- 1School of Water Resource and Hydropower, Sichuan University, Chengdu, China
- 2State Key Laboratory of Hydraulics and Mountain River Engineering, Sichuan University, Chengdu, China
- 3State Key Laboratory of Hydrology-Water Resources and Hydraulic Engineering, Nanjing Hydraulic Research Institute, Nanjing, China
- 4Research Center for Climate Change, Ministry of Water Resources, Nanjing, China
- 5Yangtze Institute for Conservation and Development, Nanjing, China
- 6School of Civil Engineering, Tianjin University, Tianjin, China
- 7State Key Laboratory of Simulation and Regulation of Water Cycle in River Basin, China Institute of Water Resources and Hydropower Research, Research Center on Flood and Drought Disaster Reduction of the Ministry of Water Resources, Beijing, China
The Yellow-Huai-Hai River Basin (YHHRB) is an important ecological barrier in China. There are obvious spatiotemporal differences and intrinsic drivers of vegetation coverage in this region. Using the Normalized Difference Vegetation Index (NDVI) and meteorological data, the spatiotemporal characteristics of vegetation change in the YHHRB from 1982 to 2015 and its related driving factors were analyzed. Combined with CAM5.1-1 degree model data, the impacts of natural and anthropogenic forcings on climate change were separated, and the relative roles of other driving factors, natural and anthropogenic forcings, in vegetation change were further distinguished by using a residual trend method. Results showed that the vegetation coverage increased during the study period, the NDVI increased with a slope of 0.014/10a, and the areas with NDVI significant increased accounted for 75.78%. NDVI was positively correlated with precipitation and temperature in the YHHRB, and the correlation between NDVI and temperature was higher than that of precipitation, indicating that vegetation growth was more sensitive to temperature. Residual analysis indicated that other driving factors, natural and anthropogenic forcings, were responsible for 48.52%, 26.36%, and 25.12% of NDVI variation, respectively. Natural forcing contributed most to vegetation change in the Huai River Basin, whereas anthropogenic forcing and other driving factors had large effects on vegetation coverage in the Hai River Basin. In addition, obvious spatial differences were observed in the relative roles of different driving forces on vegetation conditions. The areas where natural forcing contributed most were mainly distributed in the upper Yellow River Basin, while the areas where other driving factors played a significant role in vegetation restoration were mainly concentrated in Inner Mongolia, Shanxi Province, and northern Hebei Province. Climate change and active human activities both made positive impacts on vegetation restoration, and the change in land use was the main factor causing vegetation degradation. The results are meaningful for the ongoing ecological civilization construction project in the YHHRB.
1 Introduction
As a crucial component of the terrestrial ecosystem, vegetation plays a key role in regulating the climate system and terrestrial carbon balance, which is a sensitive indicator of global environmental change (Wu et al., 2020; Zhou et al., 2021). Alongside climate, vegetation can also affect the hydrological cycle of a watershed by altering certain processes, such as vegetation transpiration, canopy interception, and soil evaporation (Zhou et al., 2015; Zastrow, 2019). The normalized vegetation index (NDVI) is closely related to the leaf area index, photosynthetic capacity, and net primary productivity (Lamchin et al., 2018; Chu et al., 2019). In addition, this index compares the reflection intensity of visible light and near-infrared bands and is not easily affected by light conditions, which makes NDVI become the most commonly used indicator to characterize vegetation dynamics (Kumari et al., 2020). Under the backdrop of global warming, observed NDVI showed a significant increasing trend across all continents, except Oceania (Eastman et al., 2013; Wu et al., 2014). In this process, both climate change and human activities have influenced vegetation change and led to spatial variability (Li et al., 2015).
As an external environmental factor necessary for vegetation growth, climate factors fundamentally control the distribution of ecosystems and the range of species. Among the many factors, precipitation and temperature have the most significant impact on vegetation coverage (He et al., 2015; Sun et al., 2015), which directly determine the necessary hydrothermal conditions for vegetation growth (Chen et al., 2019). The vegetation growing season in high-latitude areas is significantly prolonged due to the effect of global warming (Wang et al., 2017; Myers-Smith et al., 2020). However, the increase in temperature also accelerates the evapotranspiration of vegetation, thereby accelerating soil water consumption and inhibiting vegetation growth. Previous studies found that vegetation was sensitive to extreme rainfall events in semi-arid and semi-humid areas (Liu et al., 2013). However, excessive precipitation will reduce solar radiation and temperature in humid regions (Nemani et al., 2003). Moreover, with the increasing population, rapid economic development, and accelerating urbanization, the impact of human activities (mainly including land use change and afforestation) on vegetation had gradually attracted scholarly attention (Wang et al., 2017; Zheng et al., 2019). The negative effects of these activities, such as urban expansion and overgrazing, can degrade vegetation coverage (Liu et al., 2015; Jin et al., 2018). However, carefully planned human activities, including vegetation construction and ecological protection projects, are beneficial to vegetation restoration (Zhao et al., 2018). Statistical results show that the global area of planted forests increased from 167.5 million ha to 277.9 million ha from 1990 to 2015 (Payn et al., 2015). China launched a large-scale reforestation program in 1999 and already had the largest green area in the world in 2014 (Peng et al., 2014). The effects of human activities and climate change on vegetation change have two sides, but efforts to isolate their impacts remain lacking. Therefore, conducting research on a regional scale to quantify the contributions of climate change and human activities on vegetation coverage is essential to improve the adaptability of ecosystems.
Residual trend analysis is a recognized and robust method for investigating and identifying different driving forces of vegetation change (Qi et al., 2019; Shi et al., 2021). Great efforts have been made to distinguish the impacts of climate change and human activities on vegetation dynamics by using this method (Sun et al., 2015; Shi et al., 2021). These studies have generally characterized the role of climate change by using the multiple regression values between climate factors and vegetation indicators. However, climate change is a process of interaction between human activities and external natural factors. Anthropogenic forcing factors mainly include the emission of greenhouse gases and aerosols, and stratospheric ozone depletion (Matthews et al., 2004), whereas natural forcing factors mainly include volcanic eruptions and solar activity, as well as interactions within the climate system (Hansen et al., 1998). The study indicated that the warming of China in the early 20th century may be related to solar activity and the internal interaction of the climate system, while the anthropogenic greenhouse gas emissions played a leading role in the late 20th century (Zhao et al., 2016). In addition, Ma et al. (2017) suggested that increased greenhouse gases and reduced aerosol emissions could increase heavy precipitation in eastern China, thereby leading to an increased risk of flooding. The effects of human activities on climate change had been extensively tested. Therefore, it is necessary to identify and differentiate the relative contributions of anthropogenic and natural factors to climate change. In the contribution of climate change to vegetation coverage obtained by previous studies, natural and anthropogenic factors had not been separated, which led to a poor understanding of the internal driving mechanism of vegetation change. The rapid development of computer technology and climate system models have introduced important tools for attribution analysis of climate change (Zhao et al., 2016). For instance, in the Coupled Model Intercomparison Project Phase 5 (CMIP5) (Taylor et al., 2012), the different single-factor external forcing historical experiments (natural and anthropogenic forcings) were designed. After comparing the experimental results with the actual scenario results, the impacts of human and natural factors on climate change were effectively isolated (Santer et al., 2013; Zhang et al., 2013). The research progress made in climate change attribution, while deepening our understanding of this scientific issue, also provides a new way to separate the impacts of natural and anthropogenic forcings on vegetation coverage in climate change.
The Yellow-Huai-Hai River Basin (YHHRB) is located in northern China. Affected by climate change and frequent human activities, the ecological environment in this area is fragile, and the vegetation coverage has been significantly disturbed. Taking the Loess Plateau as an example, the climate conditions in this region showed a warming and drying trend over the past 50 years (Wang et al., 2017), which may reduce the available water in the soil and limit vegetation growth, thereby aggravating water and soil loss (Zhao et al., 2020). In addition, after the implementation of large-scale water and soil conservation and management, ecological forest construction, and other projects, the vegetation coverage in the YHHRB has undergone significant changes in recent years. Many scholars have studied vegetation change in different parts of the YHHRB. For instance, Yan et al. (2017) explored the relationship between precipitation and vegetation in the YHHRB. Sun et al. (2020) assessed the role of climate change and human activities in vegetation change in the Hai River Basin. Shi et al. (2021) explored the driving factors of vegetation change in the Loess Plateau. However, only few studies have quantitatively evaluated vegetation change in relation to different drivers over the YHHRB, and even fewer studies have considered the impacts of the different factors in climate change on vegetation dynamics.
Therefore, analyzing the spatiotemporal variation characteristics of vegetation in the YHHRB and its driving factors is necessary, which has important reference significance for ecological environmental protection and sustainable social and economic development. The primary purposes of this study are to 1) investigate the spatiotemporal characteristics of the vegetation coverage in the YHHRB from 1982 to 2015, and analyze the relationships between climate factors and vegetation; 2) explore the characteristics of land use change and discuss the responses of vegetation change to ecological projects; and 3) quantitatively evaluate the relative roles of climate change and other driving factors in NDVI variation, and separate the relative contributions of natural and anthropogenic forcings to vegetation activity in climate change.
2 Materials and methods
2.1 Study area
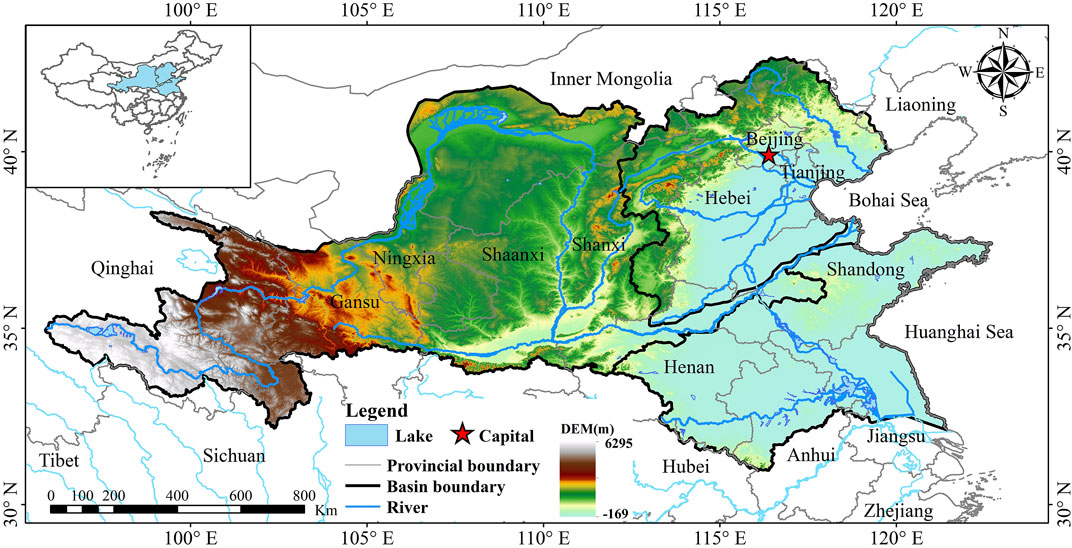
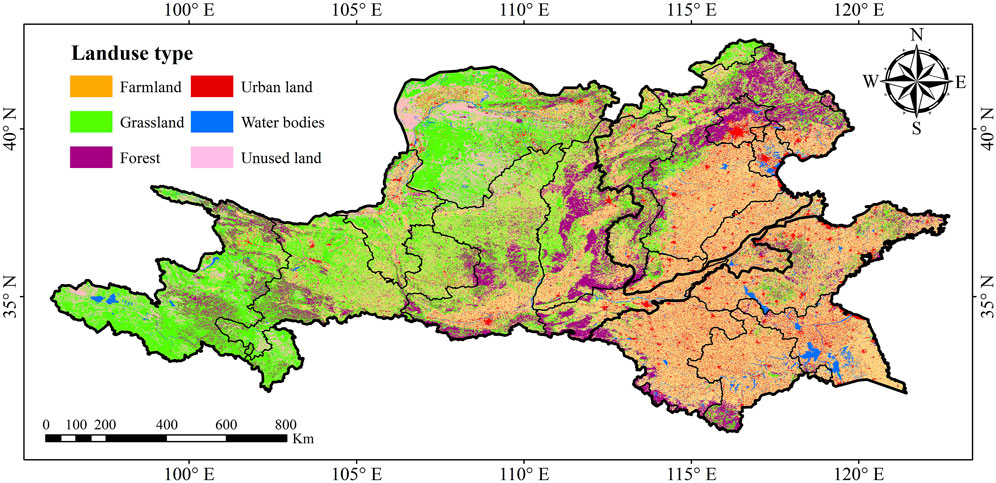
The YHHRB (95°–123°E, 30°N–43°N) is a general name for the Yellow River Basin, Huai River Basin, and Hai River Basin (Figure 1). The YHHRB covers an area of approximately 1,445,000 km2, of which the Yellow River Basin is 795,000 km2, the Huai River Basin is 330,000 km2, and the Hai River Basin is 320,000 km2. This region is the location of the political, economic, and cultural center of the country. The population, GDP (Gross Domestic Product), cultivated land area, and grain output of the YHHRB account for about 35%, 32%, 20.4%, and 23.6% of the country, respectively (Hu et al., 2021). However, the total water resources in the YHHRB are less than 8% of the national total, and the per capita water resource is only 21% of the national level (Ministry of Water Resources People’s Republic of China, 2020). Due to the wide span of the basin, there are various vegetation types (Figure 2), and multiple climate types. The precipitation is unevenly distributed in this region, with the annual precipitation being about 556 mm, the annual evaporation being about 1,699.5 mm, and the annual average temperature ranging from −4 to 16°C.
2.2 Data source
There are three main types of NDVI long-term serial data products: SPOT NDVI, MODIS NDVI, and GIMMS NDVI. Compared with the other two data products, the GIMMS data set is currently the NDVI data product with the longest time range (Zhou et al., 2020). The NDVI dataset used in the YHHRB from 1982 to 2015 was derived from the third generation Global Inventory Modeling and Mapping Studies (GIMMS NDVI3g.V1.0), produced by the Global NASA and Monitoring and Modeling Research Group. The spatial resolution is 1/12°, and the temporal resolution is 15 days. Jin et al. (2020) and Du et al. (2016) demonstrated that this dataset had good applicability in the study of vegetation change in China. A maximum value composite (MVC) method was utilized to calculate the annual maximum NDVI data.
The data of precipitation and temperature during 1982–2015 were obtained by the gridded daily observation dataset over the China region (CN05.1), published by the National Climate Center, the China Meteorological Administration (Wu and Gao, 2013), and the spatial resolution is 0.25°. Moreover, the spatial resolution is bilinearly interpolated to the same resolution as the NDVI data. The land use data for 1980 and 2015 used in this study were obtained from the Resources and Environment Data Cloud Platform of the Institute of Geographic Sciences and Natural Resources Research, Chinese Academy of Sciences (https://www.resdc.cn), with a spatial resolution is 1 km. The distribution of land use types in the YHHRB in 2015 is shown in Figure 2.
To assess the impacts of natural and anthropogenic forcings on NDVI variation in the YHHRB from 1982 to 2015, the data of precipitation and temperature under two experiment scenarios of the CAM5.1-1degree model in the C20C+ Detection and Attribution project was used in this study, with the horizontal resolution of 1.25° × 0.9375°. The CAM5.1-1degree model is the atmospheric part of the Community Earth System Model version 1.0.3 (CESM1.0.3), which has been run under two scenarios in accordance with the requirement of the C20C+ project (Xu et al., 2021). The one scenario that we have experienced (All-Hist), uses the observed boundary conditions (including sea surface temperature, carbon dioxide concentration, etc) to drive the model to obtain results under the influence of natural and anthropogenic forcings. Another scenario that we might have experienced is a climate system without human interference (Nat-Hist), which uses the boundary conditions from the CMIP5 model test simulation to drive the model to obtain results under the only influence of natural forcing. Detailed information on the CAM5.1-1degree model can be found in the literature (Stone et al., 2018) and on the official website of the C20C+D&A program data (http://portal.nersc.gov/c20c/data.html). Also, the precipitation and temperature data are bilinearly interpolated to the same resolution as the NDVI data.
2.3 Methods
2.3.1 Trend analysis
The slope of the linear regression method was utilized to characterize the interannual variation trends of NDVI, precipitation and temperature of each pixel, and the slope was obtained by least squares fitting (Chu et al., 2019). The formula is as follows:
where
The MK method was used to examine the significance of NDVI variation trend on the confidence level of 95%, and also used to analyze the abrupt change of NDVI series. The calculation method of MK method can be found in literature (Hu et al., 2021).
2.3.2 Partial correlation analysis
The partial correlation analysis method can exclude the influence of other variables when one variable is correlated with multiple variables at the same time, and only analyze the correlation between two of the variables (Stow et al., 2003). This method was used to determine the influence of precipitation and temperature on NDVI variation in this study. The formula is as follows:
where
2.3.3 Residual trend analysis
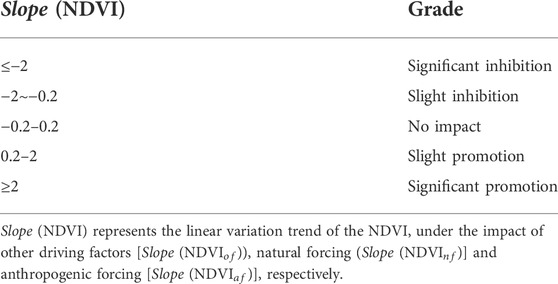
The residual trend analysis approach was used to separate the impacts of climate change and human activities on NDVI variation, which was proposed by Evans and Geerken (2004). The method consists of three main steps: 1) Based on the residual analysis model, the data of precipitation and temperature under the observed scenario and “Nat-Hist” scenario were used to predict NDVI (
where
The calculation method of the relative contributions was proposed by Xu et al. (2009). According to Table 1, the relative contributions of different factors to NDVI variation in the YHHRB from 1982 to 2015 were calculated. The linear trend of
3 Results
3.1 Spatiotemporal variation in NDVI
The annual mean NDVI showed a fluctuating and increasing trend in the YHHRB from 1982 to 2015 at a rate of 0.0014/a (Figure 3A). At the 34-year time scale, the highest NDVI was generated in 2013 (0.402), and the lowest value was 0.344 in 1982. Results of the Mann–Kendall test indicated that the annual mean NDVI exhibited a significantly increasing trend (Z >1.96). In addition, a significant abrupt change in NDVI occurred around 2003, and the increase rate from 1982 to 2002 reached 0.0012/a, after which the index demonstrated a rapid increase (0.0021/a). The annual mean NDVI of the sub-basins showed a significant increasing trend over the past 34 years, with the fastest increase rate occurring in the Huai River Basin (0.0021/a), followed by the Hai River Basin (0.0013/a), and the Yellow River Basin (0.0011/a) (Figures 3B–D). Figure 3 shows an obvious abrupt change in the annual mean NDVI of the Yellow River Basin in 2001. Multiple abrupt changes in NDVI of the Huai River Basin occurred continuously from 1989 to 1993, but they were all insignificant. In addition, there were four mutation points in the NDVI series of the Hai River Basin, including 1998,1992,1993, and 2000.
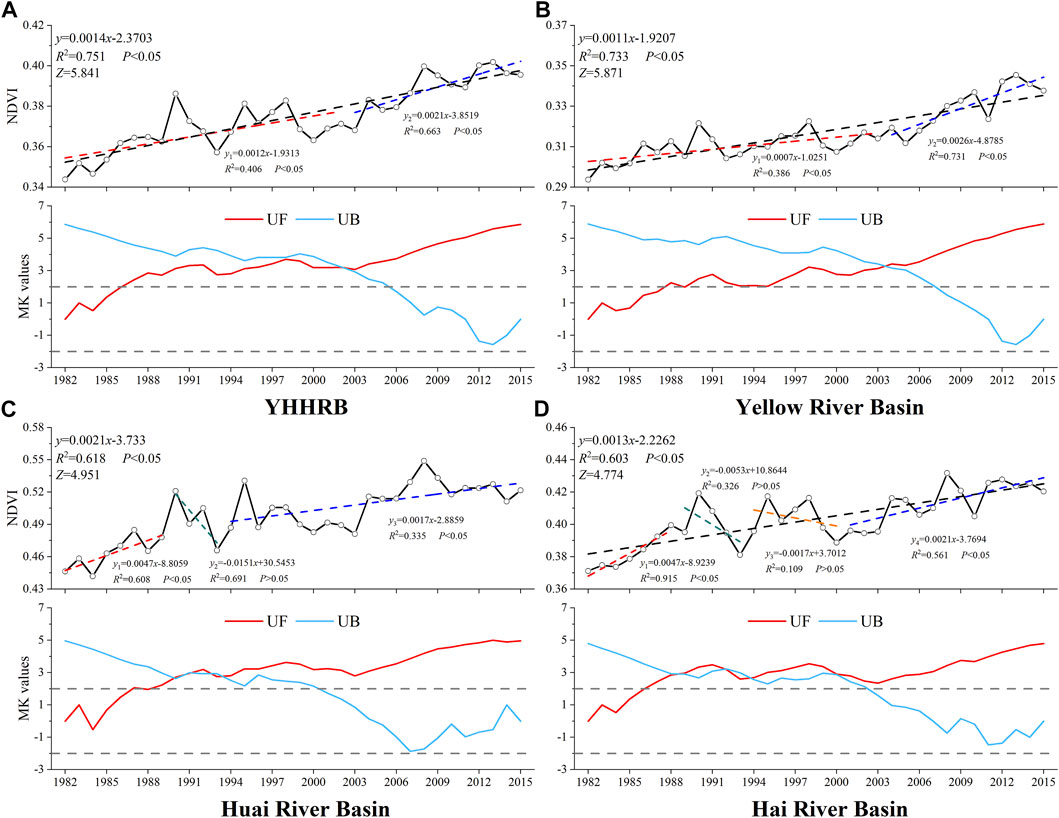
FIGURE 3. Interannual variation of the NDVI and sequential Mann–Kendall tests in the YHHRB (A), Yellow River Basin (B), Huai River Basin (C) and Hai River Basin (D) from 1982 to 2015. p < 0.05 indicates significance at the 95% confident level.
The spatial distribution of the multi-year average NDVI in the YHHRB from 1982 to 2015 is shown in Figure 4A, and the NDVI showed a decreasing trend from southeast to northwest. The regions with NDVI values of below 0.2 were located in the Loess Plateau and the northern part of Qinghai Province, and the areas with NDVI values of above 0.5 were mainly distributed in Anhui Province and Henan Province. The areas where vegetation increased and decreased accounted for 91.48% and 8.52% of the study area, respectively (Figure 4B). The NDVI in most areas of the YHHRB (75.78%) showed a significantly increasing trend, mainly concentrated in the North China Plain and the Middle and Lower Yellow River Basin (Figure 4C). Meanwhile, the significant decreases in NDVI occurred in 2.11% of the study area, which had a scattered distribution. The areas where NDVI variation was insignificant were mainly concentrated in the paramos regions of the Yellow River Basin.
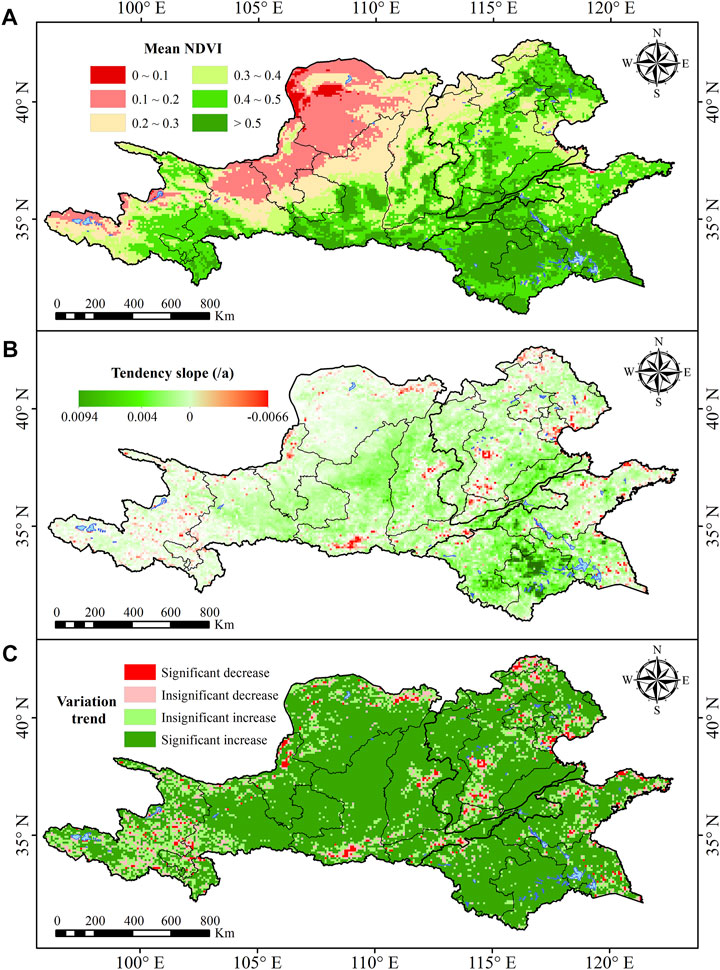
FIGURE 4. Spatial distributions of the annual mean NDVI (A), annual variation trends in NDVI (B), and significance of the various trends in NDVI (C) in the YHHRB from 1982 to 2015.
3.2 Correlations between climatic factors and vegetation change
From 1982 to 2015, the annual precipitation in the YHHRB ranged from above 1,300 mm in the southeast to less than 300 mm in the northwest. The mean value and trend of annual precipitation in this area were 565.05 and 0.89 mm/a, respectively (Figures 5A,B). The areas with increasing and decreasing trends of precipitation accounted for 67.87% and 32.13% of the study area, respectively, of which about 7% passed the significance test. The increasing trend of annual precipitation was obvious in northern Shanxi Province and part of Qinghai Province, and the decreased area of precipitation was mainly distributed in Hebei Province, Henan Province, and the Loess Plateau. The temperature in the YHHRB was affected by topography and increased along with decreasing altitude from west to east. The annual mean temperature was 8.63°C and ranged from −10 to 20°C, and the mean linear variation trend was 0.04°C/a (Figures 5C,D). The areas with the largest increase in temperature were mainly located in Qinghai Province, Gansu Province, and Ningxia Province. Overall, the climate of the YHHRB showed characteristics of warming and wetting.
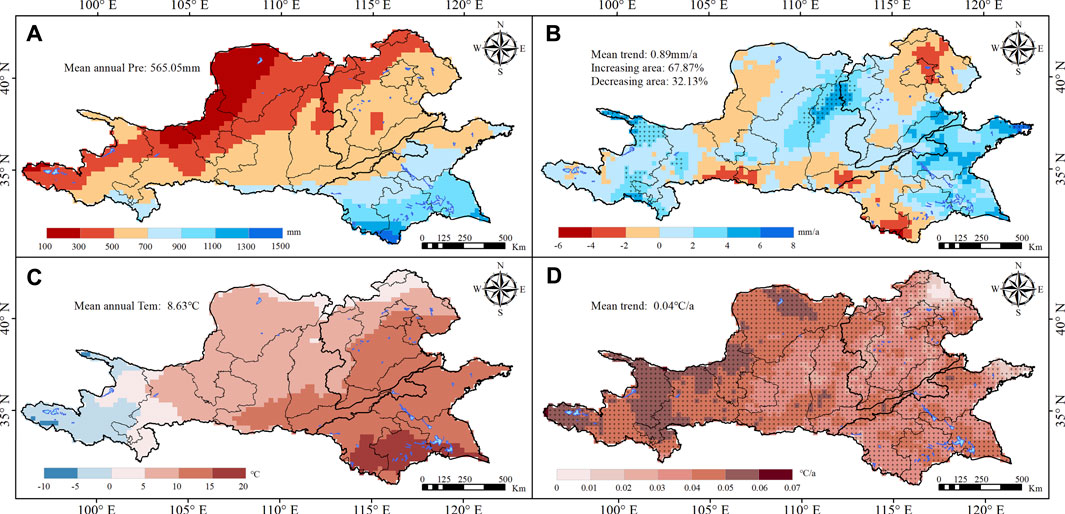
FIGURE 5. Spatial distributions of the annual mean precipitation (A), temperature (C), and their trends (B,D) in the YHHRB from 1982 to 2015. Regions labeled with “+”in (B) and (D) represent the trends are significant (p<0.05).
To spatially determine the impacts of precipitation and temperature on vegetation change, the partial correlations coefficients were mapped (Figure 6). The mean partial correlation coefficient between annual mean NDVI and annual precipitation was 0.21, 34.62%, and 2.56% of the YHHRB demonstrated positive and negative correlations at the 0.05 confidence level, respectively. The areas that exhibited a significant positive correlation between NDVI and precipitation were primarily distributed in the Middle Yellow River Basin and the local area of the Hai River Basin, and significant negative correlations were concentrated in the Upper Yellow River Basin (Figure 6B). The mean partial correlation coefficient between annual mean NDVI and temperature was 0.36, and 60.43% of the total area exhibited a positive correlation at the 0.05 confidence level, indicating that the vegetation in the YHHRB positively responded to temperature change (Figure 6D).
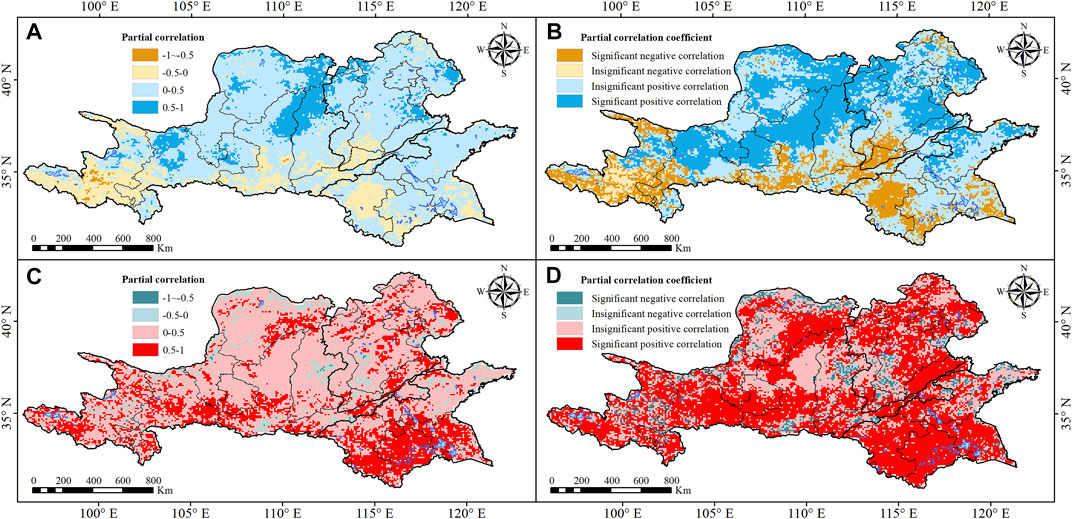
FIGURE 6. Spatial distribution of the partial correlation coefficients between NDVI and annual precipitation (A,B) and annual mean temperature (C,D) in the YHHRB from 1982 to 2015.
3.3 Influence of other driving factors on vegetation change
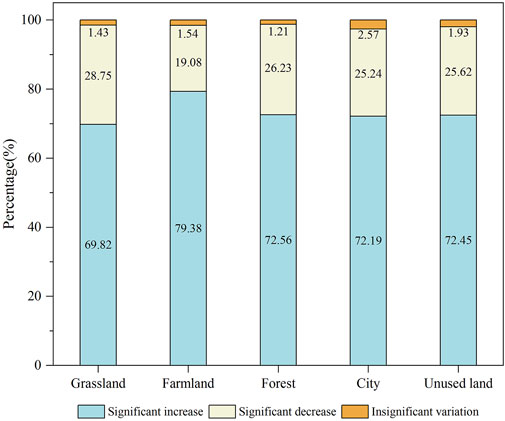
Apart from climate change, other driving factors, including ecological construction projects, urban expansion, agricultural production, and land use, are important factors with unignorable effects on vegetation distribution (Sun et al., 2020). Land use change results from the continuous utilization of land resources, and such variation directly affects the underlying surface structure and vegetation coverage (Cihlar et al., 1991). The transfer matrix of land use types in the YHHRB from 1980 to 2015 is shown in Table 3. The main characteristics of land use change were the conversion of farmland into city and grassland, and the transformation of grassland into farmland and unused land. About 19,113 km2 of farmland was converted into urban land, and 4,009 km2 of grassland was degraded to unused land. Although the farmland, forest, and grassland area in the basin changed during 1980–2015, these changed areas only accounted for less than 5% of the total area. As a result of the increasing population and accelerating urbanization, the urban area increased by about 32.48% from 1980 to 2015, and the expansion of the city scale had resulted in severe degradation of vegetation coverage. However, under the concept of “building a livable city,” the proportion of green areas in the city gradually increased, and the vegetation coverage consequently improved. Also, the vegetation coverage changed roughly demonstrated the spatial characteristics of “downtown improvement, center-periphery degradation” (Sun et al., 2020). As can be seen in Figure 7, the percentage of area with a significant increase in NDVI was above 60% for all land use types, and farmland and forest land showed the most significant improvements (79.38% and 72.56%, respectively). Meanwhile, 2.57% of the urban land showed significant degradation.
The annual afforestation area data of main ecological construction projects in the YHHRB were collected from the Statistical Yearbook of China Forestry (Figure 8). The variation trend of the NDVI was basically consistent with that of the afforestation area from 2000 to 2015, indicating that active human intervention had a significant effect on improving regional vegetation coverage. The Grain for Green Project began in 1999 and was fully implemented throughout the country in 2002. Also a large afforestation area was reported at the initial stage of the project but showed a decreasing trend after 2005. Despite the significant reduction in afforestation area between 2003 and 2004, an obvious increase in NDVI was reported during the same period due to the lagged impacts of the afforestation projects on the vegetation change. From 2000 to 2008, the project of the Beijing and Tianjing Sandstorm Source Control Project and Grain for Green Project contributed the most to regional vegetation restoration. The effects of the Three-North Shelter Forest Program gradually enhanced after 2009. The afforestation area of the YHHRB decreased between 2011 and 2013, whereas the NDVI gradually increased probably due to climate change.
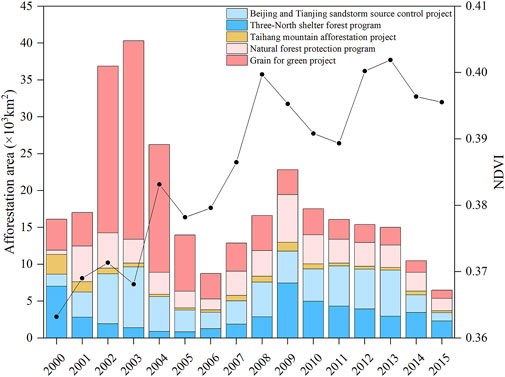
FIGURE 8. Statistical results of the NDVI and afforestation area in the YHHRB from 2000 to 2015. The bar graph represents the change in the afforestation area, and the line graph represents the NDVI variation.
3.4 Contributions of driving factors to NDVI variation
The impacts of other driving factors, natural and anthropogenic forcings on vegetation change in the YHHRB vastly differed, and the distribution of driving factors is shown in Figure 9. The results demonstrated that the areas where natural forcing promoted vegetation restoration accounted for 60.18% of the study area, and the significant restoration regions were mainly distributed in Anhui Province. Whereas the area of vegetation coverage inhibited by natural forcing accounted for 1.3% of total areas, which showed a punctiform distribution within the YHHRB. The effects of anthropogenic forcing on vegetation variation had a similar spatial distribution as natural forcing. Compared with the effects of climate factors, the areas where other driving factors inhibited vegetation restoration accounted for a larger proportion (about 7%). Vegetation restoration attributable to other driving factors was primarily observed in the eastern and central YHHRB, which accounted for 73.41% of the YHHRB. Meanwhile, the regions where natural and anthropogenic forcings had no effect on vegetation change were mainly distributed in Inner Mongolia and northern Hebei Province, whereas the regions where other driving factors exerted no effect were primarily found in Qinghai Province. Overall, climate change and other driving factors both contributed to a slight restoration of vegetation coverage in the YHHRB from 1982 to 2015. However, the above three factors showed varying influences in the same region. For example, natural forcing caused a slight restoration in the Upper Yellow River Basin, whereas other driving factors did not produce any effect.
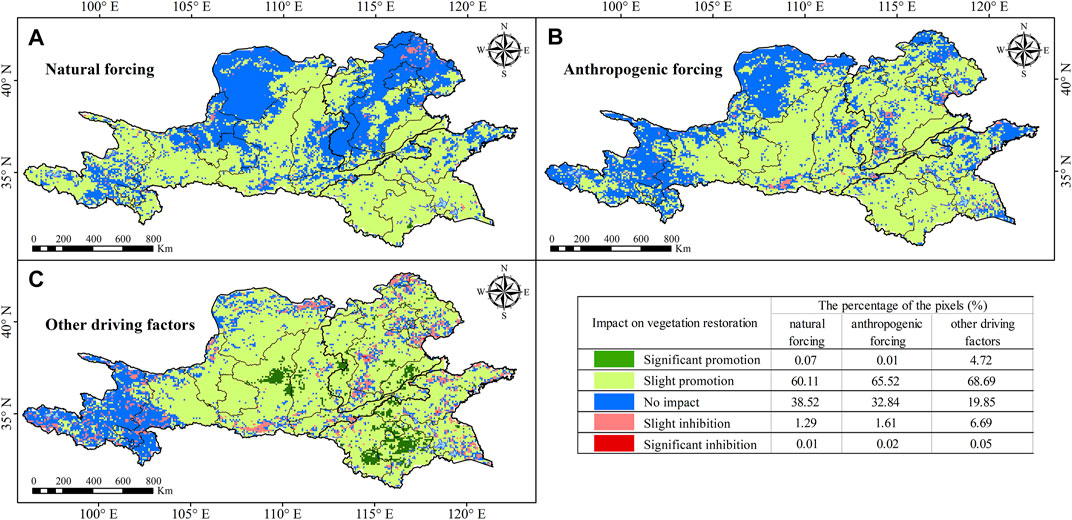
FIGURE 9. Spatial distribution of the impacts of natural forcing (A), anthropogenic forcing (B), and other driving factors (C) on vegetation restoration in the YHHRB during 1982–2015.
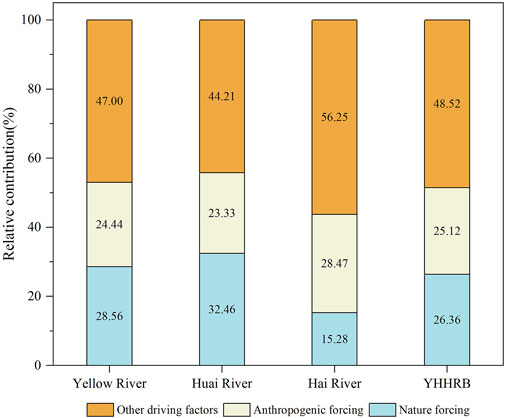
The calculation method listed in Table 2 was used to determine the relative contributions of different factors to vegetation change. As shown in Figure 10, the mean relative roles of other driving factors, natural and anthropogenic forcings in the YHHRB were 48.52%, 26.36%, and 25.12%, respectively. The direct and indirect contributions of human factors to vegetation change reached up to 73.64%. The highest contribution rate of natural forcing was observed in the Huai River Basin (32.46%), whereas the lowest contribution rate occurred in the Hai River Basin (15.28%). The other driving factors contributed most to vegetation change in the Hai River Basin (56.25%), followed by the Yellow River Basin (47%) and the Huai River Basin (44.21%).
The spatial distribution of the relative contributions of the abovementioned three driving factors is shown in Figure 11. The areas where natural forcing contributed around 0–25% to the NDVI variation accounted for the majority of the study area (58%), which were primarily distributed in the Middle Yellow River Basin and Hai River Basin. In comparison, the regions where natural forcing contributed more than 75% accounted for about 5% of the study area, which were located in the paramos regions of the Upper Yellow River Basin. Different from the distribution of natural forcing contribution, the relative role of anthropogenic forcing ranged from 0 to 50% and covered about 98% of the study area. Moreover, the areas where the relative contribution of other driving factors was between 50% and 75% showed the widest distribution and it accounted for about 42% of the YHHRB. In addition, the areas with the relative contribution of other driving factors greater than 75% were mainly distributed in Inner Mongolia, Shanxi Province, and northern Hebei Province.
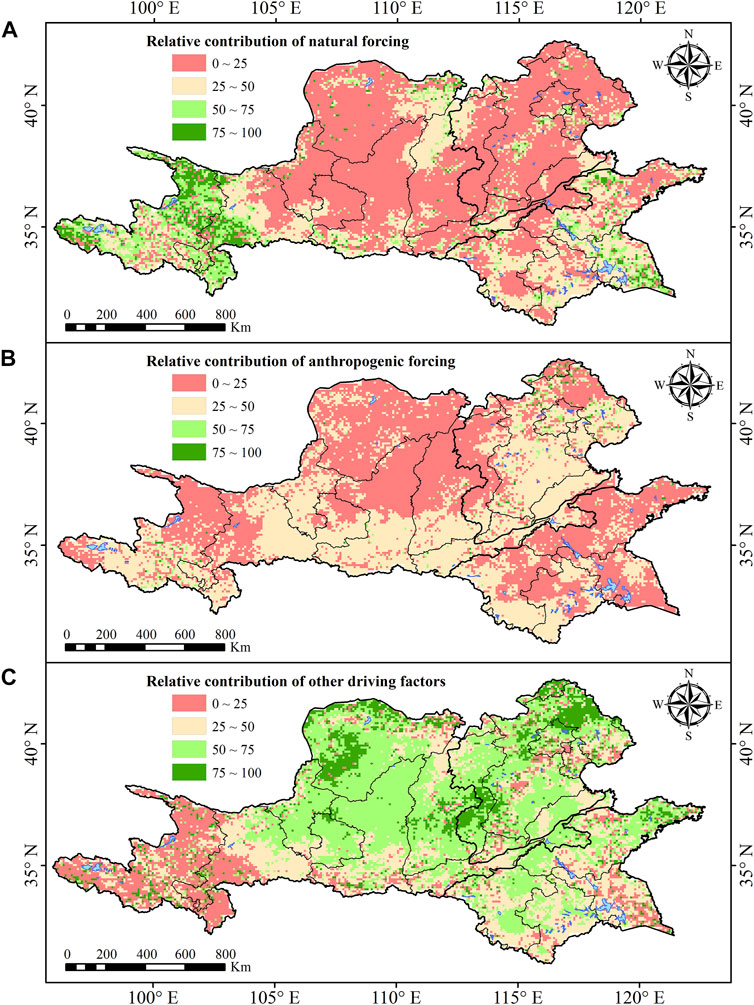
FIGURE 11. Spatial distribution of the contributions of natural forcing (A), anthropogenic forcing (B), and other driving factors (C) to vegetation coverage change in the YHHRB from 1982 to 2015.
4 Discussion
4.1 Impacts of climate change and human activities on vegetation change
The vegetation conditions in the YHHRB showed an obvious improvement trend from 1982 to 2015, and the NDVI significantly increased in 75.78% of the region, which was consistent with previous studies' results (Chen et al., 2005; Li et al., 2007; Wang, 2017). Climate change is undoubtedly a major factor influencing vegetation dynamics (Qu et al., 2020; Ge et al., 2021). The surface temperature in China, especially in its northern areas, has been rising rapidly since the 1980s, and the climate gradually moved toward warming and wetting (Zhou et al., 2015). The precipitation and temperature in the YHHRB increased during 1982–2015, which promoted the development of a warm and humid climate and favored vegetation restoration, this finding is consistent with Wang (2017). The increase in temperature not only prolongs the vegetation development cycle but also accelerates the decomposition of soil organic matter and the release of nutrients, thereby accelerating vegetation growth (Li et al., 2017). Meanwhile, increased precipitation offsets the water loss from warming and helps vegetation to survive under drought conditions (Wang et al., 2017). This study found that the sensitivity of NDVI to temperature was significantly greater than precipitation in the YHHRB. However, further increases in temperature will rapidly promote evapotranspiration, which may cause a warmer and drier climate, thereby inhibiting vegetation growth, especially for shrubs and sparse vegetation (Propastin et al., 2008; Liu et al., 2014).
The response of vegetation to climate factors varied depending on the vegetation types and climate conditions. Hu et al. (2011) suggested that water and heat conditions were key factors affecting vegetation growth, and argued that moisture was more important to vegetation than heat. This conclusion supports the findings of this study for the Middle Yellow River Basin and Hai River Basin, these areas are dominated by arid and semi-arid regions, where evaporation is large and vegetation is highly dependent on water. However, in contrast to Hu et al. (2011), this study revealed that the impact of temperature on vegetation was much greater than that of moisture in the Huai River Basin and parts of the Tibetan Plateau. The precipitation is relatively abundant in the Huai River Basin, and the soil moisture content in the region is high. Given that an increase in temperature benefits the extension of the vegetation growing season and the accumulation of dry matter mass in these regions (Fang et al., 2004), the vegetation activities in these areas are closely related to temperature. Meanwhile, the precipitation and NDVI in the Tibetan Plateau showed a negative correlation, suggesting that excessive precipitation in this region will inhibit the growth of vegetation, and this result is consistent with Gao et al. (2013). The Tibetan Plateau with its high altitude, and the melting of snow due to climate change provided enough water for vegetation growth. However, the excessive precipitation in this area will result in low temperature and radiation, thereby inhibiting photosynthesis in plants (Zhang et al., 2016; Luo et al., 2018).
Since the 1980s, the Chinese government has successively implemented a number of ecological protection and restoration projects in the YHHRB, such as the Three-North Shelter Forest Program, the Grain for Green Project, and the Natural Forest Protection Program (Sun et al., 2015; Zhou et al., 2020). Lu et al. (2015) and Zhao et al. (2018) demonstrated the positive effects of the implemented ecological construction and protection measures on vegetation change in China. Specifically, the implementation of these projects fundamentally improved the vegetation conditions in the YHHRB and reduced soil erosion in this area. Other researchers also found that the ecosystem restoration projects played a key role in increasing vegetation coverage in the Loess Plateau, Hai River Basin, and Beijing-Tianjin-Hebei Megacity Region (Li et al., 2015; Zhao et al., 2019; Sun et al., 2020; Shi et al., 2021). Figure 3 shows that the increasing trend of NDVI in the YHHRB accelerated significantly after 2003, which was directly related to the implementation of ecological projects. The same trends were also confirmed by the statistical results in Figure 8. The results of partial correlation analysis showed that NDVI and precipitation were negatively correlated in some regions of the southern Yellow River Basin. The regions are part of irrigated areas where vegetation is mainly affected by irrigation projects, and human intervention is particularly strong in years with low precipitation, thereby limiting the influence of water stress on vegetation (Shi et al., 2021; Wang et al., 2021). Active human activities through improved agricultural management (such as fertilization and irrigation) can also effectively increase vegetation coverage in local areas. However, the vegetation coverage in some regions of the Tibetan Plateau remained in a degraded state caused of mining and overgrazing (Zhang et al., 2016; Teng et al., 2020). Moreover, the rapid urbanization converted a large amount of land into construction land, resulting in a decline in vegetation coverage of the YHHRB. Overall, the impact of direct human activities on vegetation coverage has two sides.
4.2 Relative contributions of different factors to vegetation change
Many researchers have applied the residual trend method to analyze the driving forces of vegetation change in different regions of the YHHRB. For example, Shi et al. (2021) found that climate change and human activities contributed 45.78% and 54.22% to vegetation change in the Loess Plateau, respectively. Jin et al. (2020) showed that human activities played a dominant role in the typical areas covered by the Grain for Green projects, such as Shaanxi and Shanxi provinces, the contributions of these activities to the increase of NDVI exceeded 50% in most areas. In the Tibetan Plateau region, Li et al. (2011) found that the vegetation recovery was mainly attributed to climate change, and the trend of climate warming and wetting determined the direction of vegetation growth in the region. In the Beijing–Tianjin–Hebei regions, the implementation of the Three-North Shelter Forest Program and the Beijing–Tianjin Sand Source Control Program resulted in a significant vegetation restoration (Zhao et al., 2019). The advancement of urbanization was also highlighted as the main factor for vegetation degradation in some areas (Cao et al., 2021). These findings were generally consistent with the study, the improved vegetation coverage in the YHHRB was mainly caused by climate change and human activities, both of which caused more than 60% of the area to increase NDVI.
Climate system models are the main tool currently used in climate assessment researches, however, previous studies roughly attributed vegetation change to both climate change and human activities. In this paper, the drivers of vegetation change were subdivided into other driving factors, natural and anthropogenic forcings. Further research found that in the Tibetan Plateau, the relative contribution of natural forcing to vegetation change was greater than that in other regions. The vegetation of this region is particularly sensitive to global climate change and the intensity of human activity is low (Piao et al., 2006). In the Loess Plateau region, the contribution rates of natural and anthropogenic forcings were similar, ranging from 0% to 25%. Direct human activities such as afforestation were the main driving forces for the improvement of vegetation coverage in this region, however, CO2 and aerosol emissions caused by human activities were also factors that cannot be ignored in the vegetation change. The anthropogenic forcing contributed most to vegetation change in the Hai River Basin, which is an important base for industrial and agricultural production and high-tech industries in China, the land area only accounts for 3.3% of the national total, while the population accounts for 13.6% of the national total (Yang et al., 2021). An intensive human activities made the contribution of greenhouse gas and aerosol emissions to vegetation change significantly greater than natural forcing in this region.
4.3 Uncertainties and limitations
This study employed the residual trend analysis method to separate the relative roles of other driving factors and natural and anthropogenic forcings in vegetation change. Nevertheless, some uncertainties and limitations in this study should be acknowledged. First, the application of the residual trend analysis method is premised on the assumption that the relationship between climate factors and NDVI in the regression model is linear. The failure to consider the non-linear relationship between vegetation and impact factors as well as the time lag and cumulative effects of vegetation growth may bias the NDVI prediction equation (Song and Ma, 2011; Liu and Lei, 2015). Second, this study only selected precipitation and temperature to establish the NDVI prediction equation and overlooked other driving factors (such as wind, radiation, and evapotranspiration) (Liu et al., 2014; Zhang et al., 2016). There are no established criteria for choosing reasonable climate elements. Third, the impacts of specific human activities (such as grazing and urbanization) on vegetation change were not distinguished, there is a compelling need to conduct field surveys and refer to large amounts of socio-economic data to address this problem. With the continuous development of technology, some scholars have begun to use machine learning algorithms instead of the residual analysis method (Chen et al., 2020; Shi et al., 2020). However, the residual trend analysis method is always the most popular method due to its simple operation and easy access to data (Ge et al., 2021).
5 Conclusion
The spatiotemporal characteristics of vegetation change in the YHHRB from 1982 to 2015 and their responses to driving factors were analyzed and evaluated in this study. First, the spatiotemporal trends of vegetation change were analyzed using multiple trend analysis methods. Second, the vegetation change responses to climate change and human activities were analyzed via partial correlation analysis and slope trend analysis. Third, given the role of human activities and natural factors in climate change, this study further separated the contributions of natural and anthropogenic forcings and other driving factors to vegetation change. Several conclusions can be drawn:
(1) The vegetation coverage in the YHHRB had increased from 1982 to 2015, with a change rate of 0.014/10a, and the annual mean NDVI series changed abruptly in 2003. Spatially, the significantly improved vegetation areas accounted for 75.78% of the area, which was primarily distributed in the North China Plain and the Middle Yellow River Basin. Nearly 2.11% of the total area exhibited a significant decrease in vegetation coverage, which was primarily distributed in the periphery of some cities.
(2) Over the past 34 years, the precipitation and temperature showed an insignificant and significant increasing trend, respectively. Vegetation change was more sensitive to temperature than precipitation. At the spatial scale, a negative correlation between the NDVI and precipitation was observed in the paramos regions of the Yellow River Basin, and the positive correlation between the NDVI and temperature was strongest in the southern part of the Huai River Basin.
(3) A series of ecological construction projects in the YHHRB effectively improved vegetation coverage. Meanwhile, human activities, such as urbanization, construction land encroachment, and unreasonable farming methods negatively affected regional vegetation restoration.
(4) Other driving factors, natural and anthropogenic forcings, both played a positive role in vegetation restoration, with the relative contribution of 48.52%, 26.36%, and 25.12%, respectively, indicating that other driving factors was the dominant driving factor affecting vegetation change in the YHHRB. The highest contribution rate of natural forcing was observed in the Huai River Basin (32.46%), whereas other driving factors contributed most to vegetation change in the Hai River Basin (56.25%). At the spatial scale, the regions with natural forcing contributions of greater than 75% were mainly distributed in the paramos regions of the Upper Yellow River Basin. The areas where the relative contribution of other driving factors was greater than 75% were primarily distributed in Inner Mongolia, Shanxi Province, and northern Hebei Province.
Data availability statement
The original contributions presented in the study are included in the article/Supplementary Material; further inquiries can be directed to the corresponding author.
Author contributions
HW wrote the manuscript with contributions from all co-authors; JZ and ZB conceived and designed the research; GW and WW supervised the research; and YY and JW analyzed the data.
Funding
This study was funded by several research programs: 1) the National Key R&D Program of China (Grant No. 2017YFA0605002); 2) the National Natural Science Foundation of China (Grant Nos. 52121006, 41961124007, 41830863, and 51879164); and 3) “Six top talents” in Jiangsu Province (Grant No. RJFW-031). 4) GHFUND A No. 20210701.
Conflict of interest
The authors declare that the research was conducted in the absence of any commercial or financial relationships that could be construed as a potential conflict of interest.
Publisher’s note
All claims expressed in this article are solely those of the authors and do not necessarily represent those of their affiliated organizations, or those of the publisher, the editors, and the reviewers. Any product that may be evaluated in this article, or claim that may be made by its manufacturer, is not guaranteed or endorsed by the publisher.
References
Cao, W., Wu, D., Huang, L., Pan, M., and Huhe, T. L. (2021). Determinizing the contributions of human activities and climate change on greening in the Beijing-Tianjin-Hebei Region, China. Sci. Rep. 11 (1), 21201. doi:10.1038/s41598-021-00788-4
Chen, H. L., Zou, C. H., Liu, Y. J., Xu, X. D., and Wang, S. T. (2005). Variations of NDVI and the relationship with climate in Huang-huai-hai region of China from 1981-2001. Proc. SPIE - Int. Soc. Opt. Eng. 5884 (1), 588411–589112. doi:10.1117/12.616594
Chen, C., Park, T., Wang, X. H., Piao, S. L., Xu, B. D., Chaturvedi, R. K., et al. (2019). China and India lead in greening of the world through land-use management. Nat. Sustain. 2 (2), 122–129. doi:10.1038/s41893-019-0220-7
Chen, T., Tang, G. P., Yuan, Y., Guo, H., Xu, Z. W., Jiang, G., et al. (2020). Unraveling the relative impacts of climate change and human activities on grassland productivity in Central Asia over last three decades. Sci. Total Environ. 743, 140649. doi:10.1016/j.scitotenv.2020.140649
Chu, H. S., Venevsky, S., Wu, C., and Wang, M. H. (2019). NDVI-based vegetation dynamics and its response to climate changes at Amur-Heilongjiang River Basin from 1982 to 2015. Sci. Total Environ. 650, 2051–2062. doi:10.1016/j.scitotenv.2018.09.115
Cihlar, J., Stlaurent, L., and Dyer, J. A. (1991). Relation between the normalized difference vegetation index and ecological variables. Remote Sens. Environ. 35 (2-3), 279–298. doi:10.1016/0034-4257(91)90018-2
Du, J. Q., Shu, J. M., Zhao, C. X., Jiaerheng, Ahati., Wang, L. X., Xiang, B., et al. (2016). Comparison of GIMMS NDVI3g and GIMMS NDVIg for monitoring vegetation activity and its responses to climate changes in Xinjiang during 1982-2006. Acta Eco. Sin. 36 (21), 6738–6749. (In Chinese). doi:10.5846/stxb201504190805
Eastman, J. R., Sangermano, F., Machado, E. A., Rogan, J., and Anyamba, A. (2013). Global trends in seasonality of normalized difference vegetation index (NDVI), 1982-2011. Remote Sens. (Basel). 5 (10), 4799–4818. doi:10.3390/rs5104799
Evans, J., and Geerken, R. (2004). Discrimination between climate and human-induced dryland degradation. J. Arid. Environ. 57 (4), 535–554. doi:10.1016/s0140-1963(03)00121-6
Fang, J. Y., Piao, S. L., He, J. S., and Ma, W. H. (2004). Increasing terrestrial vegetation activity in China, 1982-1999. Sci. China Ser. C 47 (3), 229–240. doi:10.1360/03yc0068
Gao, Y. H., Zhou, X., Wang, Q., Wang, C. Z., Zhan, Z. M., Chen, L. F., et al. (2013). Vegetation net primary productivity and its response to climate change during 2001-2008 in the Tibetan Plateau. Sci. Total Environ. 444, 356–362. doi:10.1016/j.scitotenv.2012.12.014
Ge, W. Y., Deng, L. Q., Wang, F., and Han, J. Q. (2021). Quantifying the contributions of human activities and climate change to vegetation net primary productivity dynamics in China from 2001 to 2016. Sci. Total Environ. 773, 145648. doi:10.1016/j.scitotenv.2021.145648
Hansen, J. E., Sato, M., Lacis, A., Ruedy, R., Tegen, I., and Matthews, E. (1998). Climate forcings in the Industrial era. Proc. Natl. Acad. Sci. U. S. A. 95 (22), 12753–12758. doi:10.1073/pnas.95.22.12753
He, B., Chen, A. F., Wang, H. L., and Wang, Q. F. (2015). Dynamic response of satellite-derived vegetation growth to climate change in the three North Shelter forest region in China. Remote Sens. (Basel). 7 (8), 9998–10016. doi:10.3390/rs70809998
Hu, M. Q., Mao, F., Sun, H., and Hou, Y. Y. (2011). Study of normalized difference vegetation index variation and its correlation with climate factors in the three-river-source region. Int. J. Appl. Earth Obs. Geoinf. 13 (1), 24–33. doi:10.1016/j.jag.2010.06.003
Hu, W. T., She, D. X., Xia, J., He, B., and Hu, C. (2021). Dominant patterns of dryness/wetness variability in the Huang-Huai-Hai River Basin and its relationship with multiscale climate oscillations. Atmos. Res. 247, 105148. doi:10.1016/j.atmosres.2020.105148
Jin, K., Wang, F., and Li, P. F. (2018). Responses of vegetation cover to environmental change in large cities of China. Sustainability 10 (1), 270. doi:10.3390/su10010270
Jin, K., Wang, F., Han, J. Q., Shi, S. Y., and Ding, W. B. (2020). Contribution of climatic change and human activities to vegetation NDVI change over China during 1982-2015. Acta Ecol. Sin. 75 (5), 961–974. (In Chinese). doi:10.11821/dlxb202005006
Kumari, N., Saco, P. M., Rodriguez, J. F., Johnstone, S. A., Srivastava, A., Chun, K. P., et al. (2020). The grass is not always greener on the other side: Seasonal reversal of vegetation greenness in aspect-driven semiarid ecosystems. Geophys. Res. Lett. 47 (15). doi:10.1029/2020gl088918
Lamchin, M., Lee, W. K., Jeon, S. W., Wang, S. W., Lim, C. H., Song, C., et al. (2018). Long-term trend of and correlation between vegetation greenness and climate variables in Asia based on satellite data. Methodsx 5, 803–807. doi:10.1016/j.mex.2018.07.006
Li, Z. J., Sun, Z. B., Chen, H. L., Du, Z. X., and Zou, C. H. (2007). “Response characteristic analysis of climate change of vegetation activity in Huang-Huai-Hai area based on NOAA NDVI data set, Conference on Remote Sensing and Modelling of Ecosystems for Sustainability IV,” in Proceedings of SPIE, San Antonio, CA. 6679. doi:10.1117/12.732917
Li, H. X., Liu, G. H., and Fu, B. J. (2011). Response of vegetation to climate change and human activity based on NDVI in the Three-River Headwaters region. Acta Ecol. Sin. 31 (19), 5495–5504. (In Chinese). doi:10.3724/SP.J.1011.2011.00110
Li, S. S., Yang, S. N., Liu, X. F., Liu, Y. X., and Shi, M. M. (2015). NDVI-based analysis on the influence of climate change and human activities on vegetation restoration in the shaanxi-gansu-ningxia region, Central China. Remote Sens. (Basel). 7 (9), 11163–11182. doi:10.3390/rs70911163
Li, J., Liu, H. B., Li, C. Y., and Li, L. (2017). Changes of green-up day of vegetation growing season based on GIMMS 3g NDVI in northern China in recent 30 years. Sci. Geogr. Sin. 37 (4), 620–629. ( In Chinese). doi:10.13249/j.cnki.sgs.2017.04.016
Liu, Y. L., and Lei, H. M. (2015). Responses of natural vegetation dynamics to climate drivers in China from 1982 to 2011. Remote Sens. (Basel). 7 (8), 10243–10268. doi:10.3390/rs70810243
Liu, G., Liu, H. Y., and Yin, Y. (2013). Global patterns of NDVI-indicated vegetation extremes and their sensitivity to climate extremes. Environ. Res. Lett. 8 (2), 025009. doi:10.1088/1748-9326/8/2/025009
Liu, X. F., Zhang, J. S., Zhu, X. F., Pan, Y. Z., Liu, Y. X., Zhang, D. H., et al. (2014). Spatiotemporal changes in vegetation coverage and its driving factors in the Three-River Headwaters Region during 2000-2011. J. Geogr. Sci. 24 (2), 288–302. doi:10.1007/s11442-014-1088-0
Liu, Y. X., Wang, Y. L., Peng, J., Du, Y. Y., Liu, X. F., Li, S. S., et al. (2015). Correlations between urbanization and vegetation degradation across the world's metropolises using DMSP/OLS nighttime light data. Remote Sens. (Basel). 7 (2), 2067–2088. doi:10.3390/rs70202067
Lu, Y. H., Zhang, L. W., Feng, X. M., Zeng, Y., Fu, B. J., Yao, X. L., et al. (2015). Recent ecological transitions in China: greening, browning, and influential factors. Sci. Rep. 5, 8732. doi:10.1038/srep08732
Luo, Z. H., Wu, W. C., Yu, X. J., Song, Q. M., Yang, J., Wu, J. H., et al. (2018). Variation of net primary production and its correlation with climate change and anthropogenic activities over the Tibetan plateau. Remote Sens. (Basel). 10 (9), 1352. doi:10.3390/rs10091352
Ma, S. M., Zhou, T. J., Stone, D. A., Polson, D., Dai, A. G., Stott, P. A., et al. (2017). Detectable Anthropogenic shift toward heavy precipitation over eastern China. J. Clim. 30 (4), 1381–1396. doi:10.1175/jcli-d-16-0311.1
Matthews, H. D., Weaver, A. J., Meissner, K. J., Gillett, N. P., and Eby, M. (2004). Natural and anthropogenic climate change: incorporating historical land cover change, vegetation dynamics and the global carbon cycle. Clim. Dyn. 22 (5), 461–479. doi:10.1007/s00382-004-0392-2
Ministry of Water Resources People’s Republic of China (2020). China water resources bulletin 2019. Beijing: China Water & Power Press.
Myers-Smith, I. H., Kerby, J. T., Phoenix, G. K., Bjerke, J. W., Epstein, H. E., Assmann, J. J., et al. (2020). Complexity revealed in the greening of the Arctic. Nat. Clim. Chang. 10 (2), 106–117. doi:10.1038/s41558-019-0688-1
Nemani, R. R., Keeling, C. D., Hashimoto, H., Jolly, W. M., Piper, S. C., Tucker, C. J., et al. (2003). Climate-driven increases in global terrestrial net primary production from 1982 to 1999. Science 300 (5625), 1560–1563. doi:10.1126/science.1082750
Payn, T., Carnus, J. M., Freer-Smith, P., Kimberley, M., Kollert, W., Liu, S. R., et al. (2015). Changes in planted forests and future global implications. For. Ecol. Manage. 352, 57–67. doi:10.1016/j.foreco.2015.06.021
Peng, S. S., Piao, S. L., Zeng, Z. Z., Ciais, P., Zhou, L. M., Li, L. Z. X., et al. (2014). Afforestation in China cools local land surface temperature. Proc. Natl. Acad. Sci. U. S. A. 111 (8), 2915–2919. doi:10.1073/pnas.1315126111
Piao, S. L., Fang, J. Y., and He, J. S. (2006). Variations in vegetation net primary production in the Qinghai-Xizang Plateau, China, from 1982 to 1999. Clim. Change 74 (1-3), 253–267. doi:10.1007/s10584-005-6339-8
Propastin, P. A., Kappas, M., and Muratova, N. R. (2008). Inter-annual changes in vegetation activities and their relationship to temperature and precipitation in central asia from 1982 to 2003. J. Environ. Inf. 12 (2), 75–87. doi:10.3808/jei.200800126
Qi, X. Z., Jia, J. H., Liu, H. Y., and Lin, Z. S. (2019). Relative importance of climate change and human activities for vegetation changes on China's silk road economic belt over multiple timescales. Catena 180, 224–237. doi:10.1016/j.catena.2019.04.027
Qu, S., Wang, L. C., Lin, A. W., Yu, D. Q., Yuan, M. X., and Li, C. A. (2020). Distinguishing the impacts of climate change and anthropogenic factors on vegetation dynamics in the Yangtze River Basin, China. Ecol. Indic. 108, 105724. doi:10.1016/j.ecolind.2019.105724
Santer, B. D., Painter, J. F., Bonfils, C., Mears, C. A., Solomon, S., Wigley, T. M. L., et al. (2013). Human and natural influences on the changing thermal structure of the atmosphere. Proc. Natl. Acad. Sci. U. S. A. 110 (43), 17235–17240. doi:10.1073/pnas.1305332110
Shi, Y., Jin, N., Ma, X. L., Wu, B. Y., He, Q. S., Yue, C., et al. (2020). Attribution of climate and human activities to vegetation change in China using machine learning techniques. Agric. For. Meteorol. 294, 108146. doi:10.1016/j.agrformet.2020.108146
Shi, S. Y., Yu, J. J., Wang, F., Wang, P., Zhang, Y. C., and Jin, K. (2021). Quantitative contributions of climate change and human activities to vegetation changes over multiple time scales on the Loess Plateau. Sci. Total Environ. 755 (2), 142419. doi:10.1016/j.scitotenv.2020.142419
Song, Y., and Ma, M. G. (2011). A statistical analysis of the relationship between climatic factors and the Normalized Difference Vegetation Index in China. Int. J. Remote Sens. 32 (14), 3947–3965. doi:10.1080/01431161003801336
Stone, D. A., Risser, M. D., Angelil, O. M., Wehner, M. F., Cholia, S., Keen, N., et al. (2018). A basis set for exploration of sensitivity to prescribed ocean conditions for estimating human contributions to extreme weather in CAM5.1-1degree. Weather Clim. Extrem. 19, 10–19. doi:10.1016/j.wace.2017.12.003
Stow, D., Daeschner, S., Hope, A., Douglas, D., Petersen, A., Myneni, R., et al. (2003). Variability of the seasonally integrated normalized difference vegetation index across the north slope of Alaska in the 1990s. Int. J. Remote Sens. 24 (5), 1111–1117. doi:10.1080/0143116021000020144
Sun, Y. L., Yang, Y. L., Zhang, L., and Wang, Z. L. (2015). The relative roles of climate variations and human activities in vegetation change in North China. Phys. Chem. Earth Parts A/B/C 87-88, 67–78. doi:10.1016/j.pce.2015.09.017
Sun, Y. L., Shan, M., Pei, X. R., Zhang, X. K., and Yang, Y. L. (2020). Assessment of the impacts of climate change and human activities on vegetation cover change in the Haihe River basin, China. Phys. Chem. Earth Parts A/B/C 115, 102834. doi:10.1016/j.pce.2019.102834
Taylor, K. E., Stouffer, R. J., and Meehl, G. A. (2012). An overview of CMIP5 and the experiment design. Bull. Am. Meteorol. Soc. 93 (4), 485–498. doi:10.1175/bams-d-11-00094.1
Teng, M. J., Zeng, L. X., Hu, W. J., Wang, P. C., Yan, Z. G., He, W., et al. (2020). The impacts of climate changes and human activities on net primary productivity vary across an ecotone zone in Northwest China. Sci. Total Environ. 714, 136691. doi:10.1016/j.scitotenv.2020.136691
Wang, H., Liu, G. H., Li, Z. S., Ye, X., Fu, B. J., and Lu, Y. H. (2017a). Analysis of the driving forces in vegetation variation in the grain for green program region, China. Sustainability 9 (10), 1853. doi:10.3390/su9101853
Wang, Q. X., Wang, M. B., Fan, X. H., Zhang, F., Zhu, S. Z., and Zhao, T. L. (2017b). Trends of temperature and precipitation extremes in the Loess Plateau region of China, 1961-2010. Theor. Appl. Climatol. 129 (3-4), 949–963. doi:10.1007/s00704-016-1820-z
Wang, S. Y., Zhang, B., Yang, Q. C., Chen, G. S., Yang, B. J., Lu, L. L., et al. (2017c). Responses of net primary productivity to phenological dynamics in the Tibetan Plateau, China. Agric. For. Meteorol. 232, 235–246. doi:10.1016/j.agrformet.2016.08.020
Wang, M. Y., Fu, J. E., Wu, Z. T., Pang, Z. G., Jiang, W., and Lei, T. J. (2021). Spatial-temporal variations of vegetation cover in the huang-huai-Hai River basin. J. Shanxi Univ. (Nat. Sci. Ed.) 44 (2), 379–389. doi:10.13451/j.sxu.ns.2019149 (In Chinese)
Wang, M. Y. (2017). Spatial and temporal variations of vegetation and it’s driving mechanisms in the huang-huai-Hai River basin. Shanxi, China: China Shanxi University. (In Chinese).
Wu, J., and Gao, X. J. (2013). A gridded daily observation dataset over China region and comparison with the other datasets. Chin. J. Geophys.-Chinese Ed. 56 (4), 1102–1111. doi:10.6038/cjg20130406
Wu, D. H., Wu, H., Zhao, X., Zhou, T., Tang, B. J., Zhao, W. Q., et al. (2014). Evaluation of spatiotemporal variations of global fractional vegetation cover based on GIMMS NDVI data from 1982 to 2011. Remote Sens. (Basel). 6 (5), 4217–4239. doi:10.3390/rs6054217
Wu, D. H., Piao, S. L., Zhu, D., Wang, X. H., Ciais, P., Bastos, A., et al. (2020). Accelerated terrestrial ecosystem carbon turnover and its drivers. Glob. Change Biol. 26 (9), 5052–5062. doi:10.1111/gcb.15224
Xu, D. Y., Kang, X. W., Liu, Z. L., Zhuang, D. F., and Pan, J. J. (2009). Assessing the relative role of climate change and human activities in sandy desertification of Ordos region, China. Sci. China Ser. D-Earth. Sci. 52 (6), 855–868. doi:10.1007/s11430-009-0079-y
Xu, Y., Liu, Y. J., Han, Z. Y., Zhou, B. T., Ding, Y. H., Wu, J., et al. (2021). Influence of human activities on wintertime haze-related meteorological conditions over the jing-jin-ji region. Engineering 7 (8), 1185–1192. doi:10.1016/j.eng.2020.03.015
Yan, D. H., Xu, T., Girma, A., Yuan, Z., Weng, B. S., Qin, T. L., et al. (2017). Regional correlation between precipitation and vegetation in the huang-huai-Hai River basin, China. Water 9 (8), 557. doi:10.3390/w9080557
Yang, Y., Yang, X., Li, E. G., and Huang, W. (2021). Transitions in land use and cover and their dynamic mechanisms in the Haihe River Basin, China. Environ. Earth Sci. 80 (2), 50. doi:10.1007/s12665-020-09291-x
Zastrow, M. (2019). China’s tree-planting drive could falter in a warming world. Nature 573 (7775), 474–475. doi:10.1038/d41586-019-02789-w
Zhang, X. B., Wan, H., Zwiers, F. W., Hegerl, G. C., and Min, S. K. (2013). Attributing intensification of precipitation extremes to human influence. Geophys. Res. Lett. 40 (19), 5252–5257. doi:10.1002/grl.51010
Zhang, Y., Zhang, C. B., Wang, Z. Q., Chen, Y. Z., Gang, C. C., An, R., et al. (2016). Vegetation dynamics and its driving forces from climate change and human activities in the Three-River Source Region, China from 1982 to 2012. Sci. Total Environ. 563, 210–220. doi:10.1016/j.scitotenv.2016.03.223
Zhao, T. B., Li, C. X., and Zuo, Z. Y. (2016). Contributions of anthropogenic and external natural forcings to climate changes over China based on CMIP5 model simulations. Sci. China-Earth Sci. 59 (3), 503–517. doi:10.1007/s11430-015-5207-2
Zhao, A. Z., Zhang, A. B., Liu, X. F., and Cao, S. (2018). Spatiotemporal changes of normalized difference vegetation index (NDVI) and response to climate extremes and ecological restoration in the Loess Plateau, China. Theor. Appl. Climatol. 132 (1-2), 555–567. doi:10.1007/s00704-017-2107-8
Zhao, Y. B., Sun, R. H., and Ni, Z. Y. (2019). Identification of natural and anthropogenic drivers of vegetation change in the beijing-tianjin-hebei megacity region. Remote Sens. (Basel). 11 (10), 1224. doi:10.3390/rs11101224
Zhao, J., Huang, S. Z., Huang, Q., Wang, H., Leng, G. Y., and Fang, W. (2020). Time-lagged response of vegetation dynamics to climatic and teleconnection factors. Catena 189, 104474. doi:10.1016/j.catena.2020.104474
Zheng, K., Wei, J. Z., Pei, J. Y., Cheng, H., Zhang, X. L., Huang, F. Q., et al. (2019). Impacts of climate change and human activities on grassland vegetation variation in the Chinese Loess Plateau. Sci. Total Environ. 660, 236–244. doi:10.1016/j.scitotenv.2019.01.022
Zhou, G. Y., Wei, X. H., Chen, X. Z., Zhou, P., Liu, X. D ., Xiao, Y., et al. (2015a). Global pattern for the effect of climate and land cover on water yield. Nat. Commun. 6, 5918. doi:10.1038/ncomms6918
Zhou, Y., Zhang, L., Fensholt, R., Wang, K., Vitkovskaya, I., and Tian, F. (2015b). Climate contributions to vegetation variations in central asian drylands: Pre- and post-USSR collapse. Remote Sens. (Basel). 7 (3), 2449–2470. doi:10.3390/rs70302449
Zhou, Z. Q., Ding, Y. B., Shi, H. Y., Cai, H. J., Fu, Q., Liu, S. N., et al. (2020). Analysis and prediction of vegetation dynamic changes in China: Past, present and future. Ecol. Indic. 117, 106642. doi:10.1016/j.ecolind.2020.106642
Keywords: NDVI, natural forcing, anthropogenic forcing, other driving factors, vegetation change
Citation: Wu H, Zhang J, Bao Z, Wang G, Wang W, Yang Y, Wang J and Kan G (2022) The impacts of natural and anthropogenic factors on vegetation change in the Yellow-Huai-Hai River Basin. Front. Earth Sci. 10:959403. doi: 10.3389/feart.2022.959403
Received: 01 June 2022; Accepted: 05 August 2022;
Published: 30 August 2022.
Edited by:
Yiping Wu, Xi’an Jiaotong University, ChinaReviewed by:
Denghua Yan, China Institute of Water Resources and Hydropower Research, ChinaYanqing Lian, Institute of Earth Environment (CAS), China
Copyright © 2022 Wu, Zhang, Bao, Wang, Wang, Yang, Wang and Kan. This is an open-access article distributed under the terms of the Creative Commons Attribution License (CC BY). The use, distribution or reproduction in other forums is permitted, provided the original author(s) and the copyright owner(s) are credited and that the original publication in this journal is cited, in accordance with accepted academic practice. No use, distribution or reproduction is permitted which does not comply with these terms.
*Correspondence: Zhenxin Bao, enhiYW9AbmhyaS5jbg==
 Houfa Wu
 Jianyun Zhang3,4,5
 Zhenxin Bao
 Guoqing Wang