 Sankar Kumar Nath
 Arpita Biswas
 Anand Srivastava
 Arnab Sengupta
 Chitralekha Ghatak
 Jyothula Madan
95% of researchers rate our articles as excellent or good
Learn more about the work of our research integrity team to safeguard the quality of each article we publish.
Find out more
ORIGINAL RESEARCH article
Front. Earth Sci. , 30 August 2022
Sec. Geohazards and Georisks
Volume 10 - 2022 | https://doi.org/10.3389/feart.2022.959108
This article is part of the Research Topic Seismic Hazard Assessment of Metropolitan Cities: Scenario and Challenges View all 9 articles
The Bengal Basin located in the eastern part of the Indian subcontinent at the conjunction of the Eurasian, Indian, and Indo-Burma plates with two progressing deformation fronts viz. the Himalayas and the Indo-Burmese orogenic belts is one of the largest fluvio-deltaic to shallow marine sedimentary basin covered by alluvial plains of Holocene deposits extending from the Himalayas to the Bay of Bengal over thick younger alluvium comprising shallow layers of silt, clay, and sand that can have disastrous consequences due to site-specific ground motion amplification and liquefaction effects. The basin surrounded by Shillong and Assam plateaus in the Northeast is in the active tectonofabric of major active faults and lineaments triggering many devastating earthquakes in the past implicating the MM Intensity of VIII–XI in the near-source region causing widespread damage and destruction in the basin, thus bringing in the essence of assessing surface level seismic hazard and the risk imposed on the basin. Consideration of seismicity patterns, fault networks, and similarity in focal mechanisms yielded 49 areal seismogenic sources and additional active tectonic features in the 0–25 km, 25–70 km, and 70–180 km hypocentral depth ranges, which along with 14 ground motion prediction equations that include site-specific next generation spectral attenuation models pertaining to Northeast India, East-Central Himalaya, and Bengal Basin tectonic provinces yielded probabilistic peak ground acceleration (PGA) at engineering bedrock in the range of 0.08–0.58 g. Both the geophysical and geotechnical investigations at 6,000 sites provided effective shear wave velocity distribution in the range of 113–948 m/s on the geographical information system, thus classifying the basin into 11 site classes with “None” to “Severe” liquefaction hazard potential. A systematic non-linear/equivalent linear site response analysis and its spectral convolution with firm rock peak ground acceleration yielded surface-consistent hazard in the range of 0.09–1.17 g, thus opening up the issue of risk assessment and holistic seismic hazard microzonation of all the cities in the basin and their structural impact assessment using the SELENA-based capacity spectrum method on FEMA and BMTPC-regulated 11 model building types in the damage states of “none,” “slight,” “moderate,” “extensive,” and “complete” for all of those, however, in-depth studies carried out for Mymensingh and Dhanbad have been presented.
The Bengal Basin located at the juxtaposition of the Eurasian, Indian, and Burmese plates comprises Bangladesh and parts of the Indian states of West Bengal, Jharkhand, and Odisha. The basin is in the active tectonofabric of Main Frontal Thrust, Main Central Thrust, and Main Boundary Thrust in the north-central Himalayas and Oldam Fault and Dauki Fault demarcating the boundary of the sharply elevated Shillong Plateau in the Northeast India. In addition to these, Sainthia–Bahmani, Jangipur–Gaibandha, Debogram–Bogra, Pingla, Garhmoyna–Khandaghosh, Rajmahal, and Malda–Kishanganj faults; Tista and Purulia lineaments; and Eocene Hinge and Purulia Shear Zone are active in the region.
The Bengal Basin and its adjoining regions have been struck by the 1885 Bengal earthquake of MW 6.8, 1897 Shillong earthquake of MW 8.1, 1918 Srimangal earthquake of MW 7.6, 1930 Dhubri earthquake of MW 7.1, 1934 Bihar–Nepal earthquake of MW 8.1, 1935 Pabna earthquake of MW 6.2, 1964 Sagar Island earthquake of MW 5.4, 1997 Bandarban earthquake of MW 6.1, 2015 Gorkha–Nepal earthquake of MW 7.8, and 2016 Myanmar earthquake of MW 6.8. Near-field strong ground motion synthesis has been performed using the EXSIM finite fault stochastic method of Atkinson and Assatourians (2015), whose computational protocol is shown in Supplementary Figure S1 in the Electronic Supplement. The conversion of the synthesized peak ground acceleration (PGA) of a few significant events to the MM Intensity Scale following the formulations of Wald et al. (1999), Atkinson and Kaka (2007), and Worden et al. (2012) proposed isoseismal variations of MM Intensity of V–VIII for 1885 Bengal earthquake, MM Intensity of IV–X for 1897 Shillong earthquake, MM Intensity of IV–VIII for 2015 Gorkha–Nepal earthquake, and MM Intensity of V–X for 1934 Bihar–Nepal earthquake, as depicted in Figures 1B–E alongside the seismotectonic map in Figure 1A of the entire basin, which is found to be in good agreement with those reported in Middlemiss (1885), Oldham (1899), Dasgupta et al. (2000), Dunn et al. (1939), and Prajapati et al. (2017). The 1-D crustal velocity model (Mitra et al., 2008)–driven simulated accelerograms for these devastating earthquakes at Dhaka, Mymensingh, Kolkata, and Malda are also presented in this diagram.
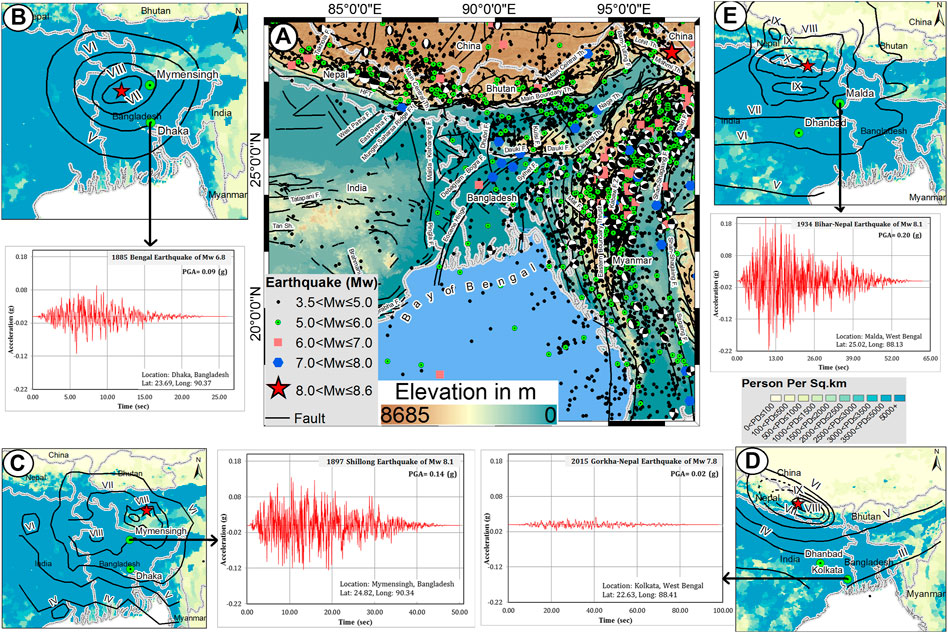
FIGURE 1. (A) Seismotectonic setting of Bengal Basin and its adjoining regions (modified after Dasgupta et al., 2000; Nath and Thingbaijam, 2012; Nath et al., 2017; Nath et al., 2021a). The isoseismal maps overlaid on the demography of the region are depicted in (B) for the 1885 Bengal earthquake of MW 6.8 along with its simulated accelerogram at Dhaka, (C) for the 1897 Shillong earthquake of MW 8.1 along with its simulated accelerogram at Mymensingh, (D) for the 2015 Gorkha–Nepal earthquake of MW 7.8 along with its simulated accelerogram at Kolkata, and (E) for the 1934 Bihar–Nepal earthquake of MW 8.1 along with its simulated accelerogram at Malda.
The Bengal Basin is a foreland basin formed by continent–continent collision of Eurasian–Indian plates in the north. It is geologically diverse comprising Archean to recent alluvial sediments. The western boundary of the basin is demarcated by the peninsular shield of India with Precambrian basement of meta-sedimentary rocks. The western districts of West Bengal and parts of Jharkhand and Odisha in Bengal Basin contain Gondwana deposits from Damodar Basin, Jharia and Raniganj coal basins, tertiary deposits of Durgapur and Baripada beds, and Mesozoic Rajmahal trap. The eastern margin of the basin featuring hills and plateaus is bounded by Naga–Halflong–Disang Thrust Zone along southeast of Chittagong and Dauki Fault Zone above north-northeastern Bangladesh, and it consists of Precambrian and early Paleozoic gneiss, granite, quartzite, and schist overlain by Eocene limestone. The lowlands of this basin covering most of West Bengal and Bangladesh comprises Quaternary alluvium deposit, while the shelf areas of Bogra slope, Rangpur saddle, Dinajpur slope, and the Foredeep are formed by Faridpur trough, Sylhet trough, and Hatia trough that can be seen across entire Bangladesh, as depicted in Figure 2A.
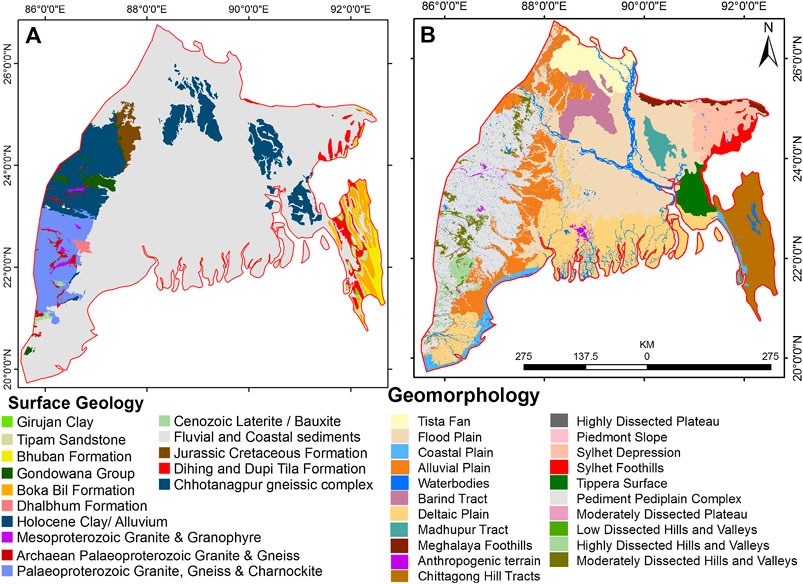
FIGURE 2. (A) Surface geology and (B) geomorphology of Bengal Basin (adopted from USGS and GSB, 2001 and https://bhukosh.gsi.gov.in/).
The Bengal Basin is mostly covered by alluvial, deltaic, coastal, and flood plains extending from the Himalayas in the north to the Bay of Bengal in the south. It is known to be the world’s largest and youngest active delta building system by Meghna, Ganges, and Brahmaputra rivers. These vast Holocene sediments are classified into four divisions by Morgan and McIntire (1959) and Umitsu (1987): the active and inactive Tista Fans in Rangpur of Bangladesh; Tippera surface near Tripura hills including Comilla of Bangladesh; Sylhet Basin in northeastern Bangladesh; and Ganges–Brahmaputra–Meghna flood and delta plains. The terraces of Barind tract, the largest Pleistocene unit in the basin in Malda, Uttar Dinajpur, Dakshin Dinajpur, Rajshahi, and Madhupur tract surrounding Dhaka consist of smooth rolling topography. Chittagong Hill Tract is the only significant hill system in the region with an altitude of approximately 1000 m. The western part of the region comprising parts of West Bengal, Jharkhand, and Odisha is the degenerated fringes of Chota Nagpur Plateau consisting of patches of Piedmont zones and high to low dissected hills and plateaus, which gradually merged with Rarh plains composed of laterites eastward. The tidal lower Ganges delta occupied by Sundarbans’ mangroves in the southern boundary is mostly filled with tidal silt and clay and sand in channels or on beaches of islands, as shown in Figure 2B. It is evident that most of the areas reside over thick younger alluvium comprising of shallow layers of silt, clay, and sand, which will not only amplify ground motion of an impending earthquake but also trigger liquefaction with disastrous consequences if a strong earthquake impinges the territory. Thus, basin tectonics and its geology and geomorphology interplay to decide the holistic geo-hazard regime, which in essence classifies the terrain into various site classes based on effective shear wave velocity (VS30) distributions viz. B (760<VS30≤1500 m/s), C1 (620<VS30≤760 m/s), C2 (520<VS30≤620 m/s), C3 (440<VS30≤520 m/s), C4 (360<VS30≤440 m/s), D1 (320<VS30≤360 m/s), D2 (280<VS30≤320 m/s), D3 (240<VS30≤280 m/s), D4 (180<VS30≤240 m/s), E (VS30≤180 m/s), and F(VS30≤180 m/s, liquefiable) following the nomenclature proposed by the National Earthquake Hazard Reduction Program (BSSC, 2003), Uniform Building Code (UBC, 1997), and Sun et al. (2018); thus, forming the basis of evaluating seismic implications in terms of surface-consistent strong ground motion through a set of spectral measurements and protocols to understand in-depth site characteristics of the terrain, the Bengal Basin in the present study in terms of spectral site amplifications, spectral site coefficients, basin predominant frequency variation, and site response spectra along with a set of secondary phenomena viz. slope/ground failure; ground subsidence; pre-, post-, and co-seismic ruptures; and liquefaction effects has been unfolded in the following sections in a sequential hierarchical fashion culminating logically into benchmarking site-specific seismic hazard microzonation and disaster potential modeling of Dhanbad, the coal capital of Jharkhand located in the basin, and Mymensingh, the commercial and educational hub of Bangladesh.
A probabilistic seismic hazard assessment (PSHA) uses various statistical methods to compute probability of crossing a predefined value of ground shaking in a specific time period termed as the earthquake return period based on homogeneous and de-clustered earthquake catalogue of the terrain, its tectonics, and geology and ground motion database, wherein all the suitable sources and feasible earthquake occurrences are appropriately considered. The formulations suggested by Cornell (1968), Esteva (1970), and McGuire (1976) provide the frequency distribution of ground motion, wherein the annual probabilities of occurrence of events greater than the specified design basis is ascertained. In the present study, PSHA for the entire Bengal Basin spanning over 2,69,463 km2 has been conceptualized considering both the polygonal and tectonic sources together using the protocol provided by Maiti et al. (2017) and Nath et al. (2021a).
Areal seismic source zonation is a popular approach in the seismogenic localization process, with the objective of capturing homogeneous seismicity and to aid in delineating sources based on the region’s tectonic trends and its seismicity. Source dynamics and seismicity patterns exhibited significant variation with depth, as reported by Christova (1992), Tsapanos (2000), and Allen et al. (2004). Thus, in this study three hypocentral depth ranges have been considered: 0–25 km, 25–70 km, and 70–180 km. A total of 49 areal seismogenic sources have been identified for Bengal Basin based on fault networks, similarity in focal mechanisms, and seismicity patterns, as modified from Nath and Thingbaijam (2012). Frankel’s (1995) technique for smoothened gridded seismicity modeling is employed for activity rate distribution mapping for a threshold magnitude of MW 3.5, 4.5, and 5.5 due to 49 polygonal seismogenic sources. The study region is gridded at a regular interval of 0.1° such that each grid point encompasses a cell of 0.1° × 0.1° representing approximately 11 km2. Figures 3A-C depict a representative smoothened seismicity analysis for the layered polygonal sources at threshold magnitude of MW 3.5 for all the three depth ranges, while all other threshold magnitudes have also been considered. For threshold magnitudes of MW 3.5, 4.5, and 5.5 for all the three hypocentral depth ranges, we have even computed seismicity activity rates for each active linear tectonic source inscribed in each of the 49 polygonal sources using the fault degradation technique of Iyengar and Ghosh (2004). Figures 3D-F present the annual activity rate versus magnitude plots for a cluster of active tectonic features inscribed in each layered polygonal seismogenic source for the three hypocentral depth ranges for the three threshold magnitude of MW 3.5 while those for MW 4.5 and 5.5 have also been calculated.
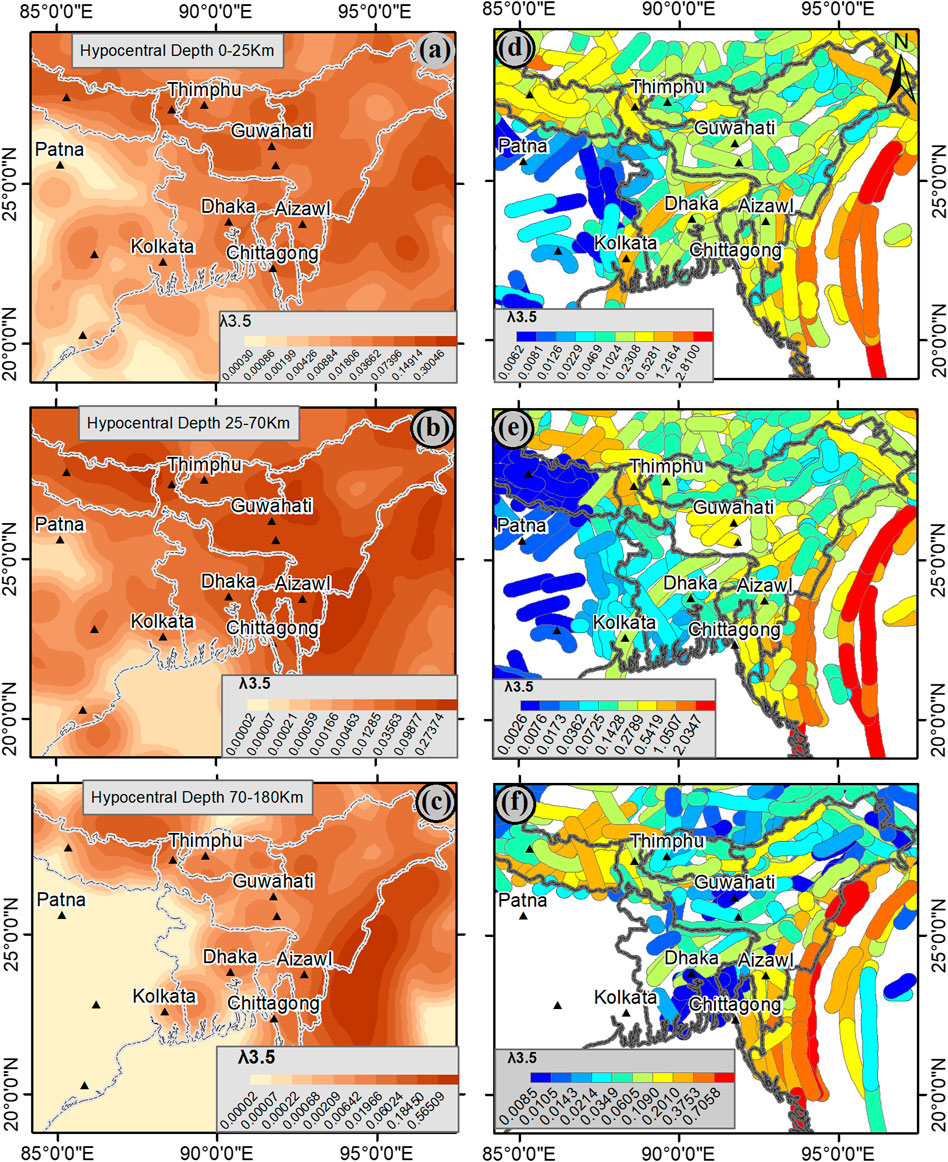
FIGURE 3. Representative smoothened seismicity model for the layered polygonal seismogenic sources for the threshold magnitude of MW 3.5 for the hypocentral depth ranges of (A) 0–25 km, (B) 25–70 km, and (C) 70–180 km and annual activity rate of each tectonic feature inscribed in the areal seismogenic sources for the threshold magnitudes MW 3.5 at the three hypocentral depth ranges of (D) 0–25 km, (E) 25–70 km, and (F) 70–180 km.
The ground motion parameters at a particular location are estimated by using a host of ground motion prediction equations (GMPEs) each of which connects a particular strong ground motion parameter of seismic shaking with one or more seismic attributes (Campbell and Bozorgnia, 2003). GMPEs are most vital not only for rapid hazard assessment but also for seismic risk estimation. The amplification caused by shallow crustal effects is regarded as an important characteristic of ground motion and is, therefore, used in ground motion synthesis. A total of 14 local-specific, regional, and global prediction equations given in Supplementary Table S1 in the Electronic Supplement have been used that includes six next generation attenuation (NGA) models developed in the course of this study (Nath, 2017) to account for seismic influence of the tectonic provinces of Northeast India, East-Central Himalayas, and Bengal Basin itself through a nonlinear regression analysis (Nath et al., 2014; Maiti et al., 2017; Nath, 2017) using the basic models suggested by Campbell and Bozorgnia (2003) and Atkinson and Boore (2006). The formulations provided by Cornell (1968), Esteva (1970), and McGuire (1976) have been employed to generate the logic tree framework, as depicted in Figure 4, which evaluates probabilistic seismic hazard (PSH) at each location by involving both the areal and tectonic seismogenic sources, seismicity parameters, and GMPEs of Supplementary Table S1 in the Electronic Supplement at threshold magnitudes of MW 3.5, 4.5, and 5.5. The weights and ranks are assigned adhering to the weight allotment method suggested by Grünthal and Wahlström (2006) for Mmax and another statistical technique, namely, the Log-likelihood (LLH) method proposed by Scherbaum et al. (2009) for GMPEs followed by a suitability test. The probability density functions used in the formulation are adopted from Maiti et al. (2017).
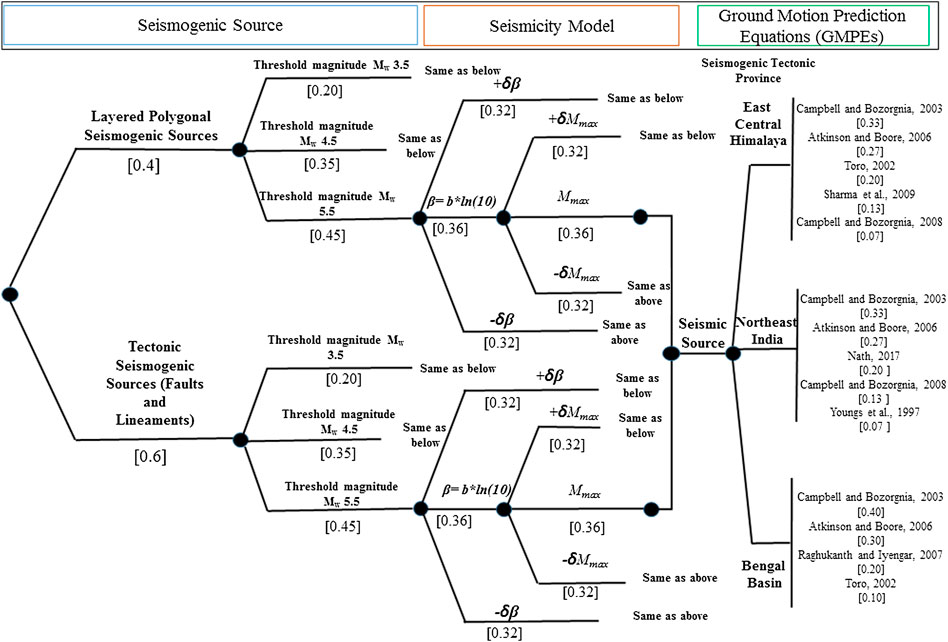
FIGURE 4. Logic tree framework for computing probabilistic seismic hazard at each node of the study region (adopted from Nath et al., 2014; Maiti et al., 2017; and Nath et al., 2021a).
The PSH distribution is estimated separately for each seismogenic source at the focal depth ranges of 0–25 km, 25–70 km, and 70–180 km and then integrated to obtain a pragmatic total value. The hazard curves represent the probability of exceeding various ground motion parameters at a specific site of interest. The seismic hazard curves for Dhanbad, Kolkata, Bhubaneswar, Malda, Mymensingh, Chittagong, Sylhet, and Dhaka corresponding to PGA and pseudo spectral acceleration (PSA) at 0.2 and 1.0 s are shown in Figure 5 for both 2% and 10% probability of exceedance in 50 years, that is, for the 2,475 and 475 years of return period scenarios at the firm rock/engineering bedrock condition adhering to the NEHRP site class B/C boundary: VS30=760 m/s.
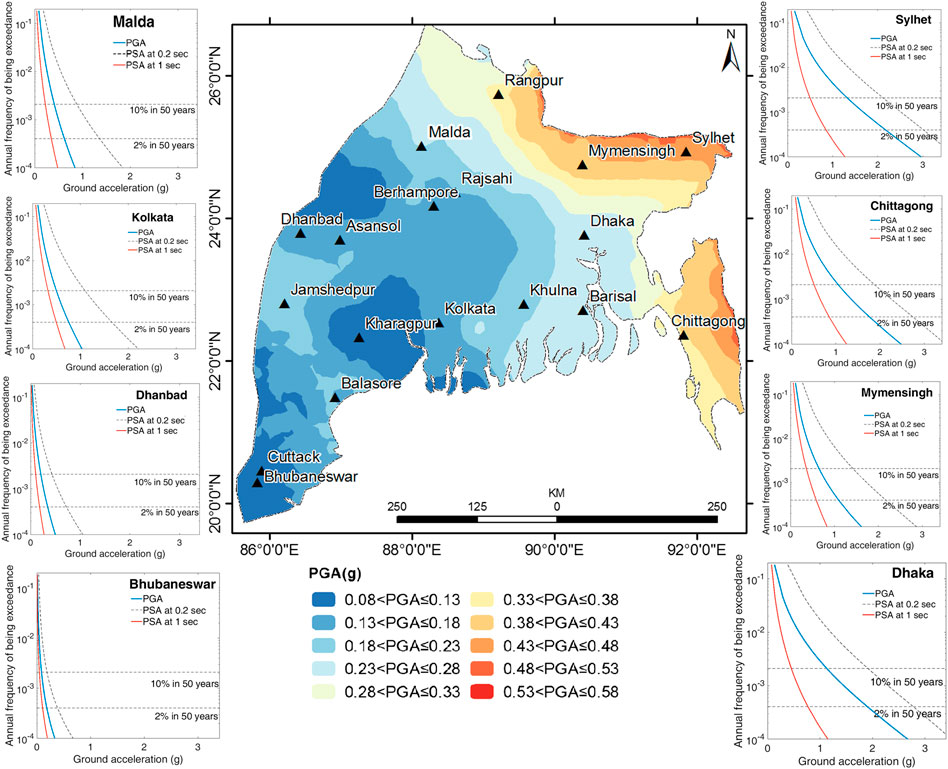
FIGURE 5. Peak ground acceleration distribution at the firm rock condition for 10% probability of exceedance in 50 years together with hazard curves for the cities of Dhanbad, Kolkata, Bhubaneswar, Malda, Mymensingh, Chittagong, Sylhet, and Dhaka corresponding to PGA (blue bold line), PSA at 0.2 s (dotted black line), and 1.0 s (red bold line) at engineering bedrock with 10% and 2% probability of exceedance in 50 years demarcated by the dotted horizontal line in the diagram presenting 475 and 2,475 years of the return period.
The seismic hazard distribution map in terms of PGA for 10% probability of exceedance in 50 years with a return period of 475 years at the bedrock level for the Bengal Basin is shown in Figure 5 depicting a PGA variation of 0.08–0.58 g. Higher hazard values in the order of 0.43–0.58 g are exhibited in Mymensingh and Sylhet, while moderate hazard values of the order of 0.23–0.43 g are seen in Barisal, Dhaka, Chittagong, and Rajshahi. Low hazard values in the order of PGA 0.08–0.23 g is observed in the southern and southwestern part of the basin encompassing the cities of Cuttack, Bhubaneswar, Jamshedpur, Balasore, Dhanbad, Asansol, Kolkata, Malda, and Behrampore.
Impact intensity and the degree of damage severity due to an impending earthquake are source, path, and site dependent. The goal of urban hazard mapping is to predict earthquake-induced ground motion effects based on various sources, paths, and site characteristics. While seismic sources are defined based on the interpretations of available seismological, geophysical, and geological data, with respect to earthquake mechanisms and source structures that are likely to be uniform within a specific geographic location, source identification, therefore, is premised on geosciences knowledge that relates to geological structures. The propagation path on the other hand is expressed in terms of geometrical spreading and shear wave frequency–dependent quality factor of the propagation medium, which along with local site effects are identified on the Fourier phase spectra of strong seismic events. Seismic ground response characteristics, commonly termed as “site effects”, are inevitably reflected in seismic code provisions. The selection of appropriate elastic response spectra according to soil/alluvium categories and seismic intensity is the simplest way to account for site effects for both engineering projects and general-purpose microzonation studies. In general, the parameters defining site effects in seismic codes are described through 1) soil/alluvium classification and 2) spectral amplification factor estimation and definition of its shape. 1-D site effect computations using the nonlinear/equivalent linear model is the prime and universal tool for all improvements and modifications in conceptualizing soil–structure interaction modeling and propagating seismic shaking from engineering bedrock through the soil/alluvium column with appropriate definitions of all its physical/lithological parameters to the surface. Site effects, therefore, play crucial role in characterizing seismic ground motions because they may strongly amplify/de-amplify seismic motions in the course of its ascent to the surface of the Earth or to the basement of manmade structures.
In the present investigation, both the surface and in situ measurements have been carried out in Bengal Basin at the locations shown in Supplementary Figure S2 in the Electronic Supplement for the estimation of shear wave velocity and, hence, to prepare its spatial distribution map for the purpose of site classification considering the top 30-m sediment fills. The standard penetration test (SPT), an in situ test under the category of penetrometer tests, is conducted in boreholes, which measures the resistance of the soil strata to the penetration encountered. The test can also be used for estimating the relative density, unconfined compressive strength, and the angle of shearing resistance of cohesive/non-cohesive soils.
Downhole seismic testing is a field test that is primarily utilized in geotechnical earthquake engineering to measure compressional wave (P) and shear wave (S) velocity profiles. These profiles are essential in order to estimate the responses due to earthquake shaking at geotechnical sites and structures. Surface measurements, namely, geophysical investigations, are preferred due to their fast data acquisition rate and cost effectiveness. In this study, the Microtremor Survey has been conducted to estimate the H/V curve of the location (Nakamura, 2000) to be inverted in 1-D velocity profile, whereas in the Multi-Channel Analysis of Surface Wave (MASW) Survey, the dispersion property of Rayleigh waves in a layered medium is utilized to derive the 2-D velocity tomogram. Several laboratory tests have also been conducted on the collected soil/sediment samples of each stratum encountered during drilling for the Atterberg limit test, bulk density, natural moisture content, and grain size analysis throughout the study region.
The standard penetration test (SPT) is conducted by using the hydraulic feed rotary borehole drilling method with bentonite circulation. A standard split spoon sampler is placed inside the borehole after drilling is done up to the targeted depth. As per IS-2131 (1963), the sampler is hammered into the soil by dropping a 63.5 kg hammer from a height of 750 mm at the rate of 30 blows/minute. The number of blows of the hammer required to drive a depth of 450 mm is noted, of which the first 150 mm is discarded and only last 300 mm is considered as the standard penetration number (N). According to IS-2131 (1981), if the number of blows for the 150 mm drive exceeds 50, it is refused and the test is terminated. In order to understand the physical and dynamic behavior of the soil, various laboratory tests have been conducted as per IS-2720 (1983) for bulk density, natural moisture content, Atterberg limit, and grain size analysis on soil/sediment samples of each stratum encountered during drilling. The measured N-values are normalized to (N1)60 by applying requisite correction factors, as illustrated in Youd et al. (2001). Figure 6 depicts the depth-wise representative geotechnical borehole dataset viz. corrected SPT-N value, shear wave velocity (m/s), unit weight (kN/m3), bulk density (kg/m3), plasticity index, and fine content in percentage at sites in IIT-ISM Dhanbad Campus and Khagdahar in Mymensingh.
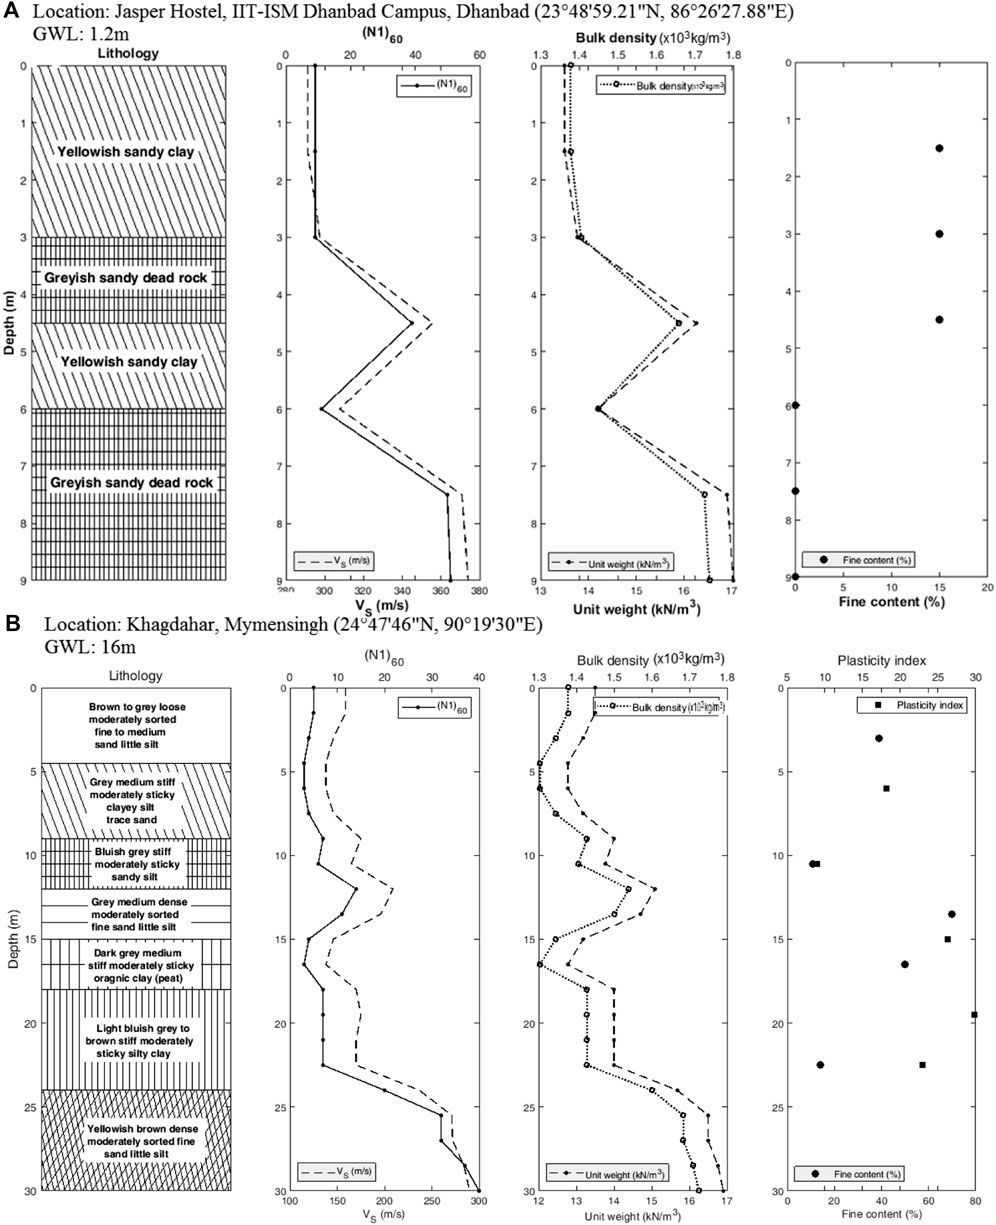
FIGURE 6. Representative depth-wise geotechnical borehole dataset viz. corrected SPT-N, shear wave velocity (m/s), unit weight (kN/m3), bulk density (kg/m3), plasticity index, and fine content in percentage for sites in (A) IIT-ISM Dhanbad Campus and (B) Khagdahar, Mymensingh.
In a downhole seismic survey, two tri-axial geophones are placed at selected depths in the borehole while the seismic source is placed near the borehole on the surface. The raw data obtained from the downhole survey are the P- and S-waves travel times from the source to the geophones as well as the distance between the source and geophones. The P-waves are generated by hitting a steel plate with a sledgehammer. The S-waves travel slower than P-waves; therefore, P-waves usually interfere with S-waves which make identification of the first S-wave arrival more difficult. The shear wave source comprises sledgehammer impacts on alternate ends of an 8″×8″×8′ wooden beam with steel end plates. The beam offset is set at 5–10 feet from the borehole to reduce direct coupling of seismic energy to the casing. The geophone assembly contains two orthogonal horizontal elements and one vertical sensing element. In total, two geophone assemblies with a fixed separation of 5 or 10 feet are used to estimate the interval velocities from the same set of impulses. This technique minimizes timing errors induced by source impulse characteristics variation and differences in seismic triggering. The data is analyzed by first computing the distance from the source to each geophone and the difference in arrival times between geophones and then estimating the interval velocity for each geophone placement. The interval velocity is then plotted as a function of depth to generate 1-D P- and S-wave velocity profiles along with Young’s modulus, shear modulus, and bulk modulus, as shown in Figure 7A, depicting a representative Downhole dataset with travel time, depth-wise P- and S-wave velocity, Young’s, shear, and bulk moduli in Sirta, Mymensingh.
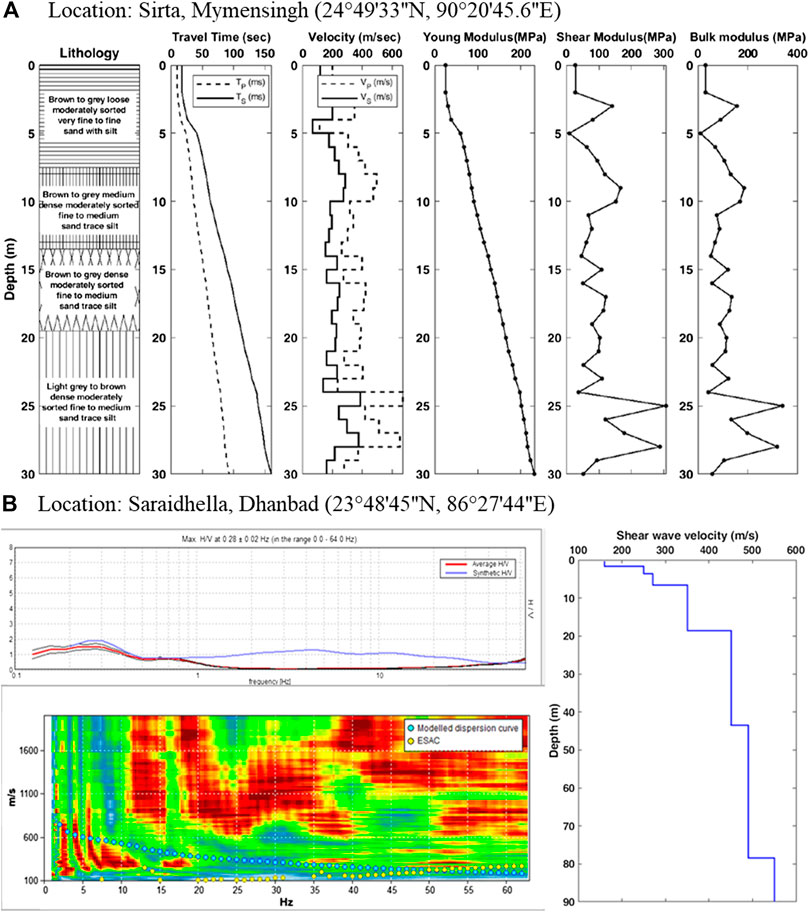
FIGURE 7. (A) Downhole dataset with travel time, depth-wise P- and S-wave velocity, Young’s, shear, and bulk moduli in Sirta, Mymensingh and (B) representative joint inversion of H/V curves derived from the ambient noise survey and the MASW-derived dispersion curve, wherein 1-D shear wave velocity section has been generated in Saraidhella, Dhanbad.
The horizontal-to-vertical spectral ratio (HVSR) (Nakamura, 2000) technique allows identifying the frequency at which ground motion is amplified due to resonance effects, related to the presence of stratigraphic discontinuities as well as the topography, by calculating the spectral ratio between the root mean square (rms) average of the horizontal components and the vertical component of the ground motion. An ambient noise signal is recorded at each site with a sampling rate of 128 Hz for 60 min and analyzed by subdividing the acquired signal for each component into a non-overlapping time window of 30 s. Each window is de-trended, padded with zeros, and tapered with a Bartlett window. The fast Fourier transform led amplitude spectrum of each component is smoothed according to a triangular smoothing function with a width equal to 10% of the central frequency and the mean HVSR curve is computed along with 95% confidence interval.
The Spectral Analysis of Surface Waves (SASW) method estimates shear wave velocity of individual near-surface soil/sediment layers using the dispersion characteristics of Rayleigh waves in a multi-layered medium (Park et al., 1999; Xia et al., 1999). Surface waves are generated with an impulsive source and are detected by geophones. The collected data are analyzed in the frequency domain to determine the dispersion curve. The dispersion curve is then utilized for the computation of a VS profile at a given site as a function of depth (e.g., Bessason and Erlingsson, 2011). Due to the dispersive properties of Rayleigh waves, wave components with different frequencies penetrate to different depths and, therefore, provide information about material properties of soil/sediment layers at diverse depths considering time series from two geophones simultaneously for a given site, wherein several measurements are taken with varying source offset and impact loads. In MASW, several geophones are employed instead of one to overcome the drawbacks in SASW technique. The HVSR approach is used to determine the fundamental frequency of soil deposits, whereas the SASW/MASW method is utilized to obtain non-invasive VS profile at a large scale. Microtremors are rich in low-frequency information and hence reach deeper horizons, whereas SASW/MASW gives broad information at higher frequencies and thus provides information about shallow layers. The non-uniqueness problem of the solution is the fundamental difficulty with surface wave methods due to its non-invasive nature. The inversion of the seismic data gives a set of velocity models that are compatible with the experimental data. To exclude profiles that are not compatible with the site, the HVSR is used in association with the dispersion curve computed from SASW/MASW survey, through a joint inversion process. Deeper profiles are obtained by combining high-frequency-rich active and low-frequency passive datasets. Furthermore, the HVSR method is used to determine the fundamental frequency of the sedimentary deposit and thus evaluate the continuity of soil/sediment layering along the study area providing rich information in the low-frequency range that allowed increasing the depth of investigation and minimizing the uncertainty of the VS profile. Therefore, in a joint fit method of estimating 1-D shear wave velocity model, the experimental HVSR curve obtained through Nakamura technique is iteratively compared with the theoretical HVSR curve generated using the near-surface shear wave velocity model from the Rayleigh wave dispersion curve until they are nearly identical. Figure 7B represents the joint fit of H/V curves derived from the ambient noise survey and the MASW-derived dispersion curve, wherein the 2-D shear wave velocity profile has been obtained through joint inversion of the H/V data model of the subsurface and the SASW/MASW dispersion curve at Saraidhella in Dhanbad.
One of the effective ways to calculate shear wave velocity (VS) is to derive correlation equations between VS and the corrected SPT-N value (Shibata, 1970). The same methodology also has been adopted for different regions of Bengal Basin viz. Kolkata (Nath, 2016), Dhaka (Rahman et al., 2018), Sylhet (Rahman et al., 2019), and Khulna (Sarkar et al., 2015). Nath et al. (2021a) proposed depth-dependent lithology-based formulations for VS as a function of corrected SPT-N for Bengal Basin, which has been extensively used in the present study. Thus, effective shear wave velocity (VS30) has been determined based on depth-wise VS derived from approximately 6,000 data points collected throughout the region. The Chittagong Hill tract and patches of Sylhet and Rangpur are deprived of sufficient geotechnical and/or geophysical data. Nath et al. (2021a) suggested empirical relations for the rugged topography of the Northeast Indian region where shear wave velocity has been estimated from surface geology, geomorphology, slope, and landform. Henceforth, these factors have been combined by establishing an empirical relation through a nonlinear regression analysis for characterizing only the hilly tracts in the basin, as given in Eq. 1 below.
where the regressed coefficients are assigned weights as A = 21.228, B = 0.302, C = −7.925, D = 76.251, E = −317.222, F = 537.205, G = 507.446, and H = −40.812 and other factors are abbreviated as LF = Landform, GGM = Geology & Geomorphology, and SLP = Slope. Surface geology and geomorphology have been adopted from USGS and GSB (2001). Shuttle Radar Topography Mission (SRTM) Digital Elevation Model (DEM) data extracted from https://earthexplorer.usgs.gov/have been used to calculate slope and landform data, which has been computed using the topographic position index (TPI) method (Weiss, 2001). Effective shear wave velocity calculated through geophysical and geotechnical databases and geoscience attribute–based regression analysis has been spatially distributed in the geographical information system (GIS) that depicts variation of VS30 in the range of 113 m/s to 948 m/s, as shown in Supplementary Figure S3 in the Electronic Supplement.
The site response analysis aids in conceptualizing the nonlinear soil–structure interaction and is considered an integral component of the seismic hazard study in any built-up environment for requisite safety implications. The assessment of the absolute and spectral site amplification factor in an earthquake-prone region covered with thick alluvium deposits is crucial to understanding the alteration of surface ground motion traveling through the soil/sediment column from engineering bedrock. In the absence of a strong ground motion database due to paucity of recordings of strong seismic events, a site response analysis is performed using the DEEPSOIL software package of Hashash et al. (2020). DEEPSOIL is a platform for site response assessment through 1-D equivalent linear and nonlinear analysis based on the pioneering work of Idriss and Seed (1968) and Seed and Idriss (1970) as employed in the widely used program SHAKE91 (Idriss and Sun, 1992). Strength-controlled nonlinear model, frequency-independent damping formulation, graphical user interface, and parallel-processing ability are some of the notable features of this application module. The DEEPSOIL module necessitates understanding of the theory and methodologies of the site response analysis and geotechnical earthquake engineering. The DEEPSOIL interface consists of several steps as pictorially illustrated in Supplementary Figure S4 of the Electronic Supplement. Various geotechnical parameters go as input. In this approach, the nonlinear stress strain loop is approximated by a single equivalent linear secant shear modulus, which is a function of the shear strain. The nonlinear analysis provides a higher capability to accurately model the soil behavior and is also more realistic. The equivalent linear modeling approach for analyzing the site response is an iterative process in which initial estimates of shear modulus and damping are provided for each soil layer. Linear dynamic analyses are conducted using these linear, time-invariant properties and the soil response thus is evaluated. Thereafter, the results are used to obtain shear strain histories, and peak shear strains are calculated for each soil layer. The effective shear strains as a fraction of the peak strains are then utilized to determine an appropriate equivalent shear modulus (G) and equivalent viscous damping ratio (β). The iteration is continued until the strain-compatible properties are consistent with the properties used to perform the dynamic response analyses. The modulus reduction curves (G/Gmax-γ) and damping ratio (D-γ) curves have been selected based on different soil/sediment types. The final step in ground response generation is to obtain an acceleration time history that is compatible with the peak dynamic loading expected at the intended site. The fundamental concept of the 1-D site response analysis is the vertical propagation of shear waves through soil layers lying on an elastic layer of the rock, which stretches up to infinite depth. With suitable acceleration time histories of a seismic event at the firm rock condition DEEPSOIL/SHAKE lifts the input bedrock acceleration–time series to the surface providing acceleration–time series, response spectra, Fourier spectra, absolute and spectral site amplification factor, and the PGA profile. Figure 8A presents the schematic diagram of wave propagation through engineering bedrock and soil/sediment surface illustrating two processes of wave propagation from seismic bedrock (VS>3000 m/s) to engineering bedrock (VS30=760 m/s; site class B/C boundary following NEHRP) and wave propagation from engineering bedrock to the soil/sediment surface with representative ground motions at both engineering bedrock and surface.
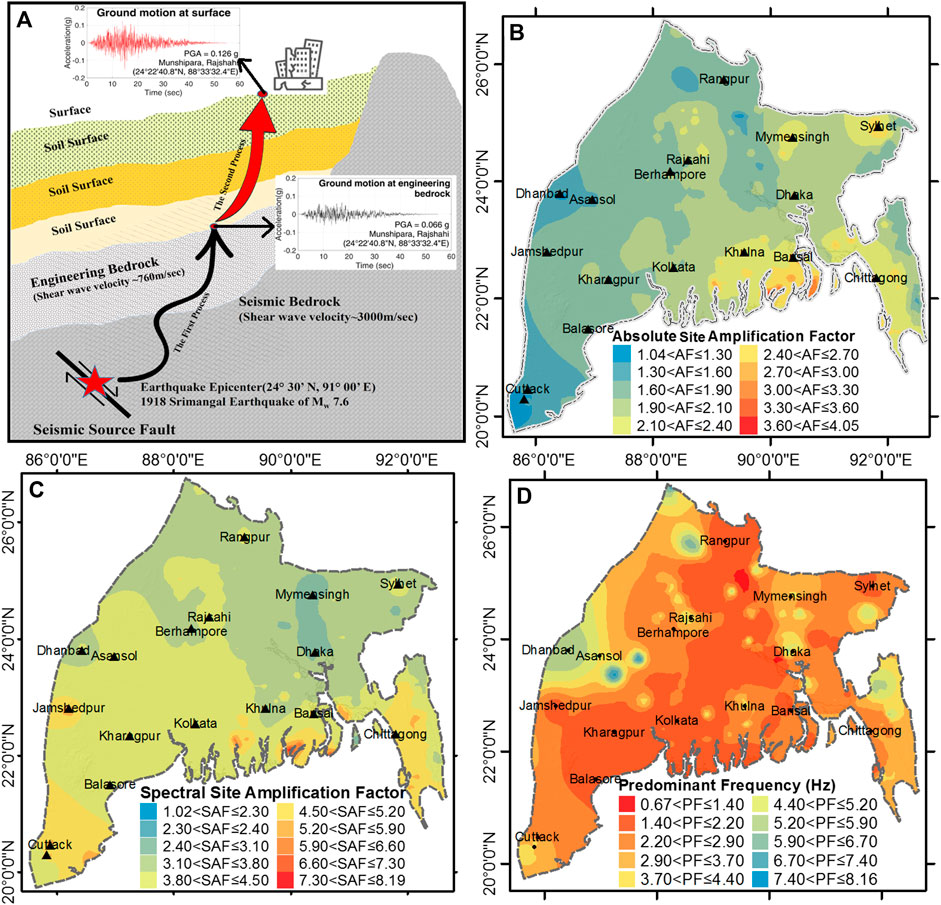
FIGURE 8. (A) Schematic illustration of wave propagation through seismic bedrock to engineering bedrock and through the soil/sediment profile to the surface with a variation in PGA. Spatial distributions on the GIS platform are depicted for (B) absolute site amplification factor, (C) spectral site amplification factor, and (D) predominant frequency in Bengal Basin.
Amplification or de-amplification of the soil/sediment column with respect to the bedrock motion is used as an input to compute the ground motion at the surface level in Bengal Basin. Stochastically synthesized ground motions for those earthquakes which impacted Bengal Basin severely in the past viz. the 1885 Bengal earthquake of MW 6.8, 1897 Shillong earthquake of MW 8.1, 1918 Srimangal earthquake of MW 7.6, 1930 Dhubri earthquake of MW 7.1, 1934 Bihar–Nepal earthquake of MW 8.1, 1935 Pabna earthquake of MW 6.2, 1964 Sagar Island earthquake MW 5.4, 1997 Bandarban earthquake of MW 6.1, 2003 Kolabunia earthquake of MW 5.6, 2015 Gorkha–Nepal Earthquake of MW 7.8, and 2016 Myanmar earthquake of MW 6.8 have been considered in the present study with 5% damping applied to all sediment types in the DEEPSOIL-led 1-D nonlinear/equivalent linear site response analysis. The source parameters for ground motion synthesis using the EXSIM software package have been adopted from GCMT catalogue and from other published literatures. Figures 8B-D exhibit spatial variations of the absolute site amplification factor in Bengal Basin on the GIS platform seen to range between 1.04 and 4.05, spectral site amplification factor in the basin within a range of 1.02–8.19, and predominant frequency distribution in the basin seen to range from 0.67 to 8.16 Hz, while spectral amplification factor distribution maps at the predominant periods of 0.2, 0.3, and 1.0 s have been presented in Supplementary Figure S5 in the Electronic Supplement.
The surface-consistent probabilistic seismic hazard for 10% probability of exceedance in 50 years with the return period of 475 years has been assessed here by convolving PGA and PSA at 0.2, 0.3, and 1.0 s predominant periods at the firm rock condition with the corresponding absolute site amplification factor distribution of Figure 8B and the spectral site amplification distributions of Supplementary Figures S5A–C in the Electronic Supplement, respectively, at each node of the 0.1o × 0.1o pixel distribution in Bengal Basin. The surface-consistent PGA for 10% probability of exceedance in 50 years, as shown in Figure 9A, is seen to vary from 0.09 to 1.18 g with the cities of Sylhet and Chittagong being located in the “Very High” hazard regime with PGA 0.9–1.18 g, while Rangpur, Mymensingh, and Comilla are located in the “High” hazard regime with PGA 0.6–0.9 g. Dhaka, Rajshahi, Khulna, Berhampore, and Dhanbad are placed in the “Moderate” hazard regime with PGA 0.3–0.6 g, while the cities of Kolkata, Asansol, and Bhubaneswar are located in the “Low” hazard regime with PGA 0.09–0.3 g. Similarly, PSA at 0.2, 0.3, and 1.0 s periods at the surface level have been depicted in Figures 9B–D, which will subsequently be used for modeling of design response spectrum and damage potential in important cities and urban centers in Bengal Basin.
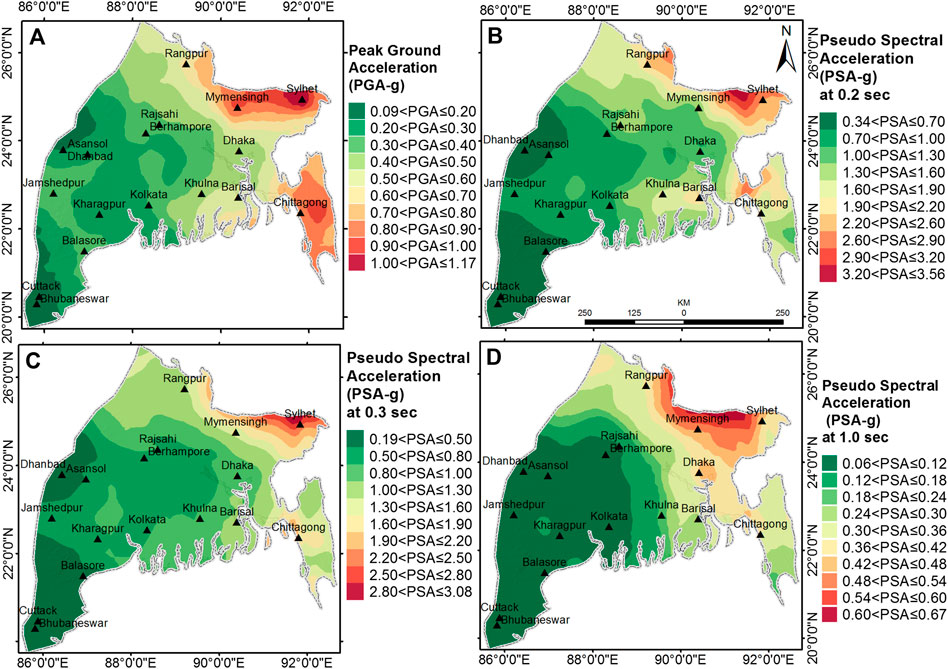
FIGURE 9. Spatial distributions of surface-consistent (A) peak ground acceleration and pseudo spectral acceleration at (B) 0.2s, (C) 0.3 s, and (D) 1.0 s, respectively, for 10% probability of exceedance in 50 years in Bengal Basin.
Soil/sediment liquefaction is triggered in a region with loose, unconsolidated soil/sediment with a shallow groundwater level due to high intensity seismic shaking induced by big earthquakes. Any sudden seismic loading destabilizes the soil by increasing the pore water pressure and the spaces between the grains. This phenomenon causes the soil to lose its cohesive strength and flow like liquid (Hazen, 1918). Bengal Basin is extremely vulnerable to liquefaction as evidenced in the cities of Dhaka (Rahman et al., 2015; Nath et al., 2021a), Chittagong (Rahman et al., 2020), Kolkata (Nath et al., 2018; Nath et al., 2022), and partially in the state of West Bengal (Nath et al., 2022). A systematic soil liquefaction analysis has been performed for Bengal Basin using geotechnical data acquired for the purpose of simulating liquefaction susceptibility potential due to significant historical earthquakes and to predict probabilistic scenario of the basin.
The cyclic stress ratio (CSR) and cyclic resistance ratio (CRR) are evaluated using soil parameters such as soil type, SPT-N value, unit weight, fine content, plasticity index, and groundwater level with the formulations of Seed and Idriss (1971) and Seed et al. (1985). Spatial distributions of the groundwater level in Bengal Basin for both pre- and post-monsoon periods are given in Supplementary Figure S6 in the Electronic Supplement. As an indicative of resistance against liquefaction of the soil/sediment column, Factor of Safety (FOS) is estimated as the ratio of CRR to CSR (Youd et al., 2001). In this simplified method of Seed and Idriss (1971), Youd et al. (2001), and Idriss and Boulanger (2006, 2010), a soil layer is termed safe when FOS is greater than 1, else is unsafe. Iwasaki et al. (1978, 1982) proposed the liquefaction potential index (LPI) as the weighted integral of layer thickness of each layer encompassing the first 20 m of the topsoil. The liquefaction risk index (IR) has been defined by Lee et al. (2004) as a parameter being nonlinearly related to FOS, and the ground failure potential of top 20 m soil is “low” if IR ≤ 20, “high” if 20< IR ≤ 30, and “extremely high” if IR > 30. LPI and IR are thus derived from FOS, amalgamation of which results in the liquefaction susceptibility assessment of a region. A framework for the liquefaction susceptibility assessment is presented in Supplementary Figure S7 of the Electronic Supplement.
The surface-consistent PGA values assessed for the seven large historical earthquakes have been used to simulate liquefaction scenarios triggered by the 1885 Bengal earthquake, 1897 Shillong earthquake, 1918 Srimangal earthquake, 1930 Dhubri earthquake, 1935 Pabna earthquake, 1934 Bihar–Nepal earthquake, and 2015 Gorkha–Nepal earthquake and also to predict a probabilistic scenario due to the surface-consistent probabilistic PGA for a return period of 475 years in terms of FOS, LPI, and IR. Spatial distribution of LPI for the scenario earthquakes of 1897 Shillong, 1885 Bengal, and 1934 Bihar–Nepal earthquake and probabilistic scenario in compliant with surface-consistent probabilistic PGA have been presented in Figures 10A–C. Figure 10D depicts LPI, IR, and corresponding PGA values of a few representative sites in the cities of Dhaka, Mymensingh, Rajshahi, Khulna, Kolkata, Asansol, Malda, and Dhanbad. The predicted probabilistic LPI distribution for 475 years of return period has divided the region into four zones such as “low (LPI = 0)” in the cities of Asansol, Bhubaneswar, and Cuttack; “moderate (0<LPI≤5)” in Dhanbad; “high (5<LPI≤15)” in the cities of Kolkata, Balasore, Berhampore, Malda, and Rajshahi; and “severe (LPI>15)” in the cities of Dhaka, Chittagong, Mymensingh, Sylhet, Rangpur, Khulna, and Barisal.
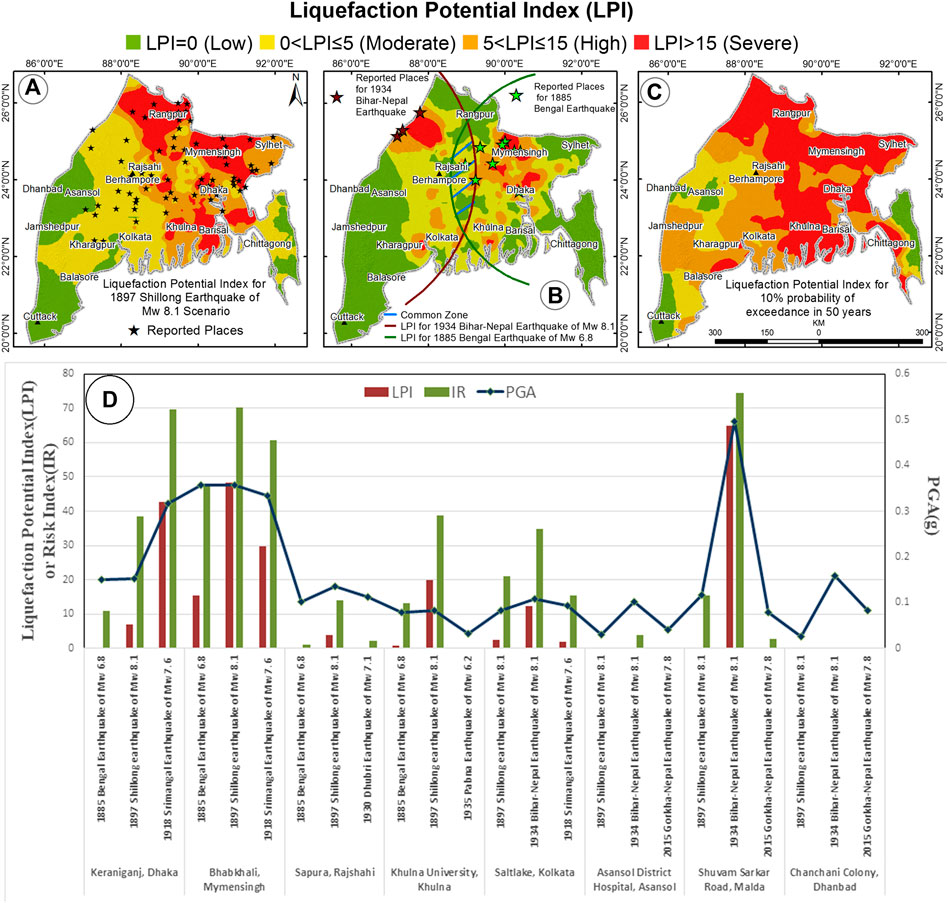
FIGURE 10. Spatial distribution of the liquefaction potential index for the scenario earthquakes of (A) 1897 Shillong earthquake for the entire basin, (B) 1885 Bengal earthquake for the eastern side of the basin, 1934 Bihar–Nepal earthquake for the western side of the basin, (C) probabilistic scenario for the region along with (D) liquefaction potential index, liquefaction risk index, and corresponding PGA values of the few representative sites of the cities of Dhaka, Mymensingh, Rajshahi, Khulna, Kolkata, Asansol, Malda, and Dhanbad.
Effective shear wave velocity delineates the soil/sediment firmness of the subsurface providing a notion about the level of site amplification that will be imparted to the bedrock motion at that particular site. In total, five site classes have been proposed by NEHRP and UBC (1997) based on VS30 variation, namely, site class A (VS30> 1500 m/s) and site class B (1,500≥ VS30>760 m/s) representing hard rock and rock sites, while site class C (760 ≥ VS30 > 360 m/s) correlates to soft rock, hard, or very stiff soils or gravels, whereas site class D (360 ≥ VS30 > 180 m/s) indicates stiff soils. Sun et al. (2018) introduced subclasses in site classes C and D, further dividing site class C and D into four subcategories: C1 (VS30: 620–760 m/s), C2 (VS30: 520–620 m/s), C3 (VS30: 440–520 m/s), C4 (VS30: 360–440 m/s), D1 (VS30: 320–360 m/s), D2 (VS30: 280–320 m/s), D3 (VS30: 240–280 m/s), and D4 (VS30: 180–240 m/s), respectively. In both the classifications site class E is defined by soft clay with VS30 ≤ 180 m/s. Site class F in the NEHRP nomenclature is categorized as special soil, which follows the condition where the soil has the potential to fail or collapse under earthquake loading, in most of the cases, this site class tends to liquefy. These considerations have been applied accordingly to convert site class E to site class F wherever applicable. The study region, therefore, has been classified on adoption of the combined regulations of NEHRP, UBC (1997), and Sun et al. (2018) into 11 classes viz. F, E, D4, D3, D2, D1, C4, C3, C2, C1, and B and is depicted in Figure 11. Site classes C4, C3, C2, C1, and B cover the hilly regions of Chittagong and Sylhet, while the lower portion of the basin exhibits site class E due to the presence of soft clay in the topsoil. Site class D4 dominates the terrain followed by D3, D2, and D1. Site classes E/F, D4, D3, D2, and D1 encompass the maximum occurring values of spectral amplification to the tune of 5.4, 3.9, 3.6, 3.4, and 3.0 at the corresponding predominant frequency of 2.2, 2.4, 3.1, 3.8, and 4.1 Hz along pointing to an absolute site amplification factor of 2.4, 2.1, 1.8, 1.4, and 1.1 in respective site classes in the basin
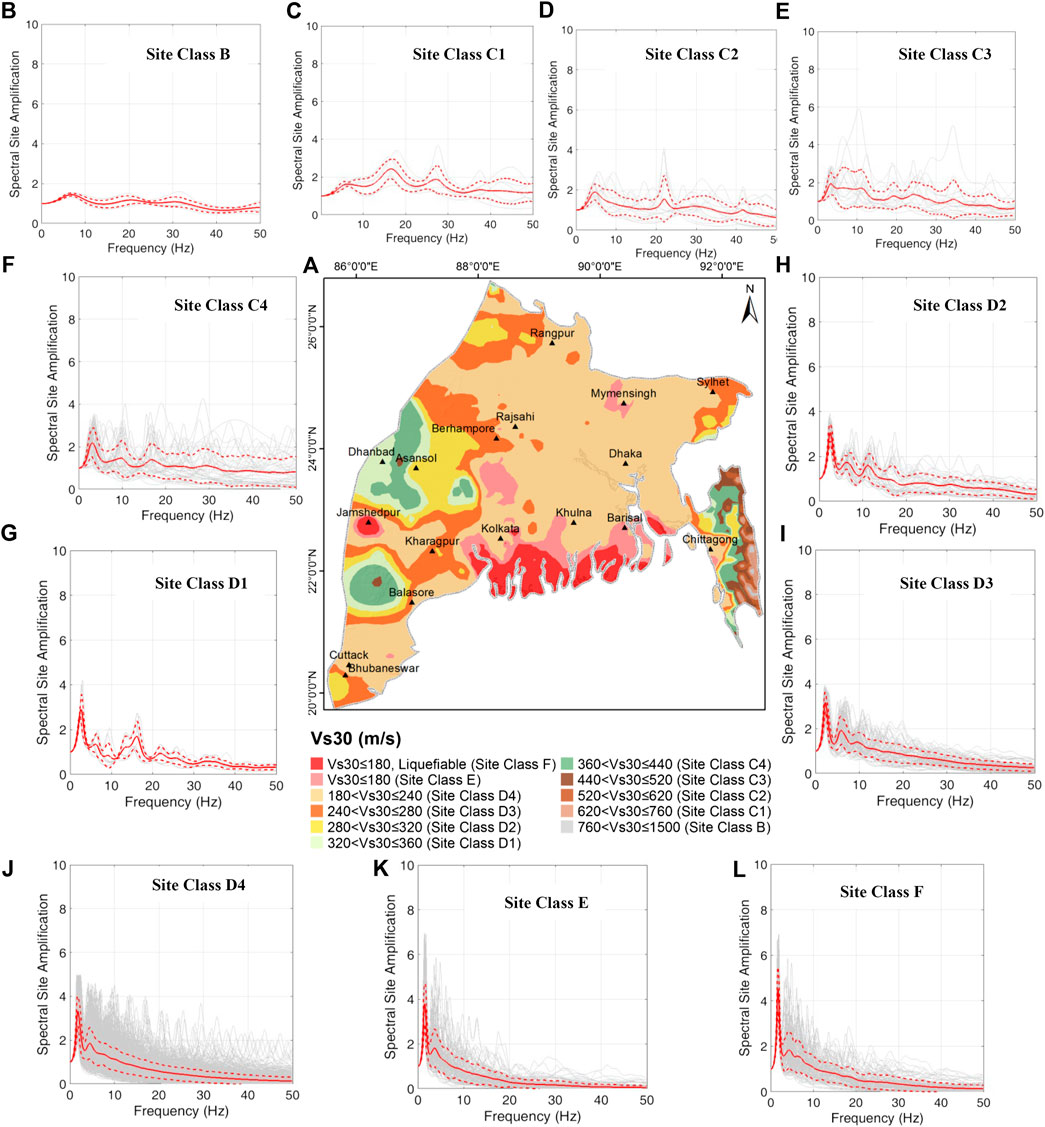
FIGURE 11. (A) Site classification map of Bengal Basin adhering to Sun et al. (2018) and displaying the presence of site classes F, E, D4, D3, D2, D1, C4, C3, C2, C1, and B in the terrain with the dominance of site class D4 followed by site class D3 and site class E in this alluvial field region, while site classes C4, C3, C2, C1, and B are in the hilly terrain. The generic site amplification spectrum for site classes (B) B, (C) C1, (D) C2, (E) C3, (F) C4, (G) D1, (H) D2, (I) D3, (J) D4, (K) E, and (L) F with spectral amplifications of 1.45 at 6.7 Hz, 1.6 at 6.3 Hz, 1.89 at 4.7 Hz, 1.92 at 3.36 Hz, 2.19 at 3.12 Hz, 2.9 at 2.68 Hz, 3.06 at 2.53 Hz, 3.17 at 2.24 Hz, 3.31 at 1.8 Hz, 3.75 at 1.7 Hz, and 4.5 at 1.47 Hz, respectively.
The generic spectral site amplification curves with ±1 standard deviation have been generated by summing up and averaging all the site response spectra at all borehole sites located in each site class for at least five near-field earthquakes impinging in that site class. As shown in Figure 11, we, thus, defined the generic site amplification spectrum in site class B with the spectral amplification factor (SAF) =1.45 at 6.7 Hz, C1 with SAF= 1.6 at 6.3 Hz, C2 with SAF =1.89 at 4.7 Hz, C3 with SAF= 1.92 at 3.36 Hz, C4 with SAF= 2.19 at 3.12 Hz, D1 with SAF= 2.9 at 2.68 Hz, D2 with SAF= 3.06 at 2.53 Hz, D3 with SAF= 3.17 at 2.24 Hz, D4 with SAF =3.31 at 1.8 Hz, E with SAF= 3.75 at 1.7 Hz, and F with SAF= 4.5 at 1.47 Hz.
Site coefficient is considered as the most essential parameter that defines seismic coefficient in conjunction with the zone factor and other important design parameters including design response spectra. Therefore, a nonlinear regression analysis has been performed between the set of site coefficients viz. short-period amplification factor, Fa for 0.1–0.5 s, and mid-period amplification factor, Fv for 0.4–2.0 s (BSSC, 2001; Sun et al., 2005), calculated from the response spectra of both the bedrock and the surface for the aforesaid earthquakes and their corresponding VS30 for 11 site classes, as shown in Supplementary Figures S8, S9, respectively, and the formulations are illustrated in the Supplementary Text S1 in the Electronic Supplement.
Design response spectra with 5% damping are derived using both the surface-consistent and bedrock level PSA at 1.0 and 0.2 s at the corresponding site classes following IBC (2009) formulations, as detailed in Supplementary Text S2 in the electronic supplementary material, for eight cities of this study region viz. Dhaka, Mymensingh, Sylhet, Kolkata, Dhanbad, Bhubaneswar, Malda, and Chittagong as presented in Supplementary Figure S10 in the electronic supplement, which can be used to modify the existing building codal provision.
Seismic risk assessment is to predict probability of economic losses and building and infrastructure damage due to potential seismic hazard or scenario earthquakes. Generally, it consists of three parts: analyzing seismic hazard, estimating socioeconomic vulnerability in terms of population density per km2, land use/land cover (LULC), number of household per district, and building density per km2 judiciously integrated with surface-consistent PGA with 10% probability of exceedance in 50 years as envisioned in Nath et al. (2015) for the capital city of Kolkata in West Bengal.
Population vulnerability exposure is estimated with the help of census data, which normally provides average number of persons per parcel/ward. A well-organized demographic data is required for seismic risk modeling at the census tract level. In the Bengal Basin, population density, male and female population ratio, age-wise population below 7 years and above 65 years, and day time and night time population have been estimated from Census of India (2011) data and Census of Bangladesh (2011) data. In the present study, GIS-based geostatistical technique (e.g., Kriging), as depicted in Supplementary Figure S11 of the Electronic Supplement, has been used to calculate number of persons per km2, as shown in Figure 12B, which depicts that population density is very high in Kolkata, followed by Dhaka and Narayanganj. Figure 12C depicts the household distribution in each of 10,000 socioeconomic clusters in the region. As the household includes all the persons who occupy a single housing unit, therefore, it has a direct relationship with the building inventory.
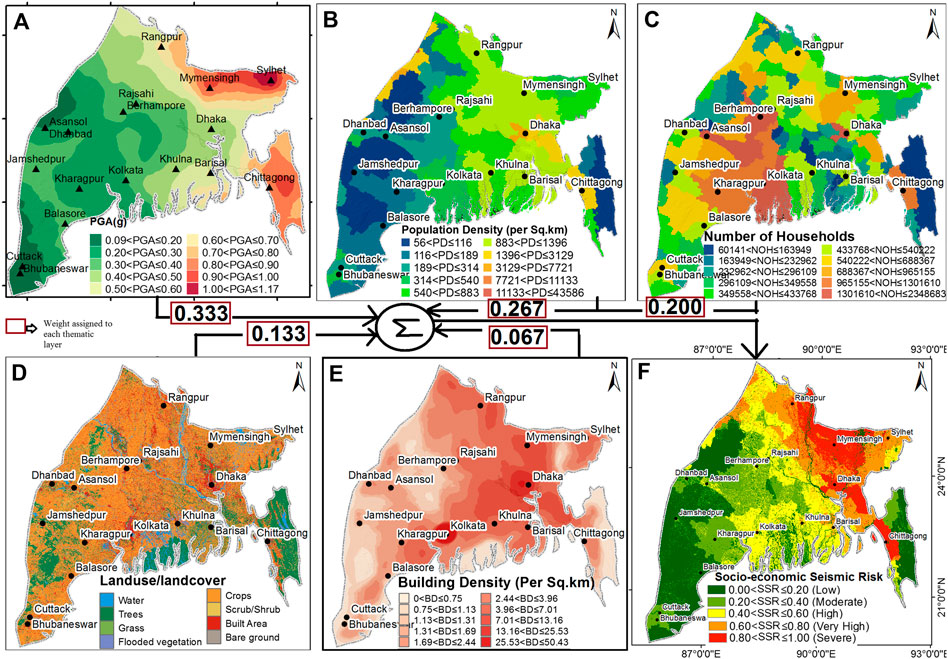
FIGURE 12. Socioeconomic seismic risk (SSR) zonation map preparation of Bengal Basin by overlaying (A) the spatial distribution of surface-consistent peak ground acceleration with 10% probability of exceedance in 50 years as a thematic layer and integrating it with the vulnerability components viz. (B) District wise population density per km2 (adopted from Census of India, 2011 and Census of Bangladesh, 2011), (C) district wise number of households (adopted from Census of India, 2011 and Census of Bangladesh, 2011), (D) land use/land cover (Karra et al., 2021), and (E) building density per km2 by assigning 0.333, 0.267, 0.200, 0.133, and 0.067 weights, respectively, through the analytic hierarchy process (AHP) of Saaty (1980) to produce the socioeconomic seismic risk map of the basin in (F).
Identifying, delineating, and mapping land cover is important for global monitoring studies, resource management, and planning activities. Identification of land cover establishes the baseline from which monitoring activities (change detection) can be performed. Remote sensing methods can be employed to classify the types of land use in a practical, economical and repetitive fashion, over large areas. The terms land use and land cover are often used interchangeably, but each term has its own unique meaning. Land cover refers to the surface cover on the ground like vegetation, urban infrastructure, water, bare soil etc. Identification of land cover establishes the baseline information for activities like thematic mapping and change detection analysis. Land use refers to the purpose the land serves, for example, recreation, wildlife habitat, or agriculture. When used together with the phrase land use/land cover (LULC) generally refers to the categorization or classification of human activities and natural elements on the landscape within a specific time frame based on established scientific and statistical methods of analysis of appropriate source materials. The growth of a society totally depends on its social and economic development. This is the basic reason why socioeconomic surveys are carried out. This type of survey includes both the spatial and non-spatial datasets. LULC maps play a significant and prime role in planning, management and monitoring programs at local, regional, and national levels. This type of information, on one hand, provides a better understanding of land utilization aspects, and on the other hand, it plays an important role in the formation of policies and program required for development planning. For ensuring sustainable development, it is necessary to monitor the ongoing process on land use/land cover pattern over a period of time. In order to achieve sustainable urban development and to check the haphazard development of towns and cities, it is necessary that authorities associated with the urban development generate such planning models so that every bit of available land can be used in most rational and optimal way. This requires the present and past land use/land cover information of the area. LULC maps also help us to study the changes that are happening in our ecosystem and environment. If we have an inch by inch information about land use/land cover of the study unit we can make policies and launch programs to save our environment. LULC classification is one of the most widely used applications in remote sensing. The most commonly used approaches include unsupervised classification (calculated by software) and Supervised classification (human guided) which is based on the idea that a user can select sample pixels in an image that are representative of specific classes and then direct the image processing software to use these training sites as references for the classification of all other pixels in the image. Training sites (also known as testing sets or input classes) are selected based on the knowledge of the user. The user also sets the bounds for how similar other pixels must be to group them together. These bounds are often set based on the spectral characteristics of the training area, plus or minus a certain increment (often based on “brightness” or strength of reflection in specific spectral bands). The user also designates the number of classes that the image is classified into. Accurate and up-to-date land use/land cover mapping has always been of interest to geoscience and remote sensing societies mainly because it is a provider of valuable information to understand human–environment relationships. Accurate and real-time LULC maps are important to provide precise information for dynamic monitoring, planning, and management of the Earth. With the advent of cloud computing platforms, time series feature extraction techniques, and machine learning classifiers, new opportunities are arising in more accurate and large-scale LULC mapping. In the present study LULC map has been classified using Sentinel-2 multispectral satellite imagery which is geometric, radiometric, terrain, and surface reflectance corrected with a spatial resolution of 10 m. The Sentinel-2 mission was developed by the European Space Agency (ESA) as a part of the Copernicus Programme. The different seasonal image datasets represented for each season have been considered for the analyses based on the median value of the collection. The multispectral bands in the study included Blue (B2), Green (B3), Red (B4), Red Edge 1 (B5), Red Edge 2 (B6), Red Edge 3 (B7), near-infrared (NIR) (B8), Red Edge 4 (B8A), shortwave infrared (SWIR) 1 (B11), and SWIR 2 (B12). In addition to these spectral bands, the normalized difference vegetation index (NDVI) and a digital elevation model (DEM) have been added to the seasonal image data (IMG 1–4) with the objective of increasing classification accuracy. In an effective LULC classification algorithm of the type depicted in Supplementary Figure S12 of the Electronic Supplement, the training dataset has been prepared such as, water, trees, grass, flooded vegetation, crops, scrub/shrub, built area, and bare ground following European Space Agency’s protocol into eight classes. The categorical loss entropy function is then used to create the labeled data sample for the training purpose. Thereafter, image segmentation using the UNet model with a cross-validation mechanism has been carried out on the training dataset formulated as a pixel-wise categorical classification problem with eight training classes. This is a convolutional neural network architecture designed for supervised classification of satellite imagery. Every band pixel is converted to floating point and scaled between 0 and 1. The stratified sampling is used during the model classification. Data augmentation is applied by randomly flipping the images vertically and horizontally, which has the effect of introducing more geographic pattern realizations. Thus, a final LULC map is generated for the Bengal Basin by computing a class weighted mode across all the model predictions with 100 iterations for the training, which generates the desired classification (Karra et al., 2021), as depicted in Figure 12D.
The spatial distribution of urban and rural structures is a fundamental component for earthquake induced damage assessment, which can be used to create post-disaster emergency planning. The building footprint for Bengal Basin has been digitized from visual interpretation techniques, using image elements such as tone, texture, shape, size, shadow, pattern, association, and location. The building footprint map has been prepared with the help of poor spectral and high spatial resolution satellite imagery (e.g., Sentinel-2, LISS-IV, and Landsat 8OLI) and Google Earth. The Sentinel-2 imagery, however, has been used in this study because of its finer spectral resolution compared to any other commonly used images such as SPOT and Landsat 8OLI. On the other hand, LISS-IV imagery has also been used for its finer spatial resolution and better enhancement of urban attributes. In the present study, principal component analysis, textural analysis, and normalized differences building index (NDBI= [Shortwave Infrared−Near Infrared]/[Shortwave Infrared + Near Infrared]) calculation have been performed for the identification of building footprint and validated through a rapid visual screening (RVS) survey. Building density thus has been calculated using the total number of buildings in a unit area (i.e., District Boundary area), following the protocol given in the Electronic Supplementary Figure S13 to produce the resulting theme shown in Figure 12E.
In order to estimate the risk due to primary seismic hazard, the vulnerability components viz. land use/land cover, population density, number of households, and building density have been overlaid and integrated with the primary hazard attribute, that is, the PGA at the surface level with 10% probability of exceedance in 50 years, as shown in Figure 12A. All the thematic layers have been assigned appropriate weights and all the attributes in each theme have also been assigned appropriate ranks, as listed in Supplementary Table S2 in the Electronic Supplement. The socioeconomic seismic risk (SSR) map thus prepared have been divided into five broad classes viz. low (0<SSR≤0.2), moderate (0.2<SSR≤0.4), high (0.4<SSR≤0.6), very high (0.6<SSR≤0.8), and severe (0.8<SSR≤1.0), as depicted in Figure 12F. It has been observed that the risk estimated in parts of Dhaka, Mymensingh, Rangpur, and Chittagong are severe, while high to very high risk has been seen in Kolkata, Sylhet, Rajshahi, Khulna, and Barisal. Other important cities such as Asansol, Dhanbad, Jamshedpur, Bhubaneswar, and Cuttack are seen to lie in the moderate risk zone.
Seismic microzonation is the generic term for subdividing a region into sub-regions in which different safeguards are to be adopted in case of a catastrophic earthquake visiting the region. Microzonation studies involve experimental techniques together with theoretical approaches involving ground motion modeling and earthquake effects implicating ground geology-geomorphology attributes consisting of geomorphological, geological and geotechnical information. Also some important seismological attributes being used in the seismic microzonation protocol are PGA at the surface-consistent level from probabilistic or deterministic approach, predominant frequency, site response/amplification, liquefaction and landslide due to earthquakes etc. All of which are integrated with the geo-hazard attributes using multi-criteria decision-making toosls like weights of the attributes depending on the region and the decision maker, for example flat terrain has weight of “0” value for landslide and deep soil terrain has the maximum weight for site response or liquefaction.
Multi-criteria seismic hazard microzonation may use integration protocol following Analytic Hierarchy Process (AHP) developed by Saaty (1980) on GIS platform as has been carried out previously in a number of Indian Cities viz. Guwahati (Nath et al., 2007), the Sikkim Himalaya (Nath, 2004), Chennai (Ganapathy, 2011), Kolkata (Nath et al., 2014), Kachchh (Pancholi et al., 2022) etc. There are multivariate statistical approaches like logistic regression (LR) proposed by Althuwaynee et al. (2014) and Hemasinghe et al. (2018) which have found wider applications in similar multi-criterion integration framework used in landslide hazard zonation alongside machine learning data-driven Random Forest (RF) technique, another most popular ensemble learning method, developed by Breiman (2001) and used successfully by Nath et al. (2021b) in the multi-criterion landslide susceptibility mapping in Darjeeling–Sikkim Himalaya employing all of AHP, LR and RF techniques mimicking the hazard zonation within 87% confidence bound. In the present study, we limit ourselves to AHP hierarchical structure that quantifies relative importance for a given set of themes on a ratio scale depending on the user’s judgment. From the judgments between two particular themes, a pairwise comparison matrix is created here on a scale of integer factors 1–6, implying an ascending importance of the themes. The pairwise comparison matrix is thus prepared to evaluate the individual normalized weights of each theme. The weights of each criterion are determined by summing up all the ratios in the relative matrix column and then dividing each theme in the matrix by its column total to generate a normalized pairwise matrix, and then the weighted matrix is generated by dividing the sum of the normalized row by the number of criteria used. The consistency index (CI) is an essential tool of the AHP that allows the rating inconsistencies to be calculated (Saaty, 1980). The consistency ratio (CR), which is the ratio of the consistency index (CI) and the random index (RI) obtained using the AHP method, is less than 0.1. Saaty (1980) provided an average RI for different matrix orders. The weights are normalized to 1 and are used in deriving the weighted sums of rating for each region of polygons of the mapped layers. Within each theme, the values differ remarkably and are therefore reclassified into various ranges or types collectively termed as a feature of a thematic layer. The corresponding feature attributes are ranked within the theme. The initial integral ranking is normalized to ascertain that no layer exerts an influence beyond its determined weight (Nath et al., 2014). Most cities and urban centers in Bengal Basin have been rocked time and again by moderate to large earthquakes thus making a strong case for locale-specific seismic hazard and microzonation studies be undertaken as envisaged in a decade old Federal Government Research Theme implicating the urban centers with population more than a million and for those located in seismic zones III, IV and V. Of all those attempted by us the case of Dhanbad and Mymensingh have been presented here.
Dhanbad, the “Coal Capital of India”, is one of the major urban-agglomeration of India with more than a million population, and is known for its coal mines and industrial establishments. The city is surrounded by about 112 coal mines with a total production of 27.5 million tons. It is located in seismic zone III according to BIS (2002) and had been visited by 1868 Hazaribagh earthquake of MW 5, 1934 Bihar–Nepal earthquake of MW 8.1, 1963 Ranchi earthquake of MW 5, 1968 Manbhum earthquake of MW 5.7, 1969 Bankura earthquake of MW 5.7 and so on indicating the presence of active neotectonic faults and lineaments in and around the city. Mymensingh, on the other hand is a major financial center and educational hub of north-central Bangladesh and is the second most densely populated city of the country. Being located in the close proximity of Madhupur fault, Dauki fault, Sylhet fault and Indo-Eurasian & Indo-Burmese plate boundaries, Mymensingh experienced several large earthquakes in the past like 1885 Bengal earthquake of MW 6.8, 1897 Shillong earthquake of MW 8.1, 1918 Srimangal earthquake of MW 7.6 and so on which devastated the city time and again. Thus it is felt imperative to study the earthquake impact on these cities and increase seismic resilience of those. The hazard themes pertaining to the study region which are materialized as thematic layers on GIS platform are 1) surface-consistent peak ground acceleration for 475 years of return period (PGA), 2) probabilistic liquefaction potential index (LPI), 3) site class (SC), 4) predominant frequency (PF), 5) geomorphology (GM), and 6) surface geology (GL). Each thematic layer has been geo-rectified on a universal transverse Mercator (UTM) projection system. The corresponding weights of all the thematic layers, the feature ranks of each thematic layer, and the theme attribute score thereof are assigned values according to the apparent contribution of the layers and layer-wise features to overall seismic hazard. Surface-consistent PGA for 475 years of return period is given utmost weightage; followed by secondary hazard attribute applicable for flat land areas viz. probabilistic LPI, Site Class based on Vs30 distribution and Predominant Frequency which is a crucial deciding factor for urban planning due to its relation with building height/no of stories. Geomorphology replicates liquefaction potential, drainage pattern, ground subsidence potential, topography and other engineering geological aspects, while surface geology indicates the ground condition of a terrain; both have been assigned least weightage. Each of the themes has been classified into several attributes which are again assigned appropriate ranks. PGA and LPI have been ranked in the directly proportional order, while SC and PF have been given ranks in inverse manner. In case of the geomorphology of Dhanbad, waterbodies have been given the highest feature rank, and moderately dissected structural hills and valleys are assigned the lowest according to their liquefaction susceptibility potential; while surface geological elements are ranked according to their rock properties. In case of Mymensingh, active channels consisting of fine grained sand and silt with perennial water flow have been ranked the highest as it resembles with soft and liquefiable soil/alluvium condition; whereas, the most stable zone of the city viz. Flood plains have been assigned the lowest rank. Surface geological features of Mymensingh have been ranked in the similar fashion. All the georeferenced thematic layers are integrated step-by-step using the aggregation method in GIS to estimate the seismic hazard index (SHI) as follows:
where “w” represents the normalized weight of a theme and “r” is the normalized rank of a feature in the theme. SHI is a dimensionless quantity that helps in indexing seismic hazard and thus accomplish microzonation of a region into a qualitative scheme such as “Low”, “Moderate”, “High” and “Very High”. Thus the calculated seismic hazard index (SHI) has been categorized into four classes viz. “Low (0.00<SHI≤0.25)”, “Moderate (0.25<SHI≤0.50)”, “High (0.50<SHI≤0.75)” and “Very High (0.75<SHI≤1.00)”. Supplementary Tables S3, S4 illustrate the thematic layers, their feature attributes, ranks, normalized ranks and weights for the cities of Dhanbad and Mymensingh respectively in the Electronic Supplement. Figures 13, 14 depict all the thematic layers along with the final Holistic seismic hazard microzonation maps and their validations for both the cities of Dhanbad and Mymensingh, respectively.
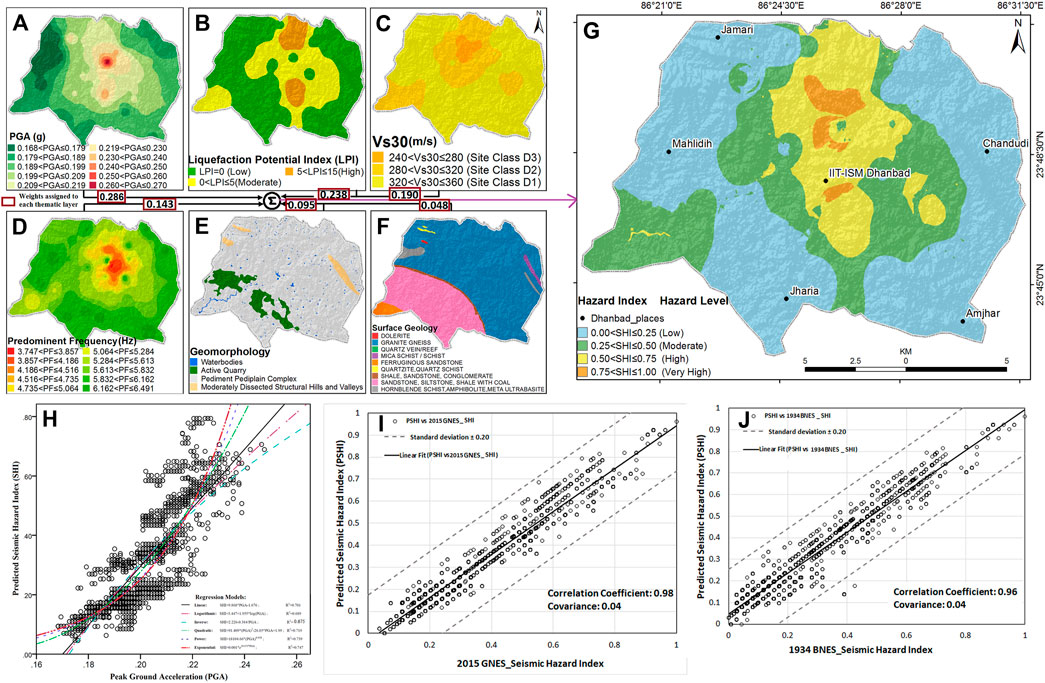
FIGURE 13. Preparation of the holistic seismic hazard microzonation map of Dhanbad on the GIS platform by overlaying (A) spatially distributed surface-consistent probabilistic peak ground acceleration for 475 years of return period on the geo-hazard thematic layers viz. (B) Probabilistic liquefaction potential index distribution, (C) site class map, (D) predominant frequency spatial distribution map, (E) geomorphology map (adopted from https://bhukosh.gsi.gov.in/), and (F) surface geology map (adopted from https://bhukosh.gsi.gov.in/) by assigning individual weights of the order of 0.286, 0.238, 0.190, 0.143, 0.095, and 0.048, respectively, using the analytic hierarchy process and integrating all the themes to produce seismic hazard microzonation map of the city as given in (G). Various regression relations given in (H) worked out between the seismic hazard index and peak ground acceleration depict an exponential fit between the two variables. A direct correlation between the probabilistic seismic hazard index of the microzonation map with the scenario hazard theme created for 2015 Gorkha–Nepal earthquake of MW 7.8 through similar integration of scenario PGA with the aforesaid geo-hazard themes and the regression relation just work out produce 0.98 correlation coefficient between the two variables with a covariance of 0.04 as shown in (I), while a similar exercise with 1934 Bihar–Nepal earthquake of MW 8.1 produces 96% correlation between these variables with a similar covariance of 0.04 as depicted in (J).
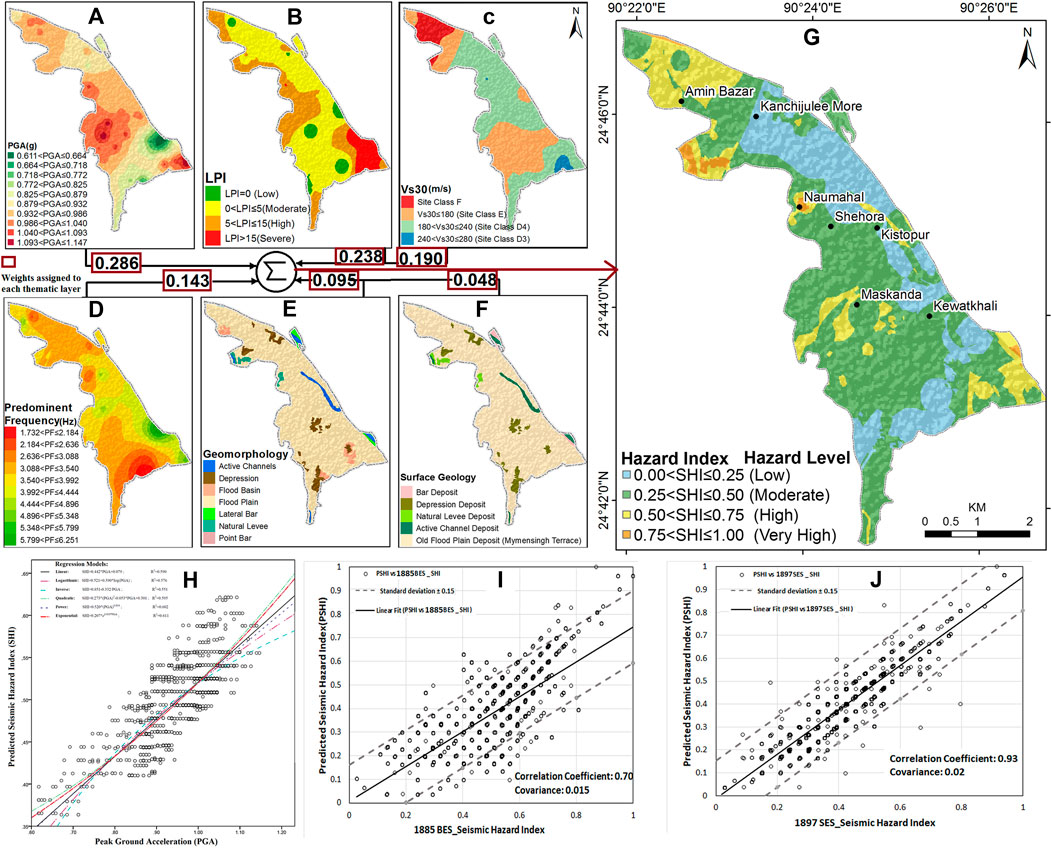
FIGURE 14. Preparation of the holistic seismic hazard microzonation map of Mymensingh on the GIS platform by overlaying (A) spatially distributed surface-consistent probabilistic peak ground acceleration for 475 years of return period on the geo-hazard thematic layers viz. (B) probabilistic liquefaction potential index distribution, (C) site class map, (D) predominant frequency spatial distribution map, (E) geomorphology map, and (F) surface geology map by assigning individual weights of the order of 0.286, 0.238, 0.190, 0.143, 0.095, and 0.048, respectively, using the analytic hierarchy process and integrating all the themes to produce seismic hazard microzonation map of the city as given in (G). Various regression relations given in (H) worked out between the seismic hazard index and peak ground acceleration depict an exponential fit between the two variables. A direct correlation between the probabilistic seismic hazard index of the microzonation map with the scenario hazard theme created for 1885 Bengal earthquake of MW 6.8 through similar integration of scenario PGA with the aforesaid geo-hazard themes and the regression relation just work out produce 0.70 correlation coefficient between the two variables with a covariance of 0.015 as shown in (I), while a similar exercise with 1897 Shillong earthquake of MW 8.1 produces 93% correlation between these variables with a covariance of 0.02 as depicted in (J).
It is observed that Velatanr, Bishnupur, and southwestern part of Hirapur of Dhanbad city fall under “Very High” hazard zone, Gohalkandi, and Naumahal follow suit in case of Mymensingh city. The residential areas and corporate houses of the city of Dhanbad in Bishnupur, Hirapur, Nayabazar, Panchwati, Wassepur, Dhokhra, Dhaunsar, and Sanjay Nagar are exposed to “Moderate” to “High” hazard condition. Commercial and residential complexes of the city in Gologonda, Dholadia, Amin Bazar, Maskanda, Kewatkhali, Balashpur, Bhatikashar, and Kashor of Mymensingh also exhibit “Moderate” to “High” hazard indices. “Low” hazard zone includes the regions of Jamari, Mahlidih, Jharia, Palani, and Gosaidi in the city of Dhanbad. Likewise, Kanchijulee More and Kistopur of the city of Mymensingh also belong to the “Low” hazard zone.
Various regression relations given in Figure 13H for the city of Dhanbad worked out between the seismic hazard index and peak ground acceleration depict an exponential fit between the two variables. A direct correlation between the probabilistic seismic hazard index of the microzonation map with the scenario hazard theme created for 2015 Gorkha–Nepal earthquake of MW 7.8 through similar integration of scenario PGA with the Geo-hazard themes and the regression relation just work out produce 0.98 correlation coefficient as computed using the formulation given in Supplementary Text S3 in the Electronic Supplementary material between the two variables with a covariance of 0.04 as shown in Figure 13I, while a similar exercise with 1934 Bihar–Nepal earthquake of MW 8.1 produces 96% correlation between these variables with a similar covariance of 0.04 as depicted in Figure 13J. Similarly, various regression relations given in Figure 14H worked out for the city of Mymensingh between the seismic hazard index and peak ground acceleration depict an exponential fit between the two variables. A direct correlation between the probabilistic seismic hazard index of the microzonation map with the scenario hazard theme created for 1885 Bengal earthquake of MW 6.8 through similar integration of scenario PGA with the geo-hazard themes and the regression relation just work out produce 0.70 correlation coefficient using the formulation given in Supplementary Text S3 in the Electronic Supplementary material between the two variables with a covariance of 0.015 as shown in Figure 14I, while a similar exercise with 1897 Shillong earthquake of Mw 8.1 produces 93% correlation between these variables with a covariance of 0.02 as depicted in Figure 14J.
The basic principle of using SELENA as suggested by Molina et al. (2014) is the capacity spectrum method wherein the response spectra is compared with the capacity curves of corresponding building types. In total, 11 model building types viz. A1, RS2, URML, URMM, C1L, C1M, C1H, C3L, C3M, C3H, and HER have been identified in both the cities of Dhanbad and Mymensingh from the satellite imagery through Google Earth and verified further through rapid visual screening following the building nomenclature given in WHE-PAGER (2008) and FEMA (2000). The building inventories of all the cities of Bengal Basin have five occupancy types, namely, “residential,” “commercial,” “educational,” “governmental,” and “religious.” The unit area of the study region is termed as “geounit” and damage potential of each geounit is calculated in terms of “None,” “Slight,” “Moderate,” “Extensive,” and “Complete” using uniform hazard curve of the same geounit and computation of capacity spectrum, demand spectrum, and identification of the performance point (Freeman et al., 1975; Freeman, 1978; ATC–40, 1996). The respective capacity curves for all the 11 building types and their fragility curves using PSA and PGA have been adopted from NIBS (2002). In addition to this, human casualty has also been calculated following the protocol given in Supplementary Figure S14 in the Electronic Supplement. The methodology as adopted from Molina et al. (2014) results in the number of human casualties caused by building collapse, with the severity of injury levels ranging from “Low,” “Medium,” “Heavy,” and “Death” assuming that about 98, 90, and 36% of the population resides at home or indoors at three distinct times of the day viz. night time (at∼ 02:00 a.m.), day time (at ∼10:00 a.m.), and commuting time (at ∼ 05:00 p.m.), respectively. The SELENA package works on the framework given in Supplementary Figure S14 in the Electronic Supplement for the assessment of damage, casualty, and economic loss. Figure 15 depicts the damage probability computed in terms of “None,” “Slight,” “Moderate,” “Extensive,” and “Complete” for all the model building types and number of human casualties with various levels of injury at the night, day, and commuting time scenarios in the cities of Dhanbad and Mymensingh. As shown in Figures 15A, B, 80–90% of the buildings made of adobe block, mud mortar and wood (A1), rubble stone masonry buildings with timber frame and roof (RS2), and low to medium-rise unreinforced masonry buildings (URML and URMM) are expected to face “complete” damage in Dhanbad. 25–45% of both the ductile and non-ductile reinforced concrete buildings viz. C1L, C1M, C1H, C3L, C3M, and C3H will face “Moderate” to “Extensive” damage states in the city of Dhanbad. In addition, 70% of all the buildings of reinforced concrete type, that is, C1L, C1M, C1H, C3L, C3M, and C3H will suffer complete damage state in the city of Mymensingh, while 100% of all other building types may suffer “Complete” damage state in the same city.
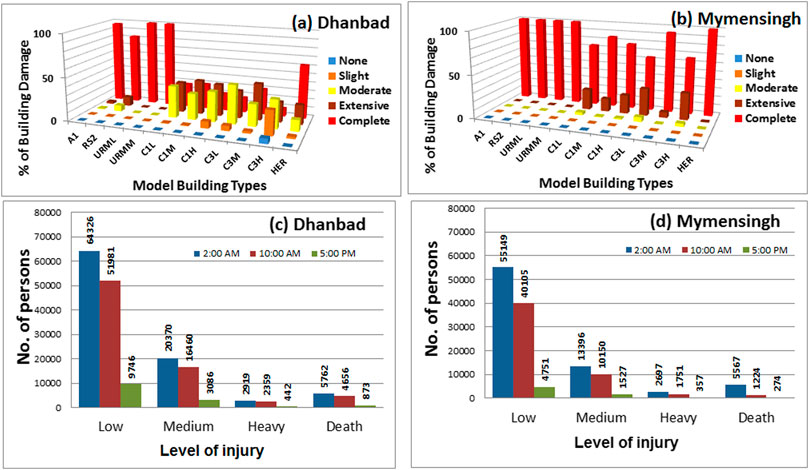
FIGURE 15. Damage probability computed in terms of “None,” “Slight,” “Moderate,” “Extensive,” and “Complete” for 11 model building types in the cities of (A) Dhanbad and (B) Mymensingh and various levels of injury suffered by the human population at the three distinctly different times of the day viz. “night time,” “day time,” and “commuting time” for the cities of (C) Dhanbad in Jharkhand and (D) Mymensingh in Bangladesh.
This analysis also depicts that 5% of a total of 1.3 million residents of the city of Dhanbad, Jharkhand will suffer from “Low” level of injury if the three distinctly different time scenarios of a day viz. “night time,” “day time,” and “commuting time” are considered together, whereas about 1.6% of the population will suffer “Medium” level of injury, 0.22% will suffer “Heavy” level of injury, and 0.44% of the total population of the city will die when exposed to the surface-consistent probabilistic seismic hazard scenario of the city for 475 years of return period, as shown in Figure 15C. The scenario for the city of Mymensingh with the dwelling of about 4,77,000 people is marginally different where 11.56% of the population will suffer from “Low” level of injury if the three distinctly different time scenarios of a day viz. “night time,” “day time,” and “commuting time” are considered together, whereas about 2.8% of the population will suffer “Medium” level of injury, 0.56% will suffer “Heavy” level of injury, and 1.16% of the total population of the city will face “Death” when exposed to the surface-consistent probabilistic seismic hazard scenario of the city, as shown in Figure 15D.
Site conditions significantly influence seismic hazard potential of a region and, therefore, its characterization has emerged as a crucial step in the quantification of seismic hazard associated with high-risk urban centers across the globe. The present study appraises a site-specific seismic response analysis toward holistic site characterization of the thick alluvial terrain of Bengal Basin in terms of absolute amplification in the range of 0.04–4.05, predominant frequency in the range of 0.67–8.19 Hz, and spectral site amplification varying to the tune of 1.02–8.19 based on the enriched geological, geomorphological, geotechnical, and geophysical database of the region. The surface-consistent PGA distribution varying from 0.09 to 1.17 g for 475 years of return period places the cities of Sylhet and Chittagong in “Severe” (PGA: 0.9–1.18 g); Rangpur, Mymensingh, and Comilla in “High” (PGA: 0.6–0.9 g); and Dhaka, Rajshahi, Khulna, Berhampore, Dhanbad, Bhubaneswar, Kolkata, and Asansol in “Moderate” (PGA: 0.3–0.6 g) hazard regime. A site-specific soil liquefaction analysis exhibits the vulnerability of the sediments underlying most part of the basin, thus facilitating reclassification of those areas from site class E to F with other attributes remaining the same. Site coefficients, Fa (0.1–0.5 s) and Fv (0.4–2.0 s), are the most essential parameters that define the seismic coefficient in conjunction with the zone factor and other important design parameters including design response spectra. These site attributes may finally be adopted in prescribing updated seismic design code for the seismogenic tectonic province of Bengal Basin toward achieving earthquake-safe urban development strategy.
Seismic vulnerability and risk assessment is an important step to ensure the building safety and reliability of current building codes. A socioeconomic seismic risk map is prepared by integrating hazard themes such as PGA at the surface as a primary level hazard and vulnerability themes based on land use/land cover, demographic distribution, and building density assigning appropriate weightage to each of the themes. Severe risk zone covers the areas of Dhaka, Mymensingh, Rangpur, and Chittagong because of their burgeoning population convolved with intense seismic hazard. The cities of Kolkata, Sylhet, Rajshahi, Khulna, Barisal, Asansol, Dhanbad, Jamshedpur, Bhubaneswar, and Cuttack are implicated with moderate to high seismic risk.
The seismic microzonation has emerged as an important issue in high-risk urban centers across the world and is considered an integral part of earthquake-induced disaster mitigation practices. A new perspective of multi-criteria holistic seismic hazard microzonation has been presented here for Dhanbad and Mymensingh. The adopted microzonation framework is based on enriched homogeneous earthquake catalogue, upgraded tectonic database, seismotectonic implications, geological, geomorphological, and geotechnical and geophysical database, judiciously integrated in a multicriterion decision-making protocol using sophisticated analytical/numerical technologies coupled with geographical information system. Thus, if the findings of the present analysis on holistic seismic hazard microzonation are judiciously implemented, it could be useful in establishing criteria for land use planning and for adopting a strategy for the formulation of systematic and informed decision-making process for the development of new communities in the region.
The open-source MATLAB-based SELENA delivered the damage probability in five different levels for the 11 model building types across the cities and number of human casualties at four different levels of injury in the three significant times of the day. The holistic hazard, risk, and damage potential model of Bengal Basin presented here will aid in the effective earthquake induced disaster mitigation and management of the basin.
The original contributions presented in the study are included in the article/Supplementary Material; further inquiries can be directed to the corresponding author.
SKN, AB, and AS took part in conceptualization, methodology, data acquisition, analysis, synthesis, and manuscript writing–draft preparation. ASG involved in mapping and reprography. CG and JM involved in data processing.
Partial research funding received from the Ministry of Earth Sciences, Government of India for Seismic Microzonation of Kolkata vide sanction order no. MoES/P.O. (Seismo)/1 (60)/2009.
Data have been collected in parts from various open domain sources and published literatures. Many open-source software and codes have been used in this work. Dr. Dominik H. Lang from Norwegian Geotechnical Institute have trained our Engineering Seismology Group on the MATLAB-based SELENA package. The critical review and constructive suggestions made by both the reviewers have greatly helped in revising the manuscript and bring it to its present shape with higher scientific exposition. The apt handling of the manuscript by the handling editor and the editorial team is thankfully acknowledged.
The authors declare that the research was conducted in the absence of any commercial or financial relationships that could be construed as a potential conflict of interest.
All claims expressed in this article are solely those of the authors and do not necessarily represent those of their affiliated organizations, or those of the publisher, the editors, and the reviewers. Any product that may be evaluated in this article, or claim that may be made by its manufacturer, is not guaranteed or endorsed by the publisher.
The Supplementary Material for this article can be found online at: https://www.frontiersin.org/articles/10.3389/feart.2022.959108/full#supplementary-material
Allen, T. I., Gibson, G., Brown, A., and Cull, J. P. (2004). Depth variation of seismic source scaling relations: Implications for earthquake hazard in southeastern Australia. Tectonophysics 390 (1-4), 5–24. doi:10.1016/j.tecto.2004.03.018
Althuwaynee, O. F., Pradhan, B., Park, H. J., and Lee, J. H. (2014). A novel ensemble bivariate statistical evidential belief function with knowledge-based analytical hierarchy process and multivariate statistical logistic regression for landslide susceptibility mapping. Catena 114, 21–36. doi:10.1016/j.catena.2013.10.011
ATC-40 (1996). Seismic evaluation and retrofit of concrete buildings. Redwood City, CA: Applied technology council. report ATC-40, 2.
Atkinson, G. M., and Assatourians, K. (2015). Implementation and validation of EXSIM (A stochastic finite-fault ground-motion simulation algorithm) on the SCEC broadband platform. Seismol. Res. Lett. 86 (1), 48–60. doi:10.1785/0220140097
Atkinson, G. M., and Boore, D. M. (2006). Earthquake ground-motion prediction equations for eastern North America. Bull. Seismol. Soc. Am. 96 (6), 2181–2205. doi:10.1785/0120050245
Atkinson, G. M., and Kaka, S. I. (2007). Relationships between felt intensity and instrumental ground motion in the central United States and California. Bull. Seismol. Soc. Am. 97 (2), 497–510. doi:10.1785/0120060154
Bessason, B., and Erlingsson, S. (2011). Shear wave velocity in surface sediments. Jökull 61, 51–64.
BIS (2002). IS-1893-2002 (Part 1): Indian standard criteria for earthquake resistant design of structures, Part 1-general provisions and buildings. New Delhi: Bureau of Indian Standards.
BSSC (2003). NEHRP recommended provisions for seismic regulations for new buildings and other structures (FEMA 450) Part 1. Washington, DC: Building Seismic Safety Council.
BSSC (2001). NEHRP recommended provisions for seismic regulations for new buildings and other structures. 2000 edition, Part 1: Provisions, building seismic safety council for the federal emergency management agency (report FEMA 368). Washington D.C.
Campbell, K. W., and Bozorgnia, Y. (2003). Updated near-source ground-motion (attenuation) relations for the horizontal and vertical components of peak ground acceleration and acceleration response spectra. Bull. Seismol. Soc. Am. 93 (1), 314–331. doi:10.1785/0120020029
Census of Bangladesh, (2011). Census of Bangladesh. Available at: http://www.bbs.gov.bd/site/page/47856ad0-7e1c-4aab-bd78-892733bc06eb/Population-and-Housing-Census.
Census of India, (2011). Census of India. Available at: http://censusindia.gov.in.
Christova, C. (1992). Seismicity depth pattern, seismic energy and b value depth variation in the Hellenic Wadati-Benioff zone. Phys. Earth Planet. Interiors 72 (1-2), 38–48. doi:10.1016/0031-9201(92)90047-Y
Cornell, C. A. (1968). Engineering seismic risk analysis. Bull. Seismol. Soc. Am. 58 (5), 1583–1606. doi:10.1785/BSSA0580051583
Dasgupta, S., Pande, P., Ganguly, D., Iqbal, Z., Sanyal, K., Venaktraman, N. V., et al. (2000). Seismotectonic atlas of India and its environs. Geological survey of India, 59. Calcutta, India: Special Publication, 87.
Dunn, J. A., Auden, J. B., Ghosh, A. M. N., and Wadia, D. N. (1939). The Bihar–Nepal earthquake of 1934. Memoirs India Geol. Surv. 73.
Esteva, L. (1970). “Seismic risk and seismic design decisions,” in Seismic design for nuclear power plants (Cambridge, MA, USA: Massachusetts Institute of Technology Press), 142–182.
FEMA (2000). Prestandard and commentary for the seismic rehabilitation of buildings, 356. Washington D.C: Federal Emergency Management Agency.
Frankel, A. (1995). Mapping seismic hazard in the central and eastern United States. Seismol. Res. Lett. 66 (4), 8–21. doi:10.1785/gssrl.66.4.8
Freeman, S. A., Nicoletti, J. P., and Tyrell, J. V. (1975). “Evaluations of existing buildings for seismic risk—A case study of Puget Sound Naval Shipyard, Bremerton, Washington,” in Proceedings of U.S. National Conference on Earthquake Engineering (IEEE), 113–122.
Freeman, S. A. (1978). Prediction of response of concrete buildings to severe earthquake motion, 55. American Concrete Institute, Detroit, Special Publication, 589–605.
Ganapathy, G. P. (2011). First level seismic microzonation map of Chennai city – A GIS approach. Nat. Hazards Earth Syst. Sci. 11 (2), 549–559. doi:10.5194/nhess-11-549-2011
Grünthal, G., and Wahlström, R. (2006). New generation of probabilistic seismic hazard assessment for the area Cologne/Aachen considering the uncertainties of the input data. Nat. Hazards 38 (1-2), 159–176. doi:10.1007/s11069-005-8611-7
Hashash, Y. M. A., Musgrove, M. I., Harmon, J. A., Ilhan, O., Xing, G., Numanoglu, O., et al. (2020). DEEPSOIL 7, user manual. Urbana, IL: Board of Trustees of University of Illinois at Urbana-Champaign.
Hemasinghe, H., Rangali, R. S., Deshapriya, N. L., and Samarakoon, L. (2018). Landslide susceptibility mapping using logistic regression model (a case study in Badulla District, Sri Lanka). Procedia Eng. 212, 1046–1053. doi:10.1016/j.proeng.2018.01.135
Idriss, I. M., and Boulanger, R. W. (2006). Semi-empirical procedures for evaluating liquefaction potential during earthquakes. Soil Dynamics Earthquake Eng. 26 (2–4), 115–130. doi:10.1016/j.soildyn.2004.11.023
Idriss, I. M., and Boulanger, R. W. (2010). SPT-based liquefaction triggering procedures. Davis, California: Center for Geotechnical Modeling, Department of Civil and Environmental Engineering, University of California (Report No. UCD/CGM-10-02).
IBC (2009). International building code. Country Club Hills, Illinois: International Code Council, Inc.
Idriss, I. M., and Seed, H. B. (1968). Seismic response of horizontal soil layers. J. Soil Mech. Found. Div. 94 (4), 1003–1031. doi:10.1061/JSFEAQ.0001163
Idriss, I. M., and Sun, J. I. (1992). User’s manual for SHAKE91. Davis: Center for Geotechnical Modeling, Department of Civil Engineering, University of California.
IS-2131 (1963). Indian standard method for standard penetration test for soils. New Delhi: Bureau of Indian Standards.
IS-2131 (1981). Method for standard penetration test for soils. New Delhi: Bureau of Indian Standards.
Iwasaki, T., Tatsuoka, F., Tokida, K. I., and Yasuda, S. (1978). “A practical method for assessing soil liquefaction potential based on case studies at various sites in Japan,” in Proc. Second Int. Conf. Microzonation Safer Construction Research Application 1978 (IEEE), 885–896.
Iwasaki, T., Tokida, K. I., Tatsuoka, F., Watanabe, S., Yasuda, S., and Sato, H. (1982). “Microzonation for soil liquefaction potential using simplified methods,” in Proceedings of the 3rd international conference on microzonation 1982, June, Seattle (IEEE), 1310–1330.
Iyengar, R. N., and Ghosh, S. (2004). Microzonation of earthquake hazard in greater Delhi area. Curr. Sci. 87 (9), 1193–1202.
Karra, K., Kontgis, C., Statman-Weil, Z., Mazzariello, J. C., Mathis, M., and Brumby, S. P. (2021). “Global land use/land cover with Sentinel 2 and deep learning,” in 2021 IEEE International Geoscience and Remote Sensing Symposium IGARSS (IEEE), 4704–4707.
Lee, D. H., Ku, C. S., and Yuan, H. (2004). A study of the liquefaction risk potential at Yuanlin, Taiwan. Eng. Geol. 71 (1-2), 97–117. doi:10.1016/S0013-7952(03)00128-5
Maiti, S. K., Nath, S. K., Adhikari, M. D., Srivastava, N., Sengupta, P., and Gupta, A. K. (2017). Probabilistic seismic hazard model of West Bengal, India. J. Earthq. Eng. 21 (7), 1113–1157. doi:10.1080/13632469.2016.1210054
McGuire, R. K. (1976). FORTRAN computer program for seismic risk analysis. U. S. Geol. Surv. doi:10.3133/ofr7667
Middlemiss, C. S. (1885). Report on the bengal earthquake of july 14, 1885. Rec. Geol. Surv. India 18 (4), 200–221.
Mitra, S., Bhattacharya, S. N., and Nath, S. K. (2008). Crustal structure of the Western Bengal Basin from joint analysis of teleseismic receiver functions and Rayleigh wave dispersion. Bull. Seismol. Soc. Am. 98, 2715–2723. doi:10.1785/0120080141
Molina, S., Lang, D. H., and Lindholm, C. D. (2014). SELENA v6.0: User and technical manual v6.0, report no. 14-003, kjeller (Norway) – alicante (Spain), 102.
Morgan, J. P., and McIntire, W. G. (1959). Quaternary geology of the Bengal Basin, East Pakistan and India. Geol. Soc. Am. Bull. 70 (3), 319–342. doi:10.1130/0016-7606(1959)70[319:QGOTBB]2.0.CO;2
Nakamura, Y. (2000). “Clear identification of fundamental idea of Nakamura’s technique and its applications,” in Proceedings of the 12th world conference on earthquake engineering, New Zealand, Auckland.
Nath, S., Ghatak, C., Biswas, A., and Srivastava, A. (2022). Liquefaction susceptibility mapping in West Bengal with emphasis on its capital city Kolkata under the impact of a few great earthquakes triggered from the Himalaya and northeast India. J. Rehabilitation Civ. Eng. 10 (4), 56–96. doi:10.22075/JRCE.2021.24034.1533
Nath, S. K., Adhikari, M. D., Devaraj, N., and Maiti, S. K. (2015). Seismic vulnerability and risk assessment of Kolkata City, India. Nat. Hazards Earth Syst. Sci. 15 (6), 1103–1121. doi:10.5194/nhess-15-1103-2015
Nath, S. K., Adhikari, M. D., Maiti, S. K., Devaraj, N., Srivastava, N., and Mohapatra, L. D. (2014). Earthquake scenario in West Bengal with emphasis on seismic hazard microzonation of the city of Kolkata, India. Nat. Hazards Earth Syst. Sci. 14, 2549–2575. doi:10.5194/nhess-14-2549-2014
Nath, S. K., Ghatak, C., Sengupta, A., Biswas, A., Madan, J., and Srivastava, A. (2021a). “Regional–local hybrid seismic hazard and disaster modeling of the five tectonic province ensemble consisting of westcentral Himalaya to Northeast India,” in Latest developments in geotechnical earthquake engineering and soil dynamics. Editors T. Sitharam, R. Jakka, and S. Kolathayar (Singapore: Springer Transactions in Civil and Environmental Engineering. Springer), 14, 307–358. doi:10.1007/978-981-16-1468-2_14
Nath, S. K., Mandal, S., Adhikari, M. D., and Maiti, S. K. (2017). A unified earthquake catalogue for south asia covering the period 1900-2014. Nat. Hazards 85 (3), 1787–1810. doi:10.1007/s11069-016-2665-6
Nath, S. K. (2017). Probabilistic seismic hazard atlas of 40 cities in India published by geoscience division, Ministry of earth Sciences (MoES), govt. Of India. New Delhi: © MoES, Govt. of India, 457p.
Nath, S. K. (2004). Seismic hazard mapping and microzonation in the Sikkim Himalaya through GIS integration of site effects and strong ground motion attributes. Nat. Hazards 31 (2), 319–342. doi:10.1023/B:NHAZ.0000023355.18619.0c
Nath, S. K. (2016). Seismic hazard vulnerability and risk microzonation atlas of Kolkata. Open File Report. New Delhi: Geoscience Division, Ministry of Earth Sciences, Government of India.
Nath, S. K., Sengupta, A., and Srivastava, A. (2021b). Remote sensing GIS-based landslide susceptibility & risk modeling in Darjeeling–Sikkim Himalaya together with FEM-based slope stability analysis of the terrain. Nat. Hazards (Dordr). 108 (3), 3271–3304. doi:10.1007/s11069-021-04823-5
Nath, S. K., Srivastava, N., Ghatak, C., Adhikari, M. D., Ghosh, A., and Sinha Ray, S. P. (2018). Earthquake induced liquefaction hazard, probability and risk assessment in the city of Kolkata, India: Its historical perspective and deterministic scenario. J. Seismol. 22 (1), 35–68. doi:10.1007/s10950-017-9691-z
Nath, S. K., and Thingbaijam, K. K. S. (2012). Probabilistic seismic hazard assessment of India. Seismol. Res. Lett. 83 (1), 135–149. doi:10.1785/gssrl.83.1.135
Nath, S. K., Thingbaijam, K. K. S., Raj, A., Shukla, K., Pal, I., Nandy, D. R., et al. (2007). Microzonation of Guwahati city. India: Guwahati: International workshop on earthquake hazard and mitigation.
NIBS (2002). HAZUS99 - earthquake loss estimation methodology, technical manual. Washington D.C: FEMA, Federal Emergency Management Agency, National Institute of Building Sciences NIBS, 325.
Oldham, R. D. (1899). Report of the great earthquake of 12th June, 1897. Calcutta: Memoirs India Geol. Surv., Memoirs of the Geological Society of India, 29.
Pancholi, V., Bhatt, N., Singh, P., and Chopra, S. (2022). Multi-criteria approach using GIS for macro-level seismic hazard assessment of Kachchh Rift Basin, Gujarat, Western India–First step towards earthquake disaster mitigation. J. Earth Syst. Sci. 131 (1), 3–20. doi:10.1007/s12040-021-01744-6
Park, C. B., Miller, R. D., and Xia, J. (1999). Multichannel analysis of surface waves. Geophysics 64 (3), 800–808. doi:10.1190/1.1444590
Prajapati, S. K., Dadhich, H. K., and Chopra, S. (2017). Isoseismal map of the 2015 Nepal earthquake and its relationships with ground-motion parameters, distance and magnitude. J. Asian Earth Sci. 133, 24–37. doi:10.1016/j.jseaes.2016.07.013
Rahman, M., Ahmed, S., and Imam, M. O. (2020). Rational way of estimating liquefaction severity: An implication for chattogram, the port city of Bangladesh. Geotech. Geol. Eng. 38 (2), 2359–2375. doi:10.1007/s10706-019-01134-2
Rahman, M., Siddiqua, S., and Kamal, A. S. M. (2019). Geology and topography based Vs30 map for Sylhet City of Bangladesh. Bull. Eng. Geol. Environ. 78 (5), 3069–3083. doi:10.1007/s10064-018-1331-5
Rahman, M. Z., Kamal, A. M., and Siddiqua, S. (2018). Near-surface shear wave velocity estimation and Vs30 mapping for Dhaka City, Bangladesh. Nat. Hazards (Dordr). 92 (3), 1687–1715. doi:10.1007/s11069-018-3266-3
Rahman, M. Z., Siddiqua, S., and Kamal, A. M. (2015). Liquefaction hazard mapping by liquefaction potential index for Dhaka City, Bangladesh. Eng. Geol. 188, 137–147. doi:10.1016/j.enggeo.2015.01.012
Saaty, T. L. (1980). The analytic Hierarchy process. New York, United States: McGraw-Hill International.
Sarkar, G., Siddiqua, S., Banik, R., and Rokonuzzaman, M. (2015). Prediction of soil type and standard penetration test (SPT) value in Khulna City, Bangladesh using general regression neural network. Q. J. Eng. Geol. Hydrogeology 48 (3-4), 190–203. doi:10.1144/qjegh2014-108
Scherbaum, F., Delavaud, E., and Riggelsen, C. (2009). Model selection in seismic hazard analysis: An information-theoretic perspective. Bull. Seismol. Soc. Am. 99 (6), 3234–3247. doi:10.1785/0120080347
Seed, H. B., and Idriss, I. M. (1970). Soil moduli and damping factors for dynamic response analyses. Report No. EERC 70-10, Earthquake Engineering Research Center. Berkeley, California: University of California, 40p.
Seed, H. B., and Idriss, I. M. (1971). Simplified procedure for evaluating soil liquefaction potential. J. Soil Mech. Found. Div. 97 (9), 1249–1273. doi:10.1061/JSFEAQ.0001662
Seed, H. B., Tokimatsu, K., Harder, L. F., and Chung, R. M. (1985). Influence of SPT procedures in soil liquefaction resistance evaluations. J. Geotechnical Geoenvironmental Eng. 111 (12), 1425–1445. doi:10.1061/(ASCE)0733-9410(1985)111:12(1425)
Shibata, T. (1970). Analysis of liquefaction of saturated sand during cyclic loading. Disaster Prev. Res. Inst. Bull. 13, 563–570.
Sun, C. G., Kim, D. S., and Chung, C. K. (2005). Geologic site conditions and site coefficients for estimating earthquake ground motions in the inland areas of Korea. Eng. Geol. 81 (4), 446–469. doi:10.1016/j.enggeo.2005.08.002
Sun, C. G., Kim, H. S., and Cho, H. I. (2018). Geo-proxy-based site classification for regional zonation of seismic site effects in South Korea. Appl. Sci. 8 (2), 314. doi:10.3390/app8020314
Tsapanos, T. M. (2000). The depth distribution of seismicity parameters estimated for the South American area. Earth Planet. Sci. Lett. 180 (1-2), 103–115. doi:10.1016/S0012-821X(00)00158-8
UBC (1997). “Uniform building code,” in International conference of building officials, Whittier, CA.
Umitsu, M. (1987). Late Quaternary sedimentary environment and landform evolution in the Bengal lowland. Geogr. Rev. Jpn. Ser. B 60 (2), 164–178, doi:10.4157/grj1984b.60.164
USGS and GSB (2001). Digital geologic and geophysical data of Bangladesh. Reston, Virginia: U.S. Geological Survey Open-File. Report 97-470-H. doi:10.3133/ofr97470H
Wald, D. J., Quitoriano, V., Heaton, T. H., and Kanamori, H. (1999). Relationships between peak ground acceleration, peak ground velocity and modified Mercalli intensity in California. Earthq. Spectra 15, 557–564. doi:10.1193/1.1586058
Weiss, A. (2001). Topographic position and landforms analysis, in Poster presentation, ESRI user conference, 200. San Diego, CA. Available at: http://www.jennessent.com/downloads/TPI-poster-TNC_18x22.pdf.
WHE-PAGER (2008). WHE-PAGER Project: A new initiative in estimating global building inventory and its seismic vulnerability in Proceedings of the 14th World Conference on Earthquake Engineering, Beijing, China, 12–17.
Worden, C. B., Gerstenberger, M. C., Rhoades, D. A., and Wald, D. J. (2012). Probabilistic relationships between ground‐motion parameters and modified Mercalli intensity in California. Bull. Seismol. Soc. Am. 102 (1), 204–221. doi:10.1785/0120110156
Xia, J., Miller, R. D., and Park, C. B. (1999). Estimation of near-surface shear-wave velocity by inversion of Rayleigh waves. Geophysics 64, 691–700. doi:10.1190/1.1444578
Youd, T. L., Idriss, I. M., Andrus, R. D., Arango, I., Castro, G., Christian, J. T., et al. (2001). Liquefaction resistance of soils: Summary report from the 1996 NCEER and 1998 NCEER/NSF workshops on evaluation of liquefaction resistance of soils, ASCE. J. Geotech. Geoenviron. Engg. 127, 817–833. doi:10.1061/(ASCE)1090-0241(2001)127:4(297)
Keywords: Bengal Basin, site characterization, surface-consistent probabilistic PGA, SELENA, seismic microzonation, liquefaction hazard, Mymensingh, Dhanbad
Citation: Nath SK, Biswas A, Srivastava A, Sengupta A, Ghatak C and Madan J (2022) Site-specific seismic hazard and risk potential of Bengal Basin with emphasis on holistic seismic hazard microzonation and its structural impact assessment in the cities of Dhanbad and Mymensingh. Front. Earth Sci. 10:959108. doi: 10.3389/feart.2022.959108
Received: 01 June 2022; Accepted: 20 July 2022;
Published: 30 August 2022.
Edited by:
Brijesh K. Bansal, Indian Institute of Technology Delhi, IndiaReviewed by:
Ravi Jakka, Indian Institute of Technology Roorkee, IndiaCopyright © 2022 Nath, Biswas, Srivastava, Sengupta, Ghatak and Madan. This is an open-access article distributed under the terms of the Creative Commons Attribution License (CC BY). The use, distribution or reproduction in other forums is permitted, provided the original author(s) and the copyright owner(s) are credited and that the original publication in this journal is cited, in accordance with accepted academic practice. No use, distribution or reproduction is permitted which does not comply with these terms.
*Correspondence: Sankar Kumar Nath, bmF0aEBnZy5paXRrZ3AuYWMuaW4=
Disclaimer: All claims expressed in this article are solely those of the authors and do not necessarily represent those of their affiliated organizations, or those of the publisher, the editors and the reviewers. Any product that may be evaluated in this article or claim that may be made by its manufacturer is not guaranteed or endorsed by the publisher.
Research integrity at Frontiers
Learn more about the work of our research integrity team to safeguard the quality of each article we publish.