 Gerhard Heij
94% of researchers rate our articles as excellent or good
Learn more about the work of our research integrity team to safeguard the quality of each article we publish.
Find out more
ORIGINAL RESEARCH article
Front. Earth Sci., 31 August 2022
Sec. Geomagnetism and Paleomagnetism
Volume 10 - 2022 | https://doi.org/10.3389/feart.2022.944220
This article is part of the Research TopicRemagnetization and DiagenesisView all 5 articles
This paper presents an integrated paleomagnetic, rock magnetic and geochemical study of the Devonian Antrim shale in the Michigan Basin. Specimens were obtained from two unoriented vertical cores (named St. Chester and Krocker) and sampled relative to a master specimen orientation line. Alternating field (AF) demagnetization experiments isolated a lower coercivity component (LC) from 0 to ∼60 mT in the Krocker core and corresponds to a Jurassic (170 Ma ± 25) magnetization. Higher coercivity components (HC) in the Krocker core are unblocked from ∼60 to 120 mT and unlike LC components, occasionally exhibit stable unblocking temperature ranges (e.g., 150–450°C) and higher AF demagnetization ranges (∼60–120 mT). HC components in the Krocker core are unique to certain members within the Antrim shale with a poorly resolved Middle Permian/Late Triassic magnetization in the Paxton member and Late Pennsylvanian (305 Ma ± 10) component in the Norwood. The St. Chester well exhibited a LC component among all specimens with a slightly older (205 Ma ± 10) than the Krocker core. Rock magnetic parameters indicate the magnetization resides in PSD/SD magnetite in both HC and LC components. Overall, the magnetizations are interpreted to be chemical remanent magnetizations (CRMs) with the HC component residing in SD magnetite which formed during hydrothermal activity in both cores. The LC component likely resides in PSD/MD magnetite and is interpreted to have formed in response to fluid flow associated with tectonic uplift and/or hydrocarbon migration. Petrographic observations indicate mineral assemblages consistent with hydrothermal mineralization (e.g., baroque dolomite). Depleted δ18O data from carbonate fractures are consistent with a hydrothermal fluid magnetization mechanism. Consistent anisotropy of magnetic susceptibility (AMS) lineations indicates either a long-lived paleocurrent direction or far-field tectonic shortening originating from the neighboring Acadian orogeny. Inorganic geochemistry indicate that paramagnetic Fe-rich clays carry the AMS signal. Lastly, an evaluation of the origin of chalcopyrite and monazite is performed through provenance analysis. These minerals are attributed to hydrothermal mineralization however, strong evidence suggests that some fraction of these grains were sourced from the Michigan Peninsula.
Paleomagnetic studies of Devonian shales in North America have provided key insights regarding the timing of paleofluid activity in sedimentary basins (e.g., Dennie et al., 2012; Manning and Elmore, 2015; Roberts and Elmore, 2017, Roberts et al., 2019; Steullet et al., 2019). The Antrim Formation represents one such shale deposited within the vast eastern interior seaway which separated the North American craton. However, unlike the Woodford or Marcellus shales, the Antrim resides in an intracratonic basin which underwent comparatively less intense tectonic episodes. Major regional tectonic events in the Michigan basin are limited to pulses of late Paleozoic subsidence, hydrothermal activity related to reactivation of the eastern limb of the midcontinent rift and post-Permian uplift (Howell and van der Pluijm, 1990; Crowley, 1991; Apotria et al., 1994; Girard and Barnes, 1995; Ma et al., 2009). The thermal maturity of the Antrim also provides clues to its burial history because, burial alone does not account for vitrinite reflectance values observed and therefore must indicate one or some combination of processes including tectonic uplift, elevated geothermal gradients or hydrothermal fluids (Crowley, 1991; Apotria et al., 1994; Luczaj et al., 2006). Petrographic and geochemical evidence of hydrothermal activity has been reported in underlying rocks such as Ordovician carbonates and middle Devonian dolomites (Coniglio et al., 1994; Winter et al., 1995; Luczaj et al., 2006), however, the of hydrothermal fluid alteration in the Antrim is still an open question. Integrated paleomagnetic investigations buttressed by geochemical and observational evidence are well suited for determining the timing of hydrothermal activity and can potentially shed light on whether hydrothermal activity extended to the Antrim. Constraining the extent of hydrothermal activity into the Antrim is important for several reasons. For example, hydrothermal fluids can impact catagenesis of organic material (e.g., Simoneit et al., 1992) and may constructively or destructively influence reservoir properties (e.g., Saller and Dickson, 2011). Understanding the extent and degree to which hydrothermal alteration impacted the Antrim may be important for future development of unconventional resources in the basin.
In addition to testing for hydrothermal activity, the two cores utilized in this study offer a unique opportunity to investigate the differences, if any, between thermogenic and biogenically mediated (i.e., bacterial methanogenesis) natural gas formation on magnetic properties and diagenesis. Gas production in the northern St. Chester well is dominated by biogenically produced gas, evidenced by chemical and isotopic compositions of produced water (e.g., Martini et al., 1996) whereas the deeper, Krocker well from the middle of the basin is characterized by predominantly thermogenic gas which is self-sourced or migrated from underlying Silurian shales (East et al., 2012). According to Martini et al. (1998) the origin of biogenic gas stems from episodes of Pleistocene glaciation over northern Michigan where the melting of ice sheets provided hydraulic head that enhanced dilation of pre-existing fractures, influx of meteoric water and facilitation of microbial methanogenesis. Such conditions would allow for magnetite precipitation via magnetotatic bacterial organisms and hence could be recorded by paleomagnetic and rock magnetic methods (e.g., Chang et al., 1987; Moskowitz et al., 1993).
Lastly, there are unresolved questions regarding the role of paleostresses operating in the Michigan Basin. For example, fractures in the Antrim have been attributed to natural hydraulic fracturing (Apotria et al., 1994) and far-field tectonic stresses (Craddock and van der Pluijm, 1989; Versical, 1991). A petrofabric study can serve as an independent means to evaluate which hypothesis is more likely. Room temperature anisotropy of magnetic susceptibility (AMS) are well-established petrofabric tools that have been used to successfully detect tectonic shortening and these tools are particularly sensitive to subtle strain recorded by clay-rich sediments (e.g., Pares, 2004; Pares and van der Pluijm, 2004). If consistent AMS lineations are present, it could provide support for a tectonically driven fracture network in the Antrim Shale.
The Michigan Basin is an oval, yoked intracratonic basin occupying an area of over 200,000 km2 (e.g., Gutschick, 1987) (Figure 1). The basin is underlain by the eastern segment of the midcontinent rift system (MCRS) which formed during the Proterozoic. The incipient development of the Michigan Basin is attributed to fault-controlled subsidence followed by thermal subsidence (Klein and Hsui, 1987). During the late Cambrian, minor subsidence occurred due to extension of the Reelfoot rift south of the Michigan basin (Sleep et al., 1980). Thereafter, episodic subsidence inferred from stratal geometries in the Michigan Basin occurred first during the middle Ordovician owing to the Taconic orogeny followed by another period of subsidence related to the Acadian orogeny (Howell and Pluijm, 1990). Subsurface structural expressions such as anticlines and synclines are interpreted as shear folds that formed in response to Appalachian tectonics (Figure 1) (Prouty, 1988; Versical, 1991). These features are thought to be thick-skinned tectonic features caused by inversion of extensional structures in basement rocks during the Late Mississippian (Prouty, 1988; Versical, 1991; Curran and Hurley, 1992).
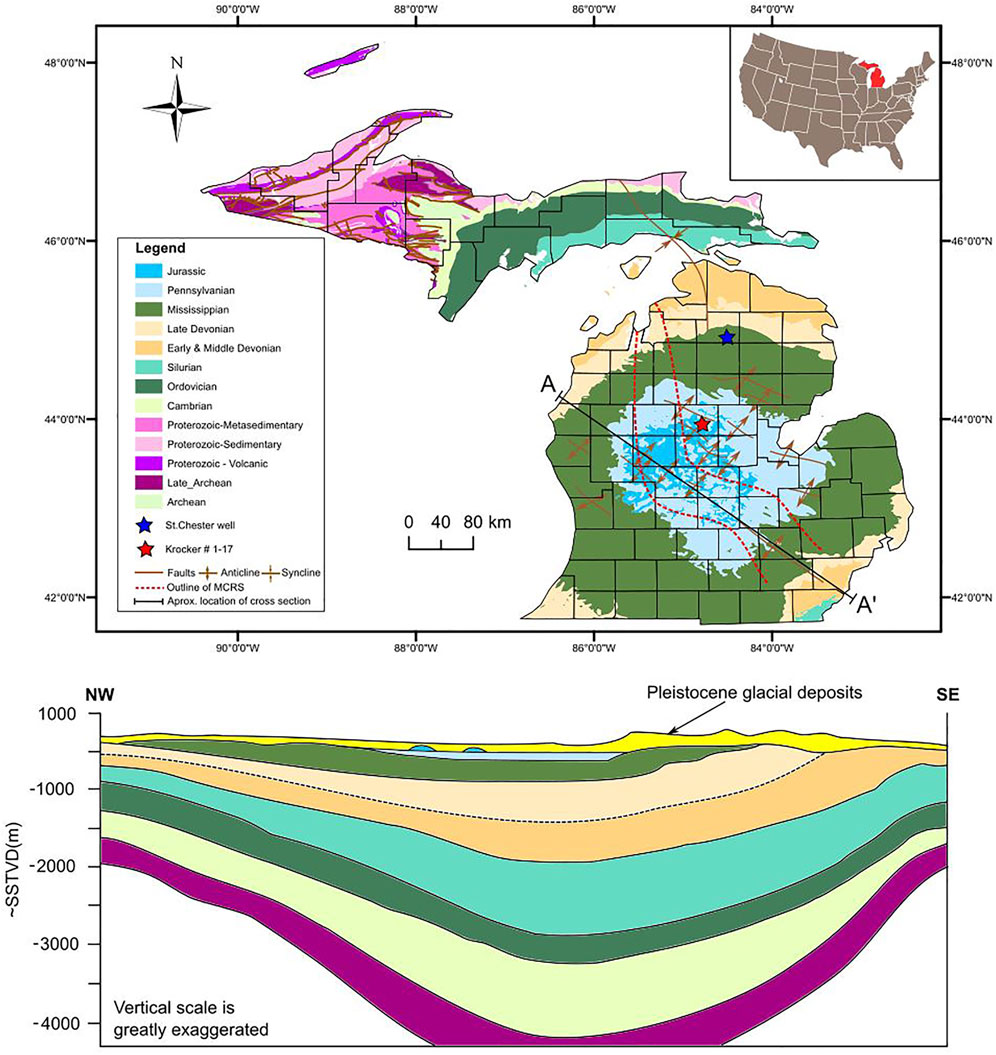
FIGURE 1. Geologic Map of Michigan modified from Dicken et al. (2004) and East et al. (2012). Schematic cross-section modified from Ma et al. (2009). Core locations denoted by stars. MCRS = Midcontinent rift system.
In terms of lithostratigraphy, Paleozoic through Mesozoic sedimentary rocks in the Michigan Basin are primarily composed of evaporites, carbonates, shale, and sandstone underneath a thick layer of Pleistocene glacial deposits. As with other intracratonic basins, strata progressively thin towards the margins of the basin and occasionally show evidence of “yoking” where strata spill over into the neighboring basin.
(Ma et al., 2009) reported depleted noble gas concentrations from deep brines of eight formations, including the Antrim which can result from boiling and steam separation in hydrothermal systems (e.g., Winckler et al., 2000). Based on these findings, (Ma et al., 2009) postulates an ancient thermal event in the basin, during which hydrothermal fluids migrated from deeper portions of the basin along major faults and fractured zones. The underlying mechanism for hydrothermal activity has been attributed to the reactivation of the MCRS during the Late Devonian–Mississippian (370–323 Ma) period based K-Ar dating of authigenic illite and fluid inclusion data from the underlying Ordovician St. Peter sandstone (Girard and Barnes, 1995). Luczaj et al. (2006) report depleted δ18O values and fluid inclusion data (homogenization temperatures from 120 to 150°C) from aqueous inclusions in saddle dolomite and calcite from the underlying Devonain Dundee Formation that is consistent with precipitation from hydrothermal fluids. Apatite fission track data indicate heating events culminating by the Triassic followed by cooling during the Mesozoic (Crowley, 1991). Cooling ages are interpreted to correspond to uplift and removal of Permian and Pennsylvanian sediments which presumably covered the Michigan Basin (Crowley, 1991).
The Late Devonian Antrim Formation was deposited within the eastern interior seaway which covered large swaths of the North American Craton, including the Michigan Basin (Dellapenna, 1991). As a result, the Antrim is chronostratigraphically equivalent to other Devonian black shales in North America such as those within the neighboring Appalachian and Illinois basins (Matthews, 1993). Deposition of the Antrim occurred over a ∼12 Ma period and is broadly characterized by slow, hemipelagic basinal sedimentation in predominantly anoxic waters that were punctuated by prodeltaic complexes (Gutschick and Sandberg, 1991). Gutschick and Sandberg (1991) also report turbidite complexes extending to the central part of the basin.
Multiple orthogonal natural fracture sets occur across the Antrim, particularly in the northern Michigan Basin (e.g., Budai et al., 2002). The mechanism for fracture development is attributed to either natural hydraulic fracturing owing to hydrocarbon generation or far field paleostresses imposed by the Alleghenian Orogeny (Craddock and Pluijm, 1989; Apotria et al., 1994). Burial and thermal history modeling by (Aporia et al. .,1994) suggest the Antrim shale reached its maximum burial temperature from 250 to 240 Ma after-which, uplift since the Permian brought the Antrim to its present depth.
From a lithological standpoint, the Antrim Formation broadly consists of finely laminated, organic-rich and pyritic shales (Figure 2) that are intermittently interbedded with gray and green shales and carbonate units (Gutschick and Sandberg, 1991; Martini et al., 1998; Over, 2002). The Antrim formation ranges from 30 to 180 m in thickness and is divided into three members that include the Norwood, Paxton and Lachine. The Norwood Member consists of black fissile pyritic shales with thin fossiliferous limestone beds, carbonate concretions, and cyclical greenish gray and black shales that show evidence of bioturbation (Gutschick and Sandberg, 1991) (Figures 2A,D). This member is also distinguished by its unusually high total organic carbon (TOC), which can range from 10 to 24 weight percent (Matthews, 1993). The Paxton Member is an interbedded light gray argillaceous calcareous greenish gray with significantly lower total organic carbon relative to the other members (Gutschick, 1987; Dellapena, 1991; Martini et al., 1998) (Figure 2B). Finally, the Lachine Member is a black shale punctuated by greenish-gray shales and carbonate concretions (Gutschick and Sandberg, 1991) with the Frasnian-Famennian boundary identified at its base (Figure 2C). Underlying the Antrim Formation, the Squaw Bay Formation, which forms part of the Traverse Group is a gray limestone/shaley limestone interbedded with gray and black shales. Although not, strictly part of the Antrim Formation, this unit is considered to be a transitional unit and is included in this study.
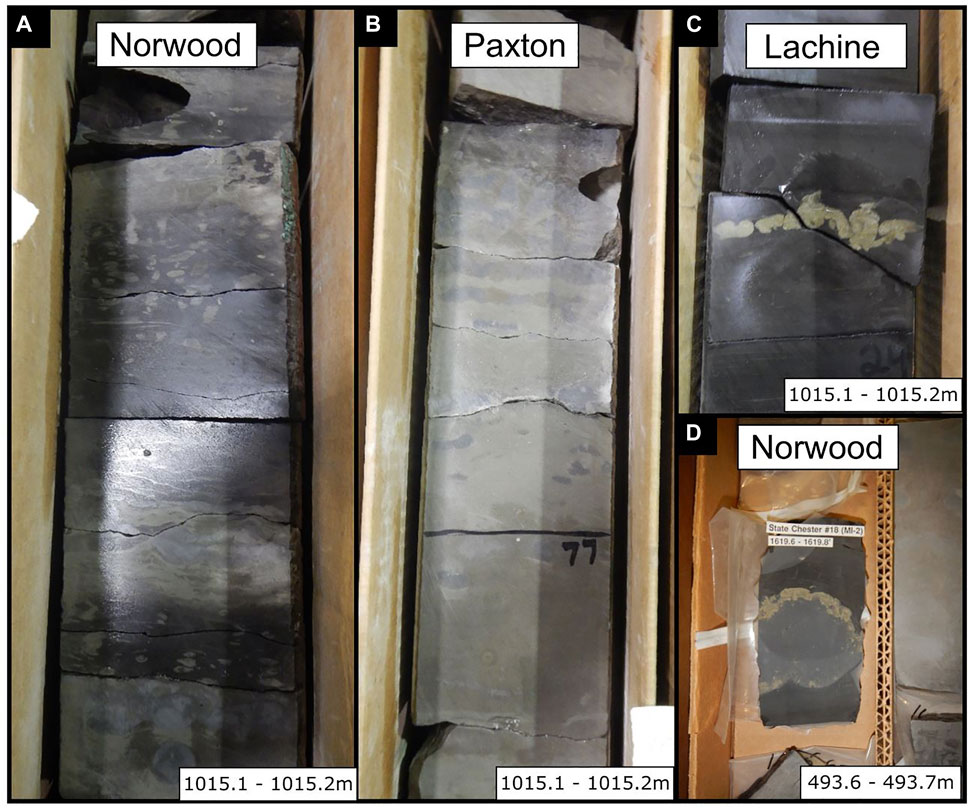
FIGURE 2. Representative lithofacies from each member in the Krocker core (A)—Norwood (B)—Paxton and (C)—Lachine. Similar facies characteristics are observed in the St. Chester core. (D) Carbonate concretion with pyritized margin in the St. Chester core.
Two vertical unoriented cores were sampled at the Michigan Geological Repository for Research and Education (MGRRE) in Kalamazoo, MI (Figure 1). Drilling reports indicate no deviation from vertical orientations in either well and dip-meter data confirm horizontal bedding. A total of 21 specimens were retrieved from the St. Chester well Norwood (n = 9, 486.8–492.7 m); Paxton (n = 6, 457.8–474 m); Squaw Bay limestone (n = 6, 509.2–510.1 m). Additional sampling from the Lachine and other members were not possible because of the overall fissile and unconsolidated of the slabbed core. For the Krocker well, a total of 116 specimens were extracted Norwood (n = 30, 1038.4–1049.7 m); Paxton (n = 57, 1021.1–0137 m); Lachine (n = 29, 994.1–1015.8 m); Squaw Bay limestone; (n = 12, 1057.7–1061.2 m). Samples were drilled from slabs relative to a master orientation line and full-length plugs were cut to standard paleomagnetic specimen dimensions (25 mm diameter × 22 mm height) that yielded two to three plugs per sampling interval. All specimens were oriented with respect to the stratigraphic up direction. Thin sections were prepared from representative specimens and mineralized carbonate-filled fractures from both cores were sampled using a microdremel for carbon and oxygen stable isotope analysis.
Paleomagnetic measurements were performed using a 2G Enterprise cryogenic magnetometer with DC superconducting quantum interference devices (SQUIDS) within a magnetically shielded room at the University of Oklahoma. One specimen from each depth interval underwent thermal demagnetization from 0 to 500°C at 50°C increments and the remaining specimens were subjected to alternating field (AF) demagnetization at field increments of 10 mT from 0 to 120 mT. Characteristic remanent magnetization (ChRM) were determined from principle component analysis (Kirsvinck, 1980) of demagnetization data plotted on Zijderveld diagrams. Maximum angular deviations (MAD) values for magnetic components were generally <10°, however, in a few instances reached up to 15°. ChRM inclinations were processed using the statistical routine proposed by Arason and Levi (2010) in order to correct for shallow-inclination bias and plotted against the expected inclinations obtained from the North American APWP (Torsvik et al., 2012).
Magnetic hysteresis measurements were performed on representative specimens using a Princeton Measurements vibrating sample magnetometer (VSM) 3,900–04 housed at Southern Illinois University Carbondale to constrain magnetic mineral type(s) and their granulometry. Specimens were subjected to an applied field ranging from 0.5 to 1T at a field step of 5.0 mT and averaging time of 500 ms. Data processing was performed using HystLab, a MATLAB based software written by Paterson et al. (2018). Standard processing of hysteresis loops included linear high-field slope corrections, loop centering and paramagnetic drift corrections (Jackson & Solheid, 2010; Paterson et al., 2018). Hysteresis parameters, which include (remanent magnetization (Mrs), saturation magnetization (Ms) and coercivity (Bc)) were computed from processed loops and data quality was assessed using the Q-factor parameter (Jackson and Solheid, 2010). Back-field demagnetization curves were measured to obtain remanent coercivity (Bcr) and were processed using the Max Unmix program (Maxbauer et al., 2016) in order to reveal the coercivity spectrums of representative specimens from each core. Saturation isothermal remanent magnetization (SIRM) were measured after applying a field of 1.5T on specimens following AF demagnetization. The ratio of SIRM and low-field magnetic susceptibility (klf) was used to detect changes in magnetic mineralogy (e.g., Stoner et al., 1996; Peters and Dekers, 2003; Maher, 2007). Stepwise thermal demagnetization of triaxial isothermal remanent magnetizations (x = 120 mT y =500 mT z = 1200 mT) imparted on AF demagnetized samples were performed in order identify magnetic carrier minerals based on unblocking temperatures of low (x), intermediate (y) and high (z) coercivity minerals.
Anisotropy of magnetic susceptibility (AMS) and klf were measured at room temperature (∼297 K) using a MFK1-FA Kappabridge magnetic susceptimeter in order to quantify magnetic petrofabrics (e.g. Rochette, 1987). Anisoft V4.2 (Chadima and Jelinek, 2009) was used to process AMS data and calculate the orientation of principal magnetic axes (K1, K2 and K3) and scalar parameters including the corrected degree of magnetic anisotropy (Pj) and shape of the AMS ellipsoid (T) (Jelinèk, 1981).
Stable carbon and oxygen isotopic signatures were obtained from carbonate-filled fractures and carbonate matrix material in both cores. Aliquots of calcite samples placed in a sealed tube with 100% phosphoric acid (H3PO4) at 50°C for 2 h (McCrea, 1950; Swart et al., 1991). Gas from this reaction was then analyzed using a Thermo Delta V Plus isotope mass spectrometer at the Univeristy of Oklahoma for both carbon and oxygen isotope abundance. The data is reported relative to the PeeDee Belemnite (PDB) and Vienna Standard Mean Ocean Water (SMOW) standards.
Hand-held X-ray fluorescence measurements were performed on each plug using the Bruker Tracer III-V HH-ED-XRF Spectrometer. Plugs were analyzed for major (Al, Si, S, Ca, Ti, and Fe) and trace (Cu, Zr, Nb) elements for 90 and 60 s respectively. Calibration of the raw X-ray spectra were performed using mudstone specific calibration reference materials compiled by Rowe et al. (2012) and data are reported in parts per million (ppm). Elemental abundances and ratios were used as proxies to infer mineralogical compositions, magnetic mineralogy, redox conditions and provenance lithotypes. Fe concentrations were used to evaluate the contribution of iron-bearing minerals to the klf, Al is used as a proxy for clay concentration, Cu as a proxy for copper-bearing minerals, Zr as a terrestrial source and textural maturity indicator, Si/Al for quartz concentration and Ti/Nb as a provenance lithotype indicator (i.e., basic vs. quartzofeldspathic) (e.g., Bonjour and Dabard, 1991; Tribovillard et al., 2006).
Petrographic observations at the University of Oklahoma were conducted using transmitted and reflected light microscopy on polished thin sections using a Zeiss AxioImager.Z1m petrographic microscope. In addition, back-scatter (BSE) and secondary electron (SE) images were collected using a FEI Quantum 250 Scanning Electron Microscope (SEM) with an attached Bruker X-ray detector for energy dispersive analysis (EDS).
AF and thermal demagnetization resulted in 30–97.7% decay of the NRM (mean = 70.0%, Stdev. = 16.3%) among Krocker specimens whereas St. Chester specimens ranged from 16 to 68.7% decay (mean = 49.8%, Stdev = 19.35%). Median destructive fields (MDF) show no relation with depth or facies in the Krocker (mean = 38.3 mT, Stdev. = 24.4 mT) or St. Chester (mean = 58.3 mT, Stdev. = 41.6 mT) specimens. A lower coercivity (LC) (0–∼60 mT) and higher coercivity (HC) component (∼60–120 mT) was revealed in all members with the exception of the Squaw Bay which only showed a stable, low coercivity component. Thermal demagnetization did not yield interpretable unblocking temperatures for the LC component and, therefore, the possibility of a thermoviscous magnetization (TVRM) cannot be excluded.
The Lachine member’s magnetizations in the Krocker are generally unblocked at low fields (0–60 mT) (n = 11). A single stable, higher temperature component unblocked from 100 to 450°C sampled at 1012.6 m (Figure 3A) in the Lachine but the remaining thermal demagnetization data for this member were unsuitable for PCA. AF demagnetization commonly produced laboratory induced, gyro-remanent magnetizations (GRM) starting at 40–60 mT. LC inclinations are fairly well constrained and show a component with moderate, down inclinations ranging from 30° to 45° (Figures 3B, 4). NRM intensities in the Lachine display little variability and range between 0.07 and 0.09 mA/m (Figure 5). Similarly, SIRM/klf ratios show little variability with values <10 kA/m (Figure 5).
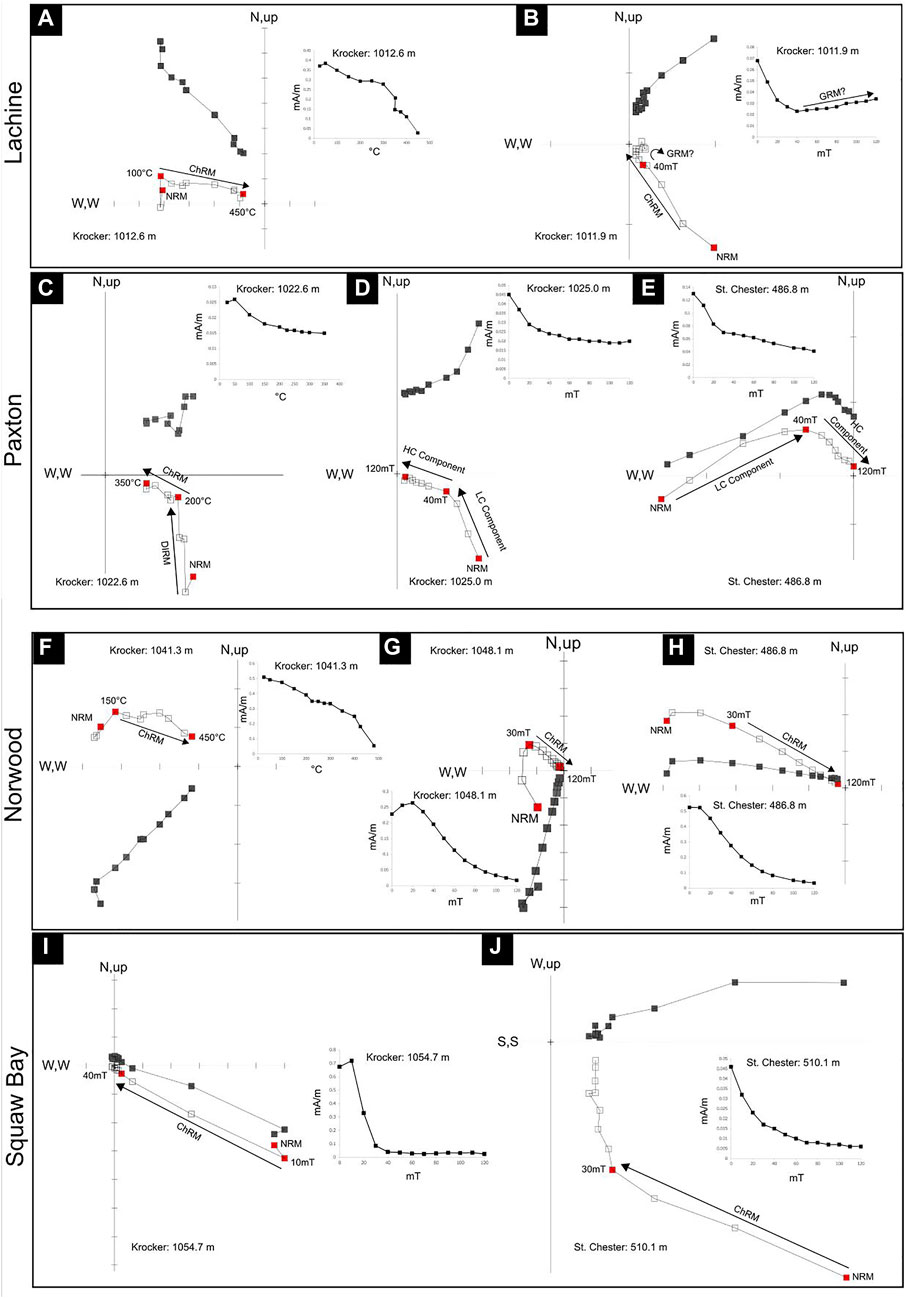
FIGURE 3. Representative Zijderveld diagrams and associated demagnetization curves from the Lachine, Paxton, Norwood and Squaw Bay (A–J). Note HC components only residing with Paxton and Norwood members. Stable LC components reside in the Lachine and Squaw Bay with the exception of one stable thermal demagnetization experiment from a Lachine specimen.
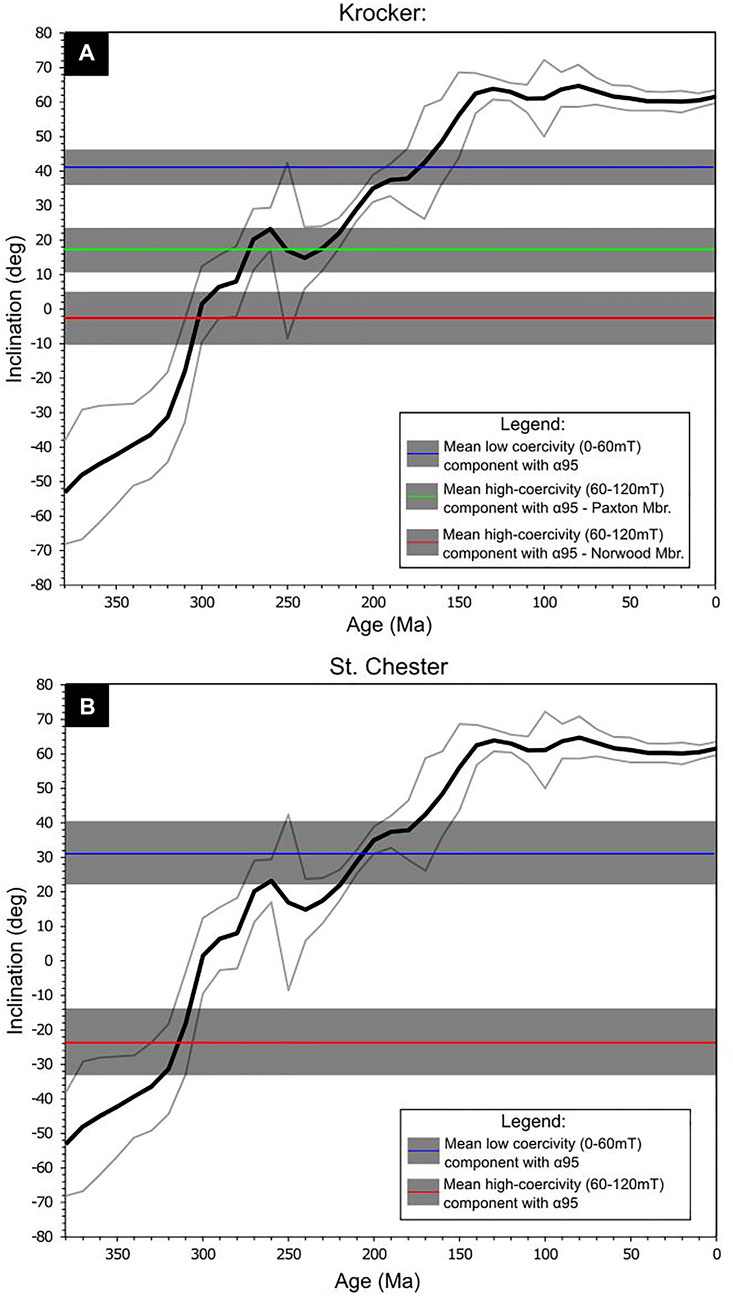
FIGURE 4. Inclination only plots derived from the North American apparent polar wander path (Table 2: Torsvik et al., 2012). (A) Mean inclinations with α95 for various components—Krocker core. (B) Mean inclinations with α95 for various components—St. Chester core. Solid black line indicates mean inclination and light-gray lines denote its α95. Core locations were used to determine the expected inclination.
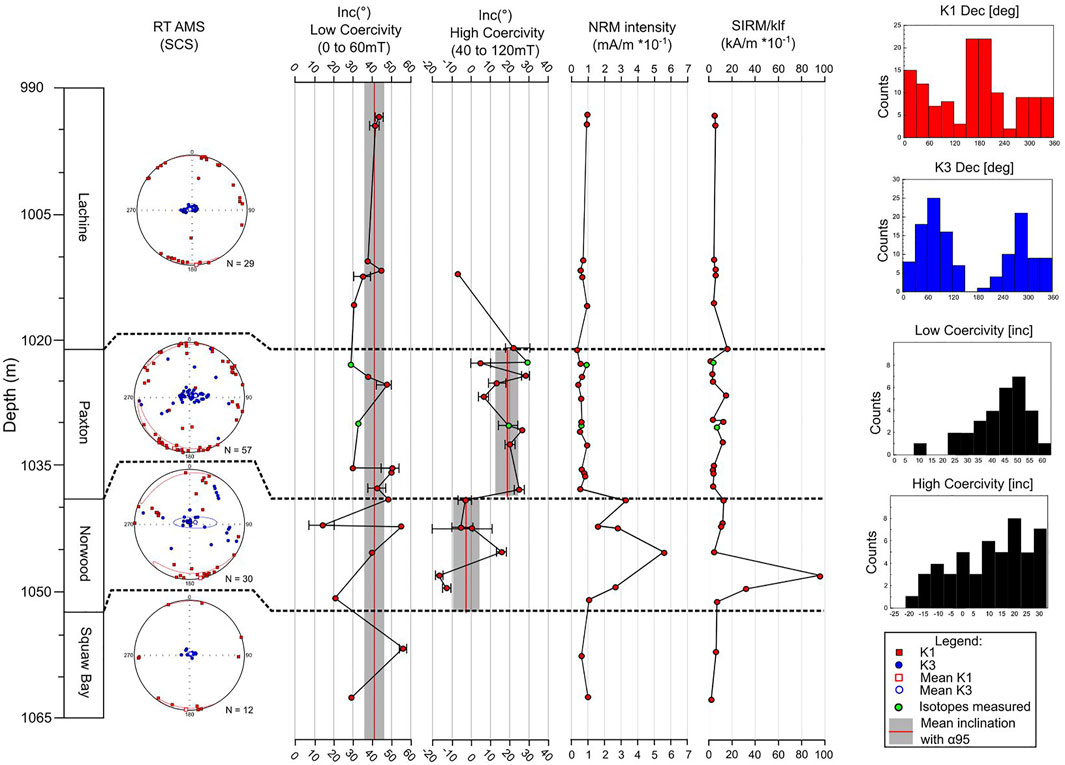
FIGURE 5. Krocker core. From left to right. AMS equal-area stereonets in specimen coordinate system and confidence ellipses for K1 and K3 tensors. LC and HC coercivity data with range of values per sampling depth indicated by error bars and mean inclination depicted by solid red line with α95. If no error bars are present, error bars were too small to plot. NRM and SIRM values, error bars are too small to be depicted. Bottom—from left to right, frequency distribution histograms for K1, K3, LC and HC components. Bottom left—legend.
The more densely sampled Paxton shows an equal contribution of LC and HC components revealed by AF demagnetization experiments (Figure 5). Like the Lachine, thermal demagnetization yielded significantly fewer stable components in the Krocker core (n = 5) and only higher temperature components could be fit with PCA (Figure 3C). Stable components were unblocked between 200 and 350°C, after which magnetic intensities rose sharply. Anomalously steep inclinations from 50 to 200°C appeared in several specimens and likely correspond to a drilling induced remanent magnetization (DIRM) (Figure 3C). The LC data from the Paxton in the Krocker core show moderate inclinations ranging from 30° to 55° (n = 12) and from 20° to 40° (n = 4) in the St. Chester core (Figures 3D,E, 5, 6). Its HC components are comparatively shallower and range from 0 to 30° (n = 26) in the Krocker core (Figures 3D, 5) and from -35° to 1° (n = 4) in the St. Chester (Figures 3E, 6). The mean inclination, statistics and age for the HC component in the Paxton (Krocker core only) are displayed in Figure 4; Table 1. The mean inclination yields a non-unique age due to multiple intersections with the predicted inclination plot (300 Ma, 270 Ma, 250 Ma, 230 Ma and 210 Ma) and is therefore, broadly referred to as a Permian/Triassic magnetization (Figure 4A). Like the Lachine, NRM intensities are typically <0.1 mAm−1 and SIRM/klf ratios range from 18 to 3 kAm−1 (mean = 8.6 kAm−1) (Figure 5).

FIGURE 6. St. Chester core. From left to right. LC coercivity and HC coercivity data with range of values per sampling depth indicated by error bars. If no error bars are present, only one specimen was measured or error bars were too small to plot. Mean inclination depicted by solid red line with α95 in gray for LC components. For mean NRM and SIRM values, error bars are too small to be depicted. Far right—AMS Equal-area stereonet. Note streaked K3 tensors.

TABLE 1. Statistics for magnetic components. SB—Squaw Bay, LC—lower coercivity component, HC—higher coercivity component.
Thermal demagnetization of Norwood specimens from the Krocker core reveal a high temperature, shallow up inclination that is unblocked from 150 to 450°C (n = 3) (Figure 3F). AF demagnetization reveals a similar HC component in both the Krocker and St. Chester wells (Figures 3G,H). Inclinations for the HC component in the Krocker core range from -11° to 18° (mean = -2.48°, n = 15) (Figure 4A; Table 1). The HC mean inclination indicate a Late Pennsylvanian to Triassic age (240-315 Ma) (Table 1; Figure 4A). LC components in the Norwood (n = 6) show significant variability relative to the other members and range from 8° to 55°. The Norwood has the highest NRM intensities in both cores (mean = 0.35 mAm−1) and NRM values are up to 5 times greater than those observed in other units (Figures 5, 6). SIRM/klf ratios are broadly consistent with other units however, outlier values exceeding 20 kAm−1 are confined to the Norwood in both cores (Figures 5, 6).
A total of 11 specimens were obtained from the Squaw Bay, (Krocker = 7; St. Chester = 4) with all specimens revealing a single, LC component during AF demagnetization with inclinations ranging from 30° to 55° (Krocker) and 16°–36° (St. Chester) (Figures 3I,J, 5, 6). Thermal demagnetization experiments produced data that could not be fit with PCA. NRM intensities and SIRM/klf ratios are consistent with values observed in the Lachine and Paxton members (Figures 5, 6).
Given the normal distribution observed in the histogram in Figure 5 of LC inclinations in the Krocker core, we interpret these magnetizations to be cogenetic. Under this assumption, mean inclinations indicate a Jurassic (170 Ma ± 25) magnetization (Table 1; Figure 4A). For the St. Chester, significantly less samples precludes the determination of a robust age, however, based on the available data, the age of the LC component is older but overlaps with the Krocker (155-275 Ma) (Table 1; Figure 4B). Considerable overlap exists between LC magnetizations in both cores and therefore it is plausible that these magnetizations are also cogenetic.
The HC components residing in the Norwood and Paxton members (n = 10) in the St. Chester also preclude the determination of a robust age for these units. It is unclear whether the Norwood has a different age than the Paxton in the St. Chester core (as observed in the Krocker well), however, the available data does indicate, on average, older magnetizations (315 Ma ±20) residing in both the Norwood and the Paxton members (Table 1; Figure 4B).
Triaxial thermal decay experiments reveals that the magnetization resides predominately in a higher coercivity mineral unblocked between 450 and 500°C in the Norwood and Paxton members (Figure 7A) than in the other units. The normalized magnetization curves, show an increase in magnetization of the subordinate lower coercivity component starting at 350°C in the Paxton and Norwood (Figure 7B). In contrast, the magnetization in the Lachine and Squaw bay, resides in a lower coercivity mineral, however, sharp rises in magnetization starting a 300–350°C preclude precise determination of an unblocking temperature (Figure 7C). The subordinate higher coercivity component in the Lachine and Squaw Bay appears to be unblocked at ∼400°C (Figure 7D). Overall, all triaxial thermal decay experiments indicate unblocking temperatures consistent with magnetite.
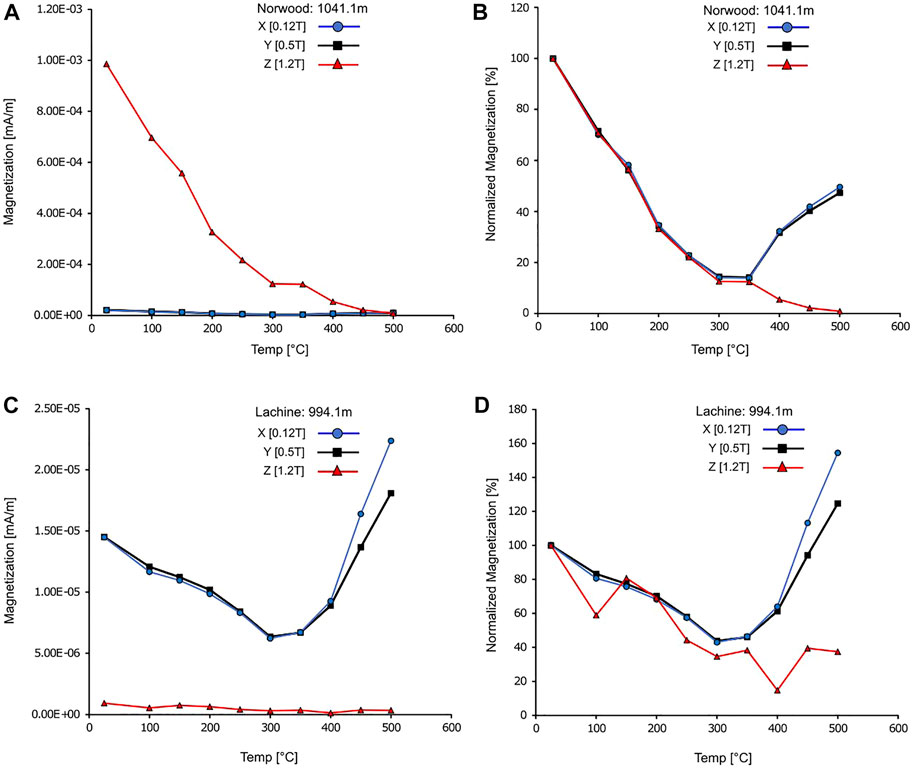
FIGURE 7. Representative triaxial thermal decay plots with low coercivity in blue, medium coercivity in black and high coercivity in red. Norwood and Paxton exhibit similar decay patterns in both cores (A–D). Similarly, Lachine and Squaw Bay display similar decay with magnetization residing mostly in low-coercivity minerals. Note sharp increase occurring at 300–350°C owing to oxidation of pyrite.
Representative hysteresis loops are displayed in Figure 8. Processed hysteresis loops have excellent Q-values ranging from 2.93 to 3.43 and suggest good symmetry between upper and lower branches. Pole drift artifacts are observed in specimens with weaker magnetizations however, the fidelity of hysteresis parameters are unaffected. Overall, two main behaviors are observed across all hysteresis loops 1) Clear wasp-waistedness in several Paxton and Norwood members (Krocker) indicative of mixed magnetic behaviors and 2) Smooth symmetrical hysteresis loops in the Lachine, Squaw Bay and St. Chester core specimens. Hysteresis parameters were plotted on a Day-plot and suggest pseudo-single-domain behavior or a mixture among Paxton and Norwood specimens (Krocker) (Figure 9A). The proximity these specimens to the SD-MD mixing curve (Dunlop 2002a and b) suggests the PSD behavior results from a mixture of SD and MD grains. Unmixing of back-field curves show that the coercivity spectrum can be modeled with two components with coercivities consistent with SD and MD magnetite (Table 2; Figure 9C). The Lachine, Squaw bay and Paxton (St. Chester) hysteresis data plot closer to the SP-SD mixing curve and are also best modeled with two components, with essentially identical coercivity spectrums (Table 2; Figure 9B).
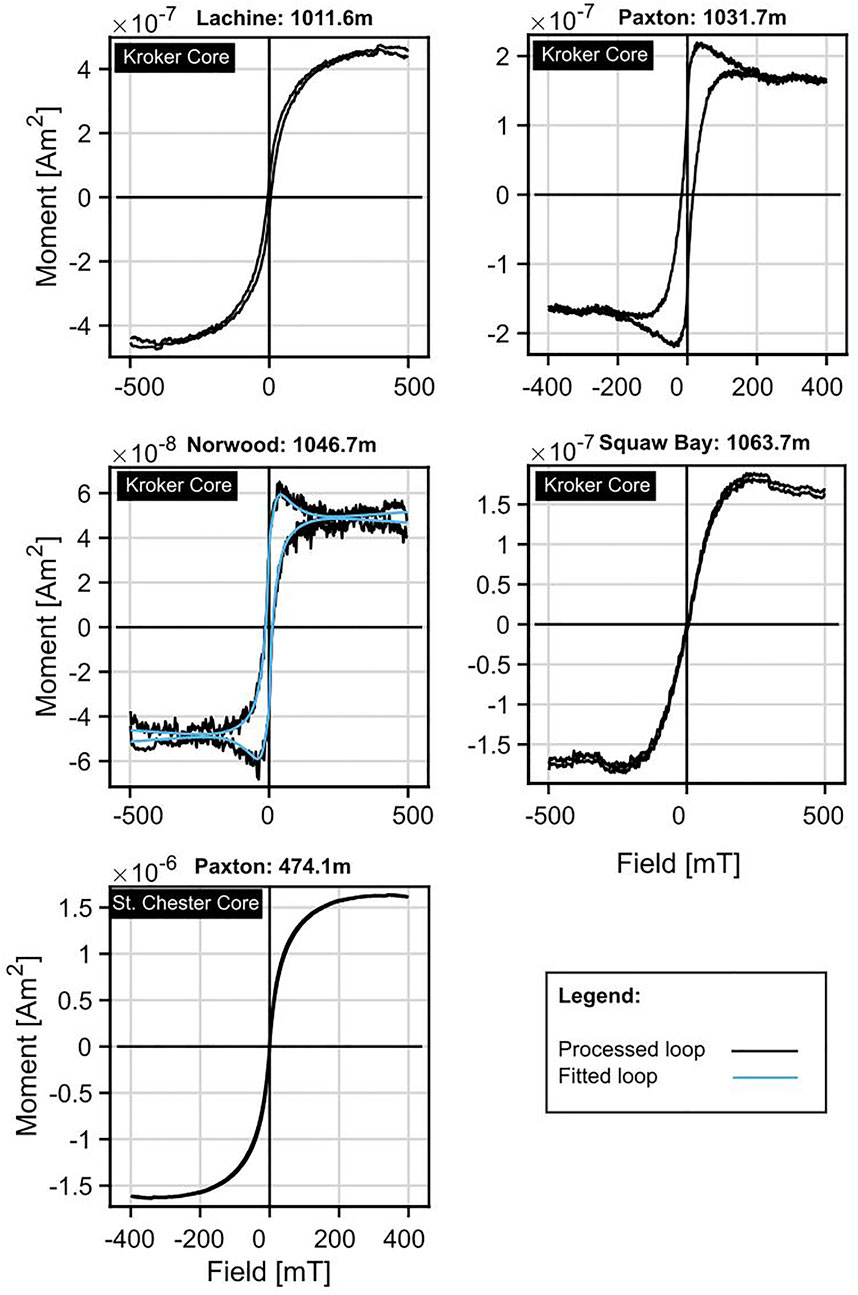
FIGURE 8. Representative processed hysteresis loops of Antrim and Squaw Bay specimens. Note wasp-waisted shapes among Norwood and Paxton specimens in the Krocker well. Pole drift artifacts occur in certain specimens however, loop closure is achieved in all specimens.
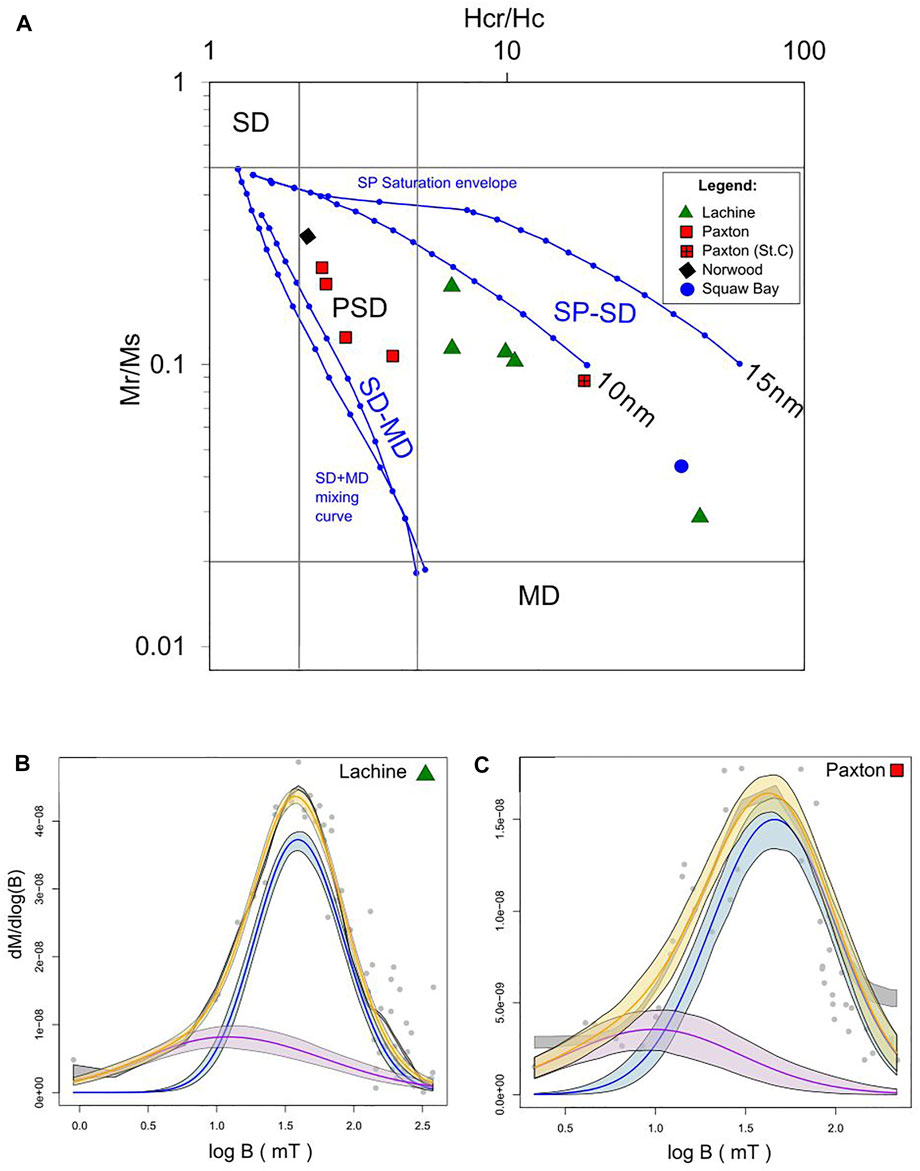
FIGURE 9. (A) Day plot of Antrim and Squaw Bay specimens. The horizontal and vertical lines delimitate the theoretical area for single (SD), pseudo-single (PSD) and multi domain (MD) magnetite grains. These lines and the mixing reference curves are from Dunlop (2002a, 2002b). (B) and (C) Representative coercivity spectrum modeling. Gray curve = spline fit of data. Blue line—high coercivity component with α95, purple line—low coercivity component, orange line—cumulative Gaussian curves (high + low coercivity components).
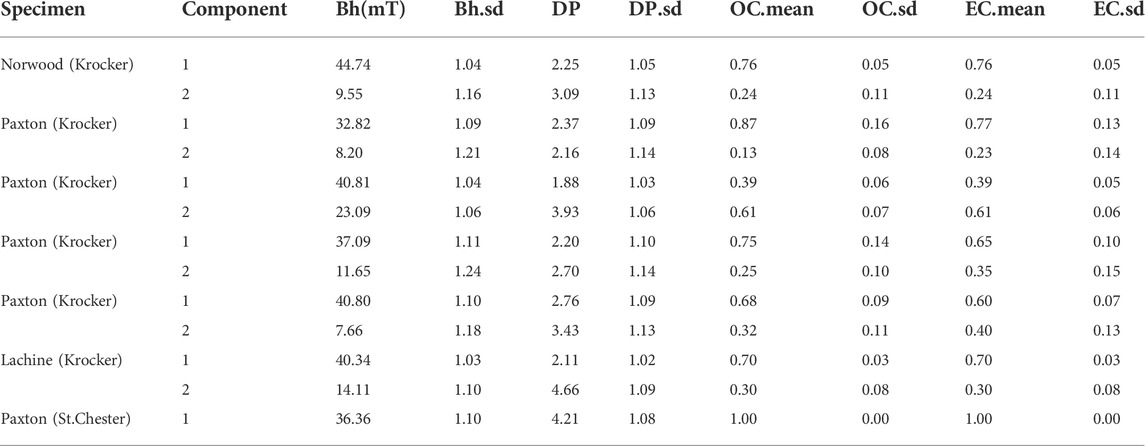
TABLE 2. Results from coercivity spectrum modeling or “unmixing”. Component 1 = HC; Component 2 = LC; Bh = mean coercivity; DP = dispersion parameter; OC = observed contribution; EC = extrapolated contribution.
A consistent lineation of K1 and near vertical K3 tensors emerges across all members in the Krocker core, although there is some disparity in the consistency of groupings between members (Figure 5). For example, K1 confidence ellipses in the Lachine, Squaw Bay, and perhaps the Paxton are better constrained than those observed in the Norwood member. Frequency-distributions for K1 declinations and K3 declinations confirm a consistent lineation, however, a clear bimodal distribution of K3 tensors emerges (Figure 5). Significantly fewer K3 tensors plot in the lower hemisphere of the equal-area (i.e. 90° and 270°) relative to data in the upper hemisphere and signifies a slight imbrication of the AMS fabric. Like the Krocker core, a consistent lineation among K1 tensors occurs in the St. Chester core (Figure 6) however, K3 tensors show a streaked distribution.
Bulk magnetic susceptibility shows a positive correlation with Fe in low S-bearing (<15,000 ppm) specimens (Figure 10A). Interestingly, S-rich (>15,000 ppm) specimens which occur predominantly in the Lachine, tend to depart from the regression line. A positive correlation also emerges between Al and klf (Figure 10B). Additionally, Fe concentrations increase concurrently with Al and klf (Figure 10B).
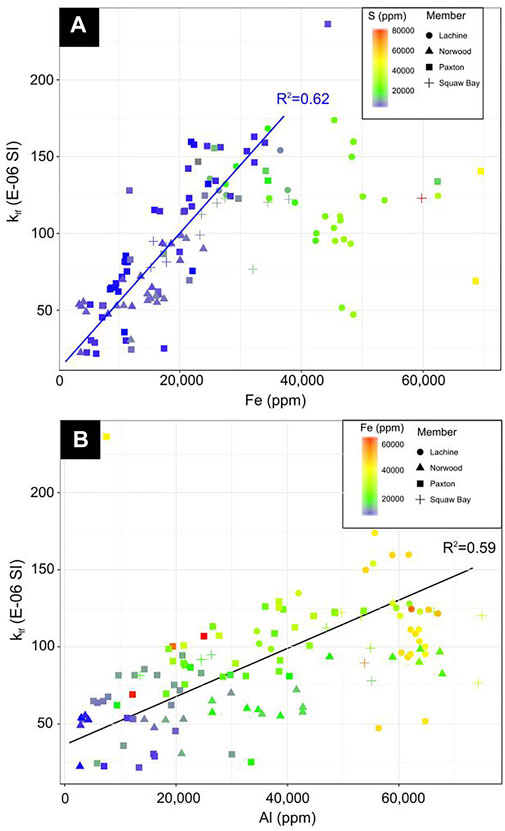
FIGURE 10. (A) Magnetic susceptibility (klf) vs. Fe cross plot with data points colored by sulfur (ppm). Magnetic susceptibility controlled by iron-bearing minerals when sulfur concentrations are low. With increasing sulfur no relationship is observed particularly in the Lachine member. Perhaps iron in the Lachine is mostly bound to pyrite and chalcopyrite which have lower magnetic susceptibilities than illite. (B) Positive correlation between Al and klf suggests clays control the magnetic susceptibility and its anisotropy.
Reflected light photomicrographs show evidence of preferential oxidation in iron sulfides occurring throughout the Antrim and the Squaw Bay (Figure 11A). Surficial oxidation of pyrite is a common artifact that forms during or after the thin section making process, however, such artifacts usually appear as splotches which do not occur in our thin sections. BSE imaging of pyrite also reveals oxidized margins and intergrown oxidized marcasite identified by its spearhead crystal habits (Figure 11B). EDS analysis confirms the presence of oxygen along with iron and sulfur in these oxidized zones and thereby suggests partial replacement by magnetite (Supplementary Material, Supplementary Figure S1). Cubic, octahedral and pyritohedral pyrite occur throughout the Antrim (Figure 11C). Closer examination reveals that the nucleus of many pyrite crystals show textures consistent with pyrite framboids (inset Figure 11C). Sphalerite is also commonly associated with dense pyrite clusters (Figure 11C). Certain pyrite crystals in the St. Chester well (Figure 11D) contain trace amounts of Ni (two to three at%) based on EDS spectra (Supplementary Material, Supplementary Figure S1). EDS spectra of clays from both cores show Fe-rich clays that likely correspond to chlorite (Figure 11E). Patches of celestine with streaks of barite cement occur in the Paxton member (Figure 11F). Euhedral quartz crystals occur within the celestine/barite cements (Figure 11F). Within the Lachine, monazite and chalcopyrite occur within carbonate grains (Figures 11G,H). These minerals are found in the matrix, unassociated with fractures and often occur together. Both rounded and euhedral chalcopyrite crystal habits are observed (Figure 11H and Supplementary Material, Supplementary Figure S2).
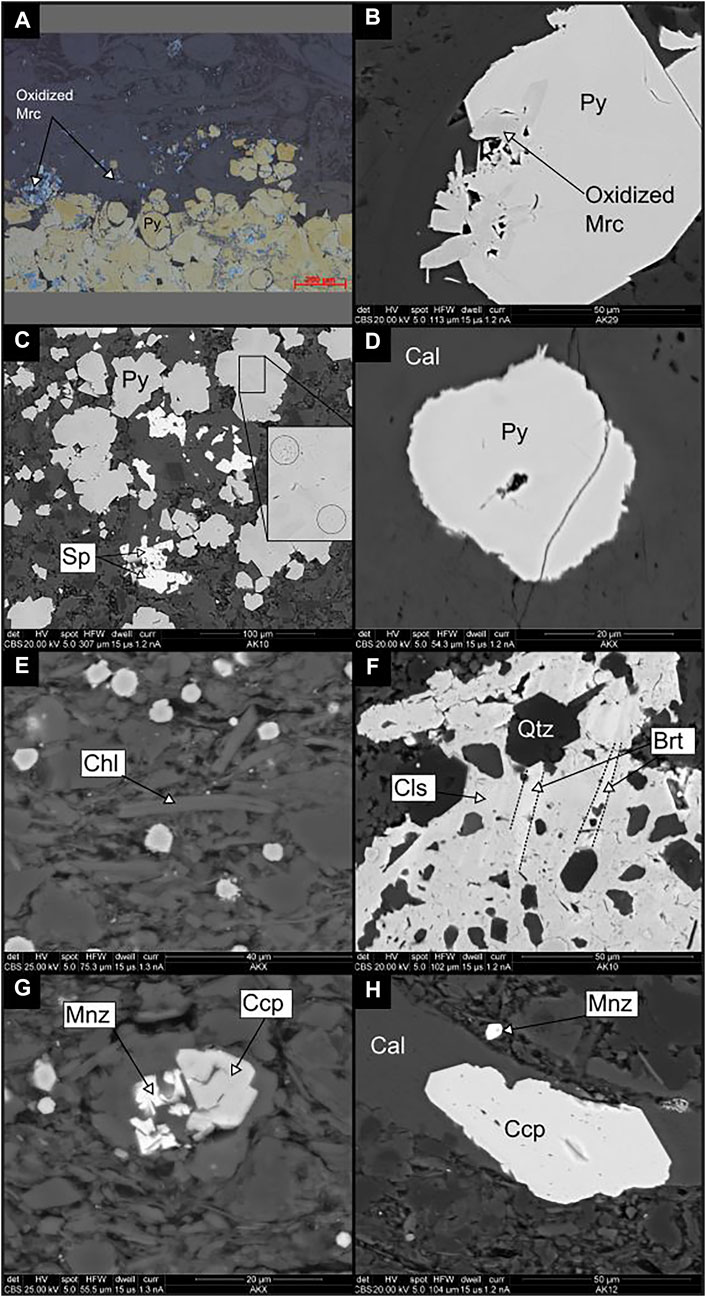
FIGURE 11. (A) Reflected light image of pyritized bed in the Paxton—Krocker core. (Py—pyrite) Note preferential oxidation of iron sulfides(B)Backscatter SEM image of cubic pyrite with oxidized intergrown marcasite in the Lachine—Krocker Core (See Supplementary Material, Supplementary Figure S1 for EDS spectra). (C) Backscatter SEM image of pyrite and sphalerite (Sp) in the Paxton. Note relic framboids at the nucleus of several pyrite grains—Krocker core. (D) Backscatter SEM image of nickel-bearing pyrite surrounded by calcite (Ca) in the Paxton—St. Chester Core. (E) Backscatter SEM image of siliceous mudrock with chlorite (Chl) in the Norwood—St. Chester. (F) Backscatter SEM image of patch of barite (Brt) and celestine (Cls) cement with euhedral and double terminated quartz (Qtz) in the Paxton—Krocker core. (G) Backscatter SEM image of monazite and chalcopyrite (Ccp) in the Lachine member—Krocker core. (H) Backscatter SEM image of euhedral chalcopyrite grain within calcite in the Lachine member—Krocker core.
The Ti/Nb vs. Zr plot was used to differentiate provenance materials delivered to the Antrim (Figure 12) (Bonjour and Dabard, 1991). Four distinct groups emerge from the data: 1) a Cu-rich, mixed quartzofeldspathic/volcanic source generally confined to the Lachine member; 2) Cu-rich, quartzofeldspathic source restricted to certain specimens from the Paxton; 3) Cu-poor, quartzofeldspathic source among a few Paxton specimens and; 4) Cu-poor, dominantly intrabasinal sourced specimens residing in the Paxton, Norwood and Lachine. Group 4 specimens generally contain the highest concentrations of quartz relative to groups. The presence of chalcopyrite in the Lachine further corroborates the increased Cu concentrations detected by HHXRF.
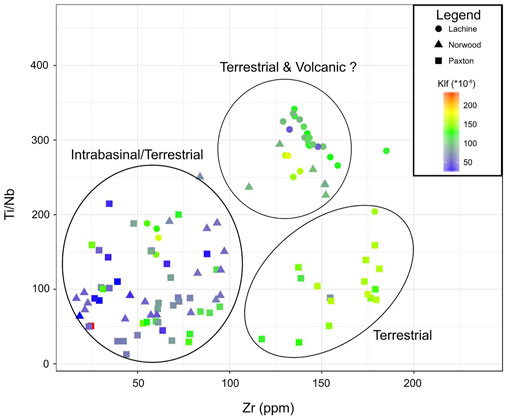
FIGURE12. Ti/Nb vs. Zr plot with data points colored by their copper concentration. Group 1–4 delimitated by ellipses.
Carbonate-rich matrix material and mineralized fractures from the Paxton member in the Krocker and St. Chester wells were sampled for stable oxygen and carbon isotopic analysis (Figure 13A). δ13C values in this study range from -7.44 to -13.11‰ (PDB) [mean = -10.3‰ (PDB)]. The δ18O values from vein specimens in both cores show depleted values ranging from -9.5 to -11.8‰ (PDB) [19.1–21.9‰ (SMOW)]. The δ18O values from the adjacent matrix exhibit significantly less depleted values (4.8, 4.9‰ (PDB); 25.9, 25.8‰ (SMOW)). The locations of matrix and vein sampling sites are shown in Figure 13B). Vuggy porosity commonly occurs within such fractures and curved crystal habits consistent with baroque dolomite are observed (Figure 13C). Optical microscopy reveals baroque dolomite characterized by coarsely crystalline mosaics of anhedral to subhedral crystals with undulose extinction, curved crystal faces (Figure 13D). Large calcite crystals with occasional patches of anhydrite occur intergrown with baroque dolomite (Figure 13D).
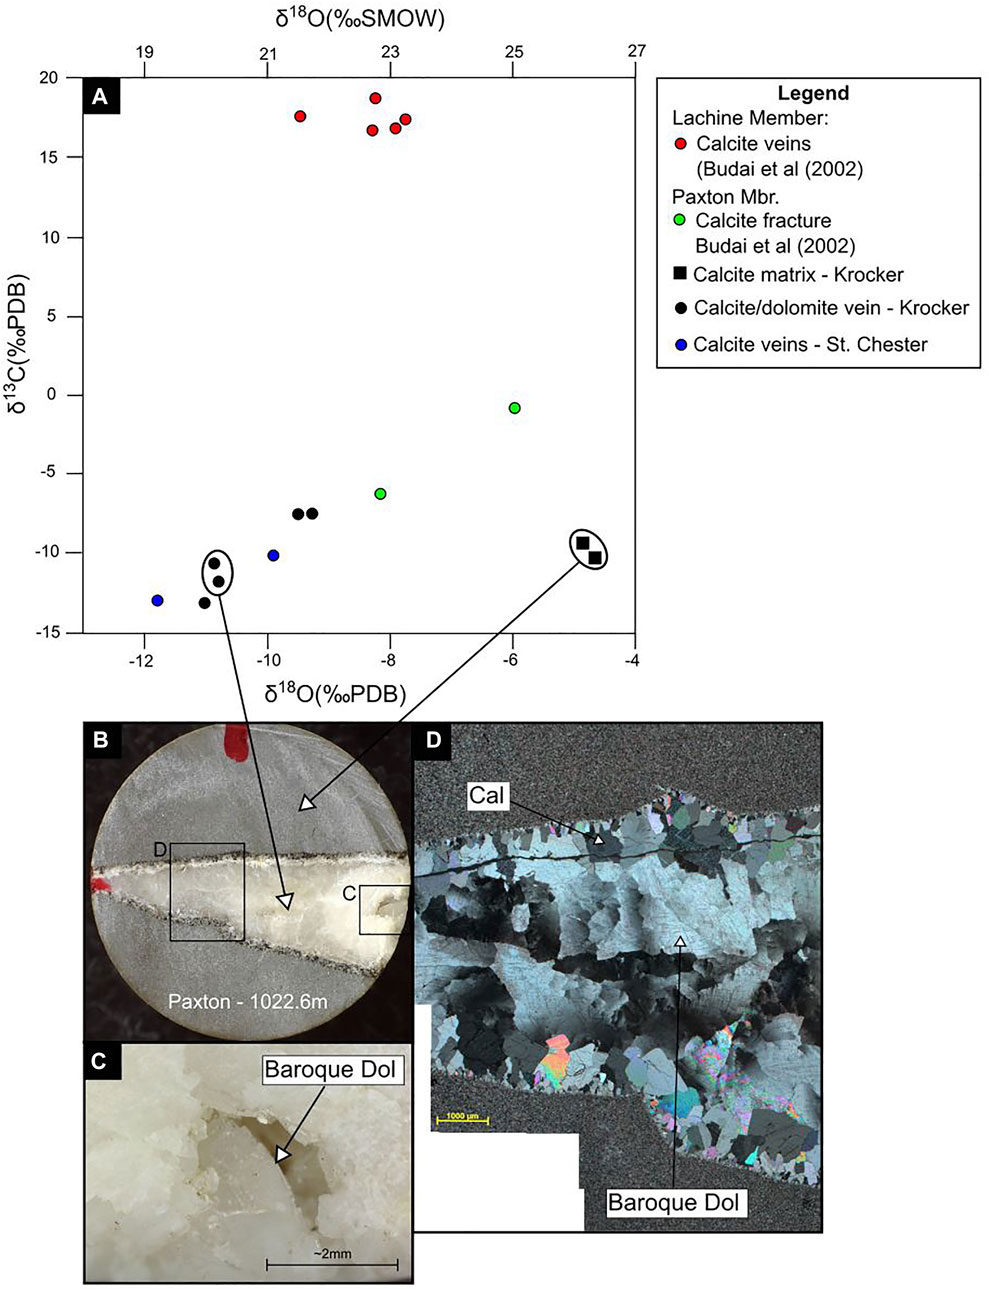
FIGURE 13. (A) Carbon and oxygen stable isotope data from this study and from Budai et al. (2002). Vein specimens display depleted δ18O whereas matrix specimens show more standard values. (B) Sampling sites for isotopic analysis. (C) Vuggy porosity in fracture with curved crystal habit indicative of baroque dolomite. (D) Cross polar photomicrograph of vein fill with calcite (Cal) and coarsely crystalline mosaics of anhedral to subhedral baroque dolomite with undulose extinction.
The carrier of magnetic remanence is difficult to define given the complex rock-magnetic and thermal demagnetization results, however, the body of evidence suggests that magnetite is the most likely carrier. Gyro-remanence observed in some of the AF demagnetization experiments has been ascribed to the presence of magnetic sulfides such as greigeite (i.e., Duan et al., 2020), however, specimens showing this behavior rarely yielded consistent, interpretable magnetic components and therefore were unlikely to be the main carrier of the magnetic remanence. The hysteresis behavior observed are somewhat consistent with the observations reported by Housen and Musgrave (1996) who documented iron sulfides in shallow cores from the ODP 146 program, however, a mixture of high coercivity magnetite particles along with magnetic sulfides is likely to produce similar hysteresis loops. Overall, the rock magnetic experiments and petrographic obsevations suggest the magnetizations in the Antrim and Squaw Bay reside primarily in SD and PSD/MD magnetite (Figures 7–9) with the LC component most likely residing in PSD/MD magnetite and HC component residing in SD magnetite.
The SD component is interpreted to be a chemical remanent magnetization (CRM) based on the following lines of evidence; 1) Burial temperatures inferred from vitrinite reflectance and fluid inclusion homogenization temperatures (120–150°C) of Luczaj et al. (2006), 2) unblocking temperatures (e.g., 450°C) of the HC component evaluated against a TVRM nomogram for SD magnetite (Pullaiah et al., 1975), which indicate that the HC component is not a TVRM.
We propose the following evidence in support of the CRM being related to hydrothermal activity. Paleomagnetic ages and their geographical differences are consistent with radiometric ages determined by Girard and Barnes (1995) for hydrothermal alteration in the Michigan Basin. An older magnetization (315 Ma ±20) carried by SD magnetite in the St. Chester core compared to younger magnetizations in the Krocker (Paxton–Middle Permian/Late Triassic; Norwood—240-315 Ma) is consistent with regional age discrepancies recorded by K-Ar dating. Girard and Barnes (1995) recognized that shallower (1–1.5 km) Ordovician rocks toward the Northern margin of the Michigan Basin recorded older K-Ar ages (355 Ma-380 Ma) relative to specimens collected above the MCR (318-365 Ma) in the central and deepest part (2.1–3.1 km) of the basin. Conduits (e.g., fractures) facilitating hydrothermal alteration of Ordovician rocks likely also acted as conduits for hydrothermal fluids within the Antrim Formation (see evidence below). These conduits most likely originate in the basement which is thought to have well-developed patterns of jointing and faulting, analogous to the highly fractured neighboring Canadian Shield outcrop (Sanford et al., 1985; Fisher et al., 1988). These conduits may have been similar but probably not identical due to the slight age discrepancy between HC components in the Krocker core and K-Ar ages. Perhaps paleoplumbing in the central section of the basin precluded early migration of hydrothermal beyond Ordovician rocks and only later, instigated by a far-field orogenic pulse from the Appalachians, conduits for hydrothermal fluid migration to the Antrim became active. K-Ar dating on Antrim specimens would provide much needed clarification to further reconcile these age discrepancies.
There is also abundant evidence that the Antrim has been altered by diagenetic/hydrothermal fluids that could have caused acquisition of a CRM. For example, baroque dolomite occurring in fractures within the Paxton member exhibit depleted δ18O values Figure 13) consistent with previous data collected from hydrothermal baroque dolomite and calcite in the middle Devonian Dundee Formation (Luczaj et al., 2006). Furthermore Luczaj et al. (2006) also report fluid inclusion data of aqueous inclusions in saddle dolomite and calcite with homogenization temperatures from 120 to 150°C in the Dundee Formation. This temperature range cannot be explained by burial heating alone unless an additional 3000 m of overburden were present (Luczaj et al., 2006) and no evidence exists for an uplift event of such magnitude.
Minerals associated with hydrothermal activity such as barite, celestine, sphalerite, nickel-bearing pyrite, monazite, chalcopyrite and euhedral megaquartz (Campbell and Ethier, 1984; Rusk, 2012) occur, although not uniformly across the Antrim and Squaw Bay (Figures 11, 13). Of course, many of these minerals can form independent of hydrothermal activity via burial diagenesis or may originate from extrabasinal sources (e.g., Kesler and Jones, 1980; Totten et al., 2000; Berner et al., 2013), however, the collection of these minerals do support a hydrothermal mineralization. With the exception of baroque dolomite occurring in fractures, these minerals occur as individual constituents in the matrix (sphalerite, monazite, and chalcopyrite) (Figures 11C,G,H) or as isolated cemented patches (celestine, barite, euhedral quartz) (Figure 11F). This brings into question the mechanism by which fluids migrated through the Antrim and Squaw Bay. We speculate that hydrothermal mineralization in the matrix would have likely occurred during early burial, while sediments were undercompacted and geopressure regimes allow for mass transfer of fluids (Magara, 1978). HC CRM development most likely occurred via illitization initiated by hydrothermal fluids which can produce authigenic magnetite (McCabe and Elmore, 1989; Hirt et al., 1993; Katz et al., 2000). This may have been the case in the Norwood which contains hydrothermal minerals in the matrix and virtually no mineralized fractures. A separate hydrothermal event likely migrated through fractures in the Paxton, also causing a CRM by similar remagnetization mechanism. Additional evidence supporting two unique CRMs for the Norwood and Paxton include the starkly disparate NRM intensities (Figures 5, 6).
The origin of LC components (Krocker—170 Ma±25) and (St. Chester—205 Ma±10) are more difficult to decipher however, some preliminary ideas will be discussed. Thermal demagnetization did not yield interpretable unblocking temperatures for the LC component and, therefore, the possibility of a thermoviscous magnetization (TVRM) cannot be excluded. LC components may reside in PSD/MD magnetite that has replaced iron sulfides which occur in each member and both cores (Figures 11A–C), however, mechanisms for oxidizing fluids moving through each unit are unknown. Interestingly, LC magnetizations appear to be broadly coeval with the apatite fission track ages obtained from basement specimens which indicate Triassic heating (Crowley, 1991). Given the microtextural evidence and interpretations from Crowley (1991), two hypothesis are put forth: 1) A CRM related to an additional pulse of regional hydrothermal fluids migrating through the Antrim and Squaw Bay or 2) a CRM related to fluid migration caused by overpressuring due to tectonic uplift which forced oxidizing fluids through the Antrim and Squaw Bay. Numerical and burial history modeling by (Aportria et al., 1994) suggest peak thermogenic hydrocarbon generation occurred from 240 to 250 Ma followed by natural hydraulic fracturing. These conditions would favor hydrocarbon migration as a mechanism for CRM development in the Antrim and Squaw Bay (e.g., Kilgore and Elmore, 1989; Elmore and Leach, 1990; Elmore et al., 2012).
The available data do not indicate significant differences with respect to magnetic mineralogy, mineral authigenesis or stable isotopes between the two cores, however, this could reflect sampling bias due to the lack of samples retrieved from the St. Chester core. For example, from a stable isotopes standpoint δ13C values fall within similar ranges in Paxton members in both cores and suggest similar fractionation processes were at play (i.e. abiotic methane oxidation or bacterial sulfate reduction). This does not necessarily indicate that no microbial processes were active in the Lachine which, previous studies have shown to exhibit strong evidence of microbial methanogenesis (Budai et al., 2002). δ13C values for calcite veins from Osego county in the Lachine member (Budai et al., 2002) are substantially greater than those observed in this study. Budai et al. (2002) attributes high δ13C values to bacterial methanogenesis whereas data from this study indicate abiotic methane oxidation or bacterial sulfate reduction. Petrographically, no differences emerge in terms of authigenic minerals with the exception of Ni-bearing pyrite which is only observed in St. Chester core which has no obvious connection to microbial methanogenesis. Paleomagnetic data also indicate no evidence of a modern or post, Pleistocene magnetization in the St. Chester well and suggests microbial methanogenesis does not result in the formation of remanence-bearing minerals. Future studies should focus on retrieving specimens from the Lachine member, which may have been the member most affected by infiltrated Pleistocene glacial waters.
As with the majority of AMS studies on shales (e.g. Pares, 2015), bedding parallel K1 orientations observed in the Antrim and Squaw Bay are due to mechanical compaction, however, the origin of the consistent lineation in some members is more ambiguous. A slight imbrication of K3 tensors (i.e., deviation from the vertical plane) in the Krocker core suggests a hydrodynamically influenced magnetic fabric (Figure 5) (e.g., Schieber and Ellwood, 1988). Such ellipsoid configurations have been attributed to moderate current velocities that produce an upstream imbrication of grains (e.g., Ellwood and Ledbetter. 1979; Liu et al., 2001; Pares et al., 2007). In this study, no evidence of reworked sediments were found, therefore, current velocities were probably low to moderate. Consistent AMS lineations are generally confined to massive, featureless facies, cross-laminated or wavy discontinuously laminated facies. If paleocurrents are indeed responsible for AMS lineations in the Antrim, paleocurrent directions probably remained relatively constant throughout the Late Devonian. The preservation of a hydrodynamically shaped fabric is a function of many factors including an unchanging basin configuration, sediment supply and sea-level variability (e.g., Schieber, 1994). Structure maps on the base of the Antrim Shale indicate a concentric depocenter and show little evidence of major basin reconfiguration during the Late Devonian (Gutschick and Sandberg, 1991). However, changes in sediment supply (i.e., contribution from Catskill delta and eastward prograding Ellsworth deltaic sediments) along with gradually falling sea-levels could have inhibited preservation of paleocurrent lineations (Gutschick and Sandberg, 1991).
Subtle tectonic shortening is an alternative and equally plausible explanation for the origin of consistent AMS lineations in the Antrim. (Versical 1991) among others suggest far-field tectonic shortening during the Late Mississippian evidenced by anticlinal features in the Michigan Basin. The Krocker core is located within the crest of one such anticline (Figure 1). Furthermore, AMS tensors in the St. Chester core show hallmarks of a composite sedimentary/tectonic fabric (i.e., streaked K3 directions) (Weil and Yonkee, 2012) (Figure 6). Discrimination between weak tectonic and hydrodynamically shaped AMS fabrics can be problematic when there are insufficient independent evidence of these processes (e.g., fracture orientations or bedforms).
Minerals such as baroque dolomite and associated stable isotopic compositions are often considered incontrovertible forms of evidence for hydrothermal activity (e.g., Qing and Mountjoy, 1994; Machel and Lonnee, 2002) (Figure 13), however, given the regional geology, it is worth considering whether a subset of the aforementioned hydrothermal minerals are in fact detrital. A case can be made that monazite and chalcopyrite were sourced from the Michigan peninsula which host significant monazite-bearing and copper-bearing Proterozoic rocks (Figure 1). Monazite occurs in economic quantities in the Paleoproterozoic Goodrich quartz and chalcopyrite is reported in a variety of pre-Devonian rocks within the Michigan peninsula such as the Nonesuch Shale, Copper Harbor Formation and Portage Lake volcanics (Bornhorst and Barron, 2011). In addition to the proximity of these deposits to the Michigan basin, compelling evidence from trace-element geochemistry also suggest these minerals were detrital. Increased concentrations of copper are largely confined to the Lachine (Group 1) and part of the Paxton (Group 2) member (Figure 12) (also confirmed by SEM analysis). These groups also contain the highest concentrations of Zr which is a robust indicator of terrestrial provenance (e.g., Tribovillard et al., 2006). Group 1 could indicate a mixed quartzofeldspathic/volcanic origin whereas Group 2 could correspond to a dominantly quartzofeldspathic source (Figure 12). Textural evidence for a detrital origin of chalcopyrite and monazite are mixed. For example, these minerals are often accompanied by rutile, a common detrital constituent and often occur within by clasts (Figures 11G,H). Counterevidence to a detrital origin include the well-defined crystal habits observed and the relatively large crystal sizes which show no evidence of transport particularly among certain chalcopyrite grains. If monazite and chalcopyrite are in fact detrital, it ties in well with the transition from Catskill prodeltaic influx in the lower Antrim to a more westerly/north westerly prodeltaic input in the Upper Antrim. Chalcopyrite and monazite have higher densities relative to most detrital minerals therefore, a high energy transport mechanism must be invoked to support a detrital origin. Gutschick and Sandberg report upper Antrim/Ellsworth turbidite complexes extending far into the basin which could have been responsible for transporting these minerals into the Michigan Basin. A possible implication, of establishing the origin of these minerals would be furthering our understanding of the Michigan Peninsula. If these minerals are detrital, it would indicate that Proterozoic rocks were exposed during the Late Devonian which could improve our understanding of the structural evolution of the Michigan Peninsula.
Data from this study are consistent with a growing body of evidence for significant hydrothermal activity in midcontinent North America during the late Paleozoic and the Mesozoic (McCabe and Elmore, 1989; Roberts et al., 2019). Despite having undergone relatively quiescent tectonic episodes relative to other sedimentary basins in North America, complex thermochemical activity took place in the Michigan basin. The following main conclusions can be drawn from this study:
1) Remagnetizations (HC) carried by SD magnetite occurred during the late Paleozoic and are most likely a result of hydrothermal fluids. This interpretation is buttressed by petrographic and isotopic evidence. Geographical variability of paleomagnetic ages and their timing relate to previous radiometric dating of Ordovician rocks (Girard and Barnes, 1995) and may indicate a complex paleoplumbing network in the Michigan basin.
2) A younger, widespread magnetization residing in PSD/MD magnetite occurred predominately during the Mesozoic. Petrographic evidence suggests this magnetization results from oxidation of metastable iron sulfides and the age coincides with regional uplift and hydrocarbon migration. Additional hypothesis should be explored to explain the nature of this magnetization (i.e., TVRM).
3) AMS fabrics are predominantly carried by paramagnetic Fe-rich clays. The lineation observed in AMS data are consistent with hydrodynamic forces or subtle tectonic shortening.
4) A case can be made that chalcopyrite and monazite in the Antrim were sourced from the Northern Michigan Peninsula although a hydrothermal origin cannot be ruled out. It is also possible that populations of detrital chalcopyrite and monazite grains exist along with neoformed grains that formed during hydrothermal activity. Radiometric dating on monazite grains could provide valuable insight into this conundrum.
This study demonstrates that the integration of paleomagnetism, rock magnetism and geochemistry have wide reaching implications that can serve to better define the burial, tectonic and depositional history of shales. The differences between thermogenic and biogenically gas systems require additional work to understand any associated magnetic and diagenetic mineral authigenesis.
The original contributions presented in the study are included in the article/Supplementary Material, further inquiries can be directed to the corresponding author.
Experimental work and analysis performed by both authors.
We thank David Fruit for providing information on the Antrim, as well as Mike Engel and Shannon Dulin comments on the manuscript. We think Maggie Martin for helping with the sampling and Western Michigan University’s Michigan Geological Repository for Research and Education for access to the cores. We think the undergraduate workers for their help with this project, and Eric Ferré for providing the hysteresis data.
GH was employed by the company ExxonMobil.
The remaining author declares that the research was conducted in the absence of any commercial or financial relationships that could be construed as a potential conflict of interest.
All claims expressed in this article are solely those of the authors and do not necessarily represent those of their affiliated organizations, or those of the publisher, the editors and the reviewers. Any product that may be evaluated in this article, or claim that may be made by its manufacturer, is not guaranteed or endorsed by the publisher.
The Supplementary Material for this article can be found online at: https://www.frontiersin.org/articles/10.3389/feart.2022.944220/full#supplementary-material
Apotria, T. G., Kaiser, C. J., and Cain, B. A. (1994). “Fracturing and stress history of the devonian Antrim shale, Michigan basin,” in Rock mechanics. Editors P. P. Nelson, and S. E. Lauback (Rotterdam: Balkema), 809–816.
Arason, Þ., and Levi, S. (2010). Maximum likelihood solution for inclination-only data in paleomagnetism. Geophys. J. Int. 182 (2), 753–771. doi:10.1111/j.1365-246x.2010.04671.x
Berner, Z. A., Puchelt, H., NÖltner, T., and Kramar, U. T. Z. (2013). Pyrite geochemistry in the Toarcian Posidonia Shale of south‐west Germany: Evidence for contrasting trace‐element patterns of diagenetic and syngenetic pyrites. Sedimentology 60 (2), 548–573. doi:10.1111/j.1365-3091.2012.01350.x
Bonjour, J. L., and Dabard, M. P. (1991). Ti/Nb ratios of clastic terrigenous sediments used as an indicator of provenance. Chem. Geol. 91 (3), 257–267. doi:10.1016/0009-2541(91)90003-a
Bornhorst, T. J., and Barron, R. J. (2011). Copper deposits of the western upper peninsula of Michigan. Geol. Soc. Am. Field Guide 24, 83–99. doi:10.1130/2011.0024(05)
Budai, J. M., Martini, A. M., Walter, L. M., and Ku, T. C. W. (2002). Fracture‐fill calcite as a record of microbial methanogenesis and fluid migration: A case study from the devonian Antrim shale, Michigan basin. Geofluids 2 (3), 163–183. doi:10.1046/j.1468-8123.2002.00036.x
Campbell, F. A., and Ethier, V. G. (1984). Nickel and cobalt in pyrrhotite and pyrite from the Faro and Sullivan orebodies. Can. Mineralogist 22 (3), 503–506.
Chadima, M., and Jelinék, V. (2009). Anisoft 4.2: Anisotropy data browser for windows. Brno: Agico. Inc. https://www.agico.com/text/software/anisoft/anisoft.php.
Chang, S. B. R., Kirschvink, J. L., and Stolz, J. F. (1987). Biogenic magnetite as a primary remanence carrier in limestone deposits. Phys. Earth Planet. Interiors 46 (1-3), 289–303. doi:10.1016/0031-9201(87)90191-9
Coniglio, M., Sherlock, R., Williams-Jones, A. E., Middleton, K., Frape, S. K., Purser, B., et al. (1994). “Burial and hydrothermal diagenesis of ordovician carbonates from the Michigan basin, ontario, Canada,”in Dolomites—a volume in honour of Dolomieu. Editors B. Purser, M. Tucker, and D. Zenger (Ortisei, Italy: International Association of Sedimentologists, Special Publication), 21, 231–254.
Craddock, J. P., and Pluijm, B. A. V. D. (1989). Late Paleozoic deformation of the cratonic carbonate cover of eastern North America. Geol. 17 (5), 416–419. doi:10.1130/0091-7613(1989)017<0416:lpdotc>2.3.co;2
Crowley, K. D. (1991). Thermal history of Michigan Basin and Southern Canadian Shield from apatite fission track analysis. J. Geophys. Res. 96 (B1), 697–711. doi:10.1029/90jb02174
Curran, B. C., and Hurley, N. F. (1992). Geology of the devonian dundee reservoir, west branch field, Michigan (1). AAPG Bull. 76 (9), 1363–1383.
Dellapenna, T. M. (1991). Sedimentological, structural, and organic geochemical controls on natural gas occurrence in the Antrim formation in otsego county, Michigan. (PhD dissertation). Kalamazoo: Western Michigan University.
Dennie, D., Elmore, R. D., Deng, J., Manning, E., and Pannalal, J. (2012). Palaeomagnetism of the mississippian barnett shale, fort worth basin, Texas. Geol. Soc. Spec. Publ. 371 (1), 89–106.
Dicken, S. W. N. C. L., and Mueller, M. P. F. J. A. (2004). The upper midwest states: Minnesota, Wisconsin, Michigan, Illinois and Indiana-the state of Wisconsin. US: USGS Issue 2004-1355.
Duan, Zongqi, Liu, Qingsong, Qin, Huafeng, Zhao, Xixi, and Gao, Xing (2020). Behavior of greigite‐bearing marine sediments during AF and thermal demagnetization and its significance. Geochem. Geophys. Geosyst. 21 (7), e2019GC008635. doi:10.1029/2019gc008635
Dunlop, D. J. (2002a). Theory and application of the day plot (Mrs/Ms versus hcr/hc): 1. Theoretical curves and tests using titanomagnetite data. J. Geophys. Res. 107 (B3), 2056. doi:10.1029/2001JB000486
Dunlop, D. J. (2002b). Theory and application of the day plot (Mrs/Ms versus hcr/hc): 2. Application to data for rocks, sediments, and soils. J. Geophys. Res. 107 (B3), 2057. doi:10.1029/2001JB000487
East, J. A., Swezey, C. S., Repetski, J. E., and Hayba, D. O. (2012). Thermal maturity map of devonian shale in the Illinois, Michigan, and appalachian basins of north America. U. S. Geol. Surv. Sci. Investig. Map 3214.
Ellwood, B. B., and Ledbetter, M. T. (1979). Paleocurrent indicators in deep-sea sediment. Science 203 (4387), 1335–1337. doi:10.1126/science.203.4387.1335
Elmore, R. D., and Leach, M. C. (1990). Remagnetization of the rush springs formation, cement, Oklahoma: Implications for dating hydrocarbon migration and aeromagnetic exploration. Geol. 18 (2), 124–127. doi:10.1130/0091-7613(1990)018<0124:rotrsf>2.3.co;2
Elmore, R. D., Muxworthy, A. R., Aldana, M., and Mena, M. (2012). Remagnetization and chemical alteration of sedimentary rocks. Remagnetization and chemical alteration of sedimentary rocks in: eds. R. D. Elmore, A. R. Muxworthy, M. Aldana, and M. Mena , Geological Society, London Special Publications, London 371, 1–21. doi doi:10.1144/SP371.15
Fisher, J. H., Barratt, M. W., Droste, J. B., and Shaver, R. H. (1988). The geology of north America. Mich. basin 2, 361–382.
Girard, J. P., and Barnes, D. A.(1995). Illitization and paleothermal regimes in the middle ordovician St. Peter sandstone, central Michigan basin: K-Ar, oxygen isotope, and fluid inclusion data. AAPG Bull. 79(1), 49–69.
Gutschick, R. C. (1987). Devonian shelf-basin, Michigan basin, alpena, Michigan. Boulder, Colorado: North-Central Section of the Geological Society of America, 297–302. Geological Society of America, Centennial Field Guide.
Gutschick, R. C., and Sandberg, C. A. (1991). Late Devonian history of Michigan basin. Early sedimentary evolution of the Michigan basin. Geol. Soc. Am. Special Pap. 256, 181–202.
Hirt, A., Banin, A., and Gehring, A. (1993). Thermal generation of ferromagnetic minerals from iron-enriched smectites. Geophys. J. Int. 115, 1161–1168. doi:10.1111/j.1365-246x.1993.tb01518.x
Housen, B. A., and Musgrave, R. J. (1996). Rock-magnetic signature of gas hydrates in accretionary prism sediments. Earth Planet. Sci. Lett. 139 (3-4), 509–519. doi:10.1016/0012-821x(95)00245-8
Howell, P. D., and Pluijm, B. A. V. D. (1990). Early history of the Michigan basin: Subsidence and Appalachian tectonics. Geol. 18 (12), 1195–1198. doi:10.1130/0091-7613(1990)018<1195:ehotmb>2.3.co;2
Jackson, M., and Solheid, P.(2010). On the quantitative analysis and evaluation of magnetic hysteresis data. Geochem. Geophys. Geosyst., 11(4), doi:10.1029/2009GC002932
Jelinek, V. (1981). Characterization of the magnetic fabric of rocks. Tectonophysics 79 (3-4), T63–T67. doi:10.1016/0040-1951(81)90110-4
Katz, B., Elmore, R. D., Cogoini, M., Engel, M. H., and Ferry, S.(2000). Associations between burial diagenesis of smectite, chemical remagnetization, and magnetite authigenesis in the Vocontian trough, SE France. J. Geophys. Res. 105(B1), 851–868, doi:10.1029/1999jb900309
Kesler, S. E., and Jones, L. M. (1980). Sulfur-and strontium-isotopic geochemistry of celestite, barite and gypsum from the Mesozoic basins of northeastern Mexico. Chem. Geol. 31, 211–224. doi:10.1016/0009-2541(80)90087-x
Kilgore, B., and Elmore, R. D. (1989). A study of the relationship between hydrocarbon migration and the precipitation of authigenic magnetic minerals in the Triassic Chugwater Formation, southern Montana. Geol. Soc. Am. Bull. 101 (10), 1280–1288. doi:10.1130/0016-7606(1989)101<1280:asotrb>2.3.co;2
Kirschvink, J. L. (1980). The least-squares line and plane and the analysis of palaeomagnetic data. Geophys. J. Int. 62 (3), 699–718. doi:10.1111/j.1365-246X.1980.tb02601.x
Klein, G. D., and Hsui, A. T. (1987). Origin of cratonic basins. Geol. 15 (12), 1094–1098. doi:10.1130/0091-7613(1987)15<1094:oocb>2.0.co;2
Liu, B., Saito, Y., Yamazaki, T., Abdeldayem, A., Oda, H., Hori, K., et al. (2001). Paleocurrent analysis for the Late Pleistocene–Holocene incised-valley fill of the Yangtze delta, China by using anisotropy of magnetic susceptibility data. Mar. Geol. 176 (1-4), 175–189. doi:10.1016/s0025-3227(01)00151-7
Luczaj, J. A., Harrison, W. B., and Williams, N. S. (2006). Fractured hydrothermal dolomite reservoirs in the devonian Dundee Formation of the central Michigan basin. Am. Assoc. Pet. Geol. Bull. 90 (11), 1787–1801. doi:10.1306/06270605082
Ma, L., Castro, M. C., and Hall, C. M. (2009). Atmospheric noble gas signatures in deep Michigan Basin brines as indicators of a past thermal event. Earth Planet. Sci. Lett. 277 (1-2), 137–147. doi:10.1016/j.epsl.2008.10.015
Machel, H. G., and Lonnee, J. (2002). Hydrothermal dolomite—a product of poor definition and imagination. Sediment. Geol. 152 (3-4), 163–171. doi:10.1016/s0037-0738(02)00259-2
Magara, K. (1978). Compaction and fluid migration. Dev. Petrol. Sci. 9. Elsevier, New York, 211–230.
Maher, B. A. (2007). Environmental magnetism and climate change. Contemp. Phys. 48 (5), 247–274. doi:10.1080/00107510801889726
Manning, E. B., and Elmore, R. D. (2015). An integrated paleomagnetic, rock magnetic, and geochemical study of the Marcellus shale in the Valley and Ridge province in Pennsylvania and West Virginia. J. Geophys. Res. Solid Earth 120 (2), 705–724. doi:10.1002/2014jb011418
Martini, A. M., Budai, J. M., Walter, L. M., and Schoell, M. (1996). Microbial generation of economic accumulations of methane within a shallow organic-rich shale. Nature 383 (6596), 155–158. doi:10.1038/383155a0
Martini, A. M., Walter, L. M., Budai, J. M., Ku, T. C. W., Kaiser, C. J., and Schoell, M. (1998). Genetic and temporal relations between formation waters and biogenic methane: Upper Devonian Antrim Shale, Michigan Basin, USA. Geochimica Cosmochimica Acta 62 (10), 1699–1720. doi:10.1016/s0016-7037(98)00090-8
Matthews, R. D.(1993). Review and revision of the Devonian–Mississippian stratigraphy in the Michigan basin, in Petroleum geology of the Devonian and Mississippian black shale of eastern North America eds. J. B. Roen Kepferle : U.S. Geological Survey Bulletin, D1–D85.
Maxbauer, D. P., Feinberg, J. M., and Fox, D. L. (2016). Max UnMix: A web application for unmixing magnetic coercivity distributions. Comput. Geosciences 95, 140–145. doi:10.1016/j.cageo.2016.07.009
McCabe, C., and Elmore, R. D. (1989). The occurrence and origin of late Paleozoic remagnetization in the sedimentary rocks of North America. Rev. Geophys. 27 (4), 471–494. doi:10.1029/rg027i004p00471
McCrea, J. M. (1950). On the isotopic chemistry of carbonates and a paleotemperature scale. J. Chem. Phys. 18 (6), 849–857. doi:10.1063/1.1747785
Moskowitz, B. M., Frankel, R. B., and Bazylinski, D. A. (1993). Rock magnetic criteria for the detection of biogenic magnetite. Earth Planet. Sci. Lett. 120 (3-4), 283–300. doi:10.1016/0012-821x(93)90245-5
Over, D. J. (2002). The Frasnian/Famennian boundary in central and eastern United States. Palaeogeogr. Palaeoclimatol. Palaeoecol. 181 (1-3), 153–169. doi:10.1016/s0031-0182(01)00477-1
Parés, J. M., Hassold, N. J. C., Rea, D. K., and Van der Pluijm, B. A. (2007). Paleocurrent directions from paleomagnetic reorientation of magnetic fabrics in deep-sea sediments at the Antarctic Peninsula Pacific margin (ODP Sites 1095, 1101). Mar. Geol. 242 (4), 261–269. doi:10.1016/j.margeo.2007.04.002
Parés, J. M. (2004). How deformed are weakly deformed mudrocks? Insights from magnetic anisotropy. Geol. Soc. Lond. Spec. Publ. 238 (1), 191–203. doi:10.1144/gsl.sp.2004.238.01.13
Parés, J. M. (2015). Sixty years of anisotropy of magnetic susceptibility in deformed sedimentary rocks. Front. Earth Sci. (Lausanne). 3, 4. doi:10.3389/feart.2015.00004
Parés, J. M., and Van der Pluijm, B. A. (2004). Correlating magnetic fabrics with finite strain: Comparing results from mudrocks in the Variscan and Appalachian Orogens. Geol. Acta 2 (3), 213–220.
Paterson, G. A., Zhao, X., Jackson, M., and Heslop, D. (2018). Measuring, processing, and analyzing hysteresis data. Geochem. Geophys. Geosyst. 19 (7), 1925–1945. doi:10.1029/2018GC007620
Peters, C., and Dekkers, M. J. (2003). Selected room temperature magnetic parameters as a function of mineralogy, concentration and grain size. Phys. Chem. Earth Parts A/B/C 28 (16-19), 659–667. doi:10.1016/s1474-7065(03)00120-7
Prouty, C. E. (1988)., 13. St, 101.Fractured hydrocarbon reservoir models-Michigan basin: Geological association of CanadaMineralogical Assoc. Can. Can. Soc. Petroleum Geol. Annu. Meet. Nfld. Program Abstr.
Pullaiah, G., Irving, E., Buchan, K. L., and Dunlop, D. J. (1975). Magnetization changes caused by burial and uplift. Earth Planet. Sci. Lett. 28 (2), 133–143. doi:10.1016/0012-821x(75)90221-6
Qing, H., and Mountjoy, E. W. (1994). Formation of coarsely crystalline, hydrothermal dolomite reservoirs in the Presqu'ile barrier, Western Canada sedimentary basin. AAPG Bull. 78 (1), 55–77.
Roberts, J., Heij, G., and Elmore, R. (2019). A diagenetic study of the Woodford Shale in the southeastern Anadarko Basin, Oklahoma, USA: Evidence for hydrothermal alteration in mineralized fractures. Geol. Mag., 1–10. doi:10.1017/S0016756819000360
Roberts, J. M., and Elmore, R. D. (2017). A diagenetic study of the Woodford Shale in the southeastern Anadarko Basin, Oklahoma, USA: Evidence for hydrothermal alteration in mineralized fractures. Interpretation 6 (1), SC1–SC13. doi:10.1190/int-2017-0071.1
Rochette, P. (1987). Magnetic susceptibility of the rock matrix related to magnetic fabric studies. J. Struct. Geol. 9 (8), 1015–1020. doi:10.1016/0191-8141(87)90009-5
Rowe, H., Hughes, N., and Robinson, K. (2012). The quantification and application of handheld energy-dispersive x-ray fluorescence (ED-XRF) in mudrock chemostratigraphy and geochemistry. Chem. Geol. 324, 122–131. doi:10.1016/j.chemgeo.2011.12.023
Rusk, B. (2012). “Cathodoluminescent textures and trace elements in hydrothermal quartz,” in Quartz: Deposits, mineralogy and analytics (Berlin, Heidelberg: Springer), 307–329.
Saller, A. H., and Dickson, J. A. T. D. (2011). Partial dolomitization of a Pennsylvanian limestone buildup by hydrothermal fluids and its effect on reservoir quality and performance. Am. Assoc. Pet. Geol. Bull. 95 (10), 1745–1762. doi:10.1306/02141110117
Sanford, B. V., Thompson, F. J., and McFall, G. H. (1985). Plate tectonics-a possible controlling mechanism in the development of hydrocarbon traps in southwestern Ontario. Bull. Can. Petroleum Geol. 33 (1), 52–71.
Schieber, J., and Ellwood, B. B. (1988). The coincidence of macroscopic paleocurrent indicators and magnetic lineation in shales from the Precambrian Belt Basin. J. Sediment. Res. 58 (5), 830–835.
Schieber, J. (1994). “Paleoflow patterns and macroscopic sedimentary features in the Late Devonian Chattanooga Shale of Tennessee; differences between the western and eastern Appalachian Basin,”. Editors A. F. Embry, B. Beauchamp, and D. J. Glass, Canad. Soc. Petrol. Geol. Mem. (Pangea: global environments and resources), 17, 763–772.
Simoneit, B. R. T., Goodfellow, W. D., and Franklin, J. M. (1992). Hydrothermal petroleum at the seafloor and organic matter alteration in sediments of Middle Valley, Northern Juan de Fuca Ridge. Appl. Geochem. 7 (3), 257–264. doi:10.1016/0883-2927(92)90041-z
Sleep, N. H., Nunn, J. A., and Chou, L. (1980). Platform basins. Annu. Rev. Earth Planet. Sci. 8 (1), 17–34. doi:10.1146/annurev.ea.08.050180.000313
Steullet, A. K., Elmore, R. D., Hamilton, M., and Heij, G. (2019). Remagnetization of Marcellus formation in the plateau province of the appalachian basin. Front. Earth Sci. 7. doi:10.3389/feart.2019.00185
Stoner, J. S., Channell, J. E., and Hillaire‐Marcel, C. (1996). The magnetic signature of rapidly deposited detrital layers from the deep Labrador Sea: Relationship to North Atlantic Heinrich layers. Paleoceanography 11 (3), 309–325. doi:10.1029/96pa00583
Swart, P. K., Burns, S. J., and Leder, J. J. (1991). Fractionation of the stable isotopes of oxygen and carbon in carbon dioxide during the reaction of calcite with phosphoric acid as a function of temperature and technique. Chem. Geol. Isot. Geosci. Sect. 86 (2), 89–96. doi:10.1016/0168-9622(91)90055-2
Torsvik, T. H., Van der Voo, R., Preeden, U., Mac Niocaill, C., Steinberger, B., Doubrovine, P. V., et al. (2012). Phanerozoic polar wander, palaeogeography and dynamics. Earth-Science Rev. 114 (3-4), 325–368. doi:10.1016/j.earscirev.2012.06.007
Totten, M. W., Hanan, M. A., and Weaver, B. L. (2000). Beyond whole-rock geochemistry of shales: The importance of assessing mineralogic controls for revealing tectonic discriminants of multiple sediment sources for the ouachita mountain flysch deposits. Geol. Soc. Am. Bull. 112 (7), 1012–1022. doi:10.1130/0016-7606(2000)112<1012:bwgost>2.0.co;2
Tribovillard, N., Algeo, T. J., Lyons, T., and Riboulleau, A. (2006). Trace metals as paleoredox and paleoproductivity proxies: An update. Chem. Geol. 232 (1), 12–32. doi:10.1016/j.chemgeo.2006.02.012
Versical, R. T. (1991). Basement control on the development of selected Michigan Basin oil fields as constrained by fabric elements in Paleozoic limestones. Kalamazoo: Western Michigan University. [Masters Thesis].
Weil, A. B., and Yonkee, W. A. (2012). Layer-parallel shortening across the sevier fold-thrust belt and laramide foreland of Wyoming: Spatial and temporal evolution of a complex geodynamic system. Earth Planet. Sci. Lett. 357, 405–420. doi:10.1016/j.epsl.2012.09.021
Winckler, G., Kipfer, R., Aeschbach, H., Botz, R., Schmidt, M., Schuler, S., et al. (2000). Sub sea floor boiling of Red Sea Brines: New indication from noble gas data. Geochimica Cosmochimica Acta 64 (9), 1567–1575. doi:10.1016/s0016-7037(99)00441-x
Keywords: Antrim formation, paleomagnetism, chemical remagnetization, anisotropy of magnetic susceptability, diagenesis
Citation: Heij G and Elmore RD (2022) Unraveling the complex burial history of the Antrim formation in Michigan basin using paleomagnetism, rock magnetism and geochemistry. Front. Earth Sci. 10:944220. doi: 10.3389/feart.2022.944220
Received: 14 May 2022; Accepted: 09 August 2022;
Published: 31 August 2022.
Edited by:
Hirokuni Oda, Geological Survey of Japan (AIST), JapanReviewed by:
Guilhem Hoareau, Université de Pau et des Pays de l'Adour, FranceCopyright © 2022 Heij and Elmore. This is an open-access article distributed under the terms of the Creative Commons Attribution License (CC BY). The use, distribution or reproduction in other forums is permitted, provided the original author(s) and the copyright owner(s) are credited and that the original publication in this journal is cited, in accordance with accepted academic practice. No use, distribution or reproduction is permitted which does not comply with these terms.
*Correspondence: Gerhard Heij, gerhardheij@outlook.com
Disclaimer: All claims expressed in this article are solely those of the authors and do not necessarily represent those of their affiliated organizations, or those of the publisher, the editors and the reviewers. Any product that may be evaluated in this article or claim that may be made by its manufacturer is not guaranteed or endorsed by the publisher.
Research integrity at Frontiers
Learn more about the work of our research integrity team to safeguard the quality of each article we publish.