- Department of Atmospheric Sciences, University of Hawaiʻi at Mānoa, Honolulu, HI, United States
The El Niño-Southern Oscillation (ENSO) phenomenon features rich sea surface temperature (SST) spatial pattern variations dominated by the Central Pacific (CP) and Eastern Pacific (EP) patterns during its warm phase. Understanding such ENSO pattern diversity has been a subject under extensive research activity. To provide a framework for unveiling the fundamental dynamics of ENSO diversity, an intermediate coupled model based on the Cane-Zebiak-type framework, named RCZ, is established in this study. Compared with the original Cane-Zebiak model, RCZ consists of revised model formulation and well-tuned parameterization schemes. All model components are carefully validated against the observations via the standalone mode, in which the observed anomalous SST (wind stress) forcing is prescribed to drive the atmospheric (oceanic) component. The superiority of RCZ’s model components over those in the original Cane-Zebiak model is evidenced by their better performance in simulating the observations. Coupled simulation with RCZ satisfactorily reproduces aspects of the observed ENSO characteristics, including the spatial pattern, phase-locking, amplitude asymmetry, and, particularly, ENSO diversity/bi-modality. RCZ serves as a promising tool for studying dynamics of ENSO diversity as it resolves most of the relevant processes proposed in the literature, including atmospheric nonlinear convective heating, oceanic nonlinear dynamical heating, and the ENSO/westerly wind burst interaction.
1 Introduction
The El Niño-Southern Oscillation (ENSO), a basin-scale atmosphere-ocean coupled phenomenon, is the dominant interannual climate variability in the tropics. Since the Tropical Ocean-Global Atmosphere (TOGA) decade, extensive observational studies have unveiled the ENSO temporal complexity and inter-event pattern diversity (Timmermann et al., 2018, and references therein). El Niño exhibits rich diversity in the sea surface temperature anomaly (SSTA) pattern at its mature phase and is accordingly categorized into two types/flavors- Eastern Pacific (EP) El Niño and Central Pacific (CP) El Niño (Larkin and Harrison, 2005; Ashok et al., 2007; Kao and Yu, 2009; Kug et al., 2009; Yeh et al., 2009; Ren and Jin, 2011). Corresponding to the contrasting spatial pattern and magnitude of the associated SSTA, the two types of El Niño exhibit substantial differences in their impacts (see review articles by Yang et al., 2018; Taschetto et al., 2020; Cai et al., 2021). In contrast to El Niño, La Niña exhibits less obvious pattern diversity (Kug and Ham, 2011).
The distinct feedback processes associated with the two types of El Niño have been well documented. Growth of SSTA during EP and CP El Niño events is accomplished by different combinations of thermocline feedback and zonal advective feedback, with the latter being more (less) important for CP (EP) El Niño (Kug et al., 2009; Capotondi, 2013; Ren and Wang, 2020; Wang and Ren, 2020). The discharge/recharge paradigm serves as delayed-negative feedback and thus contributes to the phase transition of EP El Niño. Such a slow oceanic adjustment process, however, is less distinct for CP El Niño (Kug et al., 2010; McPhaden, 2012; Capotondi, 2013; Ren and Jin, 2013).
A large amount of research efforts has been put forth to advance our understanding of the coexistence of the two types of El Niño. The current understanding of ENSO diversity is generally classified into two camps, representing two distinct possible pathways. The first understanding, which is essentially from the linear perspective, underscores the role played by stochastic processes in generating the two types of ENSO through exciting either two coexisting ENSO-like linear modes or distinct optimal growth (Bejarano and Jin, 2008; Newman et al., 2011a; Newman et al., 2011b; Vimont et al., 2014; Vimont et al., 2022; Chen et al., 2015; Hayashi and Watanabe, 2017; Xie and Jin, 2018). The other understanding emphasizes the effect of nonlinear processes and speculates that the two types of ENSO represent the moderate and extreme regimes of the universal ENSO phenomenon (Takahashi et al., 2011; Takahashi and Dewitte, 2016; Okumura, 2019). Due to their limitations, neither of the above two understandings is conclusive; the dynamics of ENSO diversity is still far from being fully understood. A major roadblock is the intertwining of proposed mechanisms in explaining various aspects of ENSO diversity. To unambiguously disentangle its dynamics, one needs to turn to a simple but comprehensive framework that allows a clean separation among the possible mechanisms.
The classic Cane-Zebiak model (CZ model hereafter; Zebiak and Cane, 1987, ZC87 hereafter), along with its simplified variants (e.g., Jin and Neelin, 1993; Jin, 1997), has dramatically advanced ENSO research as it provides a decent framework for studies on ENSO theory, modeling, and prediction. It is also a useful tool for studying ENSO diversity as it allows testing of contribution from various mechanisms by switching on/off relevant processes. Recently, the CZ model has been utilized to investigate 1) the linear ENSO dynamics of relevance to ENSO diversity (Bejarano and Jin, 2008; Xie and Jin, 2018) and 2) the effects of westerly wind bursts and their interaction with ENSO on ENSO diversity (Chen et al., 2015; Hayashi and Watanabe, 2017). It deserves to point out that the CZ model was built more than three decades ago, when there was not enough observational data, especially oceanic data, to test its validity. With the emerging satellite and in-situ data not long after the model was established, Perigaud and Dewitte (1996) and Dewitte and Perigaud (1996) were able to identify several deficiencies in the CZ model components. It has been noted in Geng (2021) that characteristics of ENSO diversity exhibit strong sensitivity to the mean state and feedback processes, which effectively determine the ENSO regime. Thus, attempts toward understanding ENSO diversity with the CZ model shall be cautious, especially considering that the mean state and model parameters in such an anomaly model are somewhat arbitrary.
Inspired by the convenience of the Cane-Zebiak-type framework for studying ENSO diversity while acknowledging its deficiencies, we aim to build a revised CZ model in which model formulation and parameterization schemes are improved and carefully validated. The model is referred to as RCZ, with “R” denoting “revised”. Section 2 provides the model description and verification of model components against observations. Characteristics of RCZ-simulated ENSO behavior are summarized in Section 3. Summary and some discussions on shortcomings and potential improvements of RCZ are presented in Section 4.
2 Model Description and Verification
2.1 Revisions to the CZ Model
The skeleton of RCZ resembles that of the CZ model, comprising a diagnostic atmospheric model, a prognostic ocean dynamics model, and a prognostic mixed-layer model. All model variables are anomalous fields defined as deviations from the prescribed seasonal-varying mean state. Detailed descriptions of the model equations are provided in the Supplementary Appendix. Key differences in model configurations between RCZ and the CZ model are summarized as follows.
2.1.1 Atmospheric Model
In the CZ model, the tropical surface wind stress anomalies are driven by SSTA-related condensation heating and anomalous circulation-determined convective heating, in which the latter is solved iteratively. However, as numerical convergence for iteration is not guaranteed, especially for the linear stability analysis performed with grid point perturbation which has been utilized to study linear ENSO dynamics (Bejarano and Jin, 2008; Xie and Jin, 2018), the iteration method introduces truncation error and artificial randomness. Anomalous diabatic heating in RCZ, therefore, is solely determined by SSTA in the form of
where
2.1.2 Ocean Dynamics Model
Unlike the CZ model, which adopts the longwave approximation in the ocean dynamics component, RCZ utilizes the full shallow-water model. Instead of separately integrating Kelvin and Rossby wave components as in Cane and Patton (1984) or applying modal decomposition to project oceanic variables onto Hermite polynomials as in Bejarano and Jin (2008), RCZ explicitly resolves the anomalous zonal current, meridional current, and thermocline depth. Furthermore, rather than being assigned a fixed value as in the CZ model, the reduced gravity constant in RCZ is spatial-varying, which effectively relieves the ocean wave over-reflection at the eastern boundary observed in shallow-water model simulations with a fixed reduced gravity constant.
2.1.3 Mixed-Layer Model
The primary difference of the mixed-layer model between RCZ and the CZ model is in the formulation of subsurface temperature parameterization. Yuan et al. (2020) found that the parameterization scheme in the CZ model 1) artificially introduces an over-strong El Niño/La Niña asymmetry and 2) underestimates subsurface temperature anomalies in the central Pacific (also see Figure 1). Inspired by ZC87 and Yuan et al. (2020), a subsurface temperature parameterization is proposed as
where
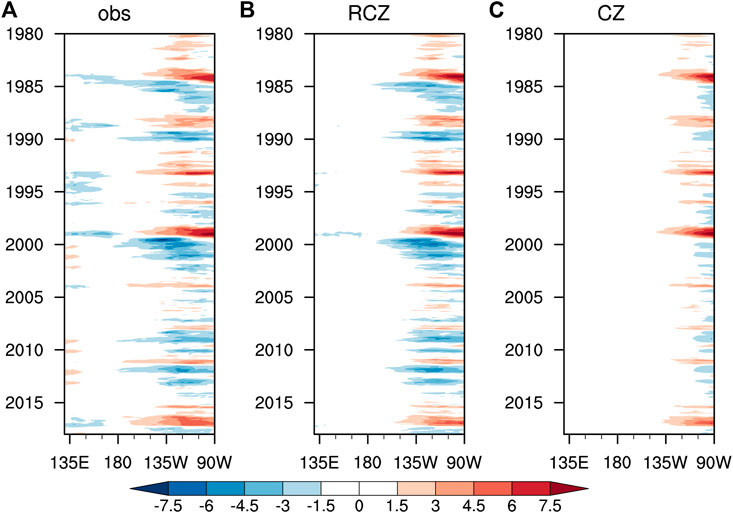
FIGURE 1. (A) Time evolution of the observed equatorial (5°S–5°N average) subsurface temperature anomalies (unit: °C) over the Pacific during 1980–2018. (B,C) Same as (A) but for subsurface temperature anomalies parameterized through Eq. 2 and Equations A12 and A13 in ZC87, respectively. The subsurface temperature is defined as the temperature at the depth of
Though the mixed layer depth (MLD) is prescribed and assumed to be fixed in RCZ and the CZ model, it varies spatially and temporally in realistic situations. Variation of mixed layer temperature defined with fixed MLD, which is essentially vertically averaged temperature over the upper-level rather than the real mixed layer, is generally of larger magnitude than that of the corresponding SSTA if the mixed layer is shallower than the prescribed MLD, for instance in the eastern Pacific. Rather than assuming SSTA to be equivalent to MLTA as in the CZ model, RCZ takes into consideration the deficiency of fixed MLD approximation and empirically relates SSTA to MLTA in an empirical way (Supplementary Appendix Equation A10). A close relationship between the observed SSTA and that parameterized with MLTA validates our empirical formulation (Figure 2).
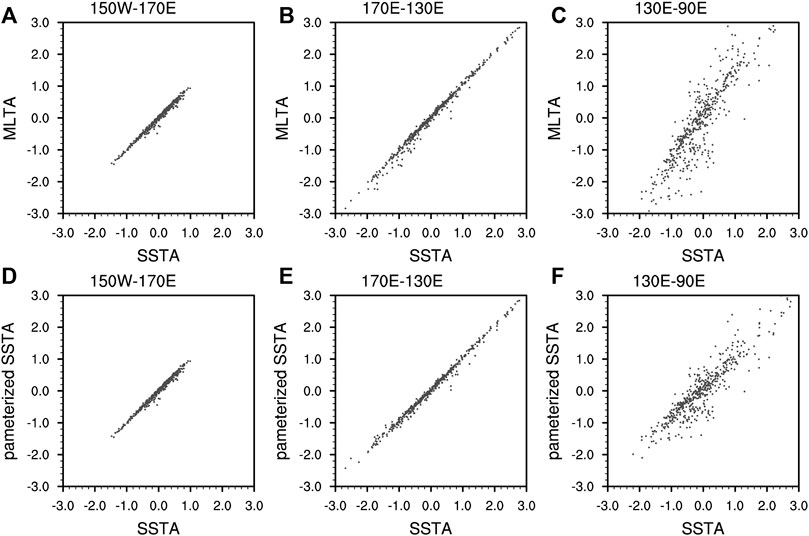
FIGURE 2. Scatter plot of the observed equatorial (5°S–5°N average) SSTA (unit: °C) vs. MLTA (unit: °C) averaged over (A) the western Pacific, (B) the central Pacific, and (C) the eastern Pacific during 1979–2018. Longitude boundaries of the above three regions are indicated on top of each plot. (D–F) Same as (A–C) but for the scatter plot of the observed and parameterized equatorial SSTA. The observed SSTA and MLTA are obtained from the ORAS5 dataset; the parameterized SSTA is calculated from the observed MLTA following Supplementary Appendix Equation A10. MLTA is defined as the anomalous vertical averaged temperature within the upper 50 m.
2.1.4 Stochastic Forcing
The original CZ model introduced in ZC87 is a purely deterministic model in which irregularities emerge primarily through nonlinear processes. In subsequent studies with the CZ model, stochastic processes have been incorporated in the form of white/red noise forcing or episodic westerly wind burst (WWB) occurrences. A parameterization scheme of state-dependent WWBs similar to that in Hayashi and Watanabe (2017) is proposed to describe the stochastic forcing. In contrast to some previous studies, both the mechanical and thermal forcing effects from WWBs are included in RCZ.
2.1.5 Numerical Scheme
The model domain for RCZ is within a closed tropical Pacific basin, bounded by a north/south boundary at 30°N/30°S and artificial meridional boundaries mimicking the realistic tilted coastline along the Maritime Continent and North America (Figure 3). The model has a resolution of 1° (meridional) × 2.5° (zonal). The ocean dynamics variables are discretized on the staggered Arakawa C-grid. The ocean current is subject to the non-slip and no-normal flow boundary condition. MLTA is subject to the no-flux boundary condition. The advection terms in the mixed layer model are calculated through the upwind finite-difference scheme. The prognostic model components are integrated forward using the semi-implicit Euler method, with a time step of 4 h. All model components are instantaneously coupled at each time step.
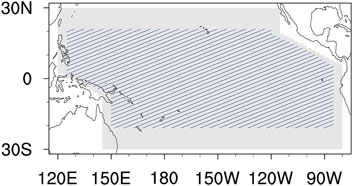
FIGURE 3. Spatial domain for the ocean dynamics model (gray shading) and mixed layer model (blue hatching) of RCZ.
2.2 Verification of Model Components
Model components are verified via the standalone (i.e., uncoupled) mode. Specifically, observed SSTAs are prescribed to drive the atmospheric model, and observed wind stress anomalies are prescribed to drive the ocean dynamics model and the mixed layer model. Comparison between the observations and the model-simulated responses allows verification of each model component. The above verification procedures are repeated, except that the CZ model is utilized instead, to compare RCZ with the CZ model, The prescribed seasonal-varying mean state is obtained through the ensemble mean of multiple in-situ and reanalysis-based datasets listed in Table 1. The corresponding observed anomalies, covering 1980–2018, are obtained after removing the long-term climatology and then de-trending.
2.2.1 Atmospheric Model
As meridional wind stress anomalies play a minor role in driving oceanic responses on ENSO timescale, we compare the observed and the model-simulated zonal wind stress anomalies to verify the atmospheric model. Given the observed SSTA, RCZ satisfactorily captures the variation of equatorial zonal wind stress anomalies (Figure 4). The over-strong eastern Pacific wind stress response identified in the CZ model is significantly alleviated in the RCZ simulation. The correlation coefficient between the observed and RCZ-simulated equatorial zonal wind stress anomalies over the western-to-central Pacific, where maximum wind stress anomalies locate, reaches 0.92 (Figure 5). In comparison, the CZ model simulation exhibits less correlation with the observation and a larger root mean square error. As indicated by the composite analysis shown in Figure 6, the spatial pattern and the magnitude of zonal wind stress anomalies during the mature phase (i.e., November to January) of the two types of El Niño and La Niña are well captured by RCZ. In contrast, the CZ model-simulated equatorial (off-equatorial) zonal wind stress anomalies to the west (east) of SSTA maximum are significantly weaker (stronger) than observed.
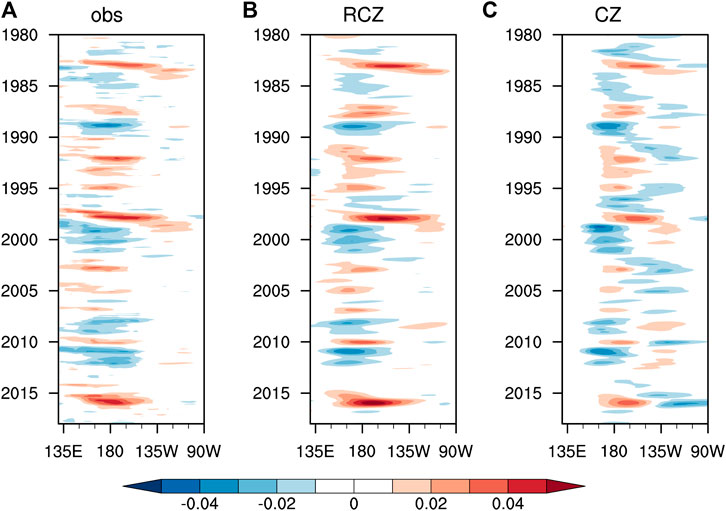
FIGURE 4. Time evolution of (A) the observed, (B) the RCZ-simulated, and (C) the CZ model-simulated equatorial (5°S–5°N average) zonal wind stress anomalies (unit: N/m2) during 1980–2018. The model simulations are performed with the atmospheric component only and are driven by the observed SSTA.
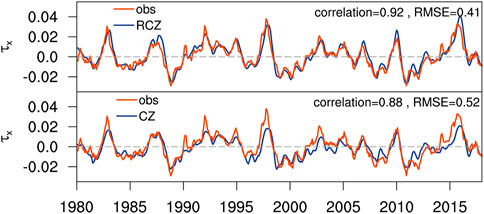
FIGURE 5. Upper panel: Time series of the observed (red line) and RCZ-simulated (blue line) equatorial (5°S–5°N average) zonal wind stress anomalies averaged between 150°E and 150°W. The correlation between the red line and the blue line, along with the standardized root mean square error of the simulated equatorial zonal wind stress anomalies, is indicated in the upper-right corner. Setting of the model simulation is the same as that in Figure 4. The zonal wind stress anomalies have been smoothed through the 3-month running average. Lower panel: Same as the upper panel, except that the blue line denotes the CZ model-simulated equatorial zonal wind stress anomalies.
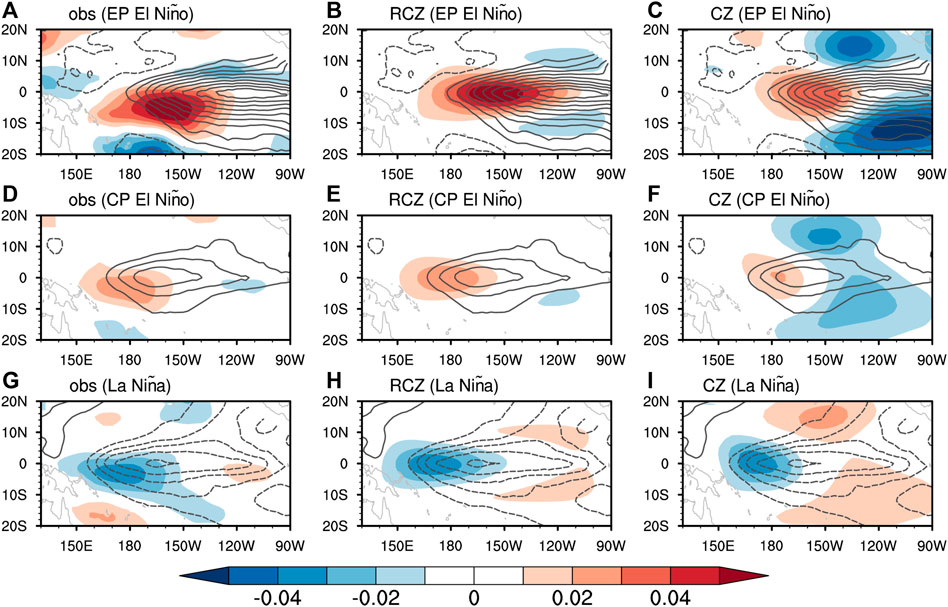
FIGURE 6. Composited November-December-January (NDJ) average zonal wind stress anomalies (shading; unit: N/m2) associated with EP El Niño, CP El Niño, and La Niña in (A,D,G) the observations, (B,E,H) the RCZ atmospheric component simulation, and (C,F,I) the CZ model atmospheric component simulation. Contours in each plot denote the corresponding observed SSTA. The contour level is 0.4°C, and dashed contours represent cold SSTA. EP El Niño (1982, 1997)/CP El Niño (1990, 1991, 1994, 2002, 2004, 2009) years are selected as the monthly E-index/C-index (Takahashi et al., 2011) exceeds one standard deviation from October to February. La Niña years (1988, 1998, 1999, 2007, 2010) are similarly selected as Niño 3.4 index is smaller than minus-one standard deviation.
The major discrepancy between the observations and the RCZ simulation lies in the meridional structure of wind stress anomalies. During the mature phase of ENSO (i.e., boreal winter), the observed zonal wind stress anomalies center to the south of the equator. The model simulated zonal wind stress anomalies, however, straddle along the equator. Considering that the corresponding SSTA forcing is generally symmetric about the equator, the absence of north-south asymmetry in zonal wind stress anomalies indicates the deficiency of the assumption that SSTA solely determines the atmospheric response. Gong and Li (2021) found that the asymmetric mean state about the equator during boreal winter plays a key role in the southward shift of zonal wind stress anomalies. It is to bear in mind that in the current version of RCZ, an at-rest mean state has been assumed in the atmospheric model. In addition, the moisture processes involved in the circulation-convection interaction have not been explicitly incorporated. Thus, the modulation effect of asymmetric mean states shall be taken into consideration in a more realistic atmospheric model with circulation-convection interaction included.
To test the validity of the atmospheric nonlinearity introduced in RCZ, we compare the atmospheric response to prescribed EP and CP El Niño-like SST forcing with varying amplitudes simulated by an AGCM (Community Atmospheric Model, CAM4; Neale et al., 2010) and the atmospheric model of RCZ (not shown). Consistent with the observations, the atmospheric response in CAM4 exhibits relatively strong (weak) nonlinearity to EP (CP) El Niño-like SST forcing. Such atmospheric nonlinearity to prescribed SST forcing is satisfactorily reproduced in RCZ simulation, thus validating the nonlinear formulation of diabatic heating proposed in Eq. 1.
2.2.2 Ocean Dynamics Model and Mixed Layer Model
The oceanic component of RCZ, consisting of the ocean dynamics model and the mixed layer model, is verified via uncoupled simulation forced with the observed wind stress anomalies. The ocean dynamics responses (i.e., anomalous thermocline depth, surface zonal current, and upwelling) exhibit a strong resemblance to the observations, except that the simulated zonal surface current near the eastern boundaries is slightly weaker than the observations (not shown).
The advantages of RCZ over the CZ model are most evident in the simulation of SSTA. Time evolution of equatorial SSTA indicates that most observed ENSO events are successfully reproduced in RCZ (Figures 7A,B). The correlation coefficients of the eastern Pacific and central Pacific SSTA between the observations and the RCZ simulation reach 0.91 and 0.92, both exceeding the 99.9% confidence level (Figure 8). The correlation coefficient/standardized root mean square error for the CZ model simulation is smaller/larger than that for the RCZ simulation. As shown in the composite analysis (Figure 9), the observed spatial patterns associated with the two types of El Niño and La Niña are satisfactorily captured in RCZ. The CZ model, however, fails to distinguish CP El Niño from EP El Niño, and it can hardly capture La Niña (Figures 7C, 9). The too-weak CP El Niño and La Niña in the CZ model possibly result from the deficient subsurface temperature parameterization scheme (Figure 1). In RCZ, the dynamical damping in the central Pacific is partially offset by the mean advection of subsurface temperature anomalies, thus allowing the emergence of CP El Niño and La Niña. In contrast, such offset is less evident in the CZ model, making the dynamical damping dominate over the mean advection of subsurface temperature anomalies.
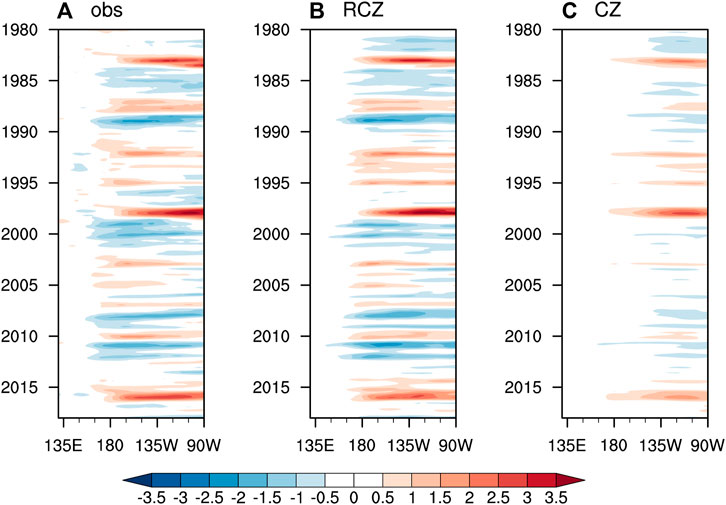
FIGURE 7. Time evolution of (A) the observed, (B) the RCZ-simulated, and (C) the CZ model-simulated equatorial (5°S–5°N average) SSTA (unit: °C) during 1980–2018. The model simulations are performed with the oceanic component only and are driven by the observed wind stress anomalies.
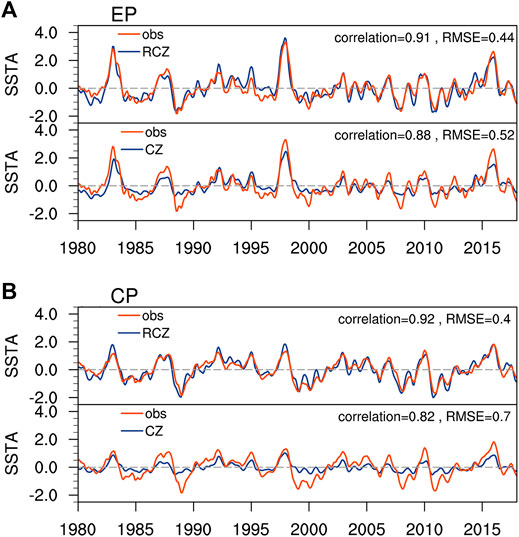
FIGURE 8. (A) upper panel: Time series of the observed (red line) and RCZ-simulated (blue line) equatorial (5°S–5°N average) EP SSTA (i.e., averaged between 140°W and 90°W). The correlation between the red line and the blue line, along with the standardized root mean square error of the simulated EP SSTA, is indicated in the upper-right corner. Settings of the model simulation are the same as that in Figure 5. SSTA has been smoothed through the 3-month running average. (A) lower panel: Same as the upper panel, except that the blue line denotes the CZ model-simulated equatorial EP SSTA. (B) Same as (A) but for the equatorial CP SSTA (i.e., averaged between 170°E and 140°W).
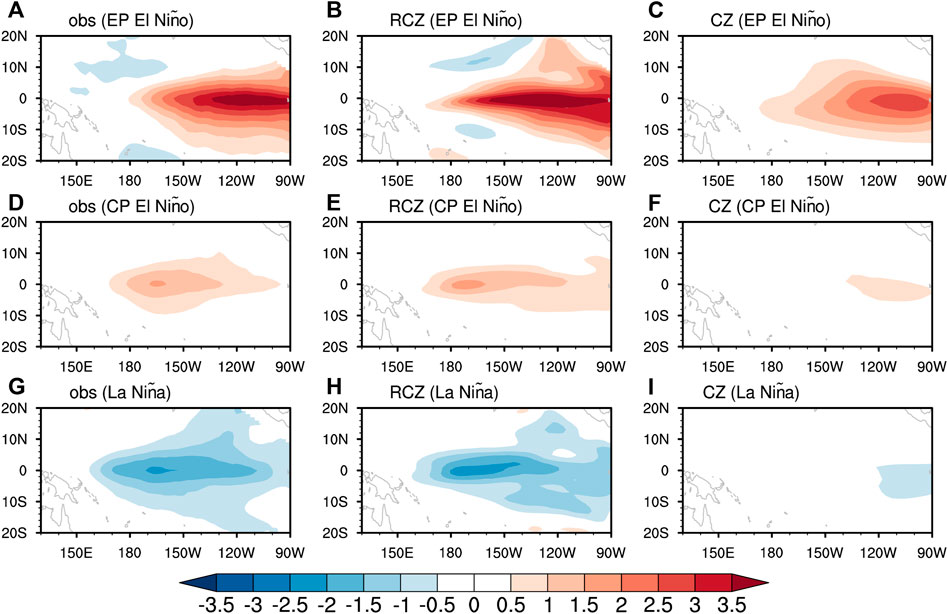
FIGURE 9. Composited November-December-January (NDJ) average SSTA (shading; unit: °C) associated with EP El Niño, CP El Niño, and La Niña in (A,D,G) the observations, (B,E,H) the RCZ oceanic component simulation, and (C,F,I) the CZ model oceanic component simulation. EP El Niño, CP El Niño, and La Niña years are selected as in Figure 6.
Compared with those observed, the EP El Niño SSTA pattern in RCZ extends more westward toward the warm pool. Such excessive warming in the equatorial central-western Pacific is a common bias in climate models and is arguably attributed to the model-simulated stronger-than-observation mean zonal temperature gradient (Chen et al., 2021; Jiang et al., 2021). Interestingly, it is to be noted that the mean zonal temperature gradient in RCZ is prescribed as observed. The reason for the SSTA pattern bias in RCZ is thus worthy of further investigation. In addition, the RCZ-simulated ENSO patterns are of a slightly smaller meridional scale, for which the reason is possibly related to the biased ocean circulation response and needs to be further studied.
3 ENSO Diversity in RCZ
3.1 General ENSO Behavior
To evaluate the performance of RCZ in simulating ENSO features, we perform a 5000-year coupled simulation with default model settings. The prescribed seasonal-varying mean state is obtained from the long-term averaged observations. The Hovmöller diagram of a 120-year segment of the RCZ-simulated equatorial SSTA, as shown in Figure 10, exhibits intermittency of ENSO activity, with more or less frequent occurrences of ENSO events in various epochs/decades. The intensity of the tropical Pacific interannual variability, measured by the standard deviation of SSTA, is shown in Figure 11. Consistent with the observations, RCZ-simulated SSTA variability is strongest in the central-eastern Pacific. However, the amplitude of SSTA variability is stronger in RCZ than in the observations. Such inconsistency is partly due to the fact that ENSO simulated in RCZ exhibits less irregularity than in the observations. As shown in the Hovmöller diagram of equatorial SSTA in Figure 10, warm and cold events tend to occur alternatively in active ENSO epochs. In contrast, observed El Niño events, especially for CP El Niño, are more-or-less episodic-like rather than being regularly followed by La Niña events (Figure 7A). The underestimated irregularity in RCZ indicates that ENSO behavior in active decades may reside in the self-sustained regime.
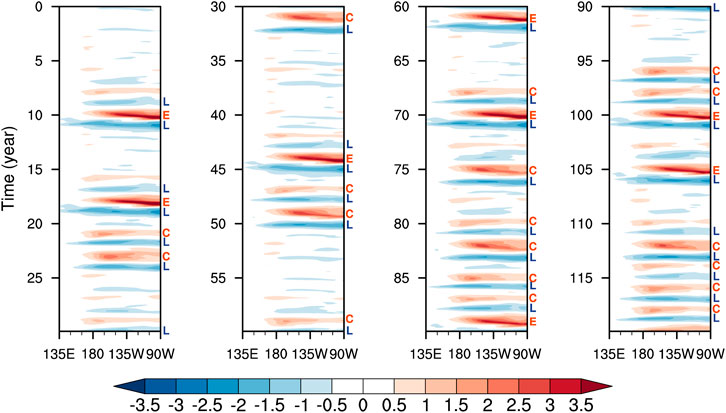
FIGURE 10. Hovmöller diagram of 120-year RCZ simulated equatorial (5°S–5°N average) SSTA (unit: °C). The 120-year segment of data is from the 5000-year simulation and is separated into four consecutive 30-year segments for display. The type of each ENSO event is indicated on the right-hand-side of the Hovmöller diagram, with red “E” denoting EP El Niño, red “C” denoting CP El Niño, and blue “L” denoting La Niña.
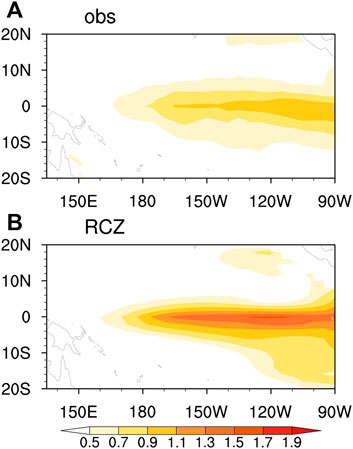
FIGURE 11. The standard deviation of SSTA (unit: °C) in (A) the observations and (B) the 5000-year RCZ coupled simulation. The observed standard deviation is calculated with the HadISST dataset covering 1900–2018.
The phase-locking behavior of ENSO is examined via the seasonal standard deviation of the Niño 3 index (Figure 12A). Again, the standard deviation in the RCZ simulation is stronger than in the observations. Consistent with the observations, ENSO events tend to see peak phases in boreal winter, as indicated by the strongest Niño 3 index variability from November to January. The minimum amplitude of Niño 3 index variability in RCZ, however, is slightly shifted by 2-month compared with the observations. The relationship between seasonal ENSO stability and ENSO phase locking has been well noted (e.g., Chen and Jin, 2020). In the current version of RCZ, the stability of the coupled system is solely determined by the seasonal cycle of oceanic variables. By considering the atmospheric control over the ENSO stability associated with the seasonal migration of the Intertropical Convergence Zone (ITCZ) and the South Pacific Convergence Zone (SPCZ), the simulated ENSO phase-locking may be further improved.
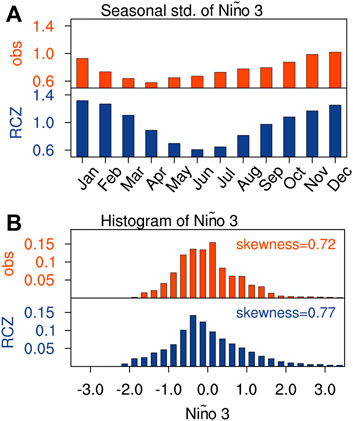
FIGURE 12. (A) Seasonal standard deviation of Niño 3 index (unit: °C) in the observations (upper panel; red bars) and the RCZ simulation (lower panel; blue bars). (B) Histogram of the monthly Niño 3 index (unit: °C) in the observations (upper panel; red bars) and the RCZ simulation (lower panel; blue bars). The bin size is 0.2°C.
The observed El Niño/La Niña asymmetry is also successfully reproduced in RCZ (Figure 12B). The monthly Niño 3 index is skewed toward the positive end in the observations and the RCZ simulation, with the skewness [calculated following An and Jin (2004)] being 0.72 and 0.77, respectively.
3.2 Characteristics of ENSO Bi-Modality
ENSO pattern diversity can be clearly identified in the Hovmöller diagram of the RCZ-simulated equatorial SSTA (Figure 10). Warm events are generally categorized into two groups, with maximum SSTA at the peak phase located either over the eastern Pacific or slightly to the east of the dateline. Consistent with previous observational findings (e.g., Kug and Ham, 2011), cold events exhibit less pattern diversity, and the associated SSTA spans broadly over the central-to-eastern Pacific. To better distinguish the different ENSO types, El Niño events are first identified according to the following criteria: equatorial SSTA averaged over the eastern Pacific region (i.e., 140°W–90°W) or the central Pacific region (i.e., 170°E–140°W) exceeds 0.5°C for five consecutive months. La Niña events are similarly identified but with the threshold being −0.5°C. As shown in Figure 13A, the probability density function (PDF) for the centroid longitude of equatorial SSTA at the peak phase of El Niño events exhibits double peaks. In contrast, only a single peak exists in the PDF for La Niña’s centroid longitude (Figure 13B). Here, the centroid longitude of SSTA is defined as
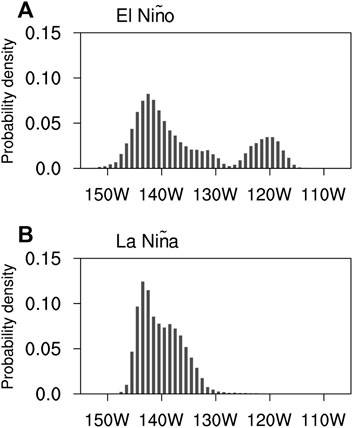
FIGURE 13. Probability density function (PDF) for the centroid longitude of equatorial SSTA at the peak phase of (A) El Niño events and (B) La Nina events. The PDF is estimated based on binned histograms from the 5000-year simulation. The width of the bins is one degree in longitude.
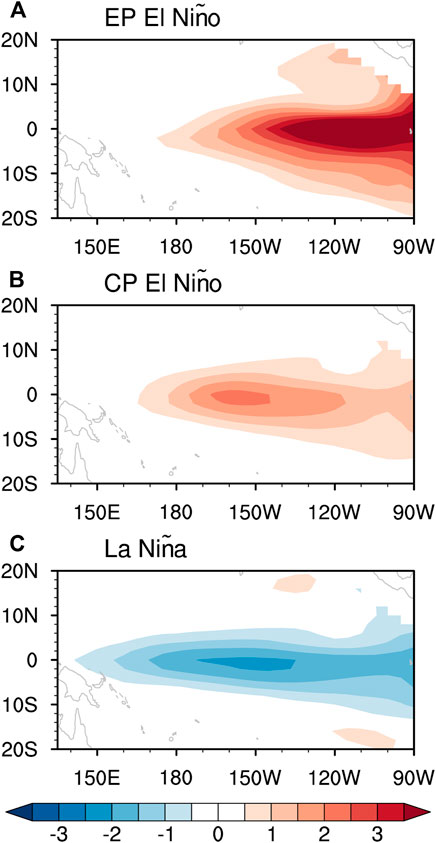
FIGURE 14. Composites of SSTA pattern at the peak phase of (A) EP El Niño, (B) CP El Niño, and (C) La Niña. See text for criteria of the El Niño/La Niña events.
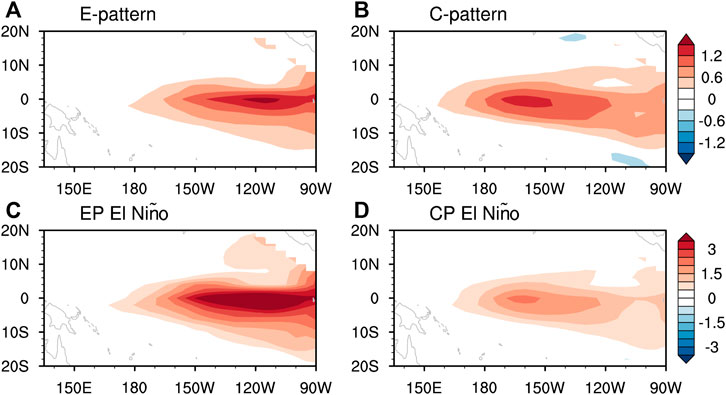
FIGURE 15. Regressed SSTA pattern against the November-December-January average (A) E-index and (B) C-index. See text for the definition of the indices. (C,D) Composites of SSTA pattern associated with EP El Niño and CP El Niño. The two types of El Niño are identified with the E-index and C-index exceeding their respective one standard deviation.
Besides the centroid longitude of SSTA, the intensity of ENSO events exhibits bi-modality as well. As shown in Figure 16, the trajectory of ENSO events generally features two distinct orbits (i.e., one with a larger amplitude and the other one with a smaller amplitude), reminiscent of the strong and moderate ENSO regimes identified in Takahashi and Dewitte (2016) and Takahashi et al. (2019). The two aspects of ENSO bi-modality shall bear strong correspondence with each other.
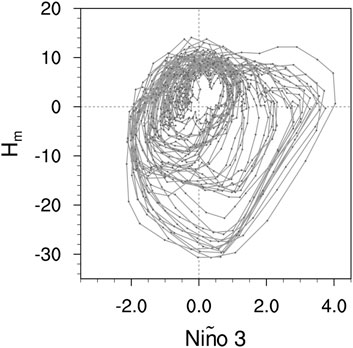
FIGURE 16. Trajectories of ENSO events in the Niño 3 index (unit: °C; horizontal axis)–zonal mean thermocline fluctuation (unit: m; vertical axis) phase space. A total of ten percent of all the simulated ENSO events are randomly chosen for display.
4 Summary and Discussion
By acknowledging its potential practical usage in investigating dynamics of ENSO diversity while observing some shortcomings in its model components, the CZ model has been revised in terms of the model formulation and parameterization schemes while keeping the model skeleton unchanged. The new model, named RCZ, is carefully validated against observations through the standalone mode. When forced with observed SSTA (wind stress anomalies), the simulated atmospheric (oceanic) responses in RCZ resemble those observed to a much more satisfying extent than that in the CZ model. Aspects of the observed ENSO characteristics (i.e., ENSO amplitude, phase-locking, and El Niño/La Niña asymmetry) are reasonably reproduced in the coupled simulation with RCZ. In addition, the observed ENSO bi-modality is well captured in RCZ, where EP and CP El Niño, of which the spatial patterns resemble those observed, are clearly distinguished. A number of studies using various intermediate coupled models, including the CZ model, have arguably simulated ENSO diversity/complexity to a satisfying extent (Chen et al., 2015; Hayashi and Watanabe, 2017; Xie and Jin, 2018; Chen et al., 2022). Though the two types of El Niño identified with RCZ exhibit more realistic characteristics than some of the previous studies, it is not the purpose of this study to argue that RCZ outperforms other intermediate coupled models in simulating the observed ENSO diversity. Instead, this study aims to provide a framework in which all the model components accurately describe the realistic physical processes so as to ensure that ENSO diversity is simulated for the right reason. It is to bear in mind that interpretation of ENSO diversity in a model with biased physics may be misleading.
The major discrepancy between the observed and RCZ-simulated ENSO behavior is its temporal characteristics. In comparison with the observations, RCZ-simulated ENSO events exhibit less irregularity. The underestimated irregularity may be attributed to a lack of tropical basin-interaction (Ham et al., 2013a; Ham et al., 2013b), ENSO’s interaction with Pacific Meridional Modes (Yu et al., 2010; Vimont et al., 2014; Vimont et al., 2022), and ENSO-Tropical Instability Wave (TIW) interaction (An, 2008). Furthermore, RCZ fails to capture the observed El Niño/La Niña duration asymmetry and the contrasting time-evolution of the two types of ENSO (Dommenget et al., 2013). Generally, in the observations, EP El Niño experiences rapid termination and phase transition after the mature phase, whereas the subsequent La Niña persists through the second year or longer (Okumura and Deser, 2010). CP El Niño, on the other hand, is more episodic-like and exhibits less apparent phase reversal. Several nonlinear processes (e.g., ENSO-TIW interaction, nonlinear convective heating response, and nonlinear radiative fluxes) have been suggested to play some role in the ENSO duration asymmetry. Whether incorporating these nonlinear processes in RCZ benefits the simulation of ENSO duration asymmetry deserves to be further explored.
As discussed in Section 2.2, the major flaw associated with the atmospheric model of RCZ resides in parameterizing diabatic heating as being solely dependent on SSTA. The important role of circulation-convection interaction in shaping tropical atmospheric response has been widely acknowledged (Webster, 1981; Weare, 1986; Kleeman, 1991; Gong and Li, 2021). Furthermore, Wu et al. (2000) noticed that the atmospheric response is sensitive to the vertical structure of convective heating, further casting doubts on the appropriateness of the Gill model. In the future version of RCZ, we seek to replace the Gill-type atmospheric model with a simplified primitive equation model.
The shallow water approximation, on the other hand, is suggested to be insufficient in capturing equatorial ocean dynamics by noticing the significant contribution to surface zonal current and sea surface height anomalies from multiple baroclinic modes, especially in the vicinity of the dateline (Dewitte et al., 1999; Dewitte, 2000; Zhao et al., 2021). On the other hand, the high-order baroclinic modes contribute to a vertically slanted structure of upper-level ocean temperature anomaly in the central Pacific, thus degrading the assumption that the subsurface temperature anomaly at a fixed depth can be parameterized as being linearly related to the thermocline fluctuation (Zhao et al., 2021). In the future version of RCZ, we aim to implement a simplified linear continuously stratified model with which the integrated effects of high-order baroclinic modes are empirically parameterized.
The well-calibrated and validated RCZ allows a systematic investigation of the linear and nonlinear dynamics of ENSO diversity. Effects of atmospheric convective nonlinearity, stochastic processes, and ENSO’s interaction with various tropical climate variability will be further studied in a forthcoming paper.
Data Availability Statement
Publicly available datasets were analyzed in this study. This data can be found here: https://psl.noaa.gov/data/gridded/; http://apdrc.soest.hawaii.edu/data/data.php.
Author Contributions
LG designed the model, performed the research, and wrote the manuscript. F-FJ contributed to discussion and revision of the manuscript.
Funding
This study is supported by the United States National Science Foundation (AGS-1813611) and the United States Department of Energy (DESC0005110).
Conflict of Interest
The authors declare that the research was conducted in the absence of any commercial or financial relationships that could be construed as a potential conflict of interest.
Publisher’s Note
All claims expressed in this article are solely those of the authors and do not necessarily represent those of their affiliated organizations, or those of the publisher, the editors and the reviewers. Any product that may be evaluated in this article, or claim that may be made by its manufacturer, is not guaranteed or endorsed by the publisher.
Supplementary Material
The Supplementary Material for this article can be found online at: https://www.frontiersin.org/articles/10.3389/feart.2022.899323/full#supplementary-material
References
An, S.-I. (2008). Interannual Variations of the Tropical Ocean Instability Wave and ENSO. J. Clim. 21, 3680–3686. doi:10.1175/2008jcli1701.1
An, S.-I., and Jin, F.-F. (2004). Nonlinearity and Asymmetry of ENSO*. J. Clim. 17, 2399–2412. doi:10.1175/1520-0442(2004)017<2399:naaoe>2.0.co;2
An, S.-I., and Kim, J.-W. (2017). Role of Nonlinear Ocean Dynamic Response to Wind on the Asymmetrical Transition of El Niño and La Niña. Geophys. Res. Lett. 44, 393–400. doi:10.1002/2016GL071971
Ashok, K., Behera, S. K., Rao, S. A., Weng, H., and Yamagata, T. (2007). El Niño Modoki and its Possible Teleconnection. J. Geophys. Res. 112. doi:10.1029/2006jc003798
Balmaseda, M. A., Vidard, A., and Anderson, D. L. T. (2008). The ECMWF Ocean Analysis System: ORA-S3. Monthly Weather Rev. 136, 3018–3034. doi:10.1175/2008MWR2433.1
Behringer, D., and Xue, Y. (2004). “January. Evaluation of the Global Ocean Data Assimilation System at NCEP: The Pacific Ocean,” in Proc. Eighth Symp. On Integrated Observing and Assimilation Systems for Atmosphere, Oceans, and Land Surface. Seattle, WA: Amer. Meteor. Soc., 2.3.
Bejarano, L., and Jin, F.-F. (2008). Coexistence of Equatorial Coupled Modes of ENSO*. J. Clim. 21, 3051–3067. doi:10.1175/2007JCLI1679.1
Cai, W., Santoso, A., Collins, M., Dewitte, B., Karamperidou, C., Kug, J.-S., et al. (2021). Changing El Niño-Southern Oscillation in a Warming Climate. Nat. Rev. Earth Environ. 2, 628–644. doi:10.1038/s43017-021-00199-z
Cane, M. A., and Patton, R. J. (1984). A Numerical Model for Low-Frequency Equatorial Dynamics. J. Phys. Oceanogr. 14, 1853–1863. doi:10.1175/1520-0485(1984)014<1853:anmflf>2.0.co;2
Capotondi, A. (2013). ENSO Diversity in the NCAR CCSM4 Climate Model. J. Geophys. Res. Oceans 118, 4755–4770. doi:10.1002/jgrc.20335
Capotondi, A., Wittenberg, A. T., Kug, J.-S., Takahashi, K., and McPhaden, M. J. (2020). ENSO Diversity, in El Niño Southern Oscillation in a Changing Climate. Editors M. J. McPhaden, A. Santoso, and W. Cai, Geophysical Monograph Series, AGU, 65–86. doi:10.1002/9781119548164
Carton, J. A., Chepurin, G. A., and Chen, L. (2018). SODA3: A New Ocean Climate Reanalysis. J. Clim. 31, 6967–6983. doi:10.1175/JCLI-D-18-0149.1
Chen, D., Lian, T., Fu, C., Cane, M. A., Tang, Y., Murtugudde, R., et al. (2015). Strong Influence of westerly Wind Bursts on El Niño Diversity. Nat. Geosci 8, 339–345. doi:10.1038/ngeo2399
Chen, H.-C., and Jin, F.-F. (2020). Fundamental Behavior of ENSO Phase Locking. J. Clim. 33, 1953–1968. doi:10.1175/JCLI-D-19-0264.1
Chen, H.-C., Jin, F.-F., Zhao, S., Wittenberg, A. T., and Xie, S. (2021). ENSO Dynamics in the E3SM-1-0, CESM2, and GFDL-CM4 Climate Models. J. Clim. 34, 1–59. doi:10.1175/JCLI-D-21-0355.1
Chen, N., Fang, X., and Yu, J.-Y. (2022). A Multiscale Model for El Niño Complexity. Npj Clim. Atmos. Sci. 5, 1–13. doi:10.1038/s41612-022-00241-x
Choi, K.-Y., Vecchi, G. A., and Wittenberg, A. T. (2013). ENSO Transition, Duration, and Amplitude Asymmetries: Role of the Nonlinear Wind Stress Coupling in a Conceptual Model. J. Clim. 26, 9462–9476. doi:10.1175/JCLI-D-13-00045.1
Dewitte, B., and Perigaud, C. (1996). El Niño-La Niña Events Simulated with Cane and Zebiak's Model and Observed with Satellite or In Situ Data. Part II: Model Forced with Observations. J. Clim. 9, 1188–1207. doi:10.1175/1520-0442(1996)009<1188:enlnes>2.0.co;2
Dewitte, B., Reverdin, G., and Maes, C. (1999). Vertical Structure of an OGCM Simulation of the Equatorial Pacific Ocean in 1985-94. J. Phys. Oceanogr. 29, 1542–1570. doi:10.1175/1520-0485(1999)029<1542:vsoaos>2.0.co;2
Dewitte, B. (2000). Sensitivity of an Intermediate Ocean-Atmosphere Coupled Model of the Tropical Pacific to its Oceanic Vertical Structure. J. Clim. 13, 2363–2388. doi:10.1175/1520-0442(2000)013<2363:soaioa>2.0.co;2
Dieppois, B., Capotondi, A., Pohl, B., Chun, K. P., Monerie, P.-A., and Eden, J. (2021). ENSO Diversity Shows Robust Decadal Variations that Must Be Captured for Accurate Future Projections. Commun. Earth Environ. 2, 1–13. doi:10.1038/s43247-021-00285-6
Dommenget, D., Bayr, T., and Frauen, C. (2013). Analysis of the Non-linearity in the Pattern and Time Evolution of El Niño Southern Oscillation. Clim. Dyn. 40, 2825–2847. doi:10.1007/s00382-012-1475-0
Frauen, C., and Dommenget, D. (2010). El Niño and La Niña Amplitude Asymmetry Caused by Atmospheric Feedbacks. Geophys. Res. Lett. 37, a–n. doi:10.1029/2010GL044444
Garreaud, R. D. (2018). A Plausible Atmospheric Trigger for the 2017 Coastal El Niño. Int. J. Climatol 38, e1296–e1302. e1302. doi:10.1002/joc.5426
Gelaro, R., McCarty, W., Suárez, M. J., Todling, R., Molod, A., Takacs, L., et al. (2017). The Modern-Era Retrospective Analysis for Research and Applications, Version 2 (MERRA-2). J. Clim. 30, 5419–5454. doi:10.1175/JCLI-D-16-0758.1
Geng, L. (2021). Dynamics of El Niño-Southern Oscillation Diversity in an Intermediate Coupled Model (Ph.D. Dissertation). Honolulu: University of Hawai’i at Manoa.
Gong, Y., and Li, T. (2021). Mechanism for Southward Shift of Zonal Wind Anomalies during the Mature Phase of ENSO. J. Clim. 1, 1–45. doi:10.1175/jcli-d-21-0078.1
Ham, Y.-G., Kug, J.-S., Park, J.-Y., and Jin, F.-F. (2013b). Sea Surface Temperature in the north Tropical Atlantic as a Trigger for El Niño/Southern Oscillation Events. Nat. Geosci 6, 112–116. doi:10.1038/ngeo1686
Ham, Y.-G., Kug, J.-S., and Park, J.-Y. (2013a). Two Distinct Roles of Atlantic SSTs in ENSO Variability: North Tropical Atlantic SST and Atlantic Niño. Geophys. Res. Lett. 40, 4012–4017. doi:10.1002/grl.50729
Hayashi, M., and Watanabe, M. (2017). ENSO Complexity Induced by State Dependence of westerly Wind Events. J. Clim. 30, 3401–3420. doi:10.1175/JCLI-D-16-0406.1
Hersbach, H., Bell, B., Berrisford, P., Hirahara, S., Horányi, A., Muñoz‐Sabater, J., et al. (2020). The ERA5 Global Reanalysis. Q.J.R. Meteorol. Soc. 146, 1999–2049. doi:10.1002/qj.3803
Hirahara, S., Ishii, M., and Fukuda, Y. (2014). Centennial-Scale Sea Surface Temperature Analysis and its Uncertainty. J. Clim. 27, 57–75. doi:10.1175/JCLI-D-12-00837.1
Huang, B., Thorne, P. W., Banzon, V. F., Boyer, T., Chepurin, G., Lawrimore, J. H., et al. (2017). Extended Reconstructed Sea Surface Temperature, Version 5 (ERSSTv5): Upgrades, Validations, and Intercomparisons. J. Clim. 30, 8179–8205. doi:10.1175/JCLI-D-16-0836.1
Jiang, W., Huang, P., Huang, G., and Ying, J. (2021). Origins of the Excessive Westward Extension of ENSO SST Simulated in CMIP5 and CMIP6 Models. J. Clim. 34, 2839–2851. doi:10.1175/JCLI-D-20-0551.1
Jin, F.-F. (1997). An Equatorial Ocean Recharge Paradigm for ENSO. Part II: A Stripped-Down Coupled Model. J. Atmos. Sci. 54, 830–847. doi:10.1175/1520-0469(1997)054<0830:aeorpf>2.0.co;2
Jin, F.-F., and Neelin, J. D. (1993). Modes of Interannual Tropical Ocean-Atmosphere Interaction-A Unified View. Part I: Numerical Results. J. Atmos. Sci. 50, 3477–3503. doi:10.1175/1520-0469(1993)050<3477:moitoi>2.0.co;2
Kanamitsu, M., Ebisuzaki, W., Woollen, J., Yang, S.-K., Hnilo, J. J., Fiorino, M., et al. (2002). NCEP-DOE AMIP-II Reanalysis (R-2). Bull. Am. Meteorol. Soc. 83, 1631–1643. doi:10.1175/BAMS-83-11-1631
Kang, I.-S., and Kug, J.-S. (2002). El Niño and La Niña Sea Surface Temperature Anomalies: Asymmetry Characteristics Associated with Their Wind Stress Anomalies. J. Geophys. Res. 107, ACL 1-1–ACL 1-10. doi:10.1029/2001JD000393
Kao, H.-Y., and Yu, J.-Y. (2009). Contrasting Eastern-Pacific and central-Pacific Types of ENSO. J. Clim. 22, 615–632. doi:10.1175/2008JCLI2309.1
Kleeman, R. (1991). A Simple Model of the Atmospheric Response to ENSO Sea Surface Temperature Anomalies. J. Atmos. Sci. 48, 3–19. doi:10.1175/1520-0469(1991)048<0003:asmota>2.0.co;2
Kug, J.-S., Choi, J., An, S.-I., Jin, F.-F., and Wittenberg, A. T. (2010). Warm Pool and Cold Tongue El Niño Events as Simulated by the GFDL 2.1 Coupled GCM. J. Clim. 23, 1226–1239. doi:10.1175/2009JCLI3293.1
Kug, J.-S., and Ham, Y.-G. (2011). Are There Two Types of La Nina? Geophys. Res. Lett. 38, a–n. doi:10.1029/2011GL048237
Kug, J.-S., Jin, F.-F., and An, S.-I. (2009). Two Types of El Niño Events: Cold Tongue El Niño and Warm Pool El Niño. J. Clim. 22, 1499–1515. doi:10.1175/2008JCLI2624.1
Larkin, N. K., and Harrison, D. E. (2005). Global Seasonal Temperature and Precipitation Anomalies during El Niño Autumn and winter. Geophys. Res. Lett. 32. doi:10.1029/2005GL022860
McPhaden, M. J. (2012). A 21st century Shift in the Relationship between ENSO SST and Warm Water Volume Anomalies. Geophys. Res. Lett. 39, a–n. doi:10.1029/2012GL051826
Neale, R. B., Richter, J. H., Conley, A. J., Park, S., Lauritzen, P. H., Gettelman, A., et al. (2010). Description of the NCAR Community Atmosphere Model (CAM 5.0). NCAR TechNote NCAR/TN-486+ STR, 212.
Newman, M., Alexander, M. A., and Scott, J. D. (2011a). An Empirical Model of Tropical Ocean Dynamics. Clim. Dyn. 37, 1823–1841. doi:10.1007/s00382-011-1034-0
Newman, M., Shin, S.-I., and Alexander, M. A. (2011b). Natural Variation in ENSO Flavors. Geophys. Res. Lett. 38, a–n. doi:10.1029/2011GL047658
Ohba, M., and Ueda, H. (2009). Role of Nonlinear Atmospheric Response to SST on the Asymmetric Transition Process of ENSO. J. Clim. 22, 177–192. doi:10.1175/2008JCLI2334.1
Okumura, Y. M., and Deser, C. (2010). Asymmetry in the Duration of El Niño and La Niña. J. Clim. 23, 5826–5843. doi:10.1175/2010JCLI3592.1
Okumura, Y. M. (2019). ENSO Diversity from an Atmospheric Perspective. Curr. Clim. Change Rep. 5, 245–257. doi:10.1007/s40641-019-00138-7
Perigaud, C., and Dewitte, B. (1996). El Niño-La Niña Events Simulated with Cane and Zebiak's Model and Observed with Satellite or In Situ Data. Part I: Model Data Comparison. J. Clim. 9, 66–84. doi:10.1175/1520-0442(1996)009<0066:ennesw>2.0.co;2
Rayner, N. A. (2003). Global Analyses of Sea Surface Temperature, Sea Ice, and Night marine Air Temperature since the Late Nineteenth century. J. Geophys. Res. 108, 4407. doi:10.1029/2002JD002670
Reynolds, R. W., Rayner, N. A., Smith, T. M., Stokes, D. C., and Wang, W. (2002). An Improved In Situ and Satellite SST Analysis for Climate. J. Clim. 15, 1609–1625. doi:10.1175/1520-0442(2002)015<1609:AIISAS>2.0.CO;2
Ren, H.-L., and Jin, F.-F. (2011). Niño Indices for Two Types of ENSO. Geophys. Res. Lett. 38. doi:10.1029/2010gl046031
Ren, H.-L., and Jin, F.-F. (2013). Recharge Oscillator Mechanisms in Two Types of ENSO. J. Clim. 26, 6506–6523. doi:10.1175/jcli-d-12-00601.1
Ren, H.-L., and Wang, R. (2020). Distinct Growth Rates of the Two ENSO Types. Geophys. Res. Lett. 47, e2020GL088179. doi:10.1029/2020gl088179
Rodríguez-Morata, C., Díaz, H. F., Ballesteros-Canovas, J. A., Rohrer, M., and Stoffel, M. (2019). The Anomalous 2017 Coastal El Niño Event in Peru. Clim. Dyn. 52, 5605–5622. doi:10.1007/s00382-018-4466-y
Takahashi, K., and Dewitte, B. (2016). Strong and Moderate Nonlinear El Niño Regimes. Clim. Dyn. 46, 1627–1645. doi:10.1007/s00382-015-2665-3
Takahashi, K., Karamperidou, C., and Dewitte, B. (2019). A Theoretical Model of strong and Moderate El Niño Regimes. Clim. Dyn. 52, 7477–7493. doi:10.1007/s00382-018-4100-z
Takahashi, K., Montecinos, A., Goubanova, K., and Dewitte, B. (2011). ENSO Regimes: Reinterpreting the Canonical and Modoki El Niño. Geophys. Res. Lett. 38, a–n. doi:10.1029/2011GL047364
Taschetto, A. S., Ummenhofer, C. C., Stuecker, M. F., Dommenget, D., Ashok, K., Rodrigues, R. R., et al. (2020). “ENSO Atmospheric Teleconnections,” in El Niño Southern Oscillation in a Changing Climate. Editors M. J. McPhaden, A. Santoso, and W. Cai, Geophysical Monograph Series, AGU, 309–335. doi:10.1002/9781119548164.ch14
Timmermann, A., An, S.-I., Kug, J.-S., Jin, F.-F., Cai, W., Capotondi, A., et al. (2018). El Niño-Southern Oscillation Complexity. Nature 559, 535–545. doi:10.1038/s41586-018-0252-6
Vimont, D. J., Alexander, M. A., and Newman, M. (2014). Optimal Growth of central and East Pacific ENSO Events. Geophys. Res. Lett. 41, 4027–4034. doi:10.1002/2014GL059997
Vimont, D. J., Newman, M., Battisti, D. S., and Shin, S.-I. (2022). The Role of Seasonality and the ENSO Mode in Central and East Pacific ENSO Growth and Evolution. J. Clim. 1, 1–46. doi:10.1175/JCLI-D-21-0599.1
Wang, R., and Ren, H.-L. (2020). Understanding Key Roles of Two ENSO Modes in Spatiotemporal Diversity of ENSO. J. Clim. 33, 6453–6469. doi:10.1175/jcli-d-19-0770.1
Weare, B. C. (1986). A Simple Model of the Tropical Atmosphere with Circulation Dependent Heating and Specific Humidity. J. Atmos. Sci. 43, 2001–2016. doi:10.1175/1520-0469(1986)043<2001:asmott>2.0.co;2
Webster, P. J. (1981). Mechanisms Determining the Atmospheric Response to Sea Surface Temperature Anomalies. J. Atmos. Sci. 38, 554–571. doi:10.1175/1520-0469(1981)038<0554:mdtart>2.0.co;2
Wiedermann, M., Radebach, A., Donges, J. F., Kurths, J., and Donner, R. V. (2016). A Climate Network-Based index to Discriminate Different Types of El Niño and La Niña. Geophys. Res. Lett. 43, 7176–7185. doi:10.1002/2016gl069119
Wu, Z., Sarachik, E. S., and Battisti, D. S. (2000). Vertical Structure of Convective Heating and the Three-Dimensional Structure of the Forced Circulation on an Equatorial Beta Plane*. J. Atmos. Sci. 57, 2169–2187. doi:10.1175/1520-0469(2000)057<2169:vsocha>2.0.co;2
Xie, R., and Jin, F.-F. (2018). Two Leading ENSO Modes and El Niño Types in the Zebiak-Cane Model. J. Clim. 31, 1943–1962. doi:10.1175/JCLI-D-17-0469.1
Yang, S., Li, Z., Yu, J.-Y., Hu, X., Dong, W., and He, S. (2018). El Niño-Southern Oscillation and its Impact in the Changing Climate. Natl. Sci. Rev. 5, 840–857. doi:10.1093/nsr/nwy046
Yeh, S.-W., Kug, J.-S., Dewitte, B., Kwon, M.-H., Kirtman, B. P., and Jin, F.-F. (2009). El Niño in a Changing Climate. Nature 461, 511–514. doi:10.1038/nature08316
Yu, J.-Y., Kao, H.-Y., and Lee, T. (2010). Subtropics-related Interannual Sea Surface Temperature Variability in the central Equatorial Pacific. J. Clim. 23, 2869–2884. doi:10.1175/2010jcli3171.1
Yuan, X., Jin, F. F., and Zhang, W. (2020). A Concise and Effective Expression Relating Subsurface Temperature to the Thermocline in the Equatorial Pacific. Geophys. Res. Lett. 47, e2020GL087848. doi:10.1029/2020GL087848
Zebiak, S. E., and Cane, M. A. (1987). A Model El Niñ-Southern Oscillation. Mon. Wea. Rev. 115, 2262–2278. doi:10.1175/1520-0493(1987)115<2262:ameno>2.0.co;2
Zhang, S., Harrison, M. J., Rosati, A., and Wittenberg, A. (2007). System Design and Evaluation of Coupled Ensemble Data Assimilation for Global Oceanic Climate Studies. Monthly Weather Rev. 135, 3541–3564. doi:10.1175/MWR3466.1
Zhao, S., Jin, F. F., Long, X., and Cane, M. A. (2021). On the Breakdown of ENSO's Relationship with Thermocline Depth in the Central‐Equatorial Pacific. Geophys. Res. Lett. 48, e2020GL092335. doi:10.1029/2020GL092335
Keywords: El Niño-Southern Oscillation, ENSO diversity, ENSO bi-modality, Cane-Zebiak model, nonlinear convective heating, subsurface temperature parameterization
Citation: Geng L and Jin F-F (2022) ENSO Diversity Simulated in a Revised Cane-Zebiak Model. Front. Earth Sci. 10:899323. doi: 10.3389/feart.2022.899323
Received: 18 March 2022; Accepted: 06 April 2022;
Published: 25 April 2022.
Edited by:
Hong-Li Ren, Chinese Academy of Meteorological Sciences, ChinaReviewed by:
Xin Geng, Nanjing University of Information Science and Technology, ChinaRun Wang, Chinese Academy of Meteorological Sciences, China
Copyright © 2022 Geng and Jin. This is an open-access article distributed under the terms of the Creative Commons Attribution License (CC BY). The use, distribution or reproduction in other forums is permitted, provided the original author(s) and the copyright owner(s) are credited and that the original publication in this journal is cited, in accordance with accepted academic practice. No use, distribution or reproduction is permitted which does not comply with these terms.
*Correspondence: Licheng Geng, bGdlbmdAaGF3YWlpLmVkdQ==
 Licheng Geng
 Fei-Fei Jin