- 1Faculty of Geosciences and Environmental Engineering, Southwest Jiaotong Universit, Chengdu, China
- 2Sichuan Academy of Safety Science and Technology, Chengdu, China
- 3MOE Key Laboratory of High-Speed Railway Engineering, Southwest Jiaotong University, Chengdu, China
The central part of the Shaluli Mountains is located in the Ganzi area, Sichuan Province, China, bordered by the Jinsha River and adjacent to Tibet. Frequent avalanches pose a serious threat to human activities and engineering construction such as the Sichuan-Tibet Railway under construction. Therefore, the evaluation of avalanche susceptibility in this area can not only help define the spatial pattern of avalanches on the Qinghai-Tibet Plateau but also provide references for the recognition and early warning of regional avalanche disasters. In this study, avalanche samples were selected by remote sensing interpretation supplemented by a detailed field survey, GIS spatial analysis, and data mining. Two statistical models [evidence confidence function (EBF) and certainty coefficient (CF)] combined with two machine learning models [logistic regression (LR) and multilayer perceptron (MLP)] were used to establish four integrated models (EBF-LR, CF-LR, EBF-MLP, and CF-MLP) as well as the traditional frequency ratio model (FR) for avalanche susceptibility evaluation. Finally, the results were checked for accuracy by Kappa coefficients and ROC curves. The CF-MLP (Kappa = 0.606, AUC = 0.910) model was the best avalanche susceptibility evaluation model for this study, the FR (Kappa = 0.584, AUC = 0.894) model had the next highest accuracy, and the combination of the CF algorithm and the machine learning model performed better than the EBF. The most important influencing factors were elevation, slope orientation, terrain moisture index, and January average temperature. The five models showed a high degree of consistency in the sensitivity to topographic factors during the evaluation of susceptibility. The avalanche susceptibility zoning map based on the CF-MLP model was obtained by the natural breakpoint method, and the areas with very high and high susceptibility accounted for about 10.01% and 15.33% of the total area, respectively.
Highlights
An integrated machine learning model is built for avalanche susceptibility mapping.
The avalanche influencing factors is analyzed.
The CF-MLP model can well evaluate the avalanche susceptibility.
1 Introduction
Snow avalanches are snow masses that rapidly descend steep slopes, which is the complex interaction between terrain, snowpack, and meteorological conditions leading to avalanching (Schweizer et al., 2003). It is a generally dispersed normal wonder and mass stream structure in the frigid mountain areas (Schweizer et al., 2015). Regular snow torrential slides compromise human existence, development, transportation, environments (Podolskiy et al., 2014).
Early avalanche research began from 18th century. People mainly concerned the environmental conditions such as climate change and snow cover features through remote sensing and field surveys in the past (Conway and Wilbour 1999; Lehning et al., 1999; Huggel et al., 2004). With the development of measurement technology, UAV tilt photography and optical remote sensing images have been widely used in the avalanche research (Bühler et al., 2016; Hafner et al., 2021). Landsat TM satellite imagery was used to characterize the composition, direction, and dimension of selected avalanche paths in Montana’s Glacier National Park (Walsh et al., 1990). Remote sensing reconstruction of avalanche paths through multi-temporal remote sensing images combined with the natural characteristics of tree annual rings can obtain the spatial extent of multiple avalanche occurrences in the same area (Lato et al., 2012; Mesesan et al., 2019). The study of zoning and mapping of avalanche hazards began in Europe, where snow damage was frequent. The concepts of avalanche cycle and maximum avalanche throw appeared on zoning maps of the Alps in 1953, and the term avalanche climate, which appeared later in 1987, has been widely used by many scholars (Dent and Lang, 1983; Ancey et al., 2004). Snowy countries such as Switzerland establish avalanche risk zoning and mapping criteria based on avalanche frequency and impact force (Schweizer et al., 2015). Based on this, these snow-prone countries plan and manage land use in mountainous areas according to the degree of avalanche risk. This standard has been widely used in countries with avalanche hazards in Europe and North America, such as Russia, Canada, and the United States, and has reduced the avalanche risk to an acceptable level (Jamieson and Stethem, 2002; Seliverstov et al., 2008).
In recent years, with the rapid development of artificial intelligence technology, machine learning has been widely used in landslide susceptibility evaluation, earthquake prediction, rainfall correction, constitutive models, and groundwater storage change prediction (Youssef et al., 2016; Ghorbani Nejad et al., 2017; Hao et al., 2017; Choubin et al., 2019a; Choubin et al., 2019b; Li et al., 2021; Xiong et al., 2021; Xi et al., 2022). Some studies have tried to apply machine learning algorithms to the automatic detection of regional avalanches (Techel et al., 2015; Yang et al., 2020), avalanche transport material susceptibility evaluation (Choubin et al., 2020), and avalanche susceptibility mapping (Rahmati et al., 2019; Mosavi et al., 2020; Wen et al., 2022). In this study, based on remote sensing interpretation and field survey, a learning sample library is constructed, and a model combining machine learning and traditional statistical methods is used to explore avalanche susceptibility mapping under different combinations of methods, which can provide an important reference for regional disaster risk prediction.
In this study, we identified 536 channeled avalanche samples by field investigation in the central Shaluli Mountain that flowed across the timberline, where the Sichuan-Tibet railway under construction will cross this study area. 14 evaluation factors were selected to examine the multicollinearity of evaluation factors by a variance inflation factor (VIF). The two statistical models of Evidence Confidence Function (EBF) and Certainty Coefficient (CF) were used to combine the two methods. A machine learning model—logistic regression (LR) and multi-layer perceptron (MLP) to establish four integrated models of EBF-LR, CF-LR, EBF-MLP, and CF-MLP, as well as the traditional frequency ratio model (FR) for avalanche susceptibility evaluation research.
2 Study area
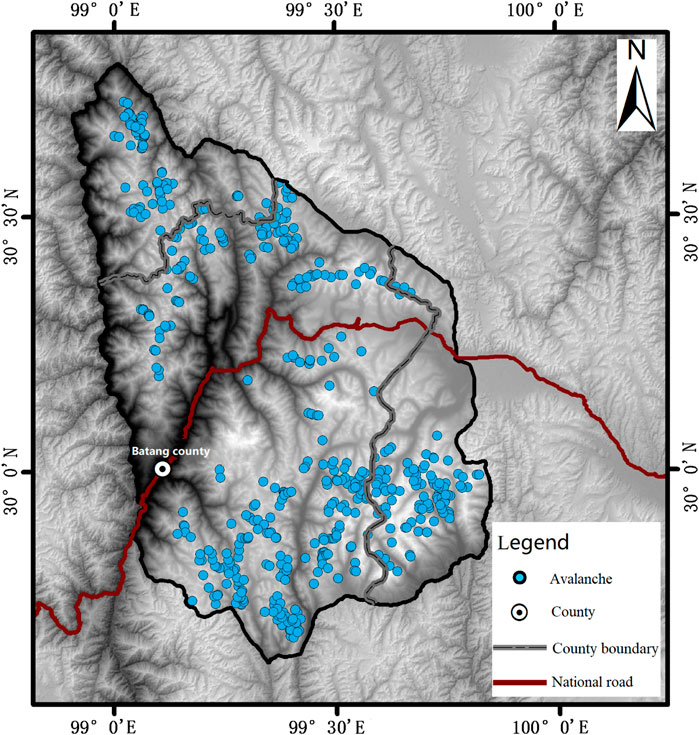
Shaluli Mountain is the watershed of the Jinsha River and Yalong River, located in the west of Ganzi Tibetan Autonomous Prefecture and Liangshan Yi Autonomous Prefecture, separated from the Bayan Kala Mountains and entering the western Sichuan Plateau in the southeast, running through Ganzi and stretching through the Yangtze River. The central part of the Shaluli Mountains is located in the eastern part of the Qinghai-Tibet Plateau and belongs to the middle part of the central mountains at the northern end of the Hengduan Mountains. Gnie Mountain is the highest peak of the Shaluli Mountain System, with an elevation of 6204m. National Roads G318 and G215 pass through the study area. The geographical coordinates are 29°37′12″N∼30°47′24″N, 98°54′06″E∼99°51′36″E, 91.8 km wide from east to west, 131.8 km long from north to south, and the total area of the study area is about 7124.46 km2 (Figure 1).
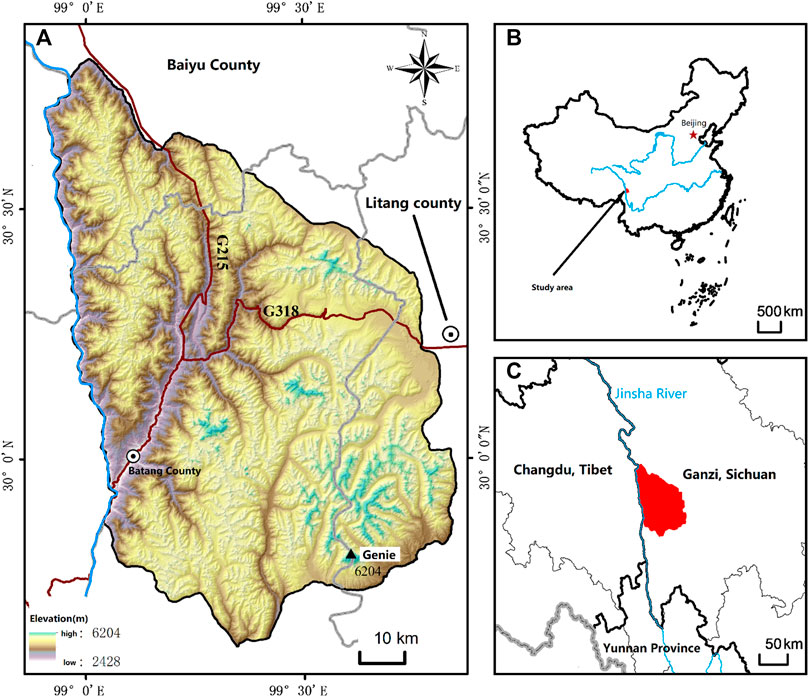
FIGURE 1. Topographic map of the study area (A), location of the study area in China (B) and overview map of the study site in Sichuan Province, south-western China (C).
The Shaluli Mountain system belongs to the semi-humid climate sub-region of the Qinghai Tibet Plateau, with a large topography and obvious zonal distribution in a small range. The changes in temperature, precipitation, and vegetation in the valley, hillside, and mountain top are different. The basic rule is that with the increase of altitude (Castebrunet et al., 2012), the temperature decreases, and the precipitation increases. According to the observation data of meteorological stations, the average annual temperature is generally 7–10°C, the average temperature in the coldest month (January) is −6∼0°C, and the extreme minimum temperature is −26°C (Litang). The annual average precipitation is generally 474 mm (Batang) ∼725 mm (Litang). The rainy season runs from June to August, and there are 5–6 months of frozen snowfall in the winter half year. According to the meteorological data of 30 years, the annual maximum snowfall in the research area is 70–143 mm, the annual maximum wind speed is 11.5–15.8 m/s, and the annual relative humidity accounts for 53–56%. The average humidity index of the study area in recent 57 years is 0.5–0.75 (Wang et al., 2019). With the increase of precipitation and water vapor evapotranspiration caused by climate warming, the dry and hot valley area in Batang County has a trend of warming and drying, and the valley area in the east of the study area has the characteristics of warm and humid type with the increase of altitude. The Asian monsoon system is the main replenishment of the precipitation in the Shaluli Mountains. The humid Indian Ocean monsoon enters the interior of the Plateau from the Yarlung Zangbo River valley and moves westward driven by the easterly air flow, which enables the rainfall entering the Qinghai-Tibet Plateau from east to west (Wang et al., 2010; Peng et al., 2017).
3 Data and methodology
3.1 Snow avalanche inventory
Based on the field investigations from the winter of 2018, a total of 536 channeled snow avalanches that flowed across the timberline were collected to establish a research sample database. The samples are related to the location of the snow avalanche and are marked by coordinates (Figure 2).
For the traditional analysis model, 536 (100%) avalanche samples are taken as modeling samples, while 161 (30%) avalanche samples and 161 randomly generated non-avalanche samples are taken as test samples. For the machine learning model, the system randomly generates the same number of non-avalanche samples (536) as avalanche samples, a total of 1072 samples, of which 750 (70%) samples are randomly selected for machine learning modeling, and the remaining 322 (30%) samples are used for model verification. The number of avalanche samples and non-avalanche samples in training samples and test samples are the same. Both methods follow the random principle to avoid the influence of human factors (Laxton and Smith 2009; Cui et al., 2017; Hao et al., 2017; Choubin et al., 2020).
3.2 Snow avalanche conditioning factors
The formation process of snow avalanche is affected by many factors, including snowfall, snow density, snow layer structure, snow depth, snow temperature, and temperature gradient, slope, vegetation type, and coverage, wind speed and direction, elevation, landform (Schweizer et al., 2003; Steinkogler et al., 2014; Fischer et al., 2015). These factors constitute a unique snow avalanche disaster-pregnant environment. Generally speaking, the above factors can be divided into three categories: terrain, meteorological condition, snowpack stratigraphy (Bühler et al., 2013; Bartelt et al., 2018). After the Pearson correlation coefficient analysis and variance inflation factor diagnostics, 14 factors are selected which can be quantitatively extracted by remote sensing and GIS (Table 1). The structure and flow pattern of avalanches are greatly influenced by the topographic conditions in the formation area. Its dynamic characteristics are usually controlled by the physical and mechanical parameters of snow, and the physical and mechanical parameters of snow will change during the avalanche flow process. Various climatic, topographic, and hydrological variables can also affect the occurrence of avalanches. Thus, the selection of evaluation factors comprehensively considers the availability of data, whether it can be expressed quantitatively and reflect the formation conditions of avalanche comprehensively.
The elevation, slope, aspect, surface roughness, Curvature Relief Amplitude, and Earth’s surface incision in elevation were (Figures 3A–F) extracted by the ALOS (Advanced Land Observing Satellite) DSM with a 12.5 m resolution.
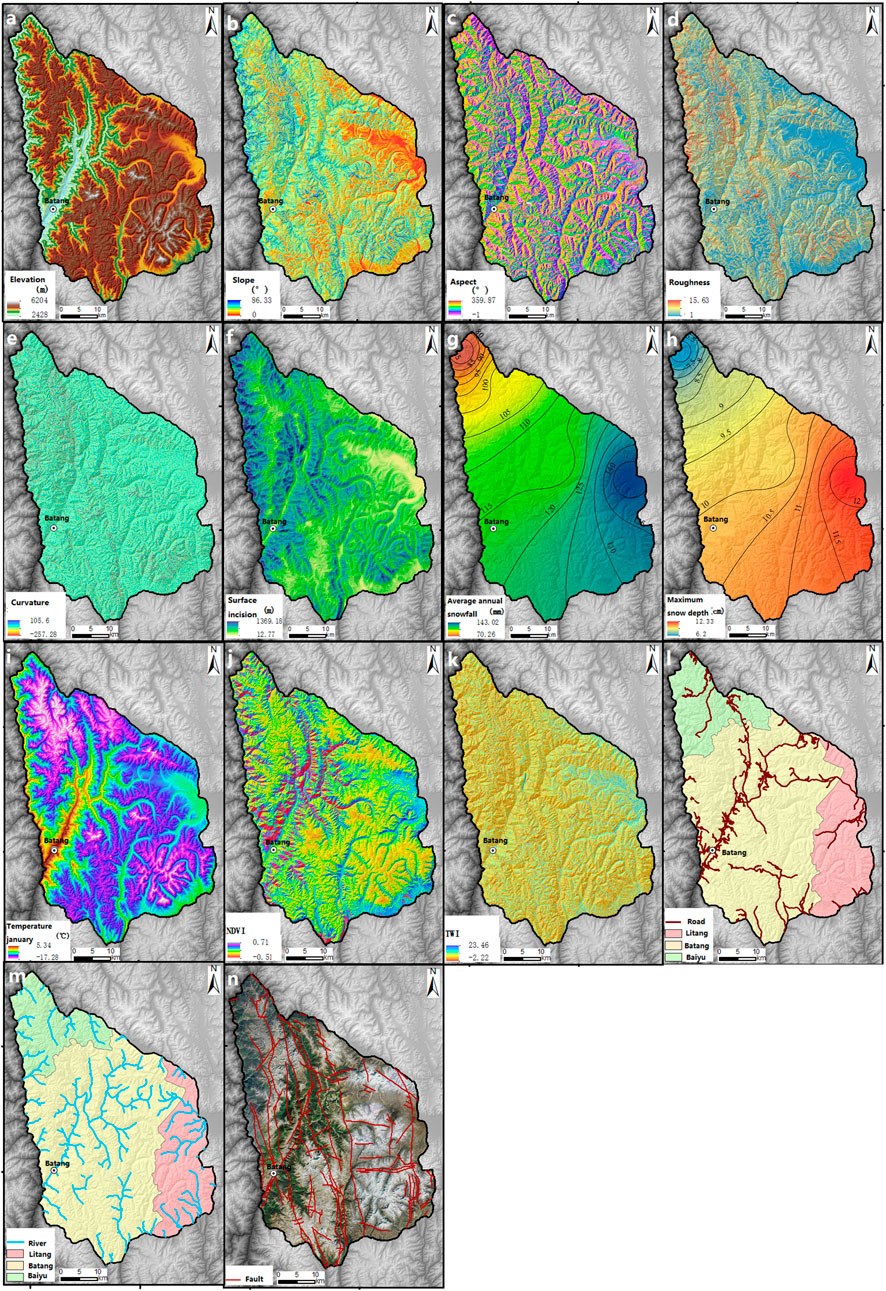
FIGURE 3. Snow avalanche conditioning factors, within the research area, Elevation (A), Slope (B), Aspect (C), Roughness (D), Curvature (E), Surface (F), Average annual snowfall (G), Maximum snow depth (H), Temperature (I), NDVI (J), TWI (K), Road distance (L), River distance (M), Fault distance (N).
The average annual snowfall, maximum snow depth, and the average temperature of January (Figures 3G–I) are obtained through the weather stations nearby the study area in recent 30 years. Landsat 8 OLI images were adopted to extract the NDVI maps by ENVI (Figure 3J). The TWI (Topographic Wetness Index) is derived from the GIS hydrological analysis module (Figure 3K). The distance to roads is based on China’s publicly available basic geographic information data (Figure 3L). The distance to rivers is based on the 1:250 000 open version of basic geographic data of the National Geographic Information Resources Directory Service System (Figure 3M). The faults are vectored according to a 1:200 000 regional geological map (https://www.ngac.org.cn) (Figure 3N).
3.3 Snow avalanche modeling
In recent years, machine learning methods have been widely used in the fields of phenomena prediction research due to their fast and accurate predictive performance. Most of the multi-hazard studies such as landslides, extreme precipitation, and forest fires have been conducted by data mining and using mathematical-statistical methods as well as machine learning models to evaluate the disaster susceptibility. The typical methods are frequency ratio model (FR), information model (I), deterministic coefficient model (CF), support vector machine (SVM), random forest (RF), and plain Bayesian (NB).
In order to reduce uncertainty and increase the accuracy of avalanche susceptibility zonation, mathematical-statistical methods combined with machine learning models are used in this study. Moreover, the evaluation result is analyzed comparatively with the traditional frequency ratio model (FR).
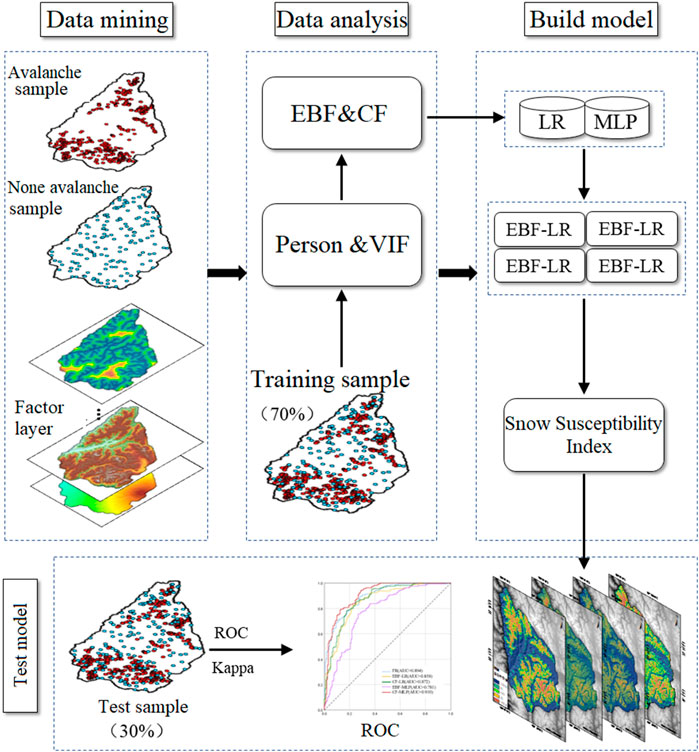
This paper on avalanche susceptibility evaluation mainly includes the following five steps, and the evaluation process is shown in Figure 4.
3.3.1 Database preparation: analysis of avalanche impact factors and data collection
The impact factor layers were created to vector and statistically analyze the impact factor data in the study area to prepare sample data for model training and validation. All factor layers are 12.5 m × 12.5 m raster layers with spatial location information.
3.3.2 Training and testing sample selection: 536 avalanche samples and 536 non-avalanche samples of the dataset
The random selection principle was strictly followed, and the dataset was divided into two subsets for model training (70%) and model testing (30%) according to different model properties.
3.3.3 Pearson correlation coefficient and variance inflation factor diagnostics
Pearson correlation analysis examined the degree of correlation between two of these factors, while variance inflation factor diagnostics were used to ensure that there was no linear relationship between the factors.
3.3.4 Model building and implementation: classification of each mode
The traditional model uses the frequency ratio method to weight the influence factor hierarchical states and then calculates them by GIS layer overlay; the machine learning model first uses two statistical calculations to assign weights to the factors: EBF (Evidential belief function) and CF, and then combines them with two models, LR (logistic regression)and MLP (multilayer perceptron), respectively, to form four integrated models EBF-LR, CF-LR, EBF-MLP and CF-MLP, and the modeling process is performed using training sample data.
3.3.5 Model validation: accuracy check
Based onthe test samples, the Kappa coefficient and area under the ROC curve (AUC) values were used to test the model accuracy.
3.3.6 Avalanche susceptibility evaluation and analysis: avalanche susceptibility zonation maps were drawn and analyzed
The model-generated susceptibility maps were classified into five levels: very low, low, medium, high, and very high using the natural breakpoint method. The model results were compared and analyzed.
3.3.6.1 Frequency ratio
The frequency ratio index FR is used to classify the evaluation factors and calculate the influence degree of each factor on avalanche under the grading state. It is often used as the basic index to establish mathematical models such as the analytic hierarchy process and logical regression. It is the basis of sensitivity analysis based on the statistical analysis method. This method can improve the accuracy of classification and grading state. The contribution rate of different influencing factors to avalanche occurrence is represented here, and compared with the integrated model as the traditional evaluation model (Pham et al., 2020). The calculation formula can be expressed as follows:
A indicates avalanche graded area; B indicates total avalanche area in the study area; C indicates the graded area in the study area; D indicates the total area in the study area; F indicates the percentage of avalanche graded area; R indicates the percentage of graded area in the study area. When FR > 1 it indicates that the graded interval is favorable to avalanche development; when FR < 1 it indicates that the graded interval is unfavorable to avalanche development; when FR = 1 it indicates that the probability of avalanche development in the graded interval is the same as the average development probability of the whole study area. The greater the value of this ratio, the greater the contribution of the class to avalanche development.
3.3.6.2 Evidential belief function
The Evidential belief function is derived from the Dempster-Shafer theory, a statistical approach to data proposed by Dempster and supplemented by Schaefer (Dempster, 1968; https://www.tandfonline.com/doi/full/10.1080/10106049.2015.1132481; Shafer, 1976). The most obvious advantage of this theory is that it is flexible enough to accept and integrate the uncertainty of various factors themselves. The Dempster-Shafer theory is therefore suitable for estimating the likelihood of an avalanche, which is a combination of four indicators: suspicion, trust, uncertainty, and plausibility. The calculation formula can be expressed as follows:
3.3.6.3 Certainty factor
The certainty factor method was first proposed by Shortliffe and Buchanan (1975). Its essence is a kind of probability and statistics method. At present, it has been widely used in the study of landslide susceptibility. It is a relatively mature and high-precision research method. The basic assumption is: according to the function statistical relationship between the avalanche activity and its influencing factors, the avalanche susceptibility in the future can be predicted. The range of CF is [−1, 1]. When CF is positive, it means that the certainty of avalanche occurrence increases in the state of influence factor classification. The closer to 1, the higher the certainty of avalanche occurrence. If CF is negative, the certainty of avalanche occurrence in the state of influence factor classification is reduced. The closer to—1, the certainty of avalanche occurrence is lower. The calculation formula is as follows:
3.3.6.4 Logistic regression
Logistic regression is a nonlinear multivariate statistical prediction method, which is suitable for solving the binary classification problem of multivariable control. At present, the disaster susceptibility assessment in the field of Geosciences has been widely used and has high accuracy (Fischer, 2013). In this model, the value of the dependent variable is usually 0 or 1, which means that the event does not occur or occurs. The range of the predicted value is [0, 1]. The closer the number is to zero, the lower the probability of the event. The function expression of logistic regression is as follows:
3.3.6.5 Multilayer perceptron
The function of the neural network is realized by the interconnection and communication of a large number of processing units (neurons) (Ramchoun et al., 2016). The neural network is adaptive, nonlinear, machine learning and fault-tolerant. It is suitable for dealing with nonlinear problems such as the natural geological disaster and the nonlinear complex system which has complex formation mechanisms and multiple influencing factors (Karlik and Olgac, 2011). To solve the linear separability problem, Rumelhart and Zisper. (1985) proposed a multi-layer perceptron model based on the single-layer perceptron classification neural network model. In the process of MLP modeling, forward propagation is carried out from the input layer to get the output value and calculate the error of the output layer. Then error backpropagation is carried out to update the weights of neurons in each layer. Finally, the target is gradually approached in the direction of decreasing the slope of the error function. The structure of the MLP model is shown in Figure 5.
4 Results
4.1 Evaluation of avalanche susceptibility based on FR model
The frequency ratio model first obtains the contribution values of all evaluation factors to the avalanche occurrence according to the Eq. 1, and then maps the FR values of all evaluation factors to the grid layer for spatial superposition by using the map algebra tool of GIS (Figure 6). The essence is to accurately stack the contribution values of all evaluation factors to the avalanche occurrence on the grid cell scale. The larger the FR stack value, the easier the avalanche is. The spatial layers of the FR value of each factor are superimposed, and the result is the distribution map of FR comprehensive evaluation value of susceptibility of Shaluli Mountain system. The FR comprehensive evaluation value is used as the evaluation index of avalanche susceptibility in the study area, and the index interval is [1.877, 51.677]. The natural discontinuity method (the most appropriate grouping of similar values) is used, which is characterized by the maximum difference between the intervals. According to the minimum difference in the interval, it can be divided into five susceptibility levels: very low (1.877–9.885), low (9.885–14.377), medium (14.377–19.845), high (19.845–28.634) and very high (28.634–51.677).
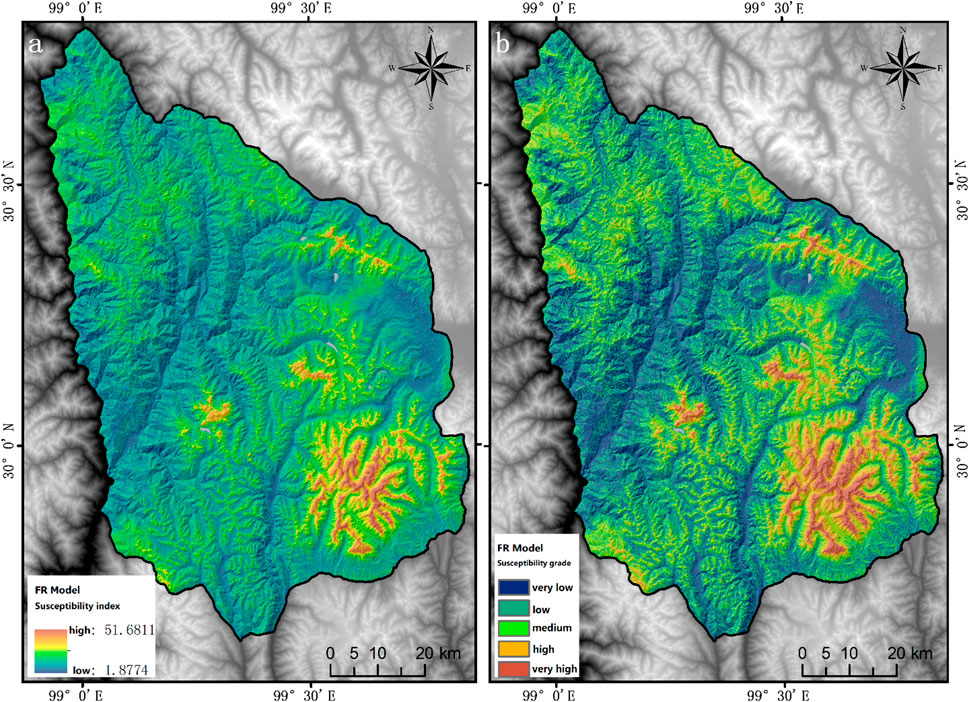
FIGURE 6. FR model susceptibility zoning map (A); FR model susceptibility zonation map was segmented by the natural discontinuity method (B).
4.2 Evaluation of avalanche susceptibility based on EBF-LR model
The values of each graded state of the 14 influence factors are calculated according to the evidence confidence function (EBF) Eq. 3, and the Bel values need to be normalized according to Eq. 2 before building the LR model and the MLP model, which is to avoid transition oscillations in the LR model calculation and machine overtraining in the MLP model. This solves the problem of determining the weights of each hierarchical state of the influence factor and the integration of data of different metrics.
The integration operation of the model can also attenuate the effect of subjective grading on a single model. The specific idea is that the influence factors weighted by EBF are input into the logistic regression model as independent variables, and the logistic regression coefficients of each independent variable are obtained according to the logistic regression equation, and then the layer space calculation is carried out according to Eq. 11 using the GIS platform to finally obtain the probability of avalanche susceptibility p-value. It is used as a comprehensive index of avalanche susceptibility zoning in the study area with an index interval of (0.001, 0.999), which is also divided into five susceptibility class intervals: very low (0.001–0.118), low (0.118–0.283), medium (0.283–0.490), high (0.490–0.729), and very high (0.729–0.999) using the natural intermittent method, and the results are shown in Figure 7.
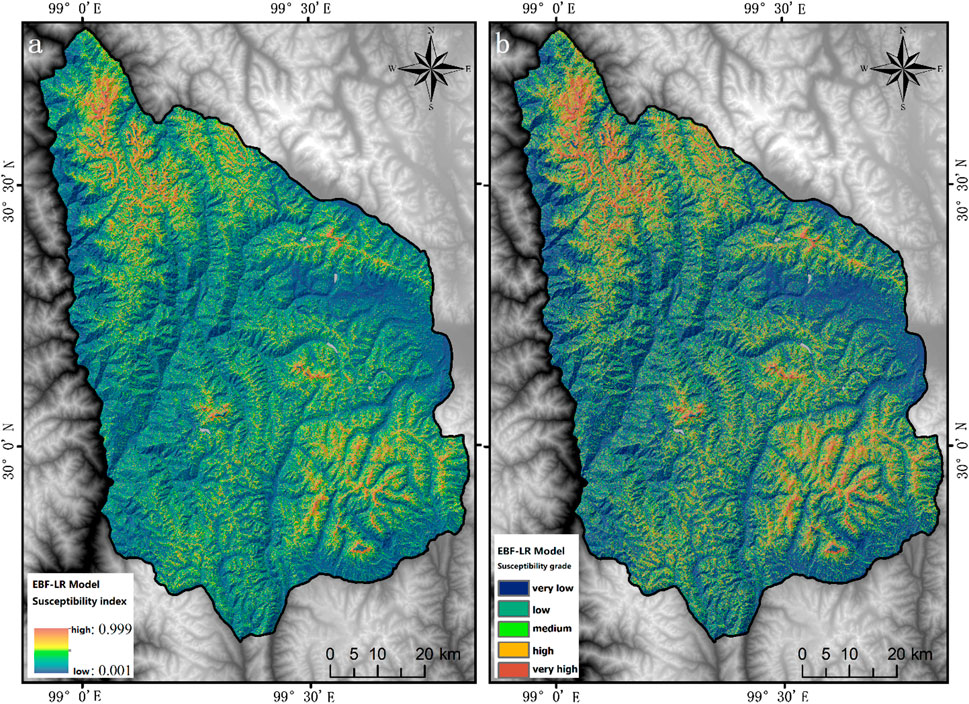
FIGURE 7. EBF-LR model susceptibility zoning map (A); EBF-LR model susceptibility zonation map was segmented by the natural discontinuity method (B).
4.3 Evaluation of avalanche susceptibility based on CF-LR model
According to the CF formula 3-8, the CF values of 14 influencing factors in each classification state are calculated, which also need to be standardized before establishing the LR model and MLP model. Similar to the processing process of the EBF-LR model, the final avalanche susceptibility probability value is taken as the comprehensive index of avalanche susceptibility zoning in the study area, and the index interval is (0, 0.999). The natural discontinuity method is used to divide it into five susceptibility level intervals: very low (0–0.098), low (0.098–0.282), medium (0.282–0.513), high (0.513–0.760), and very high (0.760–0.999). The zoning results are shown in Figure 8.
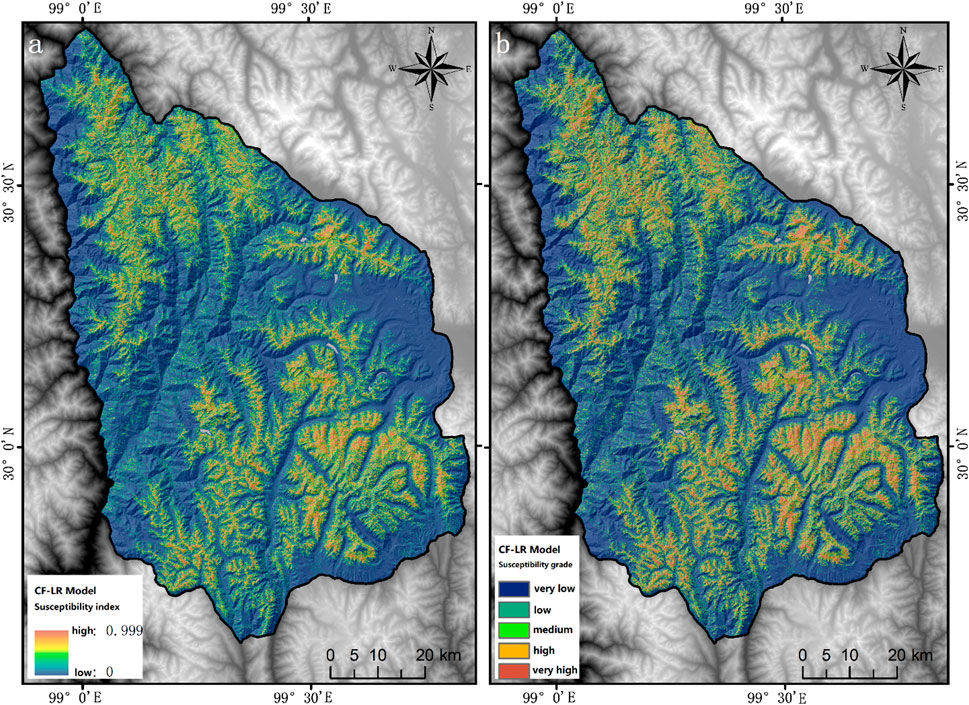
FIGURE 8. CF-LR model susceptibility zoning map (A); CF-LR model susceptibility zonation map was segmented by the natural discontinuity method (B).
4.4 Evaluation of avalanche susceptibility based on EBF-MLP model
According to the theory of the multi-layer perceptron model, 14 influence factors weighted by EBF are used as the input layer for partition training. To prevent overtraining, a hidden layer is selected, and the maximum number of cells is controlled within 10. The hidden layer is activated by the hyperbolic tangent function, and the softmax function is used as the output layer activation function. Finally, the EBF-MLP prediction model based on training samples is obtained. Before calculating the avalanche susceptibility probability value for the whole study area, the whole study area needs to be divided into fishing nets, and the center of the fishing net grid is the basis for the model to calculate the avalanche occurrence probability. The study area is divided into fishnets with the size of 100 m × 100 m which is much smaller than the avalanche size, and generate 715006 samples to be calculated. 14 weighted evaluation factors extracted from the numerous samples are calculated according to the constructed EBF-MLP model to obtain the avalanche susceptibility probability values of the study area. The probability values are ranging from (0, 1). When the value is less than 0.5, it means a low probability of avalanche occurrence. Conversely, the probability of avalanche occurrence increases higher when the value is close to 1. The study area avalanche susceptibility zoning index interval is (0.067, 0.945), and finally through the GIS platform to accurately assign to the fishing network to achieve the entire study area avalanche susceptibility zoning mapping. The natural discontinuity method was used to divide it into five susceptibility intervals: very low (0–0.259), low (0.259–0.373), medium (0.373–0.486), high (0.486–0.614), and very high (0.614–0.945), as shown in Figure 9.
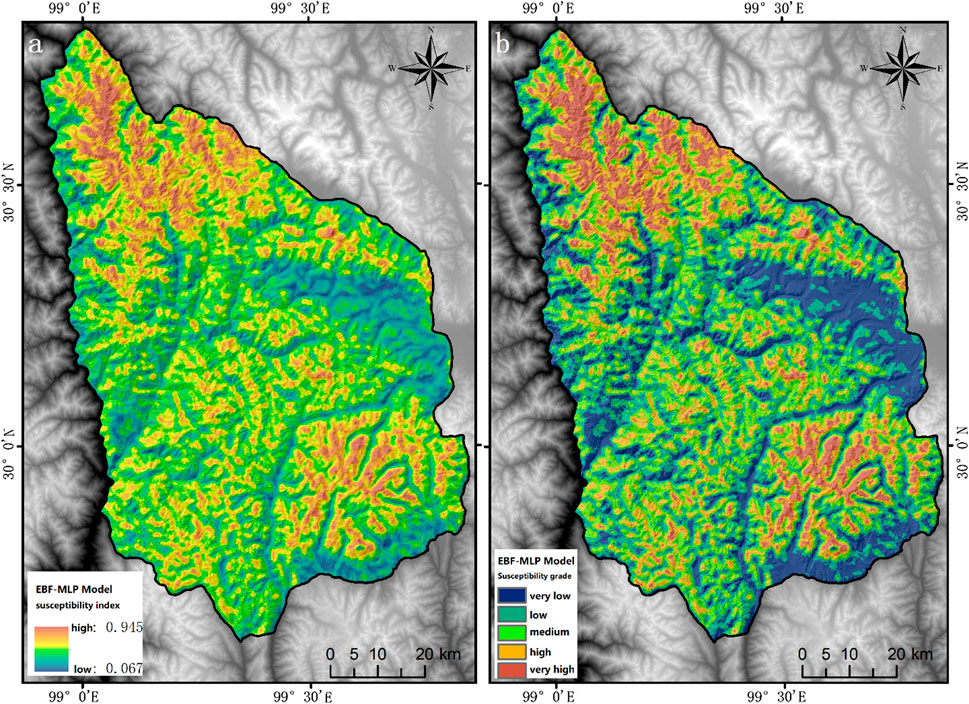
FIGURE 9. EBF-MLP model susceptibility zoning map (A); EBF-MLP model susceptibility zonation map was segmented by the natural discontinuity method (B).
4.5 Evaluation of avalanche susceptibility based on CF-MLP model
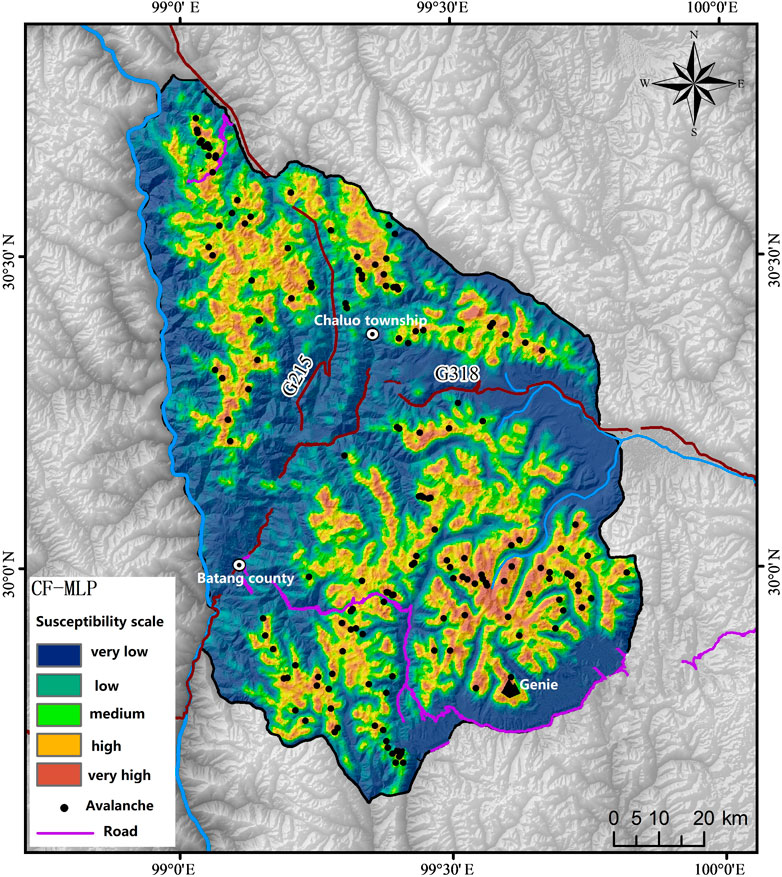
The 14 CF-weighted impact factors are used as the input layer of the MLP model, and the EBF-MLP model is established and implemented in the same way. The final avalanche susceptibility probability value is used as a comprehensive index of avalanche susceptibility zoning in the study area, and the probability value ranges from (0, 1). The avalanche susceptibility index interval of the CF-MLP model is (0, 0.988), which is divided into five susceptibility intervals: very low (0–0.116), low (0.116–0.286), medium (0.286–0.473), high (0.473–0.655), and very high (0.655–0.988) using the natural intermittent method, and the results are shown in Figure 10.
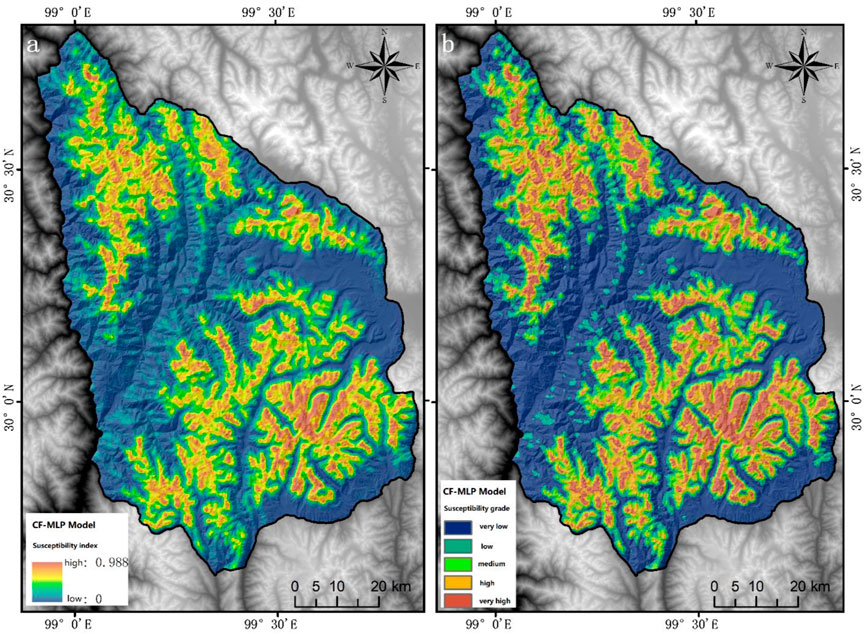
FIGURE 10. CF-MLP model susceptibility zoning map (A); CF-MLP model susceptibility zonation map was segmented by the natural discontinuity method (B).
4.6 Result test
4.6.1 Kappa coefficient
The kappa coefficient is a consistency test for binary classification prediction problems, and the model performance is evaluated by judging whether the model classification prediction results are consistent with the actual classification results (Kraemer, 2014). Kappa coefficient is calculated based on the confusion matrix with a value range of (−1, 1), but is usually greater than 0. The Kappa coefficient greater than or equal to 0.8 is almost perfect, 0.6–0.8 is substantial, 0.4–0.6 is moderate, 0.2–0.4 is fair and lower than 0.2 is slight. The kappa coefficients are calculated as follows. The Kappa coefficient of the five evaluation models were 0.584 (FR), 0.552 (EBF-LR), 0.522(CF-LR), 0.433 (EBF-MLP), and 0.606 (CF-MLP).
Po is actual agreement rate, Pe is theoretical agreement rate.
4.6.2 ROC curve
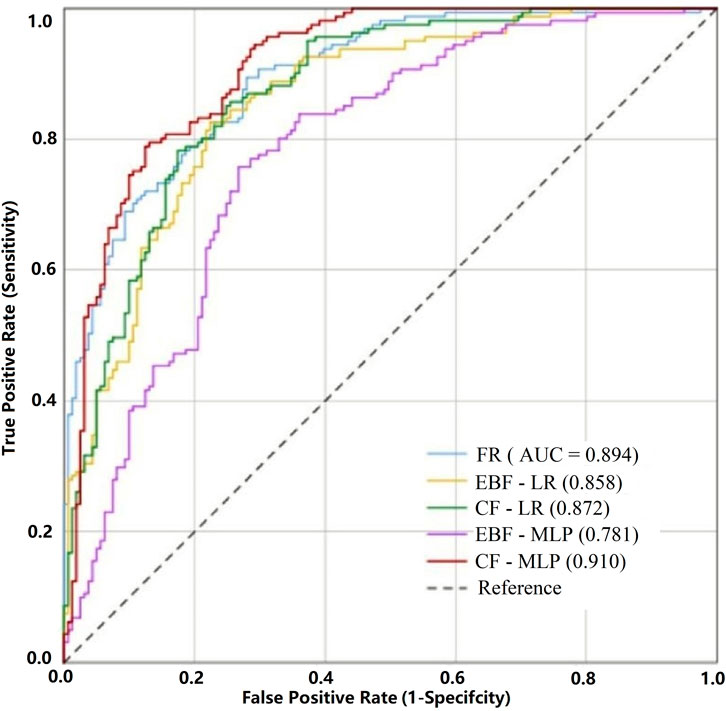
The receiver operating characteristic curve (Receiver Operating Characteristic curve) has been widely used to test the accuracy of models in many research fields (Cantarino et al., 2019; Merghadi et al., 2020). The ROC curve is based on the graphs generated at different thresholds (or critical points) of true positive rate (sensitivity) and false positive rate (1-specificity) on the X-axis to visually express the model evaluation accuracy.
Sensitivity and specificity essentially indicate the probability that the model correctly judges avalanche and non-avalanche, but these two indicators do not show the overall accuracy of the model performance, so the AUC value of the area under the ROC curve is generally used to test the model accuracy, and the value range of AUC is (0, 1), when AUC ≤0.5. This indicates that the model has no predictive value. If 0.5 < AUC ≤0.7, it indicates that the model accuracy is low; while 0.7 < AUC<0.9, indicates a high the model accuracy; An AUC value is closer to 1 shows the a higher model prediction accuracy (Mandrekar, 2010).
In order to ensure the reliability of the machine learning model, the CF-MLP and EBF-MLP models randomly segmented the training samples for five times respectively, and the mean values of the AUC after five segmented times were close to that of the first sample segmentation. Therefore, CF-MLP and EBF-MLP adopt the model and results obtained from the first sample segmentation training in this paper. The probability of avalanche occurrence and the actual state of the test sample in the evaluation model were tested by ROC curve, and the test results are shown in Figure 11. The AUC values of the five evaluation models were 0.894 (FR), 0.858 (EBF-LR), 0.872 (CF-LR), 0.781 (EBF-MLP), and 0.910 (CF-MLP). The results showed that the minimum value of AUC for the five models was 0.781, and all models could pass the accuracy test.
5 Discussion
5.1 Model accuracy comparison analysis
The avalanche susceptibility evaluation was conducted for the central part of the Shaluli Mountain system based on traditional models and four machine learning integrated models. All five models passed the accuracy test.
The results show that all five models are suitable for avalanche susceptibility evaluation in the study area, among which CF-MLP (Kappa = 0.606, AUC = 0.910) is the most accurate and the most effective model.
Compared with the traditional single FR model, the different integrated models showed significant differences in terms of consistency and accuracy tests, which reflect the performance of the combination of mathematical-statistical algorithms and machine learning models was not necessarily better than that of the traditional models. For the same statistical algorithm, the effect of EBF-LR is better than that of EBF-MLP model. This indicates that there are various possibilities for the combined performance of different algorithms and different machine learning models (Seliverstov et al., 2008).
In this study, the model with EBF-MLP (Kappa = 0.433, AUC = 0.781) had the worst performance, but in fact, the EBF model has been widely used in other studies and usually shows good accuracy, and it cannot be said that EBF does not work well when combined with a neural network model. For example, Tehrany et al. (2019) used EBF in combination with SVM to map flood susceptibility and obtained highly accurate results. This suggests that models or methods that performing well in other hazard susceptibility evaluations are not necessarily applicable to regional avalanche susceptibility studies.
The model accuracy of CF-LR improved nearly 1.63% over that of EBF-LR, and the model accuracy of CF-MLP improved nearly 4.36% over that of CF-LR, indicating that CF and MLP are the optimal combinations in this study.
In summary, the CF-MLP model is the best avalanche susceptibility evaluation model in this study. The FR (Kappa = 0.584, AUC = 0.894) model has the next highest accuracy, and the combination of CF algorithm and machine learning model performs better than the EBF algorithm.
5.2 Comparative analysis of impact factor importance
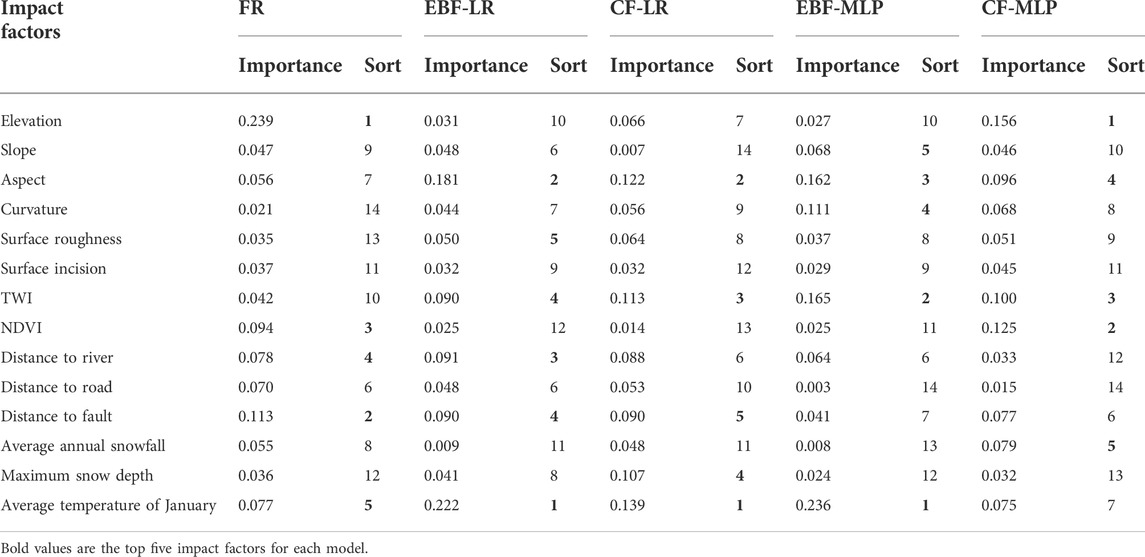
The importance of the influencing factors in the evaluation models reflect the degree of contribution of the different factors to the occurrence of avalanches. The importance of the factors in the FR model can be determined by the total value of the frequency ratio of each factor. The importance of the factors in the EBF-LR and CF-LR models can be determined by logistic regression coefficients, and the importance of the factors in the EBF-MLP and CF-MLP models can be obtained after machine learning modeling. The importance and importance ranking of the five model impact factors are shown in Table 2.
The importance of each evaluation factor obtained by the five models is different. The most important factor in FR and CF-MLP models is altitude. Altitude represents the topographic conditions of avalanche formation and often provides potential energy and temperature conditions for avalanche formation. The most important factor for EBF-LR, CF-LR and EBF-MLP is the average temperature in January. The average temperature in January represents the cold storage conditions in the avalanche development area, which is also an important feature different from the area where avalanches are not easy to occur. The second most important factor of EBF-LR and CF-LR models is the slope aspect. The factors ranking second in importance in FR, EBF-MLP and CF-MLP models are distance from fault, topographic humidity index and vegetation index respectively. Based on the results of each model, it can be seen that the main influencing factors affecting the formation of avalanches are altitude, monthly average temperature, slope direction, distance from fault, topographic humidity index and vegetation index.
The correlation between avalanche and the most important factors shows that although the model evaluation results vary, the sensitivity of the five models to the terrain factor presents a high degree of consistency in the evaluation process of susceptibility involving the three key factors of terrain, climate, and snowpack through the analysis of the influence factor importance, which also mutually verifies the accuracy of the five models.
The importance of feature factors can be obtained by modeling the training samples through machine learning algorithm. The selection and importance of feature factors have a great influence on the reliability of the model. It is agreed that the selection of appropriate factors is the key to the reliability of the model (Huynh et al., 2012; Wu and Liu, 2021). Through field investigation, it is found that avalanches in the Shaluli mountain are mostly developed in the narrow gully zone on the snow line, and the intensity and frequency of snowfall in the area are higher than other areas. At the same time, referring to previous studies on avalanche formation mechanism and susceptibility (Schweizer et al., 2015; Mosavi et al., 2020), it is shown that terrain, climate and snow conditions are the three main aspects of avalanche formation and feature selection. Therefore, the selection of feature factors in this paper is credible.
5.3 Comparative analysis of avalanche susceptibility zoning results
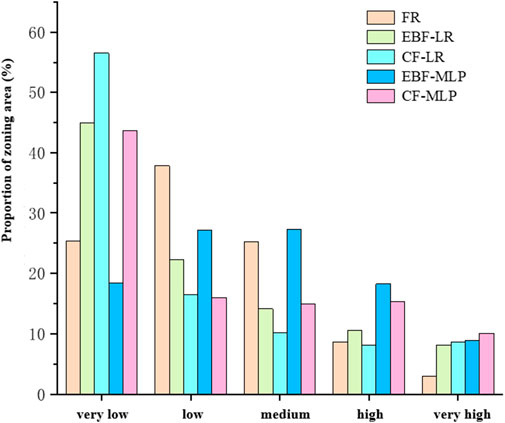
Through the above tests of model accuracy, the deterministic coefficient-multi-layer perceptron (CF-MLP) model is the best evaluation model for this study, and the accuracy-test has judged the model performance. It is easy to see that the avalanche susceptibility zoning maps of the five models have different degrees of differences, so it is necessary to further analyze the area and distribution of the avalanche susceptibility zoning classes in the study area, and through the zoning area data. The histogram of the area share of susceptibility classes of the FR model and the four integrated models is shown in Figure 12.
In terms of the area share of each class of the model susceptibility zones (Figure 12), the total area share of the very low and low susceptibility zones of the five models is generally larger than the total area share of the very high and high zones, which is consistent with the results of field investigation.
Among them, the EBF-MLP model has the smallest area share in the very low susceptibility area, while the area share in the low and medium susceptibility areas is more than 25%. The area proportion of EBF-MLP model was the largest in the region with very low susceptibility. The four models accounted for less than 13% of the area in the very high susceptibility area.
In summary, the CF-MLP model was used as the avalanche susceptibility evaluation model for the study area. According to Figure 13, the areas with very high avalanche susceptibility are mainly concentrated in Genie Mountain in Litang County and the alpine mountains on both sides of G215 route in Chaluo township in Batang County.
The average altitude of the area with very high avalanche susceptibility in the study area is about 5000 m, and that of the area with high avalanche susceptibility is about 4800 m. The remains of these high-altitude paleo-erosion mountains are rich in paleo-cirque topography and snow-eroded depressions with numerous avalanche troughs and steep slopes, which are good places for avalanche development. The back-wall slopes of the glacier are snow cornices and ice peaks which are covered with snow all the year round. The avalanche resources are abundant and the vegetation coverage is low. On the other hand, due to the high altitude of the region, the temperature is generally more than 5–10°C lower than that of the eastern plains at the same latitude, the overall topography is high in the north and low in the south, while the Jinsha River and Baqu River valley are open to the south, which becomes a transport channel for the humid airflow from the south in summer. Hence, the snowfall is abundant in the peaks above 4500 m above sea level. In addition, according to the 30-year meteorological data of the sites around the study area, the avalanche occurred in the region. The lower elevation limit is between 4600 and 4700 m. The average annual solid precipitation is presumed to be up to about 300 mm, and the average annual snowfall days are about 65 days. Therefore, the regional avalanche climate and topographical conditions together provide the environmental conditions for the occurrence of avalanches in the study area. The constructed Sichuan-Tibet Railway will cross the study area from east to northwest by a tunnel. Though the line elevation is lower than that of the National road G318, and it is less affected by avalanches than the National road, while along the entrance and exit of the tunnel more attention to prevent snow avalanche risk shall be paid.
6 Conclusion
An avalanche susceptibility evaluation study was conducted in the central part of the Shaluli Mountain system based on an integrated machine learning model, combining field survey, remote sensing interpretation, and spatial analysis to establish remote sensing interpretation markers of avalanches in the study area, obtain the location of avalanches in the study area in recent years, and select altitude, slope, slope direction, ground curvature, surface roughness, surface cut, TWI, NDVI, water system, fault, road, average annual snowfall, maximum annual snow depth and January temperature as 14 factors for avalanche susceptibility evaluation in the study area. Roads, average annual snowfall, maximum annual snow depth, and average January temperature were selected as 14 factors to evaluate the avalanche susceptibility in the study area. Four integrated models, EBF-LR, CF-LR and EBF-MLP, CF-MLP, were constructed based on the frequency ratio model (FR) and statistical models of data - evidence confidence function (EBF) and certainty coefficient (CF) with two machine learning models - logistic regression (LR) and multilayer perceptron (MLP) The avalanche susceptibility evaluation and susceptibility zoning map were conducted for the central part of the Shaluli Mountain system. The main findings of this paper are as follows.
1) In terms of the accuracy of the evaluation model, the CF-MLP model was the best avalanche susceptibility evaluation model in this study. The FR (Kappa = 0.584, AUC = 0.894) model was the second most accurate, and the combination of the CF algorithm and the machine learning model performed better than the EBF algorithm.
2) In terms of avalanche influence factor importance, the most important influence factors in this study are elevation, slope direction, terrain moisture index, and average January temperature, of which the first three are terrain factors, and the only temperature is prominent among climate factors. The sensitivity of the five models to terrain factors in the evaluation of susceptibility involving three key factors, terrain, climate, and snowpack, shows a high degree of consistency, which also indicates the accuracy of the sensitivity of the five models to the evaluation factors.
3) In terms of avalanche susceptibility partitioning, the overall effect of the integrated machine learning model in this study is better than that of the traditional single FR model, and the integrated model susceptibility partitioning maps involving the MLP model and the LR model have their advantages, but after a comprehensive comparison, CF-MLP is still the best performing integrated machine learning model.
4) Based on the CF-MLP model, the area with very high avalanche susceptibility accounted for 10.01% in the study area. The area with very high susceptibility is concentrated in the South of Lingchang Village in Litang County, Genie Mountains, and both sides of the alpine mountains. Special attention should be paid to land planning and construction as well as the safety of residents and tourists in these areas.
Data availability statement
The original contributions presented in the study are included in the article/supplementary material, further inquiries can be directed to the corresponding author.
Author contributions
RB: data collection and analysis, writing; KH: investigation, data collection and analysis; XL: conceptualization, validation, methodology, supervision and writing; SL: conceptualization and methodology; HW: investigation, data collection and analysis; XW: conceptualization, validation and supervision.
Funding
This work was supported by the Research Program of China Railway Construction Co. Ltd (Grant No. 2019-B14), Key R&D Program of Sichuan (Grant Nos. 2019YFG0460, 2019YFG0001), Natural Science Foundation of Sichuan Province for Young Scholars (Grant No. 22NSFSC0607), and Major Systematic R&D Project of China Railway Corporation (Grant No. P2018G047).
Acknowledgments
We thank the technical staff and workers working on the investigation site of Sichuan-Tibet Railway for support in the field and technical assistance.
Conflict of interest
The authors declare that the research was conducted in the absence of any commercial or financial relationships that could be construed as a potential conflict of interest.
Publisher’s note
All claims expressed in this article are solely those of the authors and do not necessarily represent those of their affiliated organizations, or those of the publisher, the editors and the reviewers. Any product that may be evaluated in this article, or claim that may be made by its manufacturer, is not guaranteed or endorsed by the publisher.
References
Ancey, C., Gervasoni, C., and Meunier, M. (2004). Computing extreme avalanches. Cold Reg. Sci. Technol. 39, 161–180. doi:10.1016/j.coldregions.2004.04.004
Bartelt, P., Bebi, P., Feistl, T., Buser, O., and Caviezel, A. (2018). Dynamic magnification factors for tree blow-down by powder snow avalanche air blasts. Nat. Hazards Earth Syst. Sci. 18, 759–764. doi:10.5194/nhess-18-759-2018
Bühler, Y., Adams, M. S., Bösch, R., and Stoffel, A. (2016). Mapping snow depth in alpine terrain with unmanned aerial systems (UASs): Potential and limitations. Cryosphere 10 (3), 1075–1088. doi:10.5194/tc-10-1075-2016
Bühler, Y., Kumar, S., Veitinger, J., Christen, M., and Stoffel, A. (2013). Automated identification of potential snow avalanche release areas based on digital elevation models. Nat. Hazards Earth Syst. Sci. 13, 1321–1335. doi:10.5194/nhess-13-1321-2013
Cantarino, I., Carrion, M. A., Goerlich, F., and Ibañez, V. M. (2019). A ROC analysis-based classification method for landslide susceptibility maps. Landslides 16 (2), 265–282. doi:10.1007/s10346-018-1063-4
Castebrunet, H., Eckert, N., and Giraud, G. (2012). Snow and weather climatic control on snow avalanche occurrence fluctuations over 50 yr in the french alps. Clim. Past. 8, 855–875. doi:10.5194/cp-8-855-2012
Choubin, B., Borji, M., Hosseini, F. S., Mosavi, A., and Dineva, A. A. (2020). Mass wasting susceptibility assessment of snow avalanches using machine learning models. Sci. Rep. 10 (1), 18363. doi:10.1038/s41598-020-75476-w
Choubin, B., Borji, M., Mosavi, A., Sajedi-Hosseini, F., Singh, V. P., Shamshirband, S., et al. (2019a). Snow avalanche hazard prediction using machine learning methods. J. Hydrol. X. 577, 123929. doi:10.1016/j.jhydrol.2019.123929
Choubin, B., Mosavi, A., Alamdarloo, E. H., Hosseini, F. S., Shamshirband, S., Dashtekian, K., et al. (2019b). Earth fissure hazard prediction using machine learning models. Environ. Res. 179, 108770. doi:10.1016/j.envres.2019.108770
Conway, H., and Wilbour, C. (1999). Evolution of snow slope stability during storms. Cold Reg. Sci. Technol. 30 (1-3), 67–77. doi:10.1016/S0165-232X(99)00009-9
Dempster, A. P. (1968). A generalization of Bayesian inference. J. R. Stat. Soc. Ser. B Methodol. 30, 205–232. doi:10.1111/j.2517-6161.1968.tb00722.x
Dent, J., and Lang, T. (1983). A biviscous modified Bingham model of snow avalanche motion. Ann. Glaciol. 4, 42–46. doi:10.3189/S0260305500005218
Fischer, J. (2013). A novel approach to evaluate and compare computational snow avalanche simulation. Nat. Hazards Earth Syst. Sci. 13, 1655–1667. doi:10.5194/nhess-13-1655-2013
Fischer, J., Kofler, A., Fellin, W., Granig, M., and Kleemayr, K. (2015). Multivariate parameter optimization for computational snow avalanche simulation. J. Glaciol. 61, 875–888. doi:10.3189/2015JoG14J168
Ghorbani Nejad, S., Falah, F., Daneshfar, M., Haghizadeh, A., and Rahmati, O. (2017). Delineation of groundwater potential zones using remote sensing and GIS-based data-driven models. Geocarto Int. 32, 1–21. doi:10.1080/10106049.2015.1132481
Hafner, E. D., Techel, F., Leinss, S., and Bühler, Y. (2021). Mapping avalanches with satellites–evaluation of performance and completeness. Cryosphere 15, 983–1004. doi:10.5194/tc-15-983-2021
Hao, C., Chen, N., Zhuotong, N., Yudan, W., Xiaobo, W., and Lin, Z. (2017). Correction of the daily precipitation data over the Tibetan Plateau with machine learning models. J. Glaciol. Geocryol. 39, 583–592. doi:10.7522/j.issn.1000-0240.2017.0065
Huggel, C., Haeberli, W., Kääb, A., Bieri, D., and Richardson, S. (2004). An assessment procedure for glacial hazards in the Swiss Alps. Can. Geotech. J. 41, 1068–1083. doi:10.1139/T04-053
Huynh, V. A., Saeys, Y., Wehenkel, L., and Geurts, P. (2012). Statistical interpretation of machine learning-based feature importance scores for biomarker discovery. Bioinformatics 28 (13), 1766–1774. doi:10.1093/bioinformatics/bts238
Jamieson, B., and Stethem, C. (2002). Snow avalanche hazards and management in Canada: Challenges and progress. Nat. Hazards (Dordr). 26 (1), 35–53. doi:10.1023/A:1015212626232
Karlik, B., and Olgac, A. V. (2011). Performance analysis of various activation functions in generalized MLP architectures of neural networks. Int. J. Artif. Intell. Expert Syst. 1, 111–122.
Kraemer, H. C. (2014). Kappa coefficient. Stanford, CA: Wiley StatsRef: statistics reference online, 1–4.
Lato, M., Frauenfelder, R., and Bühler, Y. (2012). Automated detection of snow avalanche deposits: segmentation and classification of optical remote sensing imagery. Nat. Hazards Earth Syst. Sci. 12, 2893–2906. doi:10.5194/nhess-12-2893-2012
Laxton, S. C., and Smith, and D. J. (2009). Dendrochronological reconstruction of snow avalanche activity in the Lahul Himalaya, Northern India. Nat. Hazards (Dordr). 49 (3), 459–467. doi:10.1007/s11069-008-9288-5
Lehning, M., Bartelt, P., Brown, B., Russi, T., Stöckli, U., Zimmerli, M., et al. (1999). SNOWPACK model calculations for avalanche warning based upon a new network of weather and snow stations. Cold Reg. Sci. Technol. 30, 145–157. doi:10.1016/S0165-232X(99)00022-1
Li, G., Sun, Y., and Qi, C. (2021). Machine learning-based constitutive models for cement-grouted coal specimens under shearing. Int. J. Min. Sci. Technol. 31, 813–823. doi:10.1016/j.ijmst.2021.08.005
Mandrekar, J. N. (2010). Receiver operating characteristic curve in diagnostic test assessment. J. Thorac. Oncol. 5 (9), 1315–1316. doi:10.1097/JTO.0b013e3181ec173d
Merghadi, A., Yunus, A. P., Dou, J., Whiteley, J., ThaiPham, B., Bui, D. T., et al. (2020). Machine learning methods for landslide susceptibility studies: a comparative overview of algorithm performance. Earth. Sci. Rev. 207, 103225. doi:10.1016/j.earscirev.2020.103225
Meseșan, F., Man, T. C., Pop, O. T., and Gavrilă, I. G. (2019). Reconstructing snow-avalanche extent using remote sensing and dendrogeomorphology in Parâng Mountains. Cold Reg. Sci. Technol. 157, 97–109. doi:10.1016/j.coldregions.2018.10.002
Mosavi, A., Shirzadi, A., Choubin, B., Taromideh, F., Hosseini, F. S., Borji, M., et al. (2020). Towards an ensemble machine learning model of random subspace based functional tree classifier for snow avalanche susceptibility mapping. IEEE Access 8, 145968–145983. doi:10.1109/ACCESS.2020.3014816
Peng, C., Yang, J., Fenghuan, S., Yonggang, G., Xiaoqing, C., and Qiang, Z. (2017). Natural hazards in tibetan Plateau and key issue for feature research. Bull. Chin. Acad. Sci. 32, 985–992.
Pham, B. T., Phong, T. V., Nguyen, H. D., Qi, C., Al-Ansari, N., Amini, A., et al. (2020). A comparative study of kernel logistic regression, radial basis function classifier, multinomial naïve bayes, and logistic model tree for flash flood susceptibility mapping. Water 12, 239. doi:10.3390/w12010239
Podolskiy, E. A., Izumi, K., Suchkov, V. E., and Eckert, N. (2014). Physical and societal statistics for a century of snow-avalanche hazards on sakhalin and the kuril islands (1910–2010). J. Glaciol. 60 (221), 409–430. doi:10.3189/2014JoG13J143
Rahmati, O., Ghorbanzadeh, O., Teimurian, T., Mohammadi, F., Tiefenbacher, J. P., and Falah, F. (2019). Spatial modeling of snow avalanche using machine learning models and geo-environmental factors: comparison of effectiveness in two mountain regions. Remote Sens. (Basel). 11 (24), 2995. doi:10.3390/rs11242995
Ramchoun, H., Amine, M., Idrissi, J., Ghanou, Y., and Ettaouil, M. (2016). Multilayer perceptron: architecture optimization and training. Int. J. Interact. Multimedia Artif. Intell. 4, 26. doi:10.9781/ijimai.2016.415
Rumelhart, D. E., and Zipser, D. (1985). Feature discovery by competitive learning. Cognitive Sci. 9, 75–112. doi:10.1207/s15516709cog0901_5
Schweizer, J., Bartelt, P., and van Herwijnen, A. (2015). Chapter 12: Snow avalanches. Snow and ice-related hazards, risks, and disasters. Davos, 395–436.
Schweizer, J., Bruce Jamieson, J., and Schneebeli, M. (2003). Snow avalanche formation. Rev. Geophys. 41 (4), 1–25. doi:10.1029/2002RG000123
Seliverstov, Y., Glazovskaya, T., Shnyparkov, A., Vilchek, Y., Sergeeva, K., Martynov, A., et al. (2008). Assessment and mapping of snow avalanche risk in russia. Ann. Glaciol. 49, 205–209. doi:10.3189/172756408787814672
Shafer, G. (1976). A mathematical theory of evidence. Princeton university press. doi:10.1515/9780691214696
Shortliffe, E. H., and Buchanan, B. G. (1975). A model of inexact reasoning in medicine. Math. Biosci. 23 (3-4), 351–379. doi:10.1016/0025-5564(75)90047-4
Steinkogler, W., Sovilla, B., and Lehning, M. (2014). Influence of snow cover properties on avalanche dynamics. Cold Reg. Sci. Technol. 97, 121–131. doi:10.1016/j.coldregions.2013.10.002
Techel, F., Zweifel, B., and Winkler, K. (2015). Analysis of avalanche risk factors in backcountry terrain based on usage frequency and accident data in Switzerland. Nat. Hazards Earth Syst. Sci. 15, 1985–1997. doi:10.5194/nhess-15-1985-2015
Tehrany, M. S., Kumar, L., and Shabani, F. (2019). A novel GIS-based ensemble technique for flood susceptibility mapping using evidential belief function and support vector machine: Brisbane, Australia. PeerJ 7, e7653. doi:10.7717/peerj.7653
Walsh, S. J., Brown, D. G., and Bian, L. (1990). Comparison of landsat thematic mapper digital enhancements of snow-avalanche paths: validation through GIS/remote sensing integration. Int. Geoscience Remote Sens. Symposium, 1161–1164. doi:10.1109/IGARSS.1990.688703
Wang, G., Zhang, K., Cao, K., Wang, A., Xu, Y., and Meng, Y. (2010). Expanding processes of the qinghai-tibet plateau during cenozoic: an insight from spatio-temporal difference of uplift. Earth Science-Journal China Univ. Geoscience 35, 713
Wang, Q. L., Han, Y. J., Guo, B., Wang, M. T., Ran, W. Q., and Chen, J. (2019). Temporal and spatial evolution of climate dry and wet conditions in Ganzi in the past 57 years. Chin. J. Agrometeorology 40, 435.
Wen, H., Wu, X., Liao, X., Wang, D., Huang, K. Y., Wünnemann, B., et al. (2022). Application of machine learning methods for snow avalanche susceptibility mapping in the Parlung Tsangpo catchment, southeastern Qinghai-Tibet Plateau. Cold Reg. Sci. Technol. 198, 103535. doi:10.1016/j.coldregions.2022.103535
Wu, A. J., and Liu, Y. X. (2021). Machine learning-based investigation of feature importance for high-latitude ionospheric scintillation forecasting, Proceedings of the 2021 International Technical Meeting of The Institute of Navigation, 2021, pp. 637. doi:10.33012/2021.17855
Xi, C., Han, M., Hu, X., Liu, B., He, K., Luo, Gang., et al. (2022). Effectiveness of newmark-based sampling strategy for coseismic landslide susceptibility mapping using deep learning, support vector machine, and logistic regression. Bull. Eng. Geol. Environ. 81, 174. doi:10.1007/s10064-022-02664-5
Xiong, P., Tong, L., Zhang, K., Shen, X., Battiston, R., Ouzounov, D., et al. (2021). Towards advancing the earthquake forecasting by machine learning of satellite data. Sci. Total Environ. 771, 145256. doi:10.1016/j.scitotenv.2021.145256
Yang, J., Li, C., Li, L., Ding, J., Zhang, R., Han, T., et al. (2020). Automatic detection of regional snow avalanches with scattering and interference of C-band SAR Data. Remote Sens. (Basel). 12 (11), 2781. doi:10.3390/rs12172781
Youssef, A. M., Pourghasemi, H. R., Pourtaghi, Z. S., and Al-Katheeri, M. M. (2016). Landslide susceptibility mapping using random forest, boosted regression tree, classification and regression tree, and general linear models and comparison of their performance at wadi tayyah basin, asir Region, Saudi Arabia. Landslides 13 (5), 839–856. doi:10.1007/s10346-015-0614-1
Keywords: snow avalanche, impact factor, susceptibility evaluation, machine learning ensemble model, Shaluli Mountain
Citation: Bian R, Huang K, Liao X, Ling S, Wen H and Wu X (2022) Snow avalanche susceptibility assessment based on ensemble machine learning model in the central Shaluli Mountain. Front. Earth Sci. 10:880711. doi: 10.3389/feart.2022.880711
Received: 21 February 2022; Accepted: 08 July 2022;
Published: 24 August 2022.
Edited by:
Ning Huang, Lanzhou University, ChinaReviewed by:
Calogero Schillaci, Joint Research Centre, ItalySneh Mani, Defence Research and Development Organisation (DRDO), India
Copyright © 2022 Bian, Huang, Liao, Ling, Wen and Wu. This is an open-access article distributed under the terms of the Creative Commons Attribution License (CC BY). The use, distribution or reproduction in other forums is permitted, provided the original author(s) and the copyright owner(s) are credited and that the original publication in this journal is cited, in accordance with accepted academic practice. No use, distribution or reproduction is permitted which does not comply with these terms.
*Correspondence: Xin Liao, eGlubGlhb0Bzd2p0dS5lZHUuY24=
 Rui Bian1,2
 Xin Liao
 Xiyong Wu