 Sana Khan
 Dalia B. Kirschbaum1
 Thomas A. Stanley
 Pukar M. Amatya
 Robert A. Emberson
94% of researchers rate our articles as excellent or good
Learn more about the work of our research integrity team to safeguard the quality of each article we publish.
Find out more
ORIGINAL RESEARCH article
Front. Earth Sci., 04 July 2022
Sec. Geoscience and Society
Volume 10 - 2022 | https://doi.org/10.3389/feart.2022.878996
Landslides triggered by extreme rainfall can be devastating, resulting in loss of life, property, and infrastructure. Landslide forecasting systems provide an opportunity to build awareness of potential hazards and ultimately take preemptive measures. There is currently a dearth of forecasting systems that provide regional or global coverage, but these systems can offer important situational awareness in data-sparse, ungauged, or large-scale catchments. A near global, primarily satellite-based system called the Landslide Hazard Assessment for Situational Awareness (LHASA) provides near real-time estimates of potential landslide hazard and exposure around the world. In this work, a precipitation forecast module is introduced into LHASA to complement the existing LHASA framework and provide an estimate of landslide hazard up to 3 days in advance at 1 km resolution. The model-based Goddard Earth Observing System-Forward Processing (GEOS-FP) precipitation forecast product is used as the forcing input for the model in place of the satellite-based Integrated Multi-satellitE Retrievals for Global Precipitation Mission product. Soil moisture and snow depth from the GEOS-FP assimilated product are also incorporated. The study period January 2020–January 2021 is used to test the model performance against the LHASA near real-time estimates at multiple spatiotemporal scales. Validation of the model is carried out using a collection of rainfall-triggered landslide inventories from around the world as case studies to demonstrate the potential utility and limitations of this system. The rescaling of the GEOS-FP precipitation product is a critical step in incorporating the forecasted precipitation data within LHASA-Forecast (LHASA-F). Combining different streams of forecasted data within the LHASA-F framework shows promise, particularly for larger events at the 1- and 2-days lead time for events. Results indicate that for the case studies evaluated, the LHASA-F is generally able to resolve major landslide events triggered by extreme rainfall, such as from tropical cyclones. The analysis shows that landslide forecast outputs may be represented differently depending on the user’s needs. This framework serves as a first milestone in providing a global predictive view of landslide hazard.
Landslides are pervasive in mountainous areas and adversely affect human life and infrastructure (Chester 1995; Peel et al., 2007). Key factors leading to landslides can be broadly classified into two categories: the dynamic triggering mechanisms like extreme rainfall and local soil moisture conditions and prevalent ground conditions (Guzzetti et al., 2020). It is critical to develop near real-time and early warning systems for predicting impending events. These systems could provide, emergency managers and planners, advanced situational awareness to save lives and property. Predicting when and where landslides may occur and issuing warnings, accordingly, is an evolving area of research. Landslide models can either be designed to function as near real-time or forecasting systems. Literature refers to predictive systems using several different terms, such as landslide models, forecast models, warning models, and warning systems. A forecast model provides estimate of the future state of a natural system obtained with a numerical model (Ramage, 2022). A “warning model” is a framework to issue landslide advisories and can incorporate one or more landside models and advisory protocols that are used to issue advisories. Comparatively, a “warning system” is a physical implementation of a warning model with one or more landslides forecast models (Guzzetti et al., 2020).
Landslide Early Warning Systems (LEWSs) are usually developed locally and are designed for specific uses, such as civil protection, hill slope monitoring, and regional situational awareness. According to literature, a total of five nations, 13 regions and the metropolitan areas of Chittagong, Hong Kong, and Seattle benefit from LEWSs (Guzzetti et al., 2020). An example of a near-real time system is Rio de Janeiro Brazil’s Alerta Rio system, which fuses information from susceptibility maps with the rain-gauge measurements, updated every 5 min (Calvello et al., 2015). Some examples of LEWSs that leverage numerical weather model Quantitative Precipitation Forecasts (QPF) include one Ahmed et al., 2018 proposed (operated on voluntary basis) for Chittagong Metropolitan Area, Bangladesh. This LEWS exploits empirical rainfall thresholds, daily QPF, and a statistically based landslide susceptibility zonation for preparing landslide forecasts. The Civil Protection Department of Sicily, southern Italy is operating a Hydrohazards Early Warning System (HEWS: flood and shallow landslide warning system) based on the combined use of rainfall thresholds, soil moisture modelling and QPF (Brigandì et al., 2017). Similarly, the regional government of Piedmont, northern Italy, is operating a regional LEWS which comprises three complementary landslide forecasting systems, namely, the DEFENSE (Tiranti et al., 2014), SMART (Tiranti and Rabuffetti, 2010) and TRAPS (Tiranti et al., 2013) systems. LEWS based on the comparison between hourly rainfall measures, rainfall forecasts up to +48 h, and 3D rainfall thresholds (using intensity, duration, and antecedent rainfall as rainfall parameters) is operated in the Emilia Romagna Region, Italy (Rosi et al., 2021). The Japanese Meteorological Department’s early-warning system is based on hourly rainfall, short-range precipitation forecasts, and soil-moisture index (Singh, 1995; Sugawara et al., 1983; Osanai et al., 2010), and the Norwegian national landslide early warning system uses hydrologic models and web tools to monitor and forecast hydrometeorological conditions that could potentially trigger landslides (Graziella et al., 2015). However, these LEWSs cover a very small percentage of the land susceptible to landslides globally (Nadim et al., 2006). Results compiled by Froude and Petley, (2018) suggest that most of these national and regional LEWSs do not operate where a large majority of fatal landslides occur and the risk of landslides to the population is high.
Kirschbaum et al. (2018) proposed a quasi-global near-real time Landslide Hazard Assessment for Situational Awareness (LHASA) model. LHASA combines satellite-based precipitation estimates from the Global Precipitation Measurement (GPM) mission with a landslide susceptibility map derived from information on slope, geology, road networks, fault zones, and forest loss, primarily from satellite-derived or publicly available data (Kirschbaum et al., 2018; Stanley and Kirschbaum, 2017). Version 2 of LHASA leverages machine learning to produce probabilistic ratings of landslide hazard at 1 × 1 km resolution at quasi-global scale (60°N-60°S) (Kirschbaum et al., 2020; Stanley et al., 2021). In addition to GPM rainfall estimates, LHASA version 2 ingests data on snow mass and soil moisture from the Soil Moisture Active Passive Level 4 (SMAP L4) product (Reichle et al., 2018). It also analyzes the exposure of population and road networks to landslide hazard for each level-2 administrative district (Emberson et al., 2020). Although LHASA version 2 provides near-global information in near-real time (∼4hrs latency), many stakeholders have expressed a preference for forecasting of landslide hazard, which is not addressed solely using satellite observations.
In this study, we test the feasibility of ingesting a global precipitation forecast from the NASA Goddard Earth Observing System Forward processing product (GEOS-FP; Molod et al., 2012; Rienecker et al., 2008) into the LHASA framework to provide probabilistic landslide estimates for one to 3 days in the future. As landslide hazards can be triggered in relatively short time, the global landslide forecast system could serve as a tool in conjunction with other situational awareness products for an impending major rainfall event (e.g., tropical storms). This represents a new effort in global landslide forecasting and a first attempt to provide a global predictive view of landslide hazard, which can be particularly useful in areas without ground-based systems or active monitoring programs. This work introduces the global LHASA-Forecast (LHASA-F) framework and evaluates its performance relative to the LHASA near-real time (LHASA-NRT) model and observed landslides. The overarching goal of this work is to determine the feasibility of incorporating a global forecast precipitation product within the LHASA framework to represent potential landslide hazards into future. This study considers analyses at global, regional, and local scales, with an emphasis on validation studies in multiple geographic and climatological settings using landslide inventories.
Precipitation is the key dynamic variable within the LHASA framework. The Integrated Multi-Satellite Retrievals for Global Precipitation Measurement (IMERG) product provides instantaneous precipitation estimates at a 30 min, 0.1° resolution from 60°N to 60°S by merging passive microwave and infrared data (Huffman et al., 2020). IMERG products are available at different latencies: the early product (latency of 4 h), the late product (12–14 h), and final product (3 months). The Early and Late product employ a climatological gauge correction from the Global Precipitation Climatology Project (GPCP; https://psl.noaa.gov/data/gridded/data.gpcp.html) and the Final product uses monthly gauge observations to adjust the precipitation estimates.
The GEOS system provides atmospheric and environmental variables including precipitation, soil moisture, and total precipitable water by integrating the GEOS Atmospheric General Circulation Model with land surface models (Rienecker et al., 2008; Molod et al., 2012). The GEOS FP system generates assimilation products, and 10-day forecasts. New observations are assimilated periodically (6hrs), and a forecast model is used to generate a time-series of hourly forecast products. The forecast product (GEOS-FP) is initialized four times a day at 00z, 06z, 12z, and 18z, respectively. GEOS-FP Forecast products provide precipitation estimates up to 10 days into the future at ∼0.25° × 0.31°/hr spatio-temporal resolution.
LHASA version 2 (refer to Section 2.2 for details) utilizes rescaled precipitation as a model input, mainly to account for the climatology at the grid scale, and to minimize the disparity between the near-real time and forecasted precipitation (Figure 3). Additionally, it supports the use of the previously trained model for landslide forecasting. Rescaling of the precipitation is accomplished by dividing the current daily rainfall estimates to historical 99th percentile rainfall (p99). The p99 values at each 0.1° grid cell are derived from a log-normal distribution, because it is less sensitive to skewness in the empirical data than other statistical distributions and fits the probability density function (pdf) of rainfall data well. Historical IMERG v06B data (2000–2018) are used to compute the 99th percentile (p99) for IMERG-NRT and GEOS-FP Forecast data (2018–2021) for computing p99 for rescaling forecasted precipitation.
An example of the rescaled precipitation (raw precipitation divided by p99) used to feed information on the precipitation for landslide modeling is shown in Figure 1. The raw precipitation totals (mm) from Tropical storm Linfa on 10 October 2020, can be seen in the top panels (Figures 3A,B) and the rescaled precipitation in the bottom panels respectively. It is observed that the magnitude difference between the near-real time daily accumulated precipitation (IMERG Early) and 24 h forecasted precipitation (GEOS-FP) is minimal in case of the rescaled precipitation (Figures 1C,F). Details regarding other dynamic variables used in LHASA-Forecast framework are included in Table 1.
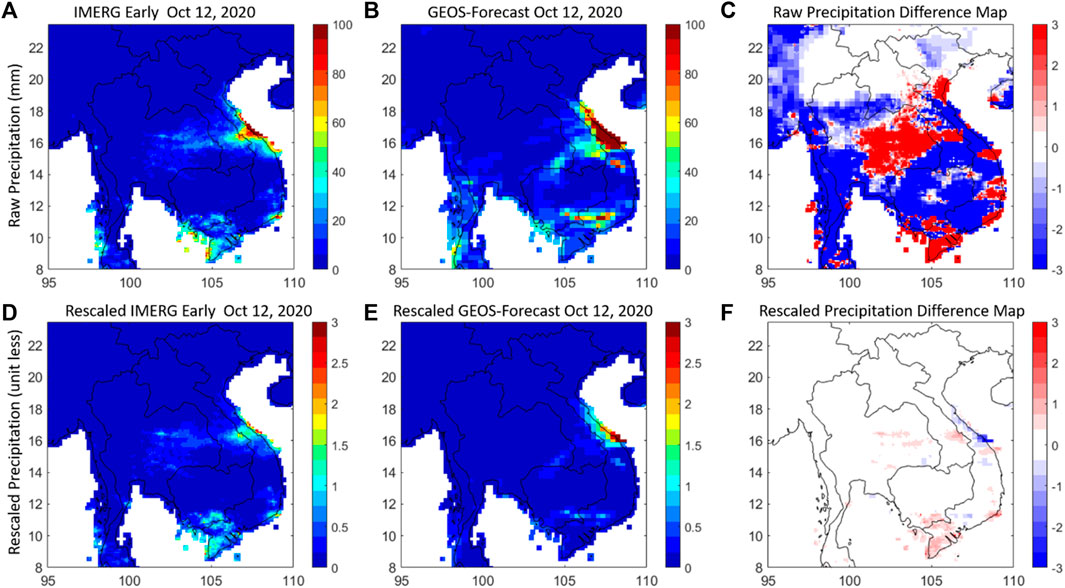
FIGURE 1. Rescaled precipitation example over Lower Mekong Region (LMR) used in the LHASA version 2 model. The top panels (A,B) exhibit the raw 24-h accumulated precipitation on 12 October 2020, for the LMR, and the bottom panels show the rescaled precipitation maps (D,E) for both near-real time (IMERG Early) and forecasted precipitation (GEOS-Forecast) products at daily scale. Red (C,F) indicates that IMERG Early has higher values than GEOS-Forecast and blue (C,F) corresponds to greater GEOS-Forecast precipitation accumulation.

TABLE 1. Dynamic variables description and sources used in LHASA-Forecast framework.
The Landslide inventories used in this study are mapped utilizing optical imagery from Planet (Planet Team, 2018) and Sentinel-2 using the Semi-Automatic Landslide Detection (SALaD) system (Amatya et al., 2021). A total of seven rainfall-induced landslide inventories are used in the model validation. Details are provided in Table 2 (more details on climate and geology of the locations in SM8). The quality of these inventories can be assessed using similar evaluation criteria to those described by Tanyaş et al., 2017. For each of the inventories, the high-resolution imagery allows differentiation of all landslide bodies. The boundary area of the mapped area is included in the datasets. The inventories are polygons of landslides triggered by the rainfall, although pre-event landslides are not differentiated–all mapped landslides are assumed to have resulted from the rainfall event associated with the inventory. The polygons do not differentiate between source and depositional areas for consistency.
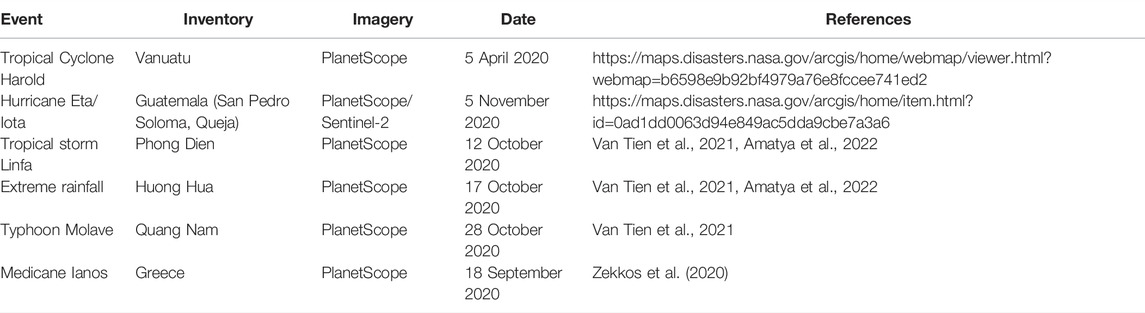
TABLE 2. Catalog of rainfall-triggered landslide inventories used for model evaluation.
LHASA version 2 advances beyond the original model by using a XGBoost machine-learning approach to incorporate soil moisture, snow mass, and geological information (Stanley et al., 2021). LHASA continues to use daily satellite rainfall estimates from the IMERG early and late run products to represent landslide-triggering rainfall, as well as antecedent precipitation. However, in version 2.0, LHASA separates these elements into a variable representing the current day’s rainfall and another variable representing the prior 2 days’ rainfall. The hydrologic effects of all precipitation prior to this 3-day period are represented by two state variables from the Soil Moisture Active Passive Level 4 (SMAP L4) product (Reichle et al., 2018): snow mass and total profile soil wetness. Finally, the relatively static effects of terrain and geologic material strength are represented by three variables: distance to active faults (Styron and Pagani, 2020), slope gradient from the Viewfinder Panoramas DEM (de Ferranti, 2015), and a global lithologic rating derived from the global lithologic map (Hartmann and Moosdorf, 2012). These factors were transformed to a probability of landslide occurrence using XGBoost, a machine-learning framework (Chen and Guestrin, 2016). To assign these probabilities, several landslide inventories were obtained and filtered by process type, trigger, and spatial uncertainty. Then the remaining landslides were merged into a global gridded landslide inventory with a 30-arcsecond daily resolution (Stanley et al., 2021). Dates and locations without recorded landslides were assumed to indicate landslide non-occurrence, and a random sample of these data were used for model development. The model was trained with data for the years 2015–2018 and evaluated with data for the years 2019–2020. LHASA version 2 raised the overall performance to an aggregated true positive rate of 93% from 45% for version 1.1, and therefore, adopted for routine operation. LHASA outputs a map of landslide hazard with a 30-arcsecond resolution that is updated 4 times daily; results can be viewed at https://landslides.nasa.gov/.
Herein, all analysis is conducted with LHASA version 2 and the near real-time (NRT) products will be referred to as LHASA-NRT, whereas the forecast product will be denoted as LHASA-F. LHASA-NRT has a 4-h latency due to the availability of the IMERG data. With LHASA-F, the global precipitation forecast is utilized to provide global landslide probabilistic estimates with a 3-days lead time. The forecast model framework is described in Figure 2. LHASA-F employs rescaled forecasted precipitation, soil moisture, and snow mass information from GEOS-FP forecast and assimilated products. These dynamic variables are fed into the machine-learning model from LHASA-NRT to estimate the probability of future landslides (Table 3).
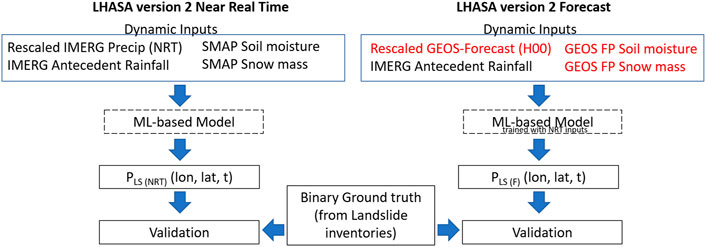
FIGURE 2. LHASA version 2 Near real-time (NRT) and Forecast (F) model workflow. The dynamic inputs highlighted in red text are the substitutions made in the forecast model. Both models provide landslide probability estimates at 1-km resolution. The model framework involves periodic validation with landslide inventories. Refer to Table 4 for details on the antecedent rainfall for LHASA-F 2-days and LHASA-F 3-days.
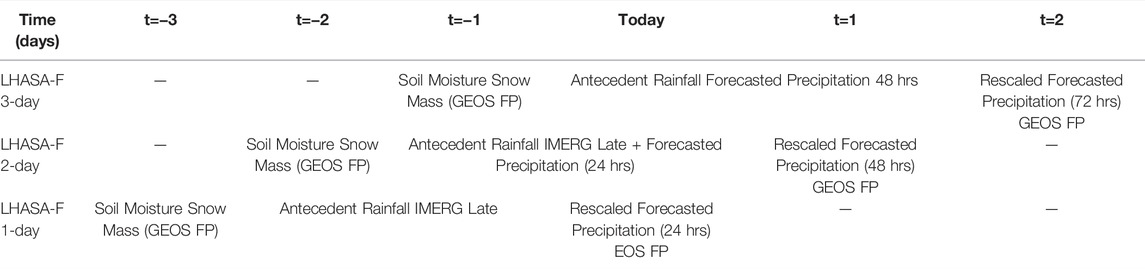
TABLE 3. Timeline for ingesting dynamic variables including rescaled forecasted precipitation, antecedent rainfall, soil moisture, and snow mass into the LHASA Forecast model for landslide probability estimation into future. This table shows timelines for 3-days forecast.
In this study, we assess LHASA-F probabilistic estimates at global, regional, and local scales against LHASA-NRT, with a special emphasis on case studies in landslide-prone areas using event-based landslide inventories.
To assess the global forecast performance, magnitude-based metrics such as mean absolute difference (MAD) and mean difference (MD) is used. These metrics are computed as follows:
Where Ncast represents version 2 LHASA-NRT probability estimates, and Fcast represents LHASA-F probability estimates respectively.
Furthermore, the performance LHASA-NRT and LHASA-F is compared at local scale using landslide inventories (Figure 3). The study period of 1 year from January 2020-January 2021 is used to evaluate the LHASA models.
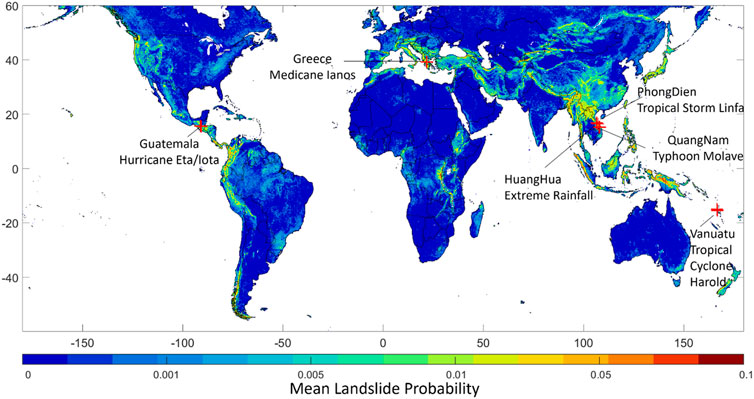
FIGURE 3. Location of landslide inventories used to validate both LHASA-NRT and Forecast models’ performance across the globe during January 2020-January 2021 analysis period. Red marks correspond to seven inventory locations. The background map shows the mean LHASA-NRT probabilities. Refer to Table 2 for details regarding the landslide inventories.
To assess LHASA-F performance at global scale, we first compute the mean absolute difference (MAD) between LHASA-NRT and LHASA-F (Figure 4). The MAD between LHASA-NRT and LHASA-F 1-day for an analysis period of 1 year shows small differences for the large regions shown in gray (<0.001 probability). Most of these areas are not highly susceptible to landslides (Stanley and Kirschbaum 2017). A closer look at the MAD for more hazardous regions such as Papua New Guinea (Figure 4A), Central and parts of northwestern South America (Figure 4B), high mountain Asia (Figure 4C), and Central Africa (Figure 4D) reveals differences ranging from 0.005–0.15 for mean probability. It should be noted that in regions where the LHASA-NRT mean probability is relatively high (Figure 3), the results for MAD are expected to diverge the most.
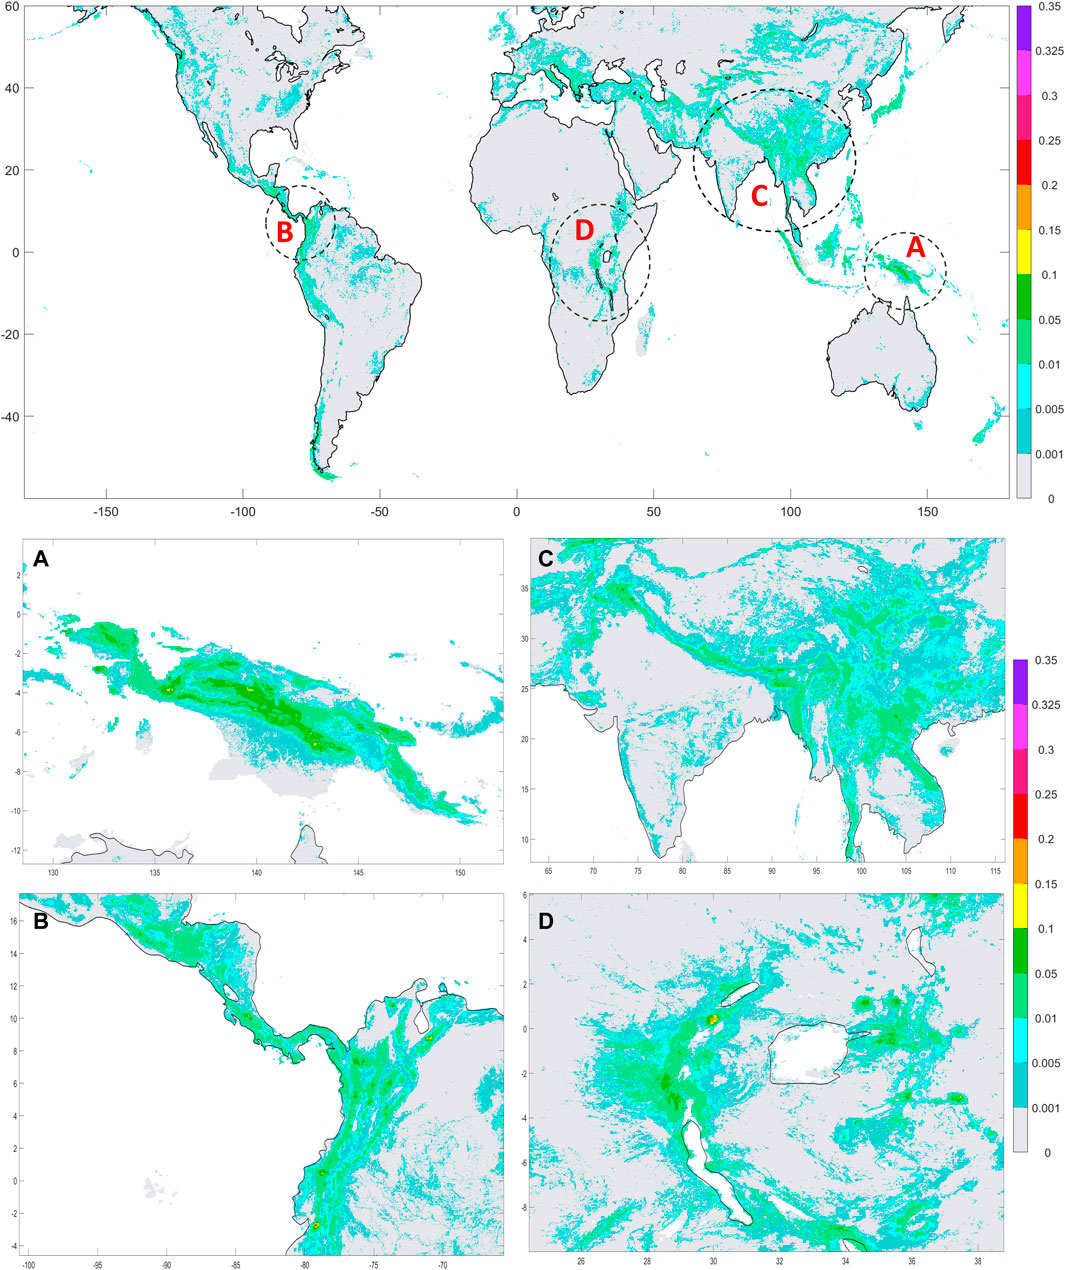
FIGURE 4. Global map of Mean Absolute Difference (MAD) between LHASA-NRT and LHASA-F 1-day landslide probability estimates. Dotted circles represent areas shown in panels below. A, B, C, and D represent 4 areas with different climates (tropical, temperate, continental, snow, and dry). The 4 panels show the mean absolute difference (MAD) for (A) Papua New Guinea, (B) Central and Northwestern parts of South America, (C) High Mountain Asia region, and (D) parts of central Africa.
Additionally, a global comparison between LHASA-NRT and LHASA-F 1-day is presented in terms of mean difference (probability) during the study period (Figure 5). The positive difference (red color) indicates higher LHASA-NRT estimates, and negative difference (blue), higher LHASA-F (1-day) estimates, respectively. On average, LHASA-F has lower probability values across the globe, and higher values (∼0.03) in some parts of western Venezuela and Colombia (Figure 5B). Moreover, in complex terrains with high landslide hazard such as parts of Papua New Guinea (Figure 5A), western Colombia and central America (Figure 5B), and high mountain Asia (Figure 5C), the LHASA-NRT show higher probability values (MD ranging from 0.05 to 0.35).
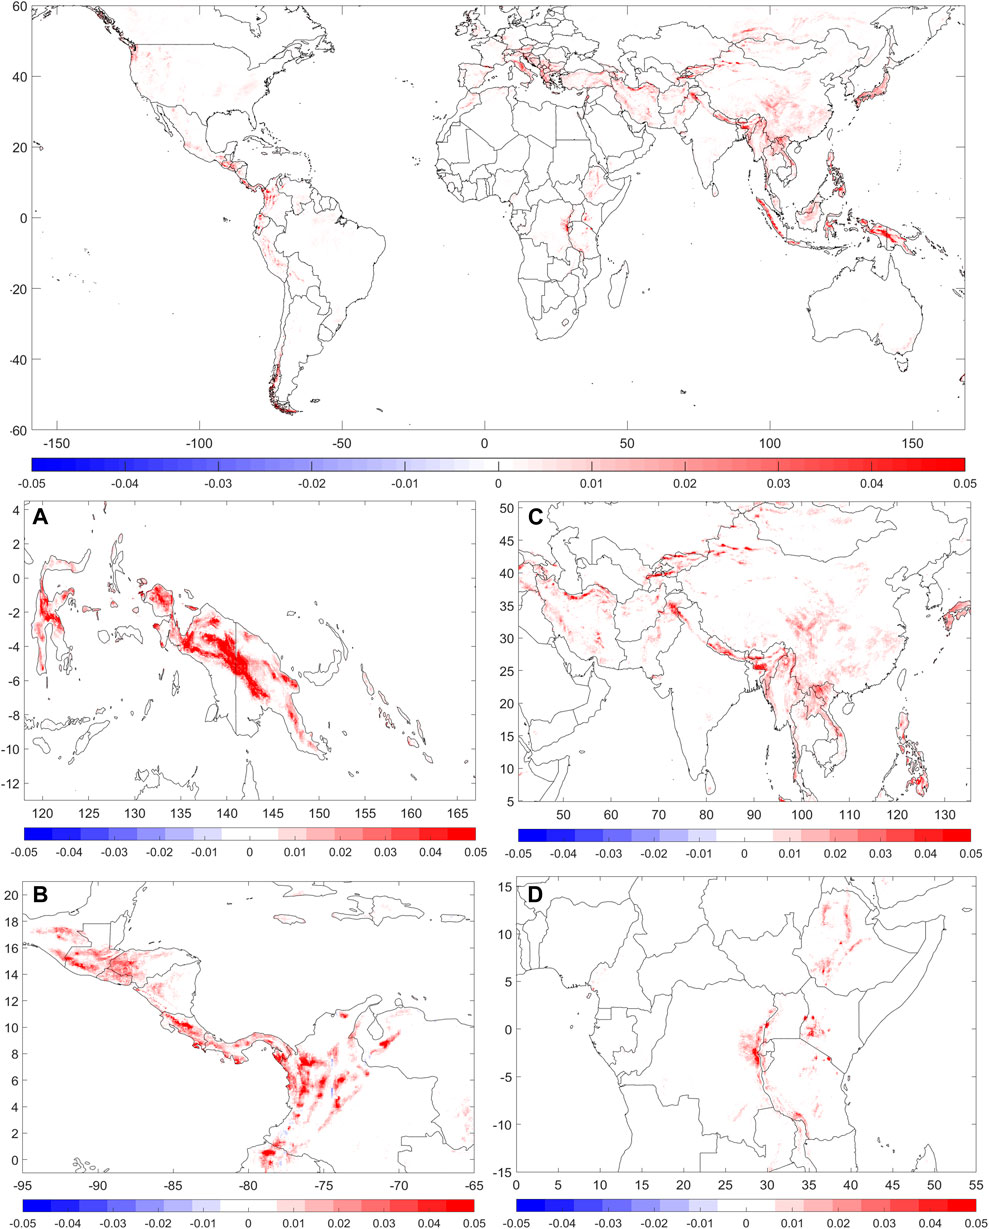
FIGURE 5. Global Mean difference (MD) map between LHASA-NRT and LHASA-F 1-day (probabilities) for the study period. Red indicates that LHASA-NRT has higher values than LHASA-F and blue corresponds to greater LHASA-F probability. The 4 panels show the mean difference (MD) for (A) Papua New Guinea, (B) Central and Northwestern parts of South America, (C) High Mountain Asia region, and (D) parts of central Africa.
To evaluate model performance at a local scale, we compare LHASA-F probabilistic outputs from 1-, 2- and 3-days forecasts to the locations of the landslide inventories highlighted in Table 1, as well as LHASA-NRT. The ultimate objective of the analysis is to assess the potential utility and limitations of the LHASA-F system.
Tropical cyclone Harold hit Vanuatu, Fiji, Tonga, and Solomon Islands as a Category 5 event between 2 and 9 April 2020.27 people lost their lives to Tropical Cyclone Harold, while many more were injured (Mahul and Signer, 2020). More than 159,000 people were affected by the cyclone in Vanuatu. GPM-based estimates showed ∼40–48 mm/h rainfall in Vanuatu. The northern islands, including the main town of Luganville, Espiritu Santo, were among the worst hit areas. Significant damage to infrastructure was also reported. Figure 6 exhibits the areas in Santo affected by the landslides (Figure 6D). The Vanuatu landslide inventory showed cyclone-triggered landslides in the North, Northwest, South, and West Santo districts. All four administrative districts show elevated landslide probabilities (>0.6) for all areas covered by the mapped landslide points in the LHASA-NRT. In LHASAF 1-day, the probability of landslides is in the range of 0.2–0.7 in parts of West Santo, Northwest Santo, and South Santo (Figure 6C). In contrast, LHASA-F 2-days estimated probabilities (∼0.2) were only observed in the West Santo administrative district (Figure 6B). LHASA-F 3-days (Figure 6A) showed no signs of landslide hazard in the Santo area except for 1 pixel showing a probability value of ∼0.15 in Northwest Santo admin district.
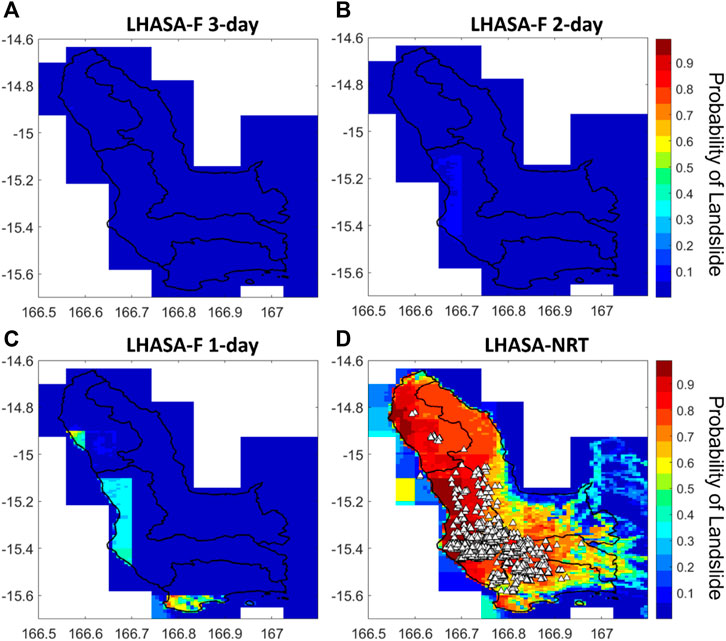
FIGURE 6. LHASA probability estimates for Vanuatu on 5 April 2020. (A) LHASA-F 3-days (B) LHASA-F 2-days, (C) LHASA-F 1-day, and (D) LHASA-NRT. The triangles correspond to mapped landslides and the black line to admininstrative district boundaries.
Tropical Storm Linfa triggered landslides in the central Vietnam along the coast on 12 October 2020. The performance of LHASA-NRT and LHASA-F for Tropical Storm Linfa in Vietnam is shown in Figure 7 (more details on the dynamic inputs be found in section 2.2). Despite the missed estimation of the landslide hazard in the 3-days forecast, the model shows qualitatively good overall performance for this event in terms of the spatial representation of the high landslide hazard for the mapped landslides districts. The spatial pattern of the estimated probabilities in LHASA-NRT and LHASA-F 1-day is similar (Figures 7C,D), however, LHASA-F clearly underestimates hazard (∼0.2 probability difference) relative to LHASA-NRT in Phong Điền and A Lưới (∼0.3 probability difference) district in central Vietnam. This is in line with the global mean difference map (Figure 5C) where the positive difference (red) indicates higher LHASA-NRT probabilities over Vietnam and Lower Mekong Region in general.
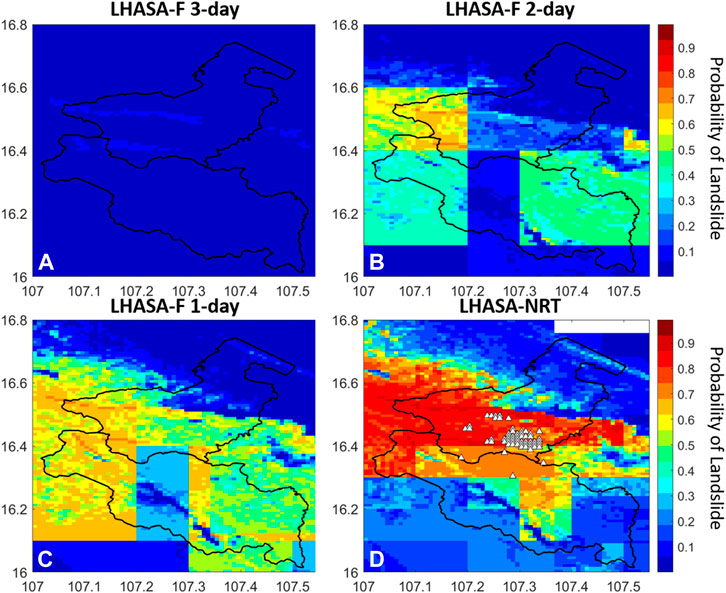
FIGURE 7. LHASA probability estimates for Vietnam on 12 Oct 2020. (A) LHASA-F 3-days (B) LHASA-F 2-days, (C) LHASA-F 1-day, and (D) LHASA-NRT. The triangles correspond to mapped landslides and the black line to administrative district boundaries.
Medicane Ianos, considered to be the most intense medicane (tropical-like cyclone) ever recorded, formed over the warm Mediterranean Sea during 15–21 September 2020. Heavy rainfall was recorded in several Ionian Islands, and in parts of Central Greece (Karagiannidis et al., 2021; Zekkos et al., 2020). IMERG estimated ∼152 mm rainfall accumulation in Central and Western coastal Greece, and ∼305 mm in parts of the Ionian islands, particularly in Kefalonia by 20 September 2020. Figure 8 shows LHASA-F and LHASA-NRT outputs for Thessaly, central Greece, on 18 September 2020. The landslide inventory for Medicane Ianos shows clusters of landslides in southwestern parts of the district (Figure 8D). The model displays high probability values in this area ∼>0.85 (LHASA-NRT) and ∼>0.7 (LHASA-F 1-day) respectively. Analogous to other case studies in Vanuatu and Vietnam, the 3-days forecast is showing probabilities ranging from 0–0.1.2-days lead time LHASA-F, however, exhibits a landslide footprint with probability ∼0.2 for the mapped landslide locations.
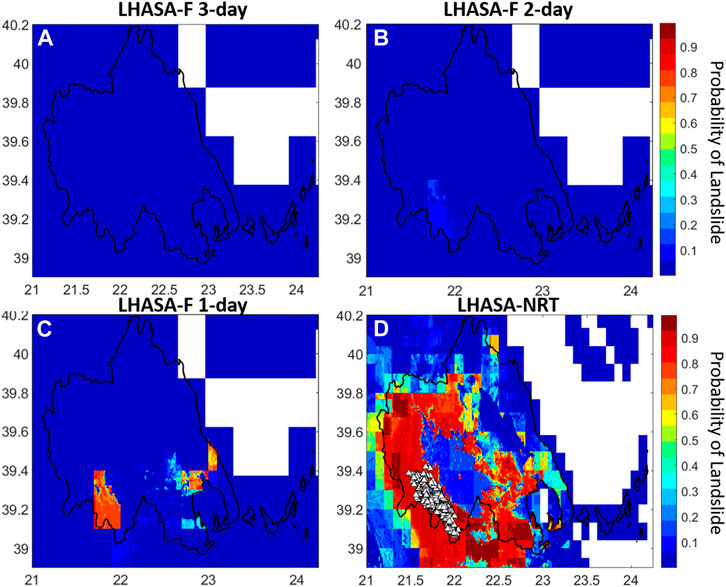
FIGURE 8. LHASA probability estimates for Central Greece on 18 September 2020. (A) LHASA-F 3-days (B) LHASA-F 2-days, (C) LHASA-F 1-day, and (D) LHASA-NRT. The triangles correspond to mapped landslides and the black line to administrative district boundaries.
In November 2020, Hurricanes Eta and Iota combined to cause some of Central America’s worst losses from landslides in the last several decades (Shultz et al., 2021; Walton et al., 2021). Results from the LHASA-NRT (Figure 9D) and Forecast (Figures 9A–C) for parts of Guatemala affected by landslides during Hurricanes Eta and Iota are shown in Figure 9. While comparing the results, both LHASA products underestimate the hazard level of this event on 5 November 2020. This could be attributed to the underestimation of the precipitation in IMERG Early as well as in GEOS-Forecast at the location of the mapped landslides (SM4). The high landslide hazard (probability values ∼> 0.40) indication is towards the eastern part of the region (Figures 9C,D).
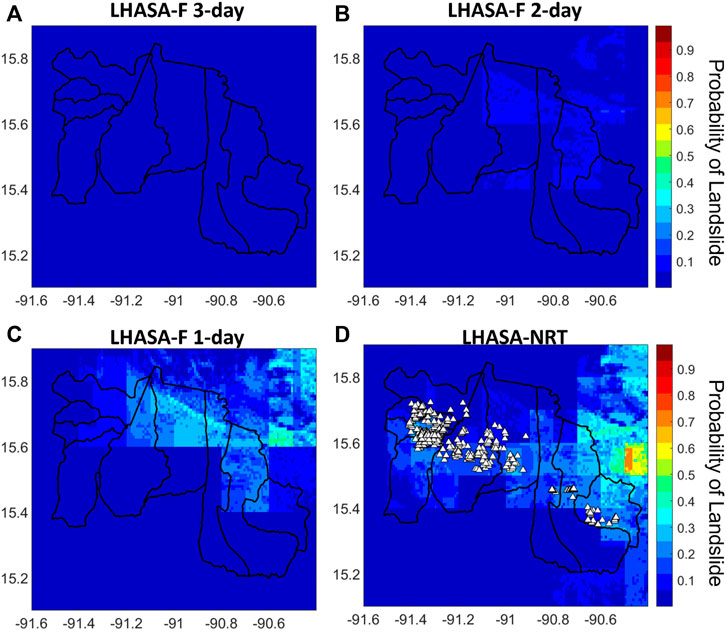
FIGURE 9. LHASA probability estimates for Guatemala on 5 Nov 2020. (A) LHASA-F 3-days (B) LHASA-F 2-days, (C) LHASA-F 1-day, and (D) LHASA-NRT. The triangles correspond to mapped landslides and the black line to administrative district boundaries.
To summarize the performance for the different case studies, the landslide probability values are extracted for each landslide point from LHASA-NRT and LHASA-F model outputs. Scatter plots in Figure 10 show the performance of the model outputs at a point scale. If all the landslide points are taken together, the overall correlation coefficient (CC) of 0.43 is observed between LHASA-NRT and LHASA-F 1-day, CC ∼0.47 for NRT versus LHASA-F 2-days, and CC∼0.3 for LHASA-F 3-days respectively. LHASA-NRT is consistently higher, and the forecast appears to be more accurate (closer to the 1:1 line) at higher probabilities than lower probabilities. The forecast model tends to show comparable performance for landslide points where LHASA-NRT ∼>0.70. However, the performance is attributable to the characteristics of the storm, geographical location, and the precipitation estimates, in general. This is discussed in more depth below.
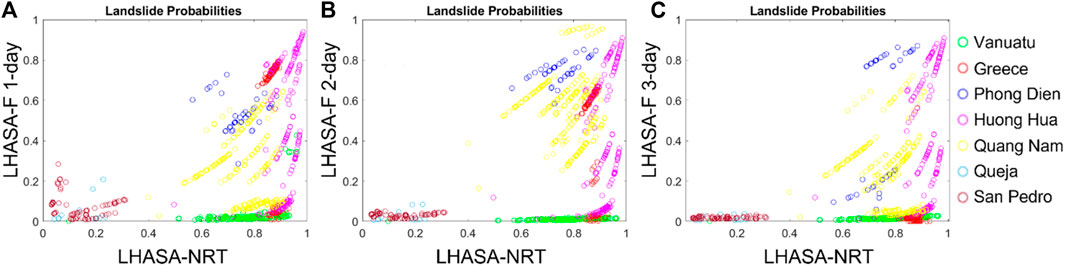
FIGURE 10. Scatter plots for landslide probabilities extracted from LHASA-NRT and LHASA-F for landslide point locations (A) LHASA-F 1-day vs. LHASA-NRT, (B) LHASA-F 2-days vs. LHASA-NRT, (C) LHASA-F 3-days vs. LHASA-NRT, respectively. Sample size=5395.
The form in which forecasts are communicated requires a clear articulation of the intended purpose of the forecast and an accurate spatiotemporal representation of the results. Stakeholders such as Pacific Disaster Center, suggested that summarizing results based on administrative district could help to rapidly articulate areas of potential impact that could initiate further investigation, action, and awareness. The results are aggregated by taking the maximum probability values within the administrative district from the model’s nominal spatial resolution of ∼1-km.
Figure 11 shows the maximum landslide probability values for each administrative district for the extreme rainfall events. LHASA-NRT shows ∼>0.80 maximum probability for all the studied administrative level 2 districts, except for Guatemala where ∼0.40 maximum value is noted. Maximum probability values in case of LHASA-F 1-day ranged between 0.2–1.0. Relative to LHASA-NRT, LHASA-F’s performance varies by region, with the highest forecasts in Vietnam (0.99), followed by Greece (0.8), Vanuatu (0.6), and Guatemala (0.3). Overall, this analysis highlights that the performance of the LHASA-F model depends on both region (Figure 5) and the forecast lead time (Figure 11).
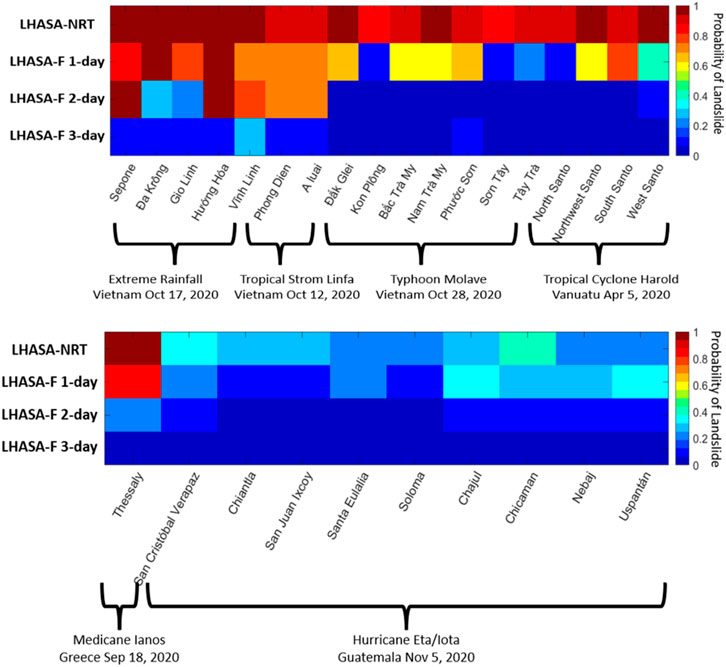
FIGURE 11. LHASA-NRT and LHASA-F performance in terms of maximum landslide probability within landslide affected administrative district level 2 limits.
The effects of aggregating forecasts by the level-2 administrative district are further illustrated in Figure 12. Spatial distribution of the maximum probabilities assigned to the individual district for the 17 October 2020, event in Vietnam is exhibited in Figures 12A–D. In this example, if a categorical hazard threshold is set to 0.80, all the districts with landslides show elevated (high) landslide hazard for all 5 districts in LHASA-F 1-day, and three districts in LHASA-F 2-days. Similarly, with a medium-hazard threshold set at 0.20, LHASA-F 2-days would display medium hazard for the remaining two districts (Figure 12C). These thresholds should be adjusted based on local conditions and the intended purpose of the application.
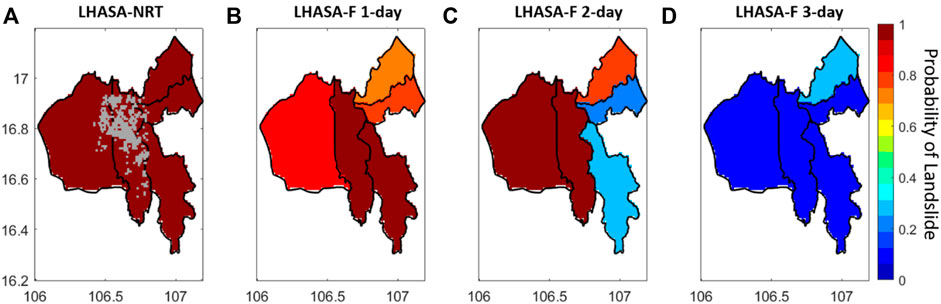
FIGURE 12. Maximum landslide probability maps for landslide affected administrative district level 2 limits in Vietnam on 17 October 2020. Landslide points are displayed with gray points in panel A. (A) LHASA-NRT, (B) LHASA-F 1-day, (C) LHASA-F 2-days, and (D) LHASA-F 3-days.
Landslide forecasting is a challenging task due to several complex phenomena which may contribute toward landslide occurrence. This is further complicated by the inherent uncertainties in the data used for developing landslide models. As in any modeling technique, simplifying assumptions are often employed to reduce the complexity in formulating underlying models. The goal of this study is to evaluate the feasibility of using a global precipitation forecast within the LHASA global landslide modeling framework to better anticipate future landslide hazard. Landslide inventories from representative areas are used as an independent reference to evaluate the performance of both products at a regional scale. Comparing LHASA-F to LHASA-NRT provides a first step in characterizing the regional differences in landslide predictions using the outlined framework.
LHASA-F evaluation framework designed in this study is based on following assumptions: Event-based landslide inventories are complete and do not miss any landslides triggered by the event; LHASA-NRT is a reasonable comparator, in the absence of an alternative global NRT hazard model; p99 calculations are not impacted by different computation time spans used for GEOS-Forecast (2018–2021) and IMERG-Early (2000–2018); substituting rescaled precipitation derived from GEOS-FP in model trained with rescaled precipitation derived from IMERG-Early alleviates the model dependence of raw precipitation. Some of these assumptions are driven by the limited historical global forecast availability. However, as previously stated, all landslide forecasting models have some assumptions (Guzzetti et al., 2020). Despite these limitations, the findings of this study demonstrate promising performance at the global scale in the analysis window and represents a step towards improved predictive capability for global landslides.
Khan et al., 2021 reported that the GEOS-FP model-based precipitation forecast demonstrates coherence with the near-real time satellite estimated (IMERG Early) for tropical storms and extreme precipitation (∼> 100 mm) in general, for regions with landslide susceptibility. As rainfall-triggered landslides are mostly caused by extreme rainfall conditions, the GEOS-FP product was deemed fit to be ingested in the new global LHASA framework for forecasting landslides. LHASA-NRT and LHASA-F exhibit high coherence for landslide points, with both associating higher probabilities (∼>0.70) with major events (Tropical storms), as demonstrated by the scatter plots in Figures 10A–C.
Although LHASA-F generates slightly lower landside probabilities (Figure 5) than LHASA-NRT, these are relative probabilities and the differences may not be significant from operational perspective, especially for extreme events. Results from the case studies presented in this work indicate that the performance of the forecast model varies with specific storm and its geographical location. The accuracy of LHASA-F improves as the forecast time is closer to the prediction time. The reduced performance of the forecast model for 3-days lead time observed in case studies is attributable to uncertainties associated with forecasted precipitation (Sikder and Hossain, 2019). Factors such as initial meteorological conditions, data assimilation methods, and the approximations required to represent physical processes, all contribute towards the forecast skill with lead time. Another reason for degraded performance of LHASA-F with longer lead time could be linked to antecedent conditions used in the model training framework (trained on LHASA-NRT dynamic variables). While the antecedent conditions for Forecast 1-day are derived from IMERG-NRT, those for Forecast 3-days are based on the forecast from the last 2 days (refer to Table 3 for details). However, the global scale mean difference maps between LHASA-NRT and LHASA-F 2-days and 3-days products reveal overall similar trends as shown in Figure 5 for LHASA-F 1-day, with LHASA-F 2- and 3-days showing lower probability values across the globe, and higher values (∼0.03–0.05) in some parts of western South America (SM6 and SM7). The spatial tendency of the LHASA-F system to provide high probability estimates is assessed using a threshold of 0.9. SM3 shows the global map with a count for, each 1 × 1 km grid box, of the number of days when LHASA-F estimated a landslide probability of >0.9, when LHASA-NRT does not. The count ranges from 1 to 5 days out of 365 days of testing period. LHASA-F estimates are lower than high threshold (0.9) most of the days across the globe (shown with white color inland) except for few grid boxes in Jamaica and El Salvador, parts of New Guinea, and north central coast Vietnam.
There are limited global landslide inventories for the relatively short historical GEOS-Forecast record, which did not allow development of a model solely based on the GEOS-Forecast. This problem is addressed by employing rescaled precipitation in both the LHASA-NRT and LHASA-F frameworks. Three dynamic variables, rescaled precipitation, soil moisture, and snow mass from GEOS-FP are used for the validation studies in the model trained with rescaled precipitation from IMERG-NRT, to generate LHASA-F up to 3-days lead time at the global scale. Depending on the availability of a long and consistent precipitation forecast data, and global landslide inventories, future work could address these limitations by training models for each forecast lead-time and combination of inputs.
We find the following overarching results when comparing LHASA-F to LHASA-NRT and available event-based inventories:
• The rescaling of the GEOS-FP precipitation product is a critical step in incorporating the forecasted precipitation data within LHASA-F, though when compared directly, probability values for LHASA-F are low relative to the LHASA-NRT.
• Combining different streams of forecasted data within the LHASA-F framework shows promise, particularly for larger events at the 1- and 2-days lead time for events.
• Maximum probability values at administrative district level 2 are informative for assigning categorical alert levels for landslides. This could help stakeholders rapidly identify areas of potential impact for further investigation, action, and awareness.
Periodic assessment of the landslide forecast system and user feedback is vital for its operational success and utility. This will require assessment of the system by stakeholders using more diverse regional landslide inventories. We envision the availability of such inventories through global initiatives such as LandAware (Calvello et al., 2020) will be crucial for the generalization as well as the advancement of the global landslide forecasting efforts.
Furthermore, updates to IMERG and GEOS may improve the predictive capability of LHASA model and could be a path for future study. LHASA framework is designed with flexibility for adapting to the future updates to the products.
LHASA-F could be used to issue landslide advisories in conjunction with other situational awareness tools. Our analysis at administrative district level 2 shows that landslide forecast outputs may be mapped differently depending on the application. Results of this system are promising, and we continue to engage with stakeholders to support the continual development, localized adaptation, and implementation of the landslide forecast framework. We plan to deploy this model routinely and to make it publicly available under the LHASA framework.
LHASA-F’s global coverage will be valuable in providing crucial information in data-sparse, ungauged, or large-scale catchments to provide broader situational awareness of potential landslide hazard. It is not intended to provide local scale warnings or to supersede local and regional systems that have been calibrated for the specific environment. The LHASA-based hazard estimates provide the likely location of landslide events and inform decision-making about disaster preparedness and response. Additional modules, incorporated into LHASA, such as estimates of population and infrastructure exposure to landslide hazard (Emberson et al., 2020), could be integrated into the landslide forecast to provide further information on potential landslide impacts as well as hazard estimates. The availability of such multi-temporal landslide hazard and exposure tools will equip stakeholders with complementary resources to aid in disaster response, planning and decision-making.
The raw data supporting the conclusions of this article will be made available by the authors, without undue reservation.
Conceptualization SK, DK, and TS; funding and project supervision, DK; methodology, SK (LHASA-F), TS (LHASA-NRT), PA (Landslide inventories); software, algorithm development, data processing, data analysis, and visualization, SK; writing—original draft preparation, SK; writing—review and editing, SK, DK, TS, and PA and RE.
This research was supported by NASA’s Disasters program through the solicitation for Earth Science Applications: Disaster Risk Reduction and Response (NNH18ZDA001N).
The authors declare that the research was conducted in the absence of any commercial or financial relationships that could be construed as a potential conflict of interest.
All claims expressed in this article are solely those of the authors and do not necessarily represent those of their affiliated organizations, or those of the publisher, the editors and the reviewers. Any product that may be evaluated in this article, or claim that may be made by its manufacturer, is not guaranteed or endorsed by the publisher.
The GEOS data used in this study have been provided by Global Modeling and Assimilation Office (GMAO) at NASA Goddard Space Flight Center (GSFC). The authors would like to thank the NASA GMAO for providing the GEOS-FP data and Precipitation Processing System (PPS) for providing the IMERG data. Computing resources supporting this work were provided by the NASA High-End Computing (HEC) Program through the NASA Center for Climate Simulation (NCCS) at NASA’s GSFC. We thank our collaborators from NASA-GMAO, Ronald Gelaro, Gary Partyka, for their inputs to the analysis, and Robert Lucchesi for helping with the relevant GEOS-FP data acquisition.
The Supplementary Material for this article can be found online at: https://www.frontiersin.org/articles/10.3389/feart.2022.878996/full#supplementary-material
Ahmed, B., Rahman, M., Islam, R., Sammonds, P., Zhou, C., Uddin, K., et al. (2018). Developing a Dynamic Web-GIS Based Landslide Early Warning System for the Chittagong Metropolitan Area, Bangladesh. Ijgi 7, 485. doi:10.3390/ijgi7120485
Amatya, P., Kirschbaum, D., and Stanley, T. (2022). Rainfall-induced Landslide Inventories for Lower Mekong Based on Planet Imagery and a Semi-automatic Mapping Method. Geosci. Data J. doi:10.1002/gdj3.145
Amatya, P., Kirschbaum, D., Stanley, T., and Tanyas, H. (2021). Landslide Mapping Using Object-Based Image Analysis and Open Source Tools. Eng. Geol. 282, 106000. doi:10.1016/j.enggeo.2021.106000
Börker, J., Hartmann, J., Amann, T., and Romero-Mujalli, G. (2018). Global Unconsolidated Sediments Map Database V1. 0 (Shapefile and Gridded to 0.5◦ Spatial Resolution). doi:10.1594/PANGAEA.884822
Brigandì, G., Aronica, G. T., Bonaccorso, B., Gueli, R., and Basile, G. (2017). Flood and Landslide Warning Based on Rainfall Thresholds and Soil Moisture Indexes: the HEWS (Hydrohazards Early Warning System) for Sicily. Adv. Geosci. 44, 79. doi:10.5194/adgeo-44-79-2017
Calvello, M., Devoli, G., Freeborough, K., Gariano, S. L., Guzzetti, F., Kirschbaum, D., et al. (2020). LandAware: A New International Network on Landslide Early Warning Systems. Berlin: Springer.
Calvello, M., D’Orsi, R. N., Piciullo, L., Paes, N. M., Magalhaes, M. A., Coelho, R., et al. (2015). “The community-based alert and alarm system for rainfall induced landslides in Rio de Janeiro, Brazil,” in Engineering Geology for Society and Territory-Volume 2 (Berlin: Springer), 653–657. doi:10.1007/978-3-319-09057-3_109
Chen, T., and Guestrin, C. (2016). “Xgboost: A Scalable Tree Boosting System,” in Proceedings of the 22nd Acm Sigkdd International Conference on Knowledge Discovery and Data Mining, 785–794. doi:10.48550/arXiv.1603.02754
de Ferranti, J. (2015). Digital Elevation Data-With SRTM Voids Filled Using Accurate Topographic Mapping. Digit. Elev. Data. s20e159.
Emberson, R., Kirschbaum, D., and Stanley, T. (2020). New Global Characterisation of Landslide Exposure. Nat. Hazards Earth Syst. Sci. 20, 3413–3424. doi:10.5194/nhess-20-3413-2020
Froude, M. J., and Petley, D. N. (2018). Global Fatal Landslide Occurrence from 2004 to 2016. Nat. Hazards Earth Syst. Sci. 18, 2161–2181. doi:10.5194/nhess-18-2161-2018
Graziella, D., Ingeborg, K., Monica, S., Nils-Kristian, O., Ragnar, E., Erik, J., et al. (2015). “Landslide Early Warning System and Web Tools for Real-Time Scenarios and for Distribution of Warning Messages in Norway,” in Engineering Geology for Society and Territory-Volume 2 (Berlin: Springer), 625–629. doi:10.1007/978-3-319-09057-3_104
Guzzetti, F., Gariano, S. L., Peruccacci, S., Brunetti, M. T., Marchesini, I., Rossi, M., et al. (2020). Geographical Landslide Early Warning Systems. Earth-Science Rev. 200, 102973. doi:10.1016/j.earscirev.2019.102973
Hartmann, J., and Moosdorf, N. (2012). The New Global Lithological Map Database GLiM: A Representation of Rock Properties at the Earth Surface. Geochem. Geophys. Geosystems 13, 4370. doi:10.1029/2012gc004370
Huffman, G. J., Bolvin, D. T., Braithwaite, D., Hsu, K.-L., Joyce, R. J., Kidd, C., et al. (2020). “Integrated Multi-Satellite Retrievals for the Global Precipitation Measurement (GPM) Mission (IMERG),” in Satellite Precipitation Measurement (Berlin: Springer), 343–353. doi:10.1007/978-3-030-24568-9_19
K, L., Karagiannidis, A., Dafis, S., Kalimeris, A., and Kotroni, V. (2021). Ianos - A Hurricane in the Mediterranean. Bull. Am. Meteorol. Soc., 1–31. doi:10.1175/bams-d-20-0274.1
Khan, S., Kirschbaum, D. B., and Stanley, T. (2021). Investigating the Potential of a Global Precipitation Forecast to Inform Landslide Prediction. Weather Clim. Extrem. 33, 100364. doi:10.1016/j.wace.2021.100364
Kirschbaum, D., Stanley, T. A., and Cappelaere, P. (2018). Landslide Hazard Assessment System and Method. United States: Nasa.
Kirschbaum, D., Stanley, T., Emberson, R., Amatya, P., Khan, S., and Tanyas, H. (2020). “Global Landslide Hazard Assessment for Situational Awareness (LHASA) Version 2: New Activities and Future Plans,” in EGU General Assembly Conference Abstracts, 11012. doi:10.5194/egusphere-egu2020-11012
Mahul, O., and Signer, B. (2020). The Perfect Storm: How to Prepare against Climate Risk and Disaster Shocks in the Time of COVID-19. One Earth 2, 500–502. doi:10.1016/j.oneear.2020.05.023
Molod, A., Takacs, L., Suarez, M., Bacmeister, J., Song, I.-S., and Eichmann, A. (2012). The GEOS-5 Atmospheric General Circulation Model: Mean Climate and Development from MERRA to Fortuna. Greenbelt, MA. NASA/TM-2012-104606-VOL-28.
Nadim, F., Kjekstad, O., Peduzzi, P., Herold, C., and Jaedicke, C. (2006). Global Landslide and Avalanche Hotspots. Landslides 3, 159–173. doi:10.1007/s10346-006-0036-1
Peel, M. C., Finlayson, B. L., and McMahon, T. A. (2007). Updated World Map of the Köppen-Geiger Climate Classification. Hydrol. Earth Syst. Sci. 11, 1633–1644. doi:10.5194/hess-11-1633-2007
Planet Team (2018). “Planet Application Program Interface,” in Space for Life on Earth (San Francisco, CA. Available at: WWW Document] URL https://api.planet.com
Ramage, (2022). Forecasting in Meteorology - Google Scholar. Available at:WWW Document] URL https://scholar.google.com/scholar_lookup?title=Forecasting%20in%20meteorology&publication_year=1993&author=C.S.%20Ramage (accessed 1.26.22).
Reichle, R. H., Liu, Q., Koster, R. D., Ardizzone, J. V., Colliander, A., Crow, W. T., et al. (2018). Soil Moisture Active Passive (SMAP) Project Assessment Report for Version 4 of the L4_SM Data Product. NASA Tech. Rep. Ser. Glob. Model. Data Assim. NASATM-2018-104606 52.
Rienecker, M. M., Suarez, M. J., Todling, R., Bacmeister, J., Takacs, L., Liu, H. C., et al. (2008). The GEOS-5 Data Assimilation System: Documentation of Versions 5.0. 1, 5.1. 0, and 5.2. 0. NASA/TM-2008-104606-VOL-27.
Rosi, A., Segoni, S., Canavesi, V., Monni, A., Gallucci, A., and Casagli, N. (2021). Definition of 3D Rainfall Thresholds to Increase Operative Landslide Early Warning System Performances. Landslides 18, 1045–1057. doi:10.1007/s10346-020-01523-2
Shultz, J. M., Berg, R. C., Kossin, J. P., Burkle Jr, F., Maggioni, A., Pinilla Escobar, V. A., et al. (2021). Convergence of Climate-Driven Hurricanes and COVID-19: The Impact of 2020 Hurricanes Eta and Iota on Nicaragua. J. Clim. Change Health 3, 100019. doi:10.1016/j.joclim.2021.100019
Sikder, M. S., and Hossain, F. (2019). Improving Operational Flood Forecasting in Monsoon Climates with Bias-Corrected Quantitative Forecasting of Precipitation. Int. J. River Basin Manag. 17, 411–421. doi:10.1080/15715124.2018.1476368
Singh, V. P. (1995). Computer Models of Watershed Hydrology. Littleton, CO: Water Resources Publications. Available at: https://www.wrpllc.com/.
Stanley, T. A., Kirschbaum, D. B., Benz, G., Emberson, R. A., Amatya, P. M., Medwedeff, W., et al. (2021). Data-driven Landslide Nowcasting at the Global Scale. Front. Earth Sci. 9, 378. doi:10.3389/feart.2021.640043
Stanley, T., and Kirschbaum, D. B. (2017). A Heuristic Approach to Global Landslide Susceptibility Mapping. Nat. Hazards 87, 145–164. doi:10.1007/s11069-017-2757-y
Styron, R., and Pagani, M. (2020). The GEM Global Active Faults Database. Earthq. Spectra 36, 160–180. doi:10.1177/8755293020944182
Sugawara, M., Watanabe, I., Ozaki, E., and Katsuyame, Y. (1983). Reference Manual for the TANK Model. Natl. Res. Cent. Disaster Prev. Jpn.
Tanyaş, H., Van Westen, C. J., Allstadt, K. E., Anna Nowicki Jessee, M., Görüm, T., Jibson, R. W., et al. (2017). Presentation and Analysis of a Worldwide Database of Earthquake-Induced Landslide Inventories. J. Geophys. Res. Earth Surf. 122, 1991. doi:10.1002/2017JF004236
Tiranti, D., Cremonini, R., Marco, F., Gaeta, A. R., and Barbero, S. (2014). The DEFENSE (Debris Flows triggEred by Storms - Nowcasting System): An Early Warning System for Torrential Processes by Radar Storm Tracking Using a Geographic Information System (GIS). Comput. Geosciences 70, 96–109. doi:10.1016/j.cageo.2014.05.004
Tiranti, D., and Rabuffetti, D. (2010). Estimation of Rainfall Thresholds Triggering Shallow Landslides for an Operational Warning System Implementation. Landslides 7, 471–481. doi:10.1007/s10346-010-0198-8
Tiranti, D., Rabuffetti, D., Salandin, A., and Tararbra, M. (2013). Development of a New Translational and Rotational Slides Prediction Model in Langhe Hills (North-western Italy) and its Application to the 2011 March Landslide Event. Landslides 10, 121–138. doi:10.1007/s10346-012-0319-7
Van Tien, P., Luong, L. H., Duc, D. M., Trinh, P. T., Quynh, D. T., Lan, N. C., et al. (2021). Rainfall-induced Catastrophic Landslide in Quang Tri Province: the Deadliest Single Landslide Event in Vietnam in 2020. Landslides 18, 2323–2327. doi:10.1007/s10346-021-01664-y
Walton, D., Arrighi, J., van Aalst, M., and Claudet, M. (2021). The Compound Impact of Extreme Weather Events and COVID-19. Geneva: IFRC.
Zekkos, D., Zalachoris, G., Alvertos, A., Amatya, P., Blunts, P., Clark, M., et al. (2021). The September 18-20 2020 Medicane Ianos Impact on Greece-Phase I Reconnaissance Report. GEER-068. Available at: https://ntrs.nasa.gov/citations/20205011398. doi:10.18118/G6MT1T
Keywords: landslide forecasting system, global model, precipitation forecast, lhasa, IMERG, GEOS-FP, probabilistic estimates, hazard assessment
Citation: Khan S, Kirschbaum DB, Stanley TA, Amatya PM and Emberson RA (2022) Global Landslide Forecasting System for Hazard Assessment and Situational Awareness. Front. Earth Sci. 10:878996. doi: 10.3389/feart.2022.878996
Received: 18 February 2022; Accepted: 02 June 2022;
Published: 04 July 2022.
Edited by:
Ben van der Pluijm, University of Michigan, United StatesReviewed by:
Susana Pereira, University of Lisbon, PortugalCopyright © 2022 Khan, Kirschbaum, Stanley, Amatya and Emberson. This is an open-access article distributed under the terms of the Creative Commons Attribution License (CC BY). The use, distribution or reproduction in other forums is permitted, provided the original author(s) and the copyright owner(s) are credited and that the original publication in this journal is cited, in accordance with accepted academic practice. No use, distribution or reproduction is permitted which does not comply with these terms.
*Correspondence: Sana Khan, c2FuYS5raGFuLmNlZUBnbWFpbC5jb20=
Disclaimer: All claims expressed in this article are solely those of the authors and do not necessarily represent those of their affiliated organizations, or those of the publisher, the editors and the reviewers. Any product that may be evaluated in this article or claim that may be made by its manufacturer is not guaranteed or endorsed by the publisher.
Research integrity at Frontiers
Learn more about the work of our research integrity team to safeguard the quality of each article we publish.