 Tao Li
- 1State Key Laboratory of Geomechanics and Geotechnical Engineering, Institute of Rock and Soil Mechanics, Chinese Academy of Sciences, Wuhan, China
- 2University of Chinese Academy of Sciences, Beijing, China
- 3Beiminghe Iron Mine of Minmetals Hanxing Mining Co., Ltd., Handan, China
In microseismic (MS) source localization, it is usually assumed that the sensor coordinates are accurate. However, there are generally measurement errors for the sensor coordinates in practical engineering, which severely affect the location accuracy of the MS sources. Therefore, based on the least square linear inversion equation, the theoretical analysis shows that the location error is proportional to the sensor coordinate error. To reduce the systematic error of the MS source location, a calculation method for the sensor coordinate error threshold is proposed. First, the theoretical arrival time of each sensor is calculated. Then, the sensor coordinate error is added and combined with the original sensor coordinate for location. Finally, the sensor coordinate error threshold that makes the location results reach the source location accuracy is obtained. Furthermore, based on this method and assuming that the sensor coordinate error is in a normal distribution, a comprehensive evaluation index of the sensor coordinates is proposed to evaluate the influence of the sensor coordinates on the MS source location. The application results of the Beiminghe Iron Mine in Hebei Province show that the farther the source is from the sensor array, the smaller the sensor coordinate error threshold is. The sensor coordinate error threshold in the sensor array is larger than that outside the sensor array. The sensor coordinate error threshold decreases rapidly in the sensor array and slowly outside the sensor array. After removing sensor No. 201, which has the greatest influence on MS source location and has a large measurement error, the average location accuracy of blasting test events is improved by 25.74%. The research results have a certain guiding significance for the sensor coordinate measurement.
Introduction
With the China’s 13th Five-year Plan on Technology and Innovation strengthening the development and utilization of deep resources, there are an increasing number of deep-buried mines and tunnels, and rockburst disasters are becoming increasingly severe. To effectively avoid and prevent loss caused by deep engineering geological disasters, the microseismic (MS) monitoring technique plays a key role as a new rock mass microfracture monitoring technique. Multiple mature MS monitoring systems have emerged, such as the Institute of Mine Seismology (IMS) in Australia, Engineering Seismology Group (ESG) in Canada, and SinoSeism (SSS) MS monitoring system jointly developed by the Institute of Rock and Soil Mechanics, Chinese Academy of Sciences, and Hubei Seaquake Technology Co., Ltd. (Chen et al., 2021). The MS monitoring techniques can obtain the MS information in the process of rock mass disaster preparation in real time and evaluate the region, probability, and scale of rock mass instability, providing the basis for early warning and prevention of rock mass risk. Currently, this approach has been widely used in many fields, such as mines, slopes, and tunnels (Leśniak and Isakow, 2009; Xu et al., 2010; Feng et al., 2015; Dai et al., 2016; Feng et al., 2022; Yu et al., 2022; Zhang et al., 2022). In the MS research, the MS source location directly affects the calculation of radiant energy, the analysis of the MS activity, and the early warning of the rockburst. Therefore, the accuracy of the MS source location is directly related to the analysis and prediction of rock engineering disasters.
Scholars worldwide have carried out much research work on the MS source location and have achieved very fruitful results. According to the principle of the MS source location, the key factors affecting the MS source location mainly include the location method, sensor array, first-arrival waveform pickup, and velocity model. In terms of the location method, location methods based on different arrival times are widely used, mainly including noniterative methods (Liu and Gao, 2012), iterative methods (Geiger, 1912; Li et al., 2014b), and swarm intelligence methods (Kennett and Sambridge, 1992; Chen et al., 2009). In terms of the sensor array, the field mainly has D-optimal design theory and C-optimal design theory (Kijko, 1977a; Kijko, 1977b), and layout optimization and evaluation methods of the MS sensor array based on D-optimal design theory (Gong et al., 2010) and the influence mechanism of the two-dimensional plane sensor array (Li et al., 2014a; Li, 2014) have been further proposed. In terms of first-arrival waveform pickup, there are many mature methods for P-wave and S-wave arrival time pickups, such as the correlation method (Bai and Kennett, 2000), energy ratio method (Saragiotis et al., 2002), and maximum amplitude method (Paige and Saunders, 1982; Cao and Greenhalgh, 1993; Boschetti et al., 1996). In terms of the velocity model, most scholars use the uniform velocity model, which simplifies the velocity of the regional rock mass and ignores the difference in rock mass characteristics. In addition, the uniform velocity model simplifies the calculation process and has strong stability. To adapt to the stratigraphic conditions, the layered velocity model (Crosson and Peters, 1974) and the anisotropic velocity model (Mooney et al., 1998) have been proposed and applied, greatly reducing the MS source location error.
In addition to the above factors affecting the MS source location, the sensor coordinates have measurement errors, which also will affect the MS source location. At present, research on the influence of sensor coordinate errors on localization mainly focuses on satellite navigation (Zhang et al., 2018), missile location (Yang and Ho, 2009; Wei et al., 2010; Sun and Ho, 2011), radar detection (Wang and Ho 2013), and communication systems (Rockah and Schultheiss, 1987; Kovavisaruch and Ho, 2005). Due to the concealment and mobility of the observation stations, research efforts are mainly aimed at the development of high-performance location methods with observation station coordinate errors. However, in the MS monitoring field, the influence of sensor coordinate errors on MS source location is rarely studied. In mine and tunnel engineering, the sensor is often installed in the borehole of the sidewall or the vault, which increases the difficulty of the sensor coordinates measurement. At the same time, the size effect of the sensor, the accuracy of the measurement equipment, and the improper operation of the measurement personnel also lead to large measurement errors in the sensor coordinates. When there is a measurement error in the sensor coordinates, the location accuracy of the MS source is significantly reduced. The sensors installed in different spatial positions have different effects on the MS source location. Therefore, to reduce the systematic error of the MS source location, it is indeed necessary to propose a corresponding sensor coordinate error threshold and quantitatively evaluate the influence of different sensors on the MS source location.
Therefore, the influence of the sensor coordinate error on the MS source location error is theoretically analyzed by the least square linear inversion equation, and the calculation method of the sensor coordinate error threshold is proposed. The influence of different sensors on the MS source location is comprehensively evaluated, which is applied in engineering. The research results have a certain guiding significance for installation and sensor coordinate measurement in actual engineering.
Least Square Linear Inversion Equation and Location Error Analysis
Least Square Linear Inversion Equation
In the MS source localization, the objective function (Liu 2007) is
where
The nonlinear function
where
We substitute Equation 3 into Equation 1:
From the extreme value theory of multivariate function, we let
We let
where the coefficient matrix
The expression of coefficient matrix A is
We let
Location Error Analysis
After the MS monitoring system is arranged, the sensor coordinates need to be measured. During the measurement, the sensor coordinates inevitably have errors, as shown in Figure 1 where Ti represents the ith sensor. The arrival time information is received by the sensor in the actual position. Therefore, when the sensor coordinates and the arrival time information do not match, systematic errors will arise.
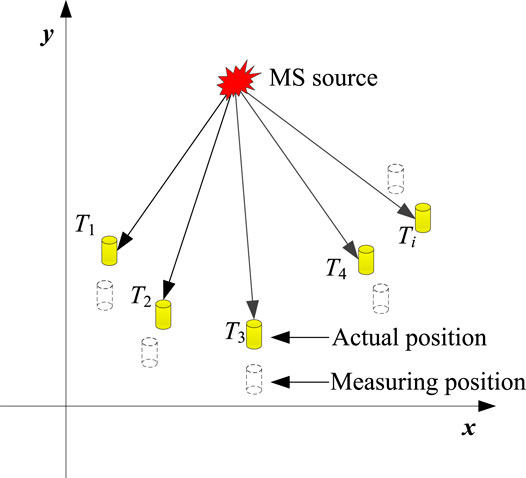
FIGURE 1. Schematic diagram of the source location with sensor coordinate error.
The coordinate error of the sensor is mainly reflected in the coefficient matrix A. The error of the coefficient matrix A is
We subtract Equation 6 from Equation 8:
The norm of Equation 10 is obtained as follows:
Equation 11 shows that as the sensor coordinate error increases, the coefficient matrix error
Influence Evaluation of the Sensor Coordinate Error on the Microseismic Source Location
Sensor Array Center
For the sensor array arranged at the vertex of the regular geometry, the center of the array is the center of the regular geometry. For example, the center of the cube array is the center point of the cube, and the center of the spherical array is the center point of the sphere. However, the sensor arrangement in actual engineering is usually presented as an array in the form of irregular geometry, whose array center is often difficult to determine, so it is urgent to study the center position of the irregular sensor array.
Kijko (1977a), Kijko (1977b) proposed an objective function for evaluating the optimal layout of the sensor array based on the D-optimal design theory. After that, Gong et al. (2010) established the expression of the covariance matrix based on the D-optimal design theory after considering the influence of the P-wave velocity error and the P-wave arrival time error:
The diagonal elements in the diagonal matrix W can be expressed as:
where
The geometric significance of the covariance matrix
Sensor Coordinate Error Threshold
The larger the sensor coordinate error is, the larger the location error of the MS source. To reduce the systematic error of the MS source location and guide the measurement of sensor coordinates, it is necessary to propose the corresponding sensor coordinate error threshold under the MS source location accuracy required by the project. Therefore, a calculation method of the sensor coordinate error threshold is proposed for an MS source. The flow chart is shown in Figure 2, and the specific steps are as follows:
1) The coordinates of the sensor are given, and the sensor coordinate error c = Δ, and the step length is Δ. The MS source location error is E, and the number of sensors is n.
2) For an MS source in the monitoring area, the theoretical times of the sensor are calculated based on the sensor coordinates.
3) It is assumed that there are errors in the x, y, and z directions of the sensor coordinates, and the error value can be taken as c or -c. Therefore, the number of coordinate error combinations in the x, y, and z directions is 2n, so the number of coordinate error combinations of the whole sensor array is 2n × 2n × 2n.
4) The coordinates of each sensor are added to the corresponding coordinate error, and localization is carried out in combination with the theoretical arrival time of the sensor. The 2n × 2n × 2n location results are obtained, and the maximum value of the location error is obtained by comparison, which is set as Q.
5) When Q ≤ E, we let c = c+Δ and proceed to step 3). When Q > E, the calculation is stopped, and c-Δ is the sensor coordinate error threshold of the MS source.

FIGURE 2. Calculation method of the sensor coordinate error threshold.
Since the coordinate errors of each sensor are different, it is difficult to make the coordinate errors of all sensors equal to the sensor coordinate error threshold, so the calculated sensor coordinate error threshold is an upper limit value. The sensor coordinate error threshold solved is not less than the coordinate errors of all the sensor. Therefore, the sensor coordinate error threshold is a value with high safety factor.
In the above method, there are 2n × 2n × 2n sensor coordinate error combinations for each increased step length Δ and corresponding 2n × 2n × 2n location times. When the number of the sensors n is small, the calculation amount is small. However, as the number of sensors n increases, the calculation amount increases exponentially. Therefore, it is necessary to simplify steps 3) and 4) in the above method. The coordinate errors of the whole sensor array in the x, y, and z directions are calculated separately, and the coordinate errors of n sensors in the x, y, and z directions are all 2n. Taking the sensor coordinate error in the x direction and no coordinate error in the y and z directions as an example, the sensor coordinate error combinations in the x direction are obtained when the location error is the largest, which is denoted as xa. Similarly, the corresponding sensor coordinate error combinations in the y and z directions are yb and zc, respectively. The influence of the sensor coordinate errors in each direction on the MS source location can be superimposed. Therefore, for the whole sensor array, when the coordinate error combinations in the x, y, and z directions are xa, yb, and zc, respectively, the calculated location error is the maximum value in the 2n × 2n × 2n location results. Therefore, the number of localizations is simplified from 2n × 2n × 2n to 3 × 2n+1, and the amount of calculation is greatly reduced.
Comprehensive Evaluation Index
In the same monitoring area, each sensor has a different influence on the MS source location. Therefore, it is necessary to evaluate the influence degree of different sensors on the MS source location. For an MS source in the monitoring area, when calculating coordinate error threshold of the sensor based on calculation method of the sensor coordinate error threshold, it is assumed that one sensor in the array has a coordinate error in a normal distribution and the other sensors have no coordinate error. Accordingly, steps 3) and 4) in Sensor Coordinate Error Threshold subsection are modified as follow:
3) The sensor coordinate errors in the x, y, and z directions follow the same normal distribution, respectively, i.e., x ∼ N (
4) The coordinates of each sensor are added to the corresponding coordinate error, and localization is carried out in combination with the theoretical arrival time of the sensor. The location error of Nm samples are obtained, and its average value is set as Q.
Similarly, the coordinate error thresholds of other sensors can also be obtained. Then, the normalization transformation is performed on the coordinate error thresholds of all sensors, and the formula is as follows:
where
It is necessary to comprehensively evaluate the influence of the sensor coordinate error on the MS source location for the whole monitoring area Ω. Therefore, the monitoring area is meshed, where each grid point is taken as an MS source, and the number of MS sources is M. The evaluation indexes of all MS sources are comprehensively analyzed, and the comprehensive evaluation indexes of the ith sensor in the monitoring area Ω are as follows:
where
The larger the comprehensive evaluation index
Field Applications
The workers of the Beiminghe Iron Mine in Hebei Province have found abnormal phenomena in the mining area many times since 2017, mainly located in the substation on the -122 m level and the excavation roadway at the -185 m level. It is preliminarily inferred that these phenomena are related to illegal mining. Therefore, to protect mineral resources and production safety, the mine has introduced a new generation of SinoSeism (SSS) MS monitoring systems jointly developed by the Institute of Rock and Soil Mechanics, Chinese Academy of Sciences, and Hubei Seaquake Technology Co., Ltd. Due to the limitation of site conditions, a total of 10 mono-component sensors and 2 three-component sensors are arranged at the roadways of the -230 m level. The sensor coordinates initially measured are shown in Table 1, and the plane diagram of the sensor layout is shown in Figure 3.
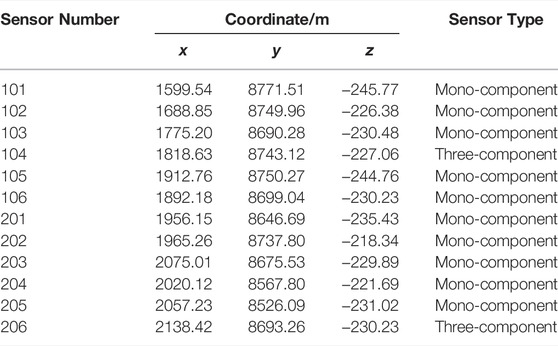
TABLE 1. Sensor coordinates.
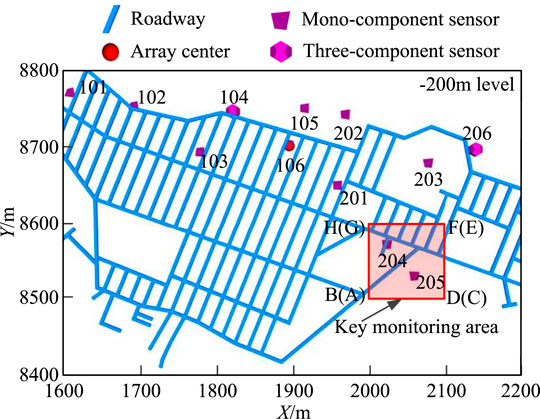
FIGURE 3. lane diagram of the sensor layout and -200 m level in the mining area.
Sensor Array Center in the Mine
Based on the sensor coordinates of the initial measurement, the determinant of the covariance matrix is calculated by Equation 12, and its spatial distribution diagram is shown in Figure 4. The expected velocity of the P-wave is 5222 m/s, the variance in the velocity is 50 m/s, and the P-wave arrival time error is 0.005 s. Figure 4 shows that there is a minimum determinant of the covariance matrix in the space, which is the array center. The farther the MS source is from the center of the sensor array, the larger the determinant of the covariance matrix
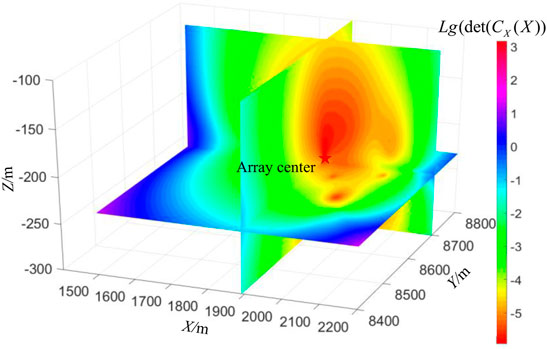
FIGURE 4. Spatial distribution diagram of
Sensor Coordinate Error Threshold and Comprehensive Evaluation Index in the Monitoring Area
The coordinate range of the -200 m level in the Beiminghe Iron Mine is set to
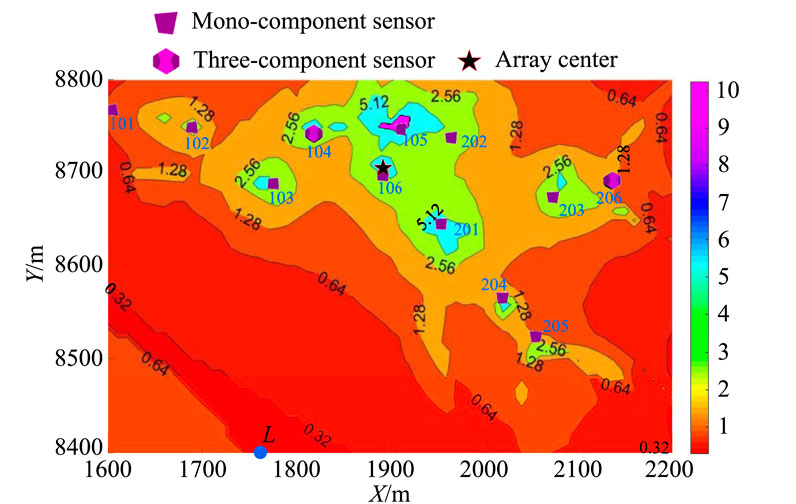
FIGURE 5. Contour diagram of the sensor coordinate error threshold at the -200 m level.
To evaluate the influence of different sensors on the MS source location, the area near stope No. 7 is further selected as the key monitoring area. The plane diagram of the key monitoring area is shown in Figure 3, and the scope of the key monitoring area is shown in Table 2. The key monitoring area meshes, and the grid spacing in the x, y, and z directions is 5 m. The grid point is taken as the MS source and the sample number Nm of normal distribution is set to 500. Then, the comprehensive evaluation index of each sensor in the key monitoring area is calculated through Equation 15. The comprehensive evaluation index of each sensor is shown in Table 3.
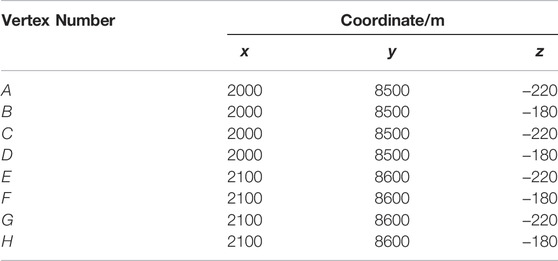
TABLE 2. Vertex coordinates of the key monitoring area.
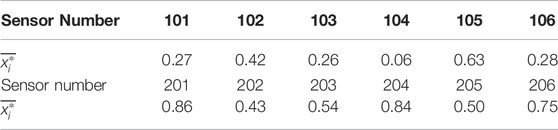
TABLE 3. Comprehensive evaluation index of each sensor.
Table 3 shows that in the key monitoring areas, the number of sensors whose coordinate error affects the MS source location from large to small is 201, 204, 206, 105, 203, 205, 202, 102, 106, 101, 103 and 104. Therefore, in sensor coordinates measurement, the sensor with a large comprehensive evaluation index should be focused on to improve the measurement accuracy of their sensor coordinates.
Comparison of the MS Location Results Before and After Remeasurement of Sensor Coordinates
According to the above calculation results, the coordinate errors of sensors 201, 204, 206, and 105, whose comprehensive evaluation index exceeds 0.6, have the greatest influence on the MS source location in key monitoring areas. Therefore, it is necessary to recheck the coordinate accuracy of the four sensors. The coordinate accuracy of sensors No. 204, 206, and 105 is within the sensor coordinate error threshold through remeasurement by the field staff. There is a fault fracture zone in the area near sensor No. 201, whose position and crushing degree are not detected in time, and hole collapse occurs in the borehole. Therefore, sensor No. 201 is not installed at the bottom of the borehole. Due to the permanent grouting installation, the coordinates of sensor No. 201 in Table 1 inevitably have measurement errors and cannot be remeasured. When the blasting events occur in the key monitoring area, the measurement error of sensor No. 201 severely affects the location accuracy of the MS source. Therefore, when the number of trigger sensors meets the minimum number of sensors required by the location method, sensor No. 201 can be discarded to improve the location accuracy of the MS source.
Five blasting tests are carried out in the key monitoring area. The locations of the test points are shown in Table 4, and the arrival time information of each test events is shown in Table 5. Since the blasting test area is far from sensors 101 and 102, these two sensors do not receive the 5 blasting test signals. The number of triggering sensors in the five blasting tests exceeds 4, so sensor No. 201 with large measurement errors should be discarded during localization. Based on the original sensor coordinates (as shown in Table 1), the location results of the five blasting test events are shown in Table 6. After removing sensor 201, the location results of the five blasting test events are shown in Table 6. After the sensor coordinates are remeasured, the location errors of the five blasting test events are reduced by 0.05 m, 5.89 m, 4.08 m, 8.22 m, and 0.13 m. The average location error is reduced by 3.67 m, and the location accuracy is improved by 25.74%.
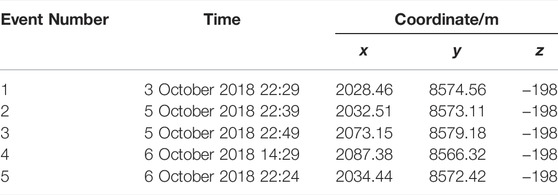
TABLE 4. Blasting test location.
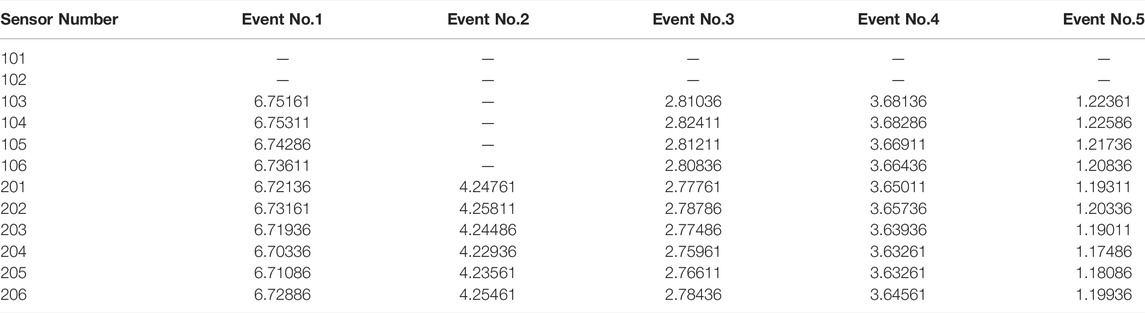
TABLE 5. Arrival time of the sensor for the blasting test event.
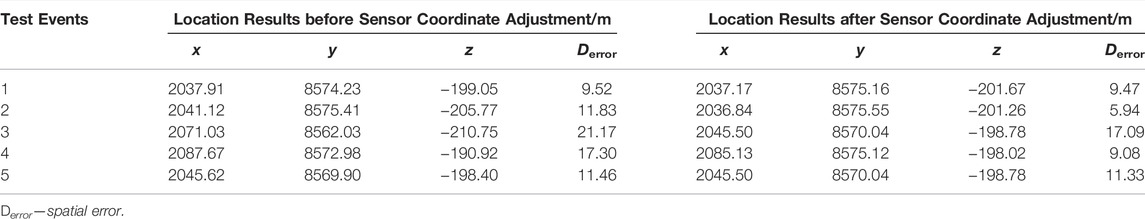
TABLE 6. Comparison of location results before and after sensor coordinate adjustment.
The accuracy range of the sensor coordinates can be obtained based on the calculation method of the sensor coordinate error threshold to guide the on-site sensor coordinate measurement. The comprehensive evaluation index of sensor coordinates is used to evaluate the influence of different sensor coordinates on the MS source location and accurately identify the sensors that have a greater impact on the MS source location. Finally, sensors with large coordinate measurement errors are focused on to improve the location accuracy of the MS sources.
Conclusion
The influence of the sensor coordinate error on the MS source location is studied, and the following conclusions can be drawn:
1) The influence of the sensor coordinate error on the location error is theoretically analyzed, and it is concluded that the location error is proportional to the sensor coordinate error.
2) The sensor array center is obtained based on D-optimal design theory. A calculation method for the sensor coordinate error threshold is proposed to obtain the sensor coordinate error threshold of different MS sources.
3) A comprehensive evaluation index of the sensor is proposed to evaluate the influence of different sensors in the monitoring area on the MS source location. The larger the comprehensive evaluation index is, the greater the influence of the sensor coordinate error on the MS source location and the higher the required accuracy of the sensor coordinate.
4) The distribution of the sensor coordinate error threshold at the -200 m level shows that the farther the source is from the sensor array, the smaller the sensor coordinate error threshold. The sensor coordinate error threshold in the array is larger than that outside the array, and the sensor coordinate error threshold decreases rapidly in the array and slowly outside the array.
5) The application results in the key monitoring areas of the Beiminghe Iron Mine show that the average location accuracy of blasting test events is improved by 25.74% by remeasuring the coordinates of sensors whose comprehensive evaluation index exceeds 6 and discarding sensors with large measurement error.
Data Availability Statement
The raw data supporting the conclusions of this article will be made available by the authors, without undue reservation.
Author Contributions
TL: Conceptualization, Resources, Methodology, Writing- Original draft preparation. B-RC: Visualization, Writing—Review and Editing. QW: Visualization, Investigation. X-HZ: Supervision. XW and M-XX: Validation.
Funding
The authors are grateful for the financial support from the National Natural Science Foundation of China (Grant No. 42077263) and the China Railway Corporation Science and Technology Research and Development Project (Grant No. P2019G001).
Conflict of Interest
M-XX was employed by the Company Beiminghe Iron Mine of Minmetals Hanxing Mining Co., Ltd.
The remaining authors declare that the research was conducted in the absence of any commercial or financial relationships that could be construed as a potential conflict of interest.
Publisher’s Note
All claims expressed in this article are solely those of the authors and do not necessarily represent those of their affiliated organizations, or those of the publisher, the editors and the reviewers. Any product that may be evaluated in this article, or claim that may be made by its manufacturer, is not guaranteed or endorsed by the publisher.
Acknowledgments
We would like to thank the staff at the Beiminghe Iron Mine of Minmetals Hanxing Mining Co., Ltd., in Hebei Province for their support and assistance in the field monitoring and data acquisition.
References
Bai, C.-Y., and Kennett, B. L. N. (2000). Automatic Phase-Detection and Identification by Full Use of a Single Three-Component Broadband Seismogram. Bull. Seismological Soc. America 90 (1), 187–198. doi:10.1785/0119990070
Boschetti, F., Dentith, M. D., and List, R. D. (1996). A Fractal‐Based Algorithm for Detecting First Arrivals on Seismic Traces. Geophysics 61 (4), 1095–1102. doi:10.1190/1.1444030
Cao, S., and Greenhalgh, S. (1993). Calculation of the Seismic First-Break Time Field and its ray Path Distribution Using a Minimum Traveltime Tree Algorithm. Geophys. J. Int. 114 (3), 593–600. doi:10.1111/j.1365-246x.1993.tb06989.x
Chen, B. R., Feng, X. T., Li, S. L., Yuan, J. P., and Xu, S. C. (2009). Microseism Source Location with Hierarchical Strategy Based on Particle Swarm Optimization. Chin. J Rock Mech Eng 28 (4), 740–749. doi:10.3321/j.issn:1000-6915.2009.04.012
Chen, B. R., Li, T., Zhu, X. H., Wei, F. B., Wang, X., and Xie, M. X. (2021). Microseismic Source Location Method Based on a Velocity Model Database and Statistical Analysis. Arab J. Geosci. 14 (19), 2017. doi:10.1007/s12517-021-08311-9
Crosson, R. S., and Peters, D. C. (1974). “Estimates of Miner Location Accuracy: Error Analysis in Seismic Location Procedures for Trapped Miners,” in Seismic Detection and Location of Isolated Miners. Washington, D.C.: United States Department of the Interior - Bureau of Mines.
Dai, F., Li, B., Xu, N., Fan, Y., and Zhang, C. (2016). Deformation Forecasting and Stability Analysis of Large-Scale Underground Powerhouse Caverns from Microseismic Monitoring. Int. J. Rock Mech. Min Sci. [Internet] 86, 269–281. doi:10.1016/j.ijrmms.2016.05.001
Feng, G.-L., Feng, X.-T., Chen, B.-R., Xiao, Y.-X., and Yu, Y. (2015). A Microseismic Method for Dynamic Warning of Rockburst Development Processes in Tunnels. Rock Mech. Rock Eng. 48 (5), 2061–2076. doi:10.1007/s00603-014-0689-3
Feng, G.-L., Feng, X.-T., Chen, B.-R., and Xiao, Y.-X. (2017). Performance and Feasibility Analysis of Two Microseismic Location Methods Used in Tunnel Engineering. Tunnelling Underground Space Technol. 63, 183–193. doi:10.1016/j.tust.2017.01.006
Feng, G.-L., Chen, B.-R., Xiao, Y.-X., Jiang, Q., Li, P.-X., Zheng, H., et al. (2022). Microseismic Characteristics of Rockburst Development in Deep TBM Tunnels with Alternating Soft-Hard Strata and Application to Rockburst Warning: A Case Study of the Neelum-Jhelum Hydropower Project. Tunnelling Underground Space Technol. 122, 104398. doi:10.1016/j.tust.2022.104398
Geiger, L. (1912). Probability Method for the Determination of Earthquake Epicenters from Arrival Time Only. Bull. Saint Louis Univ. 8, 60–71.
Gong, S. Y., Dou, L. M., Cao, A. Y., He, H., Du, T. T., and Jiang, H. (2010). Study on Optimal Configuration of Seismological Observation Network for Coal Mine. Chin. J Geophys 53 (2), 457–465. doi:10.3969/j.issn.0001-5733.2010.02.025
Kennett, B. L. N., and Sambridge, M. S. (1992). Earthquake Location-Genetic Algorithms for Teleseisms. Phys. Earth Planet. Inter. 75 (1–3), 103–110.
Kijko, A. (1977a). An Algorithm for the Optimum Distribution of a Regional Seismic Network-I. Pure Appl. Geophys. 115 (4), 999–1009. doi:10.1007/bf00881222
Kijko, A. (1977b). An Algorithm for the Optimum Distribution of a Regional Seismic Network - II. An Analysis of the Accuracy of Location of Local Earthquakes Depending on the Number of Seismic Stations. Pure Appl. Geophys. 115 (4), 1011–1021. doi:10.1007/bf00881223
Kovavisaruch, L., and Ho, K. C. (2005). “Modified Taylor-Series Method for Source and Receiver Localization Using TDOA Measurements with Erroneous Receiver Positions,” in Proc - IEEE Int Symp Circuits Syst., Kobe, Japan, 25 July 2005, 1, 2295–2298
Leśniak, A., and Isakow, Z. (2009). Space-time Clustering of Seismic Events and hazard Assessment in the Zabrze-Bielszowice Coal Mine, Poland. Int. J. Rock Mech. Min Sci. 46 (5), 918–928. doi:10.1016/j.ijrmms.2008.12.003
Li, Q. Y., Wang, N. C., and Yi, D. Y. (2008). Numerical Analysis. 5th Edition. Beijing: Tsinghua University Press.
Li, N., Ge, M., and Wang, E. (2014a). Two Types of Multiple Solutions for Microseismic Source Location Based on Arrival-Time-Difference Approach. Nat. Hazards 73 (2), 829–847. doi:10.1007/s11069-014-1110-y
Li, N., Wang, E., Ge, M., and Sun, Z. (2014b). A Nonlinear Microseismic Source Location Method Based on Simplex Method and its Residual Analysis. Arab J. Geosci. 7 (11), 4477–4486. doi:10.1007/s12517-013-1121-0
Li, N. (2014). Study on the Mechanism and Reliability of the Key Factors of Microseismic Source Location. Xuzhou, China: China University of Mining and Technology.
Liu, J. L., and Gao, J. (2012). Hypocenter Location by Using Combined Method of Inglada and Geiger Algorithms. J. Inst. Disaster Prev. 14 (2), 54–59. doi:10.3969/j.issn.1673-8047.2012.02.010
Liu, H. F. (2007). Linear and Non-linear Inversion Methods Research on Direct Current IP Measurements. Changsha, China: Central South University.
Mooney, W. D., Laske, G., and Masters, T. G. (1998). Crust 5.1: A Global Crustal Model at 5°×5°. J. Geophys. Res. 103 (1), 727–747. doi:10.1029/97jb02122
Paige, C. C., and Saunders, M. A. (1982). Algorithm 583: LSQR: Sparse Linear Equations and Least Squares Problems. ACM Trans. Math. Softw. 8 (2), 195–209. doi:10.1145/355993.356000
Rockah, Y., and Schultheiss, P. (1987). Array Shape Calibration Using Sources in Unknown Locations--Part II: Near-Field Sources and Estimator Implementation. IEEE Trans. Acoust. Speech, Signal. Process. 35 (6), 724–735. doi:10.1109/tassp.1987.1165222
Saragiotis, C. D., Hadjileontiadis, L. J., and Panas, S. M. (2002). PAI-S/K: A Robust Automatic Seismic P Phase Arrival Identification Scheme. IEEE Trans. Geosci. Remote Sensing 40 (6), 1395–1404. doi:10.1109/tgrs.2002.800438
Sun, M., and Ho, K. C. (2011). An Asymptotically Efficient Estimator for TDOA and FDOA Positioning of Multiple Disjoint Sources in the Presence of Sensor Location Uncertainties. IEEE Trans. Signal. Process. 59 (7), 3434–3440. doi:10.1109/tsp.2011.2131135
Wang, Y., and Ho, K. C. (2013). TDOA Source Localization in the Presence of Synchronization Clock Bias and Sensor Position Errors. IEEE Trans. Signal. Process. 61 (18), 4532–4544. doi:10.1109/tsp.2013.2271750
Wei, H. W., Peng, R., Wan, Q., Chen, Z. X., and Ye, S. F. (2010). Multidimensional Scaling Analysis for Passive Moving Target Localization with TDOA and FDOA Measurements. IEEE Trans. Signal. Process. 58 (3 PART 2), 1677–1688. doi:10.1109/tsp.2009.2037666
Xu, N. W., Tang, C. A., Chun, S., Liang, Z. Z., Yang, J. Y., and Zou, Y. Y. (2010). Microseismic Monitoring System Establishment and its Engineering Applications to Left Bank Slope of Jinping I Hydropower Station. Chin. J Rock Mech Eng 29 (5), 915–925.
Yang, L., and Ho, K. C. (2009). An Approximately Efficient TDOA Localization Algorithm in Closed-Form for Locating Multiple Disjoint Sources with Erroneous Sensor Positions. IEEE Trans. Signal. Process. 57 (12), 4598–4615. doi:10.1109/tsp.2009.2027765
Yu, Y., Feng, G.-L., Xu, C.-J., Chen, B.-R., Geng, D.-X., and Zhu, B.-t. (2022). Quantitative Threshold of Energy Fractal Dimension for Immediate Rock Burst Warning in Deep Tunnel: A Case Study. Lithosphere 2021, 1699273. doi:10.2113/2022/1699273
Zhang, X. S., Cai, W., Yang, Z. Y., Wang, B., and Hou, Y. G. (2018). The Analysis Influence of Positioning Error on Global Navigation Short Baseline Satellite System Orientating. Sci. Technol. Eng. 18 (35), 157–161. doi:10.3969/j.issn.1671-1815.2018.35.026
Keywords: microseismic, sensor coordinate error, monitoring area, sensor array center, threshold, comprehensive evaluation index
Citation: Li T, Chen B-R, Wang Q, Zhu X-H, Wang X and Xie M-X (2022) Influence Evaluation of Sensor Coordinate Error on Microseismic Source Location. Front. Earth Sci. 10:873986. doi: 10.3389/feart.2022.873986
Received: 11 February 2022; Accepted: 11 March 2022;
Published: 30 March 2022.
Edited by:
Shibing Huang, Wuhan University of Science and Technology, ChinaCopyright © 2022 Li, Chen, Wang, Zhu, Wang and Xie. This is an open-access article distributed under the terms of the Creative Commons Attribution License (CC BY). The use, distribution or reproduction in other forums is permitted, provided the original author(s) and the copyright owner(s) are credited and that the original publication in this journal is cited, in accordance with accepted academic practice. No use, distribution or reproduction is permitted which does not comply with these terms.
*Correspondence: Bing-Rui Chen, brchen@whrsm.ac.cn; Qing Wang, wangqing202@mails.ucas.ac.cn