 Cunying Zheng
94% of researchers rate our articles as excellent or good
Learn more about the work of our research integrity team to safeguard the quality of each article we publish.
Find out more
ORIGINAL RESEARCH article
Front. Earth Sci. , 02 May 2022
Sec. Atmospheric Science
Volume 10 - 2022 | https://doi.org/10.3389/feart.2022.859203
The research of atmospheric aerosol in mountain glacier areas has attracted more and more people’s attention. For the first time, a field observation study of total suspended particles (TSPs) for four seasons from September 2019 to August 2020 was carried out at the Tianshan Glaciological Station in the source area of Urumqi River, East Tianshan Mountains, China. The TSPs presented typical seasonal characteristics of high in autumn and low in winter, with the annual average value of 181 ± 170 μg m−3. Concentrations of Ca2+, SO42−, NO3−, Cl−, NH4+ and K+, OC, EC were elevated in autumn. The influence of stationary source emissions was stronger than mobile sources, which was explained by the average ratio of NO3−/SO42− (0.31 ± 0.17). The concentration of secondary organic carbon (SOC) was higher in summer and autumn, especially in summer, indicating that secondary formation processes of organic aerosols were frequent in summer. Impact of fossil fuel combustion sources were evident over the Glaciers, corroborated by the diagnostic mass ratios of OC/EC (0–21.4, 3.38) and K+/EC (0–0.31, 0.08). The factor analysis illustrated that aerosols were mainly affected by rock salt, dust, coal combustion, and automobile exhaust. The local sources made significant contributions to TSPs in the source of Urumqi River by the results of Results of Hybrid Single Particle Lagrangian Integrated Trajectory (HYSPLIT) model and potential source contribution function (PSCF).
It is well-known that anthropogenic and natural aerosols play significant roles in stratospheric ozone depletion, climate change, atmospheric visibility, acid deposition, photochemical smog, and human health (IPCC, 2013; Wang et al., 2019). They not only reflect and affect the local atmospheric characteristics, but due to their long-distance transportation, they may also affect the global atmospheric environment (Tripathee et al., 2017). Therefore, research on the chemical properties of aerosols has attracted increasing attention. However, due to the limited understanding of the chemical and physical properties of aerosols, as well as the lack of temporal and geographic distribution information, especially in rural and remote areas, the impact of aerosols on interconnected systems of the Earth remains great uncertainty. Analyzing the characteristics of aerosols in remote areas is not only useful for evaluating pollution transport caused by anthropogenic activities, but also for studying the impact of aerosols on biogeochemical cycles and climate change (Zhang N. et al., 2014).
Chemically speaking, aerosols are mainly composed of water-soluble inorganic ions (WSIIs), organic and elemental carbon, and mineral dust. Among them, carbon components and WSIIs are the major ingredients of aerosol particles (Zhang et al., 2011). The carbonaceous species consists of elemental carbon (EC) and organic carbon (OC). Organic carbon includes primary organic carbon (POC) directly emitted from the source and secondary organic carbon (SOC) converted from volatile organic compounds or gases. EC may be the second most direct factor in global warming, after carbon dioxide (Bond et al., 2013). EC and other carbonaceous aerosols have multiple effects on air quality, regional climate, and human health (Li et al., 2016; Chuang et al., 2019). Water-soluble compounds provide crucial information for understanding the chemical and physical properties, sources, behaviors, and formation mechanisms of aerosols (Wang et al., 2005). Furthermore, the physical and chemical characteristics of environmental aerosols are affected by two factors. One is the main meteorological factor (temperature, humidity, wind speed, and precipitation) (Trivedi et al., 2014), and the other is the geographic location (topography and distance from the source).
Recently, a lot of researches have been conducted at urban sites and some suburbs (Cao et al., 2009; Zhang NN. et al., 2012; Zhang et al., 2013; Zhao et al., 2015; Jiang et al., 2018; Turap et al., 2019; Xie et al., 2020). However, in remote areas, especially in snow-covered areas, similar measurement data is still lacking (Zhao et al., 2012; Zhao et al., 2013; Cong et al., 2015; Wang M. et al., 2016; Wan et al., 2016). These studies have mainly focused on the Tibetan Plateau, and there are few studies on carbon aerosols in the low-altitude Tianshan area (Zhang et al., 2019). The Tianshan Mountains, with nearly 16,000 glaciers, is one of the few areas with the highest concentration of glaciers in the mid-latitudes of the Northern Hemisphere (Aizen et al., 2007). They store water resources in the form of ice and snow in cold seasons, release water resources in warm seasons, and directly regulate the supply of freshwater for the lives of the surrounding people, especially in arid areas. In recent decades, the glaciers in the Tianshan Mountains have melted rapidly (Xu et al., 2019). Compared with plateau glaciers, the Tianshan glaciers are greatly affected by human activities due to their lower altitude and the larger human population. Therefore, it is very necessary to understand the temporal and spatial distribution, chemical process, and dynamic process of air pollutants in this region. However, little updated information on ambient aerosols has been available since 2017 in this region (Zhang et al., 2017).
In this research, for the first time, TSPs were collected for 1 year, from September 2019 to August 2020, in the Urumqi River Valley, eastern Tianshan, China. The research mainly analyzed the chemical properties of WSIIs, elemental (EC), and organic carbon (OC), and assessed their seasonal variability. The potential sources of aerosol particles and their transportation routes were also evaluated and discussed during periods of high aerosol loading. The purpose of this research is to understand the chemical properties, seasonal variation and possible sources of aerosols in this area, and to provide more information for research of aerosol transport mechanisms. At the same time, it also provides data for studying the background and the influence of human activities in the glacier area.
The aerosol sampling site was situated at the Tianshan Glaciological Station, hereby denoted “TGS” (43.21◦N, 87.12◦E, and 2,130 m a.s.l), Chinese Academy of Sciences (CAS), China (Figure 1). The TGS is located at the northern foot of the middle section of Tianshan Mountains, within the territory of Urumqi, Xinjiang Uygur Autonomous Region, in the Urumqi River Basin, approximately 107 km away from Urumqi. The region is situated in the middle of Eurasia, far from the ocean, and belongs to a typical continental climate. The climate in this area is dry and cold, with westerly winds prevailing. It is seated in a remote region with no crucial anthropogenic pollution sources neighboring. Therefore, long distance transportation from upwind regions may be the reason for elevated pollutant concentrations (Li et al., 2011; Zhang et al., 2019).
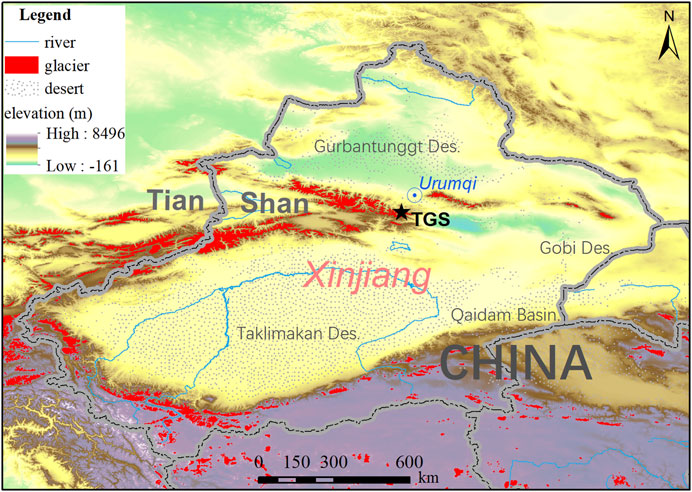
FIGURE 1. The map shows the location of the sampling site.
A mid-volume sampler (TH-150F, Wuhan Tianhong Instruments, and Wuhan, China) was used to collect the total suspended particles (TSPs), and the flow rate was controlled to 100 L min−1. The sampling filter was a quartz microfiber filters (QM/A; Whatman, Middlesex, United Kingdom), with a diameter of 90 mm. All quartz filters were preheated at 450°C for 4 h to reduce carbon interference in the blank filter membrane, and then equilibrated for 24 h at a stable temperature of 20°C and 38% relative humidity (RH). When sampling, the height of the entrance of the sampler from the ground should not be less than 1.5 m. Sampling should not be carried out under weather conditions with wind speed greater than 8 m/s, and during the sampling period, the wind speed ranged from 0.39 to 1.42 m/s, which met the sampling conditions. Sampling started at 19:00 in the evening and lasted until 18:00 in the evening of the next day, for a total of 23 h. A total of 75 TSP samples were collected at the site during the following periods: 1 September–10 October 2019 (autumn, 17 samples), 10–24 December 2019 (winter, 15 samples), 7–21 May (spring, 15 samples), and 16–31 July and 1–14 August (summer, 28 samples). Each filter was wrapped in aluminum foil, sealed in a polyethylene bag, and stored in a refrigerator at −18°C until analysis.
The Sartorius MC5 electronic microbalance was applied to analyze mass concentrations of TSPs, with a sensitivity of ±1 µg. A quarter of a quartz-fiber filter for each sample was used to analyze WSIIs (SO42−, NO3−, Cl−, Na+, NH4+, K+, Mg2+, and Ca2+), with Ion chromatography (Dionex-320). The detection limits of the method were Na+ (2,786.1 μg L −1), NH4+ (119.9 μg L −1), K+ (32.7 μg L −1), Mg2+ (150.1 μg L −1), Ca2+ (819.8 μg L −1), Cl− (41.1 μg L −1), NO3− (64.5 μg L −1), and SO42− (18.7 μg L −1). The concentrations of 8 main WSIIs were obtained by subtracting the blank value. The specific laboratory methods were described by Zhao and Li (2004). Another section of a quartz-fiber filter used the Sunset Model Carbon analyzer to analyze carbon component, and followed the Interagency Monitoring of Protected Visual Environment (IMPROVE) thermal/optical reflectance (TOR) protocol (Zhao et al., 2013; Wang Y. et al., 2016). All experimental steps were performed under strict quality control conditions. The repeat difference between OC and EC analysis was less than 10%. The same method was used to analyze the blank filter, and the average blank concentration was used to correct the sample analytical results (Wang et al., 2018).
Principal component analysis (PCA) is an effective method that can provide a quantitative simplified description of the principal components by processing the raw data matrix, and has been widely used in the source analysis and classification of air pollutants (Meng et al., 2016). Under the assumptions of the receptor model, it is assumed that at a receptor site, the measured species concentration is a linear combination of the total mass consisting of the sum of contributions from different sources/factors, the formula is as follows.
where xij refers to the concentration of the jth species in the ith sample; gik defines the contribution of kth factor/source to the ith sample; fkj is the relative amount of the jth species in the kth source. Ideally, eij should only include experimental error, but in practice it may also include small unknown and unexplained parts.
where X is a data matrix of measured concentrations of different chemical constituents in the aerosol. G is the loading matrix, which serves as the source contribution dataset for each sample. F is a score matrix representing the relative weight of the analyzed species in each source. E is the noise matrix of the residuals.
In order to analyze the origin and transport routes of TSPs, 72-h air mass back trajectories were calculated at a height of 500 m using Hybrid Lagrangian Single-Particle Integrated Trajectory (HYSPLIT) model in the GIS-based software-TrajStat (Draxler and Rolph, 2013). The model was run four times per day at starting times of 00:00, 06:00, 12:00, and 18:00 UTC, with the (National Center for Environmental Prediction) NCEP/NCAR (National Center for Atmospheric Research) meteorological reanalysis dataset generated from the global data assimilation system (GDAS, available at ftp://arlftp.arlhq.noaa.gov/pub/archives/gdas1/).
The potential source contribution function (PSCF) analysis was applied to assess the possible source areas of total suspended particulate matter. According to the results of the HYSPLIT model, the GIS-based TrajStat software (Wang et al., 2009) was used for PSCF analysis. The domain of PSCF was 22–65°N, 35–95°E with a horizontal resolution of 0.5° × 0.5°. The specific principles of these models can be detected in prior studies (Feng et al., 2015; Yao et al., 2016; Zhang J. et al., 2018).
The automatic weather observation station of the research site was used to record meteorological parameters such as precipitation, temperature, relative humidity, and wind speed. According to observations, the temperature was between −16.4 and 17.2°C, with an average of 6.3°C, the relative humidity was between 45 and 90%, with an average of 71.4%, and the wind speed was between 0.39 and 1.42 m/s, with an average of 0.91 m/s. Due to the influence of the westerly circulation in this area, precipitation was frequent from May to September, while precipitation in autumn and winter was relatively low.
The annual average concentration of TSPs in this study area was 181.4 ± 169.7 μg m−3, which was obviously lower than that in urban regions, such as in Urumqi (338.0 μg m−3) in 2010–2012 (Zhang X. et al., 2014) and Xi’an (378.7 μg m−3) in 2012 (Zhang F. et al., 2015), and higher than the concentrations in remote regions, such as in Nam Co. station (31.9 μg m−3) in 2011–2013 (Liu et al., 2017), Lulang site (23.5 μg m−3) in 2010 (Zhao et al., 2013) and Qinghai lake (41.4 μg m−3) in 2010 (Zhang N. et al., 2014). The results indicated that the air in the source area of Urumqi River had been polluted by human to a certain extent.
The average TSPs concentrations were on the order of 356.2 μg m−3 (range: 60.1–795.9 μg m−3) in autumn, 239.2 μg m−3 (range: 56.8–490.0 μg m−3) in spring, 107.0 μg m−3 (range: 51.6–280.2 μg m−3) in summer, and 64.4 μg m−3 in winter (range: 18.8–90.5 μg m−3). The average mass concentration in autumn was 5.5 times that in winter, and these typical seasonal patterns could be attributed to a variety of pollution contributions from local and regional areas in different seasons. The high concentration of TSPs in autumn was due to low wind speed and low rainfall, which was not conducive to the removal of pollutants. Second, a road was being built near the TGS, which might cause more road dust and traffic emissions. The average concentration of TSPs was also high in spring, mainly due to the high wind speed, which was easy to produce dust storms. The average concentration of TSPs was lower in summer, one was because there was less human pollution, and the other was because of more precipitation. In summer, rainfall accounted for 60% of the annual precipitation, which was conducive to remove and reduce the mass concentrations of TSPs. At the same time, due to the Covid-19, Urumqi entered into a “wartime-state” on 16 July 2020, which was the strictest mobility restriction that was, absolute lockdown. Human activities had been greatly reduced, and the mass concentration of summer aerosols had been greatly reduced. The reason for the lowest concentration of TSPs in winter was that the Tianshan Mountains were covered by heavy snow and inaccessible. At the same time, it might also be related to the temperature inversion layer. Early researchers have found that there is a strong inversion layer at 1,000–2,400 m above Urumqi in winter, which can prevent pollutants from spreading to high altitudes and trap them in the boundary layer (Zhang et al., 2019). Therefore, although Urumqi had serious air pollution in winter, the atmospheric environment in the source of Urumqi River was still relatively clean. The main reason was that the existence of the temperature inversion layer prevented pollutants from spreading to high altitude areas.
The daily concentrations of WSIIs (Cl−, NO3−, SO42–, Na+, NH4+, K+, Mg2+, and Ca2+) for all samples are listed in Figure 2. Generally, the total WSII average concentration was 9.15 ± 5.53 μg m−3, accounting for ∼5.04% of the TSP mass. The order of ionic species abundance was Ca2+ >SO42– >NO3−>Na+ >Cl− >NH4+ >K+ >Mg2+. Ca2+, SO42– and NO3− were the three most prevalent WSIIs, accounting for 81.3% of the total WSIIs. The mass concentrations of the other five ions (Na+, NH4+, K+, Mg2+ and Cl−) were lower (less than 1.0 μg m −3), accounting for 18.7% of the total ion concentration. Ca2+ and TSP had a strong correlation (R = 0.87, n = 75, p < 0.05), indicating that the changes of this ion were closely related to the formation, transmission and removal of TSP (Zhang Q. et al., 2015).
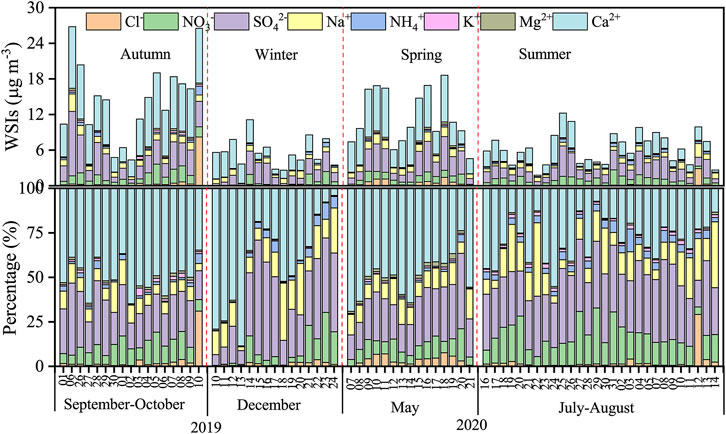
FIGURE 2. Daily change of WSIIs (Cl−, NO3−, SO42–, Na+, NH4+, K+, Mg2+ and Ca2+) and percentage (%).
The average seasonal concentrations of WSIIs are presented in Table 1. Similar to TSPs, the concentrations of sum of total ions had noticeable seasonal changes, higher in autumn and spring and low in summer and winter. The seasonal variation of the mass concentration of each ion was also very obvious. The mass concentrations of all ions were highest in autumn (except Na+ and Mg2+), and lowest in winter (except Ca2+ and NH4+).
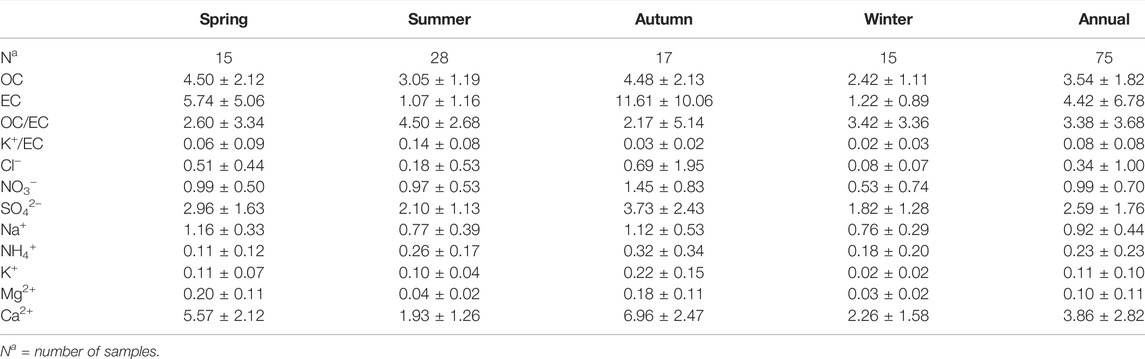
TABLE 1. Arithmetic averages ± standard deviations (µg m−3) for mass and chemical components during four seasons.
As we all know, Ca2+ was an excellent indicator of soil dust (Li et al., 2011; Zhao et al., 2011). When the spring dust storm occurred, the concentration of Ca2+ was the highest. But in this study, the Ca2+ concentration in autumn was 1.25 times that in spring. In the autumn, the infrastructure of the Tianshan Glaciological Station was under construction, generating a lot of dust from buildings and roads. Therefore, the calcium ion concentration was higher in autumn. Furthermore, the dust emission was constant in winter and summer, therefore, the seasonal variation of calcium concentration was mainly related to weather conditions, such as rainfall and wind. There was more precipitation in summer and winter, especially in summer, where the precipitation accounted for 60% of the annual precipitation, so the concentration of Ca2+ was low.
SO42– and NO3– were also the most significant water-soluble ions in total suspended particles in the source area of Urumqi River. In our study, the annual average concentration of sulfate ions was the second highest, accounting for 28.3% of the total ions. The concentration was highest in autumn, followed by spring and summer, and lowest in winter, because the relatively high SO2 concentration was conducive to the formation of SO42–. There was a significant correlation between SO42– and Ca2+ (r = 0.72), indicating that had similar origins, derived from desert and road dust particles and may exist in the form of CaSO4. Furthermore, the lower ratio (SO42–/Ca2+ = 0.22) in autumn also illustrated that the sources of SO42– and Ca2+ were similar, mainly from natural sources, such as sand and dust, etc. (Ming et al., 2007). NO3− was slightly lower than that of SO42–, accounting for 10.8% of the total concentrations of the ions. The seasonal variation characteristics of its concentrations were the same as that of SO42–, with the highest in autumn and lowest in winter. It is generally believed that NO3− is the reaction product of the emitted NOx and the NO x emissions mainly originate from the burning of fossil and biomass fuels. In an alkaline atmosphere, the gaseous HNO3 formed by the oxidation of NOx can be adsorbed on the surface of mineral particles and react with it to form nitrate (Clase and Gysels, 1998). Its concentration was the highest in autumn, mainly because there were more vehicles discharged during this period, and more NOx was produced, which was beneficial to the formation of NO3−.
Figure 3 shows the equivalent concentration ratios of the main ions. The ratio of the sum of cation and anion equivalent concentrations (CE/AE) can better reflect the acidity of air particles. In our samples, the ratios varied from 0.97 to 32.84, with an average value of 4.58, indicating cations dominate the ionic composition during the sampling period and major anions are not detected. Early studies had shown that the lack of anions was mainly due to undetected carbonate when Ca2+ was significantly related to ΔC (CE-AE) (Sun et al., 1998; Zhang XY. et al., 2012). In this research, the correlation coefficient between Ca2+ and ΔC was 0.9435 (p < 0.01), indicating that HCO3−/CO32– was the undetected primary anion. Earlier studies also reported similar results (Li et al., 2011; Zhao et al., 2011; Zhang X. et al., 2016; Zheng et al., 2021). This suggested that CO32-/HCO3− should probably be the main undetected anion. Ca2+ and NH4+ are the main alkaline ions for neutralizing acidic particles in the atmosphere. In the paper, the equivalent ratios of Ca2+/(NO3−+SO42–) were higher than 1 in four seasons, especially in winter. However, the ratios of NH4+/(NO3−+SO42–) were less than 1. These illustrated that NH4+ was not enough to neutralize NO3− and SO42-, while Ca2+ was not only formed to combine with NO3− and SO42-, but the remaining Ca2+ may also combine with CO32-/HCO3−, which also verified the previous conclusion. Therefore, the dominant inorganic compound in these samples should be CaCO3, similar to the result found at Mt. Yulong (Zhang X. Y. et al., 2012).
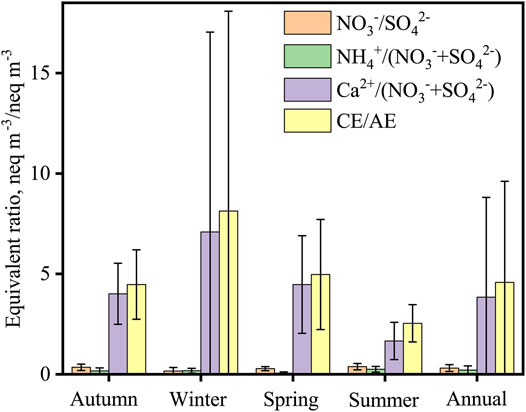
FIGURE 3. Seasonal and annual averages of equivalent ratios of major WSIIs of TSP.
The ratio of NO3−/SO42- is an important index to distinguish between stationary and mobile sources of sulfur and nitrogen in the atmosphere. In general, when the mass ratio of NO3−/SO42− is greater than 1.0, indicating that the emission of mobile sources is dominant, and vice versa, the stationary sources are dominant (Arimoto et al., 1996; Ye et al., 2017). In this paper, the ratios of NO3−/SO42− varied from 0.00 to 0.82, with an average value of 0.31, which was relatively similar to that found in some regions in China, such as Shiyi Glacier (0.37; Zhang Y. et al., 2016), Mt. Yulong (0.33, Zhang NN. et al., 2012). In semi-urban and remote regions, transportation facilities and vehicular emissions were limited. Therefore, the sources were mostly from stationary sources. The ratios of NO3−/SO42- had obvious seasonal variations at TGS. The seasonal sequence of the ratio of NO3−/SO42- was summer (0.38)> autumn (0.35)> spring (0.28) >winter (0.16). In autumn and summer, the high temperature was conducive to the decomposition of organic matter, especially in summer. In addition, there were frequent human activities in autumn, which produced abundant nitrogen. These were important sources of NO3−, so the NO3−/SO42- ratios were relatively high.
The abundances of OC, EC, OC/EC and K+/EC ratios in the samples are shown in Table 1. The mass concentration range of OC was 0.94–9.00 μg m−3, with an average of 3.54 ± 1.82 μg m−3. The mass concentration range of EC was 0.08–34.84 μg m−3, with an average of 4.42 ± 6.78 μg m−3. In autumn, the concentrations of OC and EC were significantly higher than other seasons (Figure 4). For OC, the order of decreasing concentration was: spring (4.50 μg m−3) autumn (4.48 μg m−3), and summer (3.05 μg m−3)>winter (2.42 μg m−3). However, the seasonal variation of EC was different, the order was: autumn (11.6 μg m−3)>spring (5.74 μg m−3)>winter (1.22 μg m−3)>summer (1.07 μg m−3). The seasonal changes of EC are different from other cities, such as Lanzhou (the highest in winter). The seasonal variation of EC was different from that of cities, such as Lanzhou (the highest in winter) (Tan et al., 2017). There are various sources of EC, including diesel emissions, inefficient combustion of fossil fuels, and biomass combustion. In autumn, there were more human activities. The Tianshan Glacier Station was undergoing infrastructure construction, roads were being built outside the station, and vehicles and people were frequently coming and going. At the same time, the weather conditions were relatively dry, the precipitation decreased significantly (2.8 mm), and the erosion of aerosols was significantly reduced, resulting in higher mass concentrations of EC. Therefore, the differences between OC and EC had a lot to do with their seasonal origin, chemical transformation and meteorology.
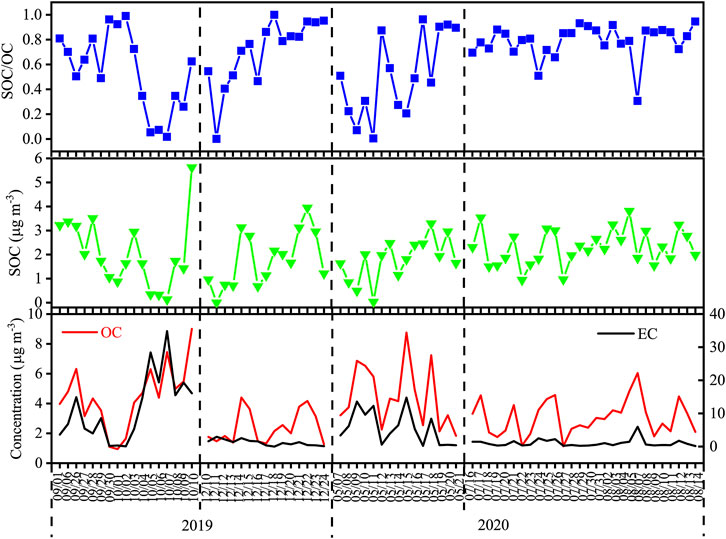
FIGURE 4. Daily variation of OC, EC SOC, and SOC/OC ratios.
The variation range of OC/EC was 0.47–21.43, with the annual average of 3.38 ± 3.68. Early research pointed out that the OC/EC ratio of most urban sites in the world is between 1.0 and 4.0 (Cao et al., 2003). The value of OC/EC in the source area of Urumqi River was between this range, showing that OC and EC in this area were affected by anthropogenic sources. The OC/EC ratio of vehicle emissions is between 0.7 and 2.4, and coal combustion is between 0.3 and 7.6. Larger values of this ratio (between 4.1 and 14.5) can usually be found in biomass combustion emissions (Wang Y. et al., 2016). The value observed at this test point was greater than the value of automobile exhaust emissions and lower than the value of biomass combustion, which was mainly affected by coal combustion. However, the OC/EC value had an obvious seasonal variability, the highest in summer (4.50 ± 2.68) and the lowest in autumn (2.17 ± 5.14). The sources of OC and EC were slightly more complicated and affected by biomass combustion and automobile exhaust respectively in summer and autumn.
In addition, the K+/EC ratio was also applied to assess the sources of fossil fuel combustion (0.03–0.09) and biomass combustion (0.2–0.5) (Tao et al., 2016). The K+/EC ratio was 0.08 ± 0.08 in our samples, showing that the concentration of EC was more affected by fossil fuel combustion emissions. Compared with the overall data, in summer, the ratio of K+/EC was 0.14, which was closer to 0.2. In summer, due to the Covid-19, Urumqi was under absolute blockade, and residents were quarantined at home. During this period, on the one hand, human activities were reduced, and on the other hand, National Highway 216 was also blocked. So, the mass concentration of EC had been greatly reduced. At the same time, precipitation was most abundant in summer, and the removal of aerosol particles by precipitation was another likely reason for the lower EC concentrations during this period. Therefore, the K+/EC ratio was the highest in summer. This was consistent with the analysis of the OC/EC ratio. In other seasons, the ratio of K+/EC was closer to the ratio of fossil fuel combustion.
Studies have shown that the good correlation between OC and EC can reflect their homology (Turpin et al., 1990). There were moderate correlations between the OC value and the EC value in autumn (R2 = 0.59) and summer (R2 = 0.63), while there was a significant correlation between the two in spring (R2 = 0.86) (Figure 5), indicating that the emission and transmission process of the two were more similar in spring. The higher OC and EC values in spring might be due to the impact of sand and dust storms, and the long-distance air masses from Central Asia carried more carbon components. However, the correlations were relatively low in other seasons compared to spring (R2 = 0.1–0.6); this suggested that there were multiple sources of OC and EC that were not always correlated.
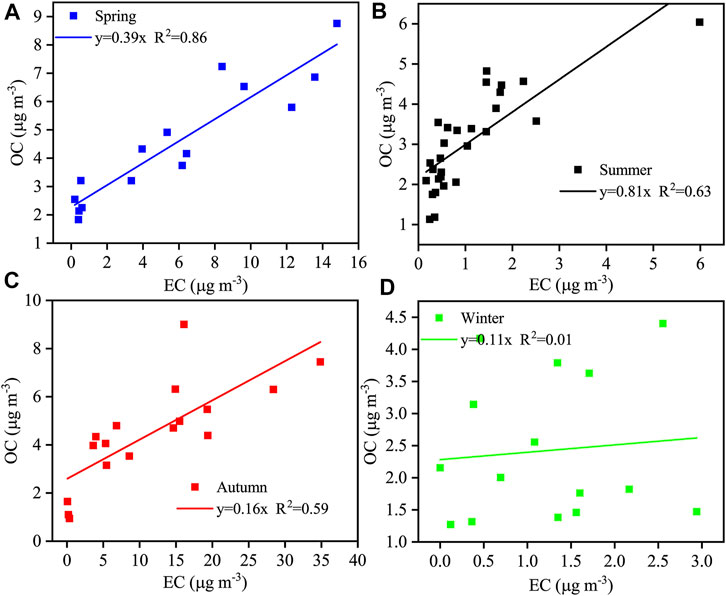
FIGURE 5. Scatter plots of OC versus EC in four seasons. (A) Spring; (B) Summer; (C) Autumn; (D) Winter.
According to earlier researches (Zhang X. et al., 2014; Li et al., 2016; Xiong et al., 2017), the estimation method of SOC is as follows:
where (OC/EC) min is the minimum value of the OC/EC ratio after excluding specific data of obviously changes in the OC/EC ratio caused by rainfall, dust, or other factors. The estimated concentration range of SOC was 0.03–5.62 μg m−3, with the average concentration of 2.04 ± 1.05 μg m−3. The concentration of SOC was higher in summer and autumn, especially in summer. It also could be seen from Figure 4 that the values of SOC/OC were also higher in summer. Previous studies had shown that the formation of SOC was related to an increase in humidity or temperature (Huang et al., 2012; Niu et al., 2013; Zhang F. et al., 2015). According to the meteorological data collected by the automatic weather station, the relative humidity (75%) and average temperature (13.80°C) in summer were higher than other seasons, which may provide favorable meteorological conditions for the formation of SOC. In winter, the stable atmospheric conditions and higher concentrations of VOCs were conducive to the formation of SOC (Jia et al., 2016). This is consistent with the fact of heating in winter.
Eight kinds of carbon components (OC1-OC4, OP and EC1-EC3) were used for source analysis of carbonaceous components, which was determined following the IMPROVE TOR protocol (Chow et al., 2001). Specifically, OC1 accounts for a relatively high proportion of biomass combustion; OC2 and OC3 may mainly cause by secondary organic reactions and biomass combustion; OC4 and EC1 represent coal combustion and automobile exhaust; OP is mainly related to water-soluble organic carbon; EC2 and EC3 are released at high temperature and may be portion of diesel engine exhaust (Cao et al., 2005).
The average percentage of the eight carbon components in the sample is shown in Figure 6. The carbon component had obvious seasonal variation characteristics. EC2 reached the highest value (70.5%) in autumn, indicating that the impact of diesel engine exhaust during this period was more serious. This was consistent with the fact that construction was underway near the sampling point. OC3, OC4, OP and EC1 were the highest in summer, accounting for 10.9, 7.8, 30.8 and 9.0%, respectively. In winter, their proportions were 8.7, 4.9, 28.0 and 8.8%. The four components were not very different in summer and winter, and they were all affected by secondary reaction, biomass combustion, and coal combustion. summer was slightly higher, mainly because favorable weather conditions such as high relative humidity, high temperature and solar radiation were conducive to form organic carbon.
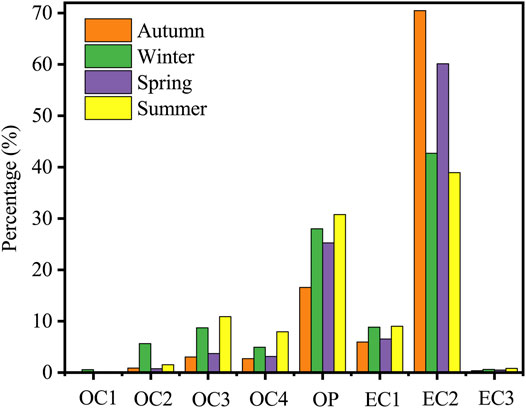
FIGURE 6. The percentages (%) of the eight carbon components in each season.
OC, EC, and ion mass concentrations and associated ratios from previous studies in different locations, including glacial and urban areas, were listed for comparison (Table 2). The OC and EC values (3.54, 4.42 μg m−3) were higher than the values (1.49 μg m−3 for OC and 0.33 μg m−3 for EC) in Qinghai Lake measured by Zhang (Zhang X. et al., 2014), but lower than some cities in China, such as Urumqi (32.0, 10.8 μg m−3), Lanzhou (17.7, 9.0 μg m−3) and Beijing (15.3, 5.27 μg m−3) (Wang M. et al., 2016; Zhang Y. et al., 2018; Turap et al., 2019). Early studies suggested that most urban sites around the world have OC/EC ratios between 1.0 and 4.0 (Cao et al., 2003). In this study, the ratio of OC/EC was lower than that of Qinghai Lake area and close to that of urban area. These comparisons showed that the concentrations of carbon components in the source area of Urumqi River were also affected by anthropogenic activities. The value of K+/EC was lower than that of Qinghai Lake, indicating that the burning of fossil fuels in this area had a greater impact on the concentrations of OC and EC. At the same time, we used analysis of variance (ANOVA, SPSS 22) to analyze the OC, EC and OC/EC, K+/EC of the study area and the urban areas (Urumqi, Lanzhou and Beijing). The results showed that there was no significant difference between the measured values in the study area and the urban areas (p = 0.60 > 0.05), which also indicated that the OC and EC in the study area had been subject to certain anthropogenic activities.
The concentration of Ca2+ was the biggest in TSP samples, which was higher than some urban areas and was more affected by dust storms. The concentrations of SO42- and NO3− were lower than that in urban areas and similar to those in remote areas, indicating that they were mainly from natural sources. The ratio of NO3−/SO42- was lower than that in urban areas and similar to those in glacier areas, indicating that nitrogen and sulfur in aerosols mainly came from stationary sources. Then we used the analysis of variance method to analyze the water-soluble ions (NO3−, SO42-, Na+, NH4+, Ca2+) and ion ratio (NO3−/SO42-) in the glacier areas. The results showed that there was no significant difference between the data in the glacier region (p = 0.51 > 0.05). Therefore, although the source region of Urumqi River has been polluted to a certain extent, natural sources still play a dominant role.
This study used principal component analysis (PCA, SPSS version 22.0) to analyze the potential origin of chemical components. Varimax rotation is used to make the loading pattern of the factor clearer, that is, the loading of some obvious variables in a factor tends to 1, while for other non-obvious variables, and the corresponding loading tends to 0. Variables are considered indicators of source categories (factors) only when their respective loadings >0.5 (Callén et al., 2009; Xu et al., 2017; Zhang Y. et al., 2018). Factors with eigenvalues >1.0 remain in the results. The results were shown in Table 3.
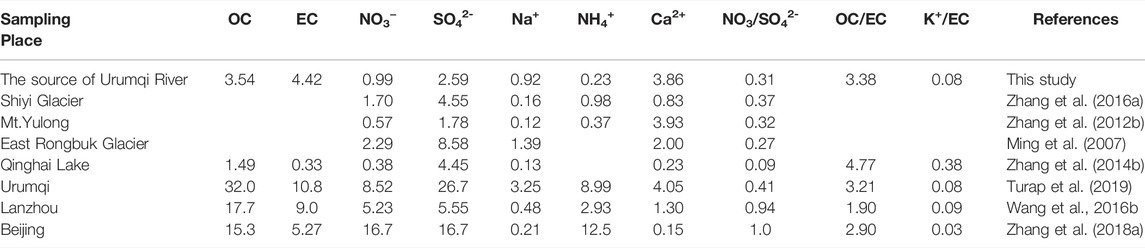
TABLE 2. Comparison of major chemical components and ratios from this study with measurements at other sites.
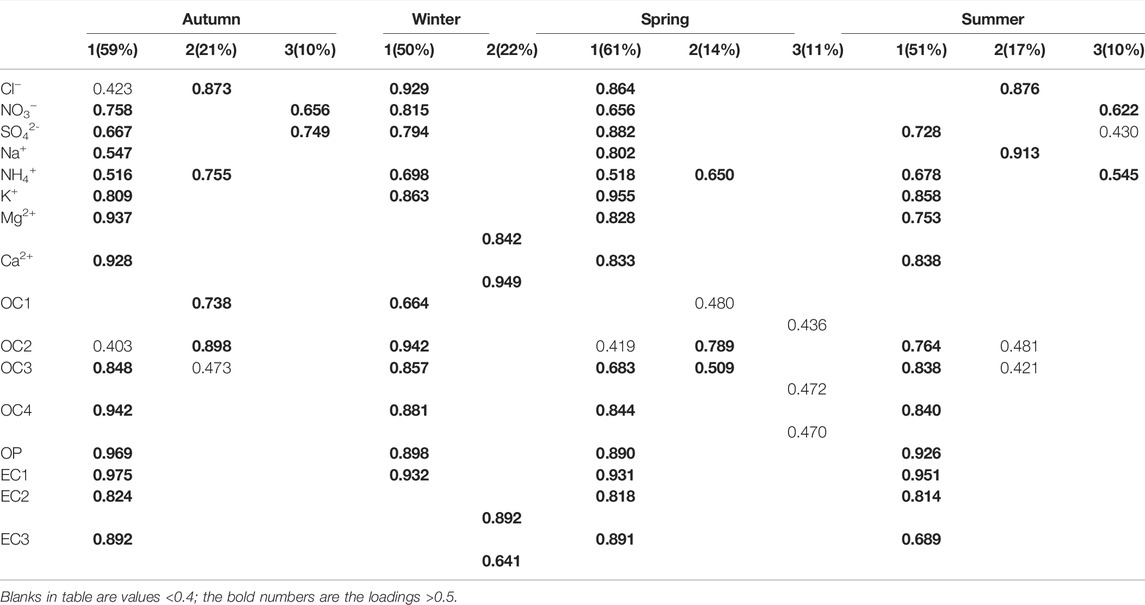
TABLE 3. The Factor loads from principal component analysis of WSIIs and OC, EC in TSP.
In autumn, four factors were appraised by principal component analysis, which explicated 90% of the total variance. Factor 1 had high loadings for K+, Mg2+, Ca2+, NO3−, OC3, OP, OC4, and EC1, EC2 (all above 0.7), which indicated that dust (construction dust and mineral dust), biomass combustion, fossil fuel combustion, and automobile exhaust emissions might account for 59%. Factor 2 was principally influenced by OC2, OC3 and Cl−, NH4+, explaining 21% of the variance. The primary emissions generated during the combustion process and the products of agriculture and animal husbandry might have a bearing on this factor. The main load of SO42- in Factor 3 indicated that it was related to the burning of fossil fuels. In winter, a total of 3 principal components were extracted to explain 81% of the total variance. The load of Cl−, NO3−, SO42−, K+, and OC2, OC3, OC4, OP, EC1 in Factor 1 was more than 0.7. The research showed that the combined effects of secondary reactions and the burning of biological and fossil fuels caused 50% of pollution. Ca2+, Mg2+ and EC2 in Factor 2 explained 22% of the total variance, mainly from dust and diesel-vehicle exhaust. In spring, four factors explained 94% of the total variance. Factor 1 had high loadings for Cl−, SO42−, Na+, K+, Mg2+, Ca2+, and OC4, OP, EC1, EC2, EC3, indicating the sources of dust, evaporated rock salt, coal combustion and vehicle exhaust. Factor 2 had high loadings for OC2, indicating the contribution of secondary organic carbon (SOC), accounting for 14% of the total variance. In summer, 4 factors were identified, which accounted for 84% of the total variance. Factor 1 was composed of SO42-, K+, Mg2+, Ca2+, and OC2, OC3, OC4, OP, EC1, EC2, indicating the contribution of sand dust, secondary organic carbon, biomass combustion, coal combustion and automobile exhaust. Factor 2 might cause by Salt Lake evaporation under high temperature conditions because of high contents of Na+ and Cl−. The loadings of NO3− and NH4+ in Factor 3 were above 0.5, indicating the impact of anthropogenic pollution. The high loading of OC1 (0.80) in Factor 4 indicated the source of biomass combustion.
In summary, the main pollution sources in this mountainous glacier area are sand, dust, rock salt, fossil fuel combustion, biomass combustion, and secondary reactions, which can account for more than 70% of pollution in each season.
Clustering trajectories of different seasons during the sampling time are displayed in Figure 7. Most of the air masses transported from the west and northwest were in good agreement with the meteorological data and mainly affected by the westerly circulation. In spring, the trajectories were classified into three clusters, and most short-range trajectories from the arid areas around the Tianshan Mountains accounted for 96.7% of the total. The air mass in Cluster 1 originating from the Gurbantunggut Desert in the northern part of the sampling site accounted for 50.0%, and the air mass in Cluster 2 originated from the Sary Ishikotrau Desert in Kazakhstan and accounted for 46.7%, which may bring more sand and dust particles, while carrying more carbon components, especially EC. Thus, the concentrations of Ca2+, Mg2+, OC, and EC were higher. The air mass from Central Asia and Siberia (Cluster 3) had the lowest frequency of long-range aerosol transport, accounted for 3.3% of the total trajectories. In summer, the air masses in Cluster 2 and Cluster 4 originating from the arid regions of Kazakhstan increased gradually, accounting for 27.5% of the total trajectories, resulting in the input of some anthropogenic pollution, which may cause the concentration of NO3− and SO42− to be higher than in winter. The air masses in Cluster 3 originating from the Gurbantunggut Desert north of the sampling site decreased to 25.0%, while the air mass in Cluster 1 arising from the Tianshan Mountains in the west of the sampling point increased, accounting for 47.5%. The air masses (Cluster 1, 46.9%) in autumn originated from the Gurbantunggut Desert and then passed through the Shihezi urban area, which may cause the input of desert dust and anthropogenic pollution. Therefore, the concentrations of SO42−, NO3−, and Ca2+ were very high. The air mass originating from Lake Issyk-Kul in Kyrgyzstan (Cluster 3) accounted for 18.8% of the total air masses, which also brought more Na+ and Cl−. The air mass in Cluster 2 originating from Uzbekistan and passing through the arid regions of Tajikistan, Kyrgyzstan, and Kazakhstan accounted for 34.3% of the total trajectories. In winter, the proportion of short-range trajectories originating from the Tianshan Mountains west of the sampling point continued to increase, accounting for 56.7% of the total trajectories. The number of trajectories in Cluster 2 originating from the arid regions of Kazakhstan accounted for 25.0%, of which the trajectories from the Caspian Sea accounted for 18.3%, passing through the arid regions of Uzbekistan, Kazakhstan and Kyrgyzstan, arrived at the sampling point from west.
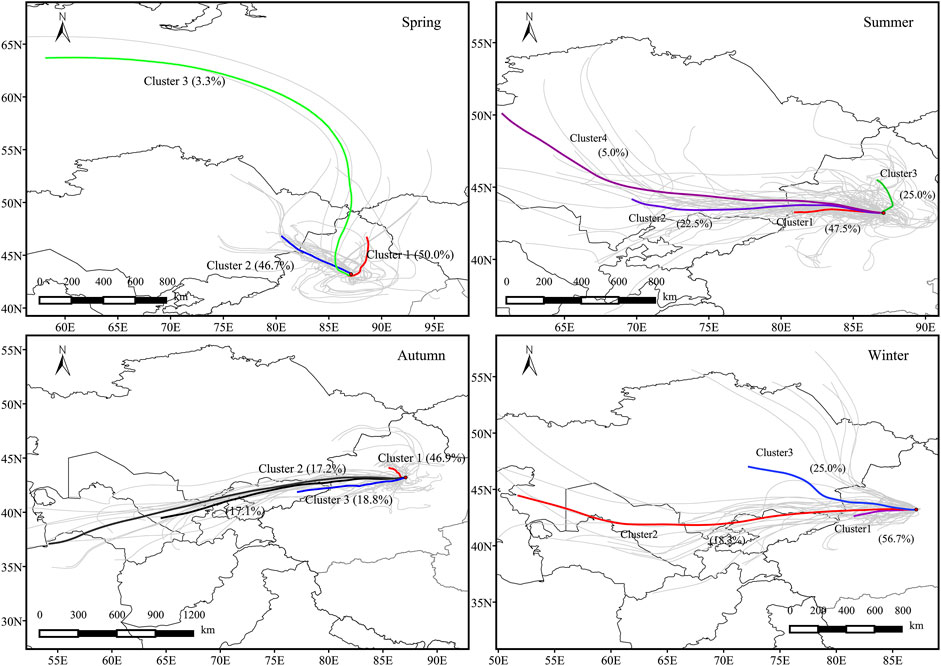
FIGURE 7. the average 72-h backward trajectories of each trajectory cluster: spring, summer, autumn and winter. The number in parentheses indicates the percentage allocated to the cluster.
Overall, the air masses from northwest and west were the main factors that affected the air quality in the source area of Urumqi River. The area was mainly influenced by the short-distance trajectories in the arid regions surrounding the Tianshan Mountains and anthropogenic pollution in the surrounding urban areas (such as Urumqi). In spring, the air masses mainly came from the Gurbantunggut Desert and the urban of Urumqi, bringing more desert dust particles and anthropogenic pollution. The air masses in autumn mainly derived from the Gurbantungut Desert, passing through Shihezi City and other areas, which may cause a certain degree of dust particles and human pollution input. The air masses in summer and winter mainly originated from the Tianshan area west of the sampling site, which was relatively clean. During this period, the research area was also affected by the long-distance transmission from Central Asia, especially in autumn. A large number of fossil fuels and biomass combustion emissions in Central Asia could affect the aerosol concentration in the source area of Urumqi River in the short term through long-distance transmission (Zhang et al., 2019).
The PSCF results are shown in Figure 8. These are the spatial distributions of potential aerosol sources combined with backward trajectories and mass concentrations. The potential source regions with high PSCF values in spring were distributed in the Gurbantunggut Desert, the urban area of Urumqi, and some places in the arid regions of Kazakhstan, which showing no difference with the cluster analysis results of the backward trajectories. The potential sources of atmospheric aerosols in summer and autumn were mainly distributed in the Tianshan area west of the sampling site. However, the mass distributions of aerosols were different. In summer, it mainly concentrated around the sampling points. In autumn, it mainly focused on the vicinity of the sampling site, the Gurbantunggut Desert and Shihezi City. In winter, most of the potential source regions with high PSCF values were located in the surrounding areas of the TGS.
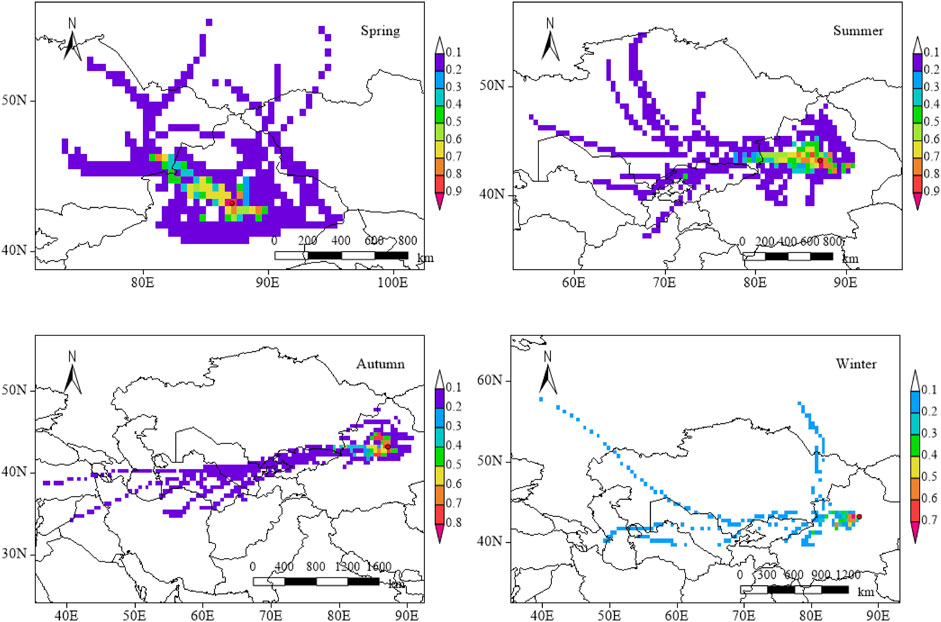
FIGURE 8. Spatial distributions of PSCF values of TSPs: spring, summer, autumn and winter.
In conclusion, local sources significantly contributed to aerosols. Additionally, the long-range transportation in some western regions, including some parts of Central Asia and Siberia, was also one of the sources of aerosols.
For the first time, the chemical composition (OC, EC, and WSIIs) and source analysis of the total suspended particles in the source area of Urumqi River were carried out in spring, summer, autumn and winter (from September 2019 to August 2020). The concentrations of TSPs were higher in autumn, with an average of 356.2 μg m −3 (range: 60.1–795.9 μg m −3), which was close to some urban areas, indicating that the research area was subject to a certain degree of anthropogenic pollution.
The concentrations of OC, EC, Cl−, NO3−, SO42−, NH4+, K+, and Ca2+ were all highest in autumn, whereas Na+ and Mg2+ were higher in spring. OC and EC had a relatively good correlation in each season (except winter), indicating that the two sources were similar. The ratios of SOC/OC were higher in winter and summer, illustrating that the second organic reaction was frequent during this period. Comparing the OC/EC and K+/EC values in aerosols of biomass burning and fossil fuels burning, the concentrations of carbonaceous component in aerosol samples were mainly affected by fossil fuels burning. The ratio of NO3−/SO42− was less than 1.0 in each season, showing that the pollutions from stationary sources were more serious than automobile exhaust. Throughout the four seasons, the equivalent ratios of Ca2+/(NO3−+SO42−) and NH4+/(NO3−+SO42−) illustrated that CaCO3 and Ca (HCO3)2 were sufficient to neutralize NO3− and SO42−. Factor analysis was used to analyze the source of each component in the sample. Na+, Mg2+ and Ca2+ originated from nature sources, such as rock salt, sand dust, etc. OC4, OP, EC1, and NO3− mainly originated from anthropogenic sources, such as biomass combustion, coal combustion, automobile exhaust emissions, etc. According to HYSPLIT and PSCF results, the air masses from northwest and west were the main factors that affected the air quality in the source area of Urumqi River. But the potential sources areas of particulate matter were mainly distributed in local areas. Therefore, local anthropogenic pollution control strategies should be implemented to reduce the concentrations of TSPs in the source area of Urumqi River.
The original contributions presented in the study are included in the article/Supplementary Material, further inquiries can be directed to the corresponding author.
CZ: Visualization, Writing - original draft. ZL: Validation, Supervision. XZ: Methodology, Software, Formal analysis. HJ: Formal analysis. XZ: Formal analysis.
This work was supported by the Second Tibetan Plateau Scientific Expedition and Research (2019QZKK0201), the Strategic Priority Research Program of the Chinese Academy of Sciences (Class A) (XDA20060201; XDA20020102), the National Natural Science Foundation of China (41,761,134,093; 41,471,058) and the SKLCS founding (SKLCS-ZZ-2021).
The authors declare that the research was conducted in the absence of any commercial or financial relationships that could be construed as a potential conflict of interest.
All claims expressed in this article are solely those of the authors and do not necessarily represent those of their affiliated organizations, or those of the publisher, the editors and the reviewers. Any product that may be evaluated in this article, or claim that may be made by its manufacturer, is not guaranteed or endorsed by the publisher.
We would like to thank Yinghui Ma for the sampling, and YuMan Zhu, QiuFang Bao, and Xiaoxiang Wang for the chemical analyses.
Aizen, V. B., Kuzmichenok, V. A., Surazakov, A. B., and Aizen, E. M. (2007). Glacier Changes in the Tien Shan as Determined from Topographic and Remotely Sensed Data. Glob. Planet. Change 56 (3–4), 328–340. doi:10.1016/j.gloplacha.2006.07.016
Arimoto, R., Duce, R. A., Savoie, D. L., Prospero, J. M., Talbot, R., Cullen, J. D., et al. (1996). Relationships Among Aerosol Constituents from Asia and the North Pacific during PEM-West A. J. Geophys. Res. 101, 2011–2023. doi:10.1029/95jd01071
Bond, T. C., Doherty, S. J., Fahey, D. W., Forster, P. M., Berntsen, T., DeAngelo, B. J., et al. (2013). Bounding the Role of Black Carbon in the Climate System: A Scientific Assessment. J. Geophys. Res. Atmos. 118, 5380–5552. doi:10.1002/jgrd.50171
Callén, M. S., De La Cruz, M. T., López, J. M., Navarro, M. V., and Mastral, A. M. (2009). Comparison of Receptor Models for Source Apportionment of the PM10 in Zaragoza (Spain). Chemosphere 76 (8), 1120–1129. doi:10.1016/j.chemosphere.2009.04.015
Cao, J.-J., Xu, B.-Q., He, J.-Q., Liu, X.-Q., Han, Y.-M., Wang, G.-h., et al. (2009). Concentrations, Seasonal Variations, and Transport of Carbonaceous Aerosols at a Remote Mountainous Region in Western China. Atmos. Environ. 43, 4444–4452. doi:10.1016/j.atmosenv.2009.06.023
Cao, J. J., Wu, F., Chow, J. C., Lee, S. C., Li, Y., Chen, S. W., et al. (2005). Characterization and Source Apportionment of Atmospheric Organic and Elemental Carbon during Fall and Winter of 2003 in Xi'an, China. Atmos. Chem. Phys. 5, 3127–3137. doi:10.5194/acp-5-3127-2005
Cao, J., Lee, S. C., Ho, K. F., Zhang, X. Y., Zou, S. C., Fung, K., et al. (2003). Characteristics of Carbonaceous Aerosol in Pearl River Delta Region, China during 2001 Winter Period. Atmos. Environ. 37 (11), 1451–1460. doi:10.1016/s1352-2310(02)01002-6
Chow, J. C., Watson, J. G., Crow, D., Lowenthal, D. H., and Merrifield, T. (2001). Comparison of IMPROVE and NIOSH Carbon Measurements. Aerosol Sci. Technol. 34, 23–34. doi:10.1080/02786820119073
Chuang, H.-C., Sun, J., Ni, H., Tian, J., Lui, K. H., Han, Y., et al. (2019). Characterization of the Chemical Components and Bioreactivity of Fine Particulate Matter Produced during Crop-Residue Burning in China. Environ. Pollut. 245, 226–234. doi:10.1016/j.envpol.2018.10.119
Clase, M., and Gysels, K. (1998). IUPAC Series on Analytical and Physical Chemistry of Environmental Systems. New York: Wiley, 141–145.
Cong, Z., Kang, S., Kawamura, K., Liu, B., Wan, X., Wang, Z., et al. (2015). Carbonaceous Aerosols on the South Edge of the Tibetan Plateau: Concentrations, Seasonality and Sources. Atmos. Chem. Phys. 15, 1573–1584. doi:10.5194/acp-15-1573-2015
Draxler, R. R., and Rolph, G. D. (2013). HYSPLIT (Hybrid Single-Particle Lagrangian Integrated Trajectory) Model Access via NOAA ARL READY. Silver Spring, MD: NOAA Air Resources Laboratory.
Feng, J., Hu, J., Xu, B., Hu, X., Sun, P., Han, W., et al. (2015). Characteristics and Seasonal Variation of Organic Matter in PM2.5 at a Regional Background Site of the Yangtze River Delta Region, China. Atmos. Environ. 123, 288–297. doi:10.1016/j.atmosenv.2015.08.019
Huang, H., Ho, K. F., Lee, S. C., Tsang, P. K., Ho, S. S. H., Zou, C. W., et al. (2012). Characteristics of Carbonaceous Aerosol in PM2.5: Pearl Delta River Region, China. Atmos. Res. 104-105, 227–236. doi:10.1016/j.atmosres.2011.10.016
IPCC (2013). Climate Change 2013: The Physical Science Basis. Contribution of Working Group I to the Fifth Assessment Report of the Intergovernmental Panel on Climate Change. Cambridge: Cambridge University Press.
Jia, C., Mao, X., Huang, T., Liang, X., Wang, Y., Shen, Y., et al. (2016). Non-methane Hydrocarbons (NMHCs) and Their Contribution to Ozone Formation Potential in a Petrochemical Industrialized City, Northwest China. Atmos. Res. 169, 225–236. doi:10.1016/j.atmosres.2015.10.006
Jiang, N., Li, Q., Su, F., Wang, Q., Yu, X., Kang, P., et al. (2018). Chemical Characteristics and Source Apportionment of PM 2.5 between Heavily Polluted Days and Other Days in Zhengzhou, China. J. Environ. Sci. 66, 188–198. doi:10.1016/j.jes.2017.05.006
Li, H., Wang, Q. g., Yang, M., Li, F., Wang, J., Sun, Y., et al. (2016). Chemical Characterization and Source Apportionment of PM2.5 Aerosols in a Megacity of Southeast China. Atmos. Res. 181, 288–299. doi:10.1016/j.atmosres.2016.07.005
Li, Z., Zhao, S., Edwards, R., Wang, W., and Zhou, P. (2011). Characteristics of Individual Aerosol Particles over Ürümqi Glacier No. 1 in Eastern Tianshan, Central Asia, China. Atmos. Res. 99 (1), 57–66. doi:10.1016/j.atmosres.2010.09.001
Liu, B., Cong, Z., Wang, Y., Xin, J., Wan, X., Pan, Y., et al. (2017). Background Aerosol over the Himalayas and Tibetan Plateau: Observed Characteristics of Aerosol Mass Loading. Atmos. Chem. Phys. 17, 449–463. doi:10.5194/acp-17-449-2017
Meng, C. C., Wang, L. T., Zhang, F. F., Wei, Z., Ma, S. M., Ma, X., et al. (2016). Characteristics of Concentrations and Water-Soluble Inorganic Ions in PM2.5 in Handan City, Hebei Province, China. Atmos. Res. 171, 133–146. doi:10.1016/j.atmosres.2015.12.013
Ming, J., Zhang, D., Kang, S., and Tian, W. (2007). Aerosol and Fresh Snow Chemistry in the East Rongbuk Glacier on the Northern Slope of Mt. Qomolangma. J. Geophys. Res. 112 (15), D15307. doi:10.1029/2007jd008618
Niu, Z., Zhang, F., Chen, J., Yin, L., Wang, S., and Xu, L. (2013). Carbonaceous Species in PM2.5 in the Coastal Urban Agglomeration in the Western Taiwan Strait Region, China. Atmos. Res. 122, 102–110. doi:10.1016/j.atmosres.2012.11.002
Sun, J., Qin, D., Mayewski, P. A., Dibb, J. E., Whitlow, S., Li, Z., et al. (1998). Soluble Species in Aerosol and Snow and Their Relationship at Glacier 1, Tien Shan, China. J. Geophys. Res. 103 (D21), 28021–28028. doi:10.1029/98jd01802
Tan, J., Zhang, L., Zhou, X., Duan, J., Li, Y., Hu, J., et al. (2017). Chemical Characteristics and Source Apportionment of PM 2.5 in Lanzhou, China. Sci. Total Environ. 601-602, 1743–1752. doi:10.1016/j.scitotenv.2017.06.050
Tao, J., Zhang, L., Zhang, R., Wu, Y., Zhang, Z., Zhang, X., et al. (2016). Uncertainty Assessment of Source Attribution of PM2.5 and its Water-Soluble Organic Carbon Content Using Different Biomass Burning Tracers in Positive Matrix Factorization Analysis - a Case Study in Beijing, China. Sci. Total Environ. 543, 326–335. doi:10.1016/j.scitotenv.2015.11.057
Tripathee, L., Kang, S., Rupakheti, D., Cong, Z., Qianggong, Z., and Jie, H. (2017). Chemical Characteristics of Soluble Aerosols over the Central Himalayas: Insights into Spatiotemporal Variations and Sources. Environ. Sci. Pollut. Res. 24, 24454–24472. doi:10.1007/s11356-017-0077-0
Trivedi, D. K., Ali, K., and Beig, G. (2014). Impact of Meteorological Parameters on the Development of Fine and Coarse Particles over Delhi. Sci. Total Environ. 478, 175–183. doi:10.1016/j.scitotenv.2014.01.101
Turap, Y., Rekefu, S., Wang, G., Talifu, D., Gao, B., Aierken, T., et al. (2019). Chemical Characteristics and Source Apportionment of PM2.5 during Winter in the Southern Part of Urumqi, China. Aerosol Air Qual. Res. 19, 1325–1337. doi:10.4209/aaqr.2018.12.0454
Turpin, B. J., Cary, R. A., and Huntzicker, J. J. (1990). An In Situ, Time-Resolved Analyzer for Aerosol Organic and Elemental Carbon. Aerosol Sci. Technol. 12, 161–171. doi:10.1080/02786829008959336
Wan, X., Kang, S., Xin, J., Liu, B., Wen, T., Wang, P., et al. (2016). Chemical Composition of Size-Segregated Aerosols in Lhasa City, Tibetan Plateau. Atmos. Res. 174-175, 142–150. doi:10.1016/j.atmosres.2016.02.005
Wang, F., Sun, Y., Tao, Y., Guo, Y., Li, Z., Zhao, X., et al. (2019). Pollution Characteristics in a Dusty Season Based on Highly Time-Resolved Online Measurements in Northwest China. Sci. Total Environ. 650, 2545–2558. doi:10.1016/j.scitotenv.2018.09.382
Wang, H., Tian, M., Chen, Y., Shi, G., Liu, Y., Yang, F., et al. (2018). Seasonal Characteristics, Formation Mechanisms and Source Origins of PM<sub>2.5</sub> in Two Megacities in Sichuan Basin, China. Atmos. Chem. Phys. 18, 865–881. doi:10.5194/acp-18-865-2018
Wang, M., Xu, B., Wang, N., Cao, J., Tie, X., Wang, H., et al. (2016a). Two Distinct Patterns of Seasonal Variation of Airborne Black Carbon over Tibetan Plateau. Sci. Total Environ. 573, 1041–1052. doi:10.1016/j.scitotenv.2016.08.184
Wang, Y., Jia, C., Tao, J., Zhang, L., Liang, X., Ma, J., et al. (2016b). Chemical Characterization and Source Apportionment of PM2.5 in a Semi-arid and Petrochemical-Industrialized City, Northwest China. Sci. Total Environ. 573, 1031–1040. doi:10.1016/j.scitotenv.2016.08.179
Wang, Y. Q., Zhang, X. Y., and Draxler, R. R. (2009). TrajStat: GIS-Based Software that Uses Various Trajectory Statistical Analysis Methods to Identify Potential Sources from Long-Term Air Pollution Measurement Data. Environ. Model. Softw. 24, 938–939. doi:10.1016/j.envsoft.2009.01.004
Wang, Y., Zhuang, G., Tang, A., Yuan, H., Sun, Y., Chen, S., et al. (2005). The Ion Chemistry and the Source of PM2.5 Aerosol in Beijing. Atmos. Environ. 39, 3771–3784. doi:10.1016/j.atmosenv.2005.03.013
Xie, Y., Lu, H., Yi, A., Zhang, Z., Zheng, N., Fang, X., et al. (2020). Characterization and Source Analysis of Water-Soluble Ions in PM2.5 at a Background Site in Central China. Atmos. Res. 239, 104881. doi:10.1016/j.atmosres.2020.104881
Xiong, Y., Zhou, J., Schauer, J. J., Yu, W., and Hu, Y. (2017). Seasonal and Spatial Differences in Source Contributions to PM2.5 in Wuhan, China. Sci. Total Environ. 577, 155–165. doi:10.1016/j.scitotenv.2016.10.150
Xu, C., Li, Z., Li, H., Wang, F., and Zhou, P. (2019). Long-range Terrestrial Laser Scanning Measurements of Annual and Intra-annual Mass Balances for Urumqi Glacier No. 1, Eastern Tien Shan, China. Cryosphere 13, 2361–2383. doi:10.5194/tc-13-2361-2019
Xu, J.-S., Xu, M.-X., Snape, C., He, J., Behera, S. N., Xu, H.-H., et al. (2017). Temporal and Spatial Variation in Major Ion Chemistry and Source Identification of Secondary Inorganic Aerosols in Northern Zhejiang Province, China. Chemosphere 179, 316–330. doi:10.1016/j.chemosphere.2017.03.119
Yao, L., Yang, L., Yuan, Q., Yan, C., Dong, C., Meng, C., et al. (2016). Sources Apportionment of PM 2.5 in a Background Site in the North China Plain. Sci. Total Environ. 541, 590–598. doi:10.1016/j.scitotenv.2015.09.123
Ye, Z., Liu, J., Gu, A., Feng, F., Liu, Y., Bi, C., et al. (2017). Chemical Characterization of Fine Particulate Matter in Changzhou, China, and Source Apportionment with Offline Aerosol Mass Spectrometry. Atmos. Chem. Phys. 17, 2573–2592. doi:10.5194/acp-17-2573-2017
Zhang, F., Wang, Z.-w., Cheng, H.-r., Lv, X.-p., Gong, W., Wang, X.-m., et al. (2015a). Seasonal Variations and Chemical Characteristics of PM2.5 in Wuhan, Central China. Sci. Total Environ. 518-519, 97–105. doi:10.1016/j.scitotenv.2015.02.054
Zhang, J., Tong, L., Huang, Z., Zhang, H., He, M., Dai, X., et al. (2018a). Seasonal Variation and Size Distributions of Water-Soluble Inorganic Ions and Carbonaceous Aerosols at a Coastal Site in Ningbo, China. Sci. Total Environ. 639, 793–803. doi:10.1016/j.scitotenv.2018.05.183
Zhang, N. N., Cao, J. J., and Ho, K. F. (2012a). Chemical Characterization of Aerosol Collected at Mt. Yulong in Wintertime on the Southeastern Tibetan Plateau. Atmos. Res. 107, 76–85. doi:10.1016/j.atmosres.2011.12.012
Zhang, N., Cao, J., Liu, S., Zhao, Z., Xu, H., and Xiao, S. (2014a). Chemical Composition and Sources of PM2.5 and TSP Collected at Qinghai Lake during Summertime. Atmos. Res. 138, 213–222. doi:10.1016/j.atmosres.2013.11.016
Zhang, Q., Shen, Z., Cao, J., Zhang, R., Zhang, L., Huang, R.-J., et al. (2015b). Variations in PM2.5, TSP, BC, and Trace Gases (NO2, SO2, and O3) between Haze and Non-haze Episodes in Winter over Xi'an, China. Atmos. Environ. 112, 64–71. doi:10.1016/j.atmosenv.2015.04.033
Zhang, R., Jing, J., Tao, J., Hsu, S.-C., Wang, G., Cao, J., et al. (2013). Chemical Characterization and Source Apportionment of PM<sub>2.5</sub> in Beijing: Seasonal Perspective. Atmos. Chem. Phys. 13, 7053–7074. doi:10.5194/acp-13-7053-2013
Zhang, T., Cao, J. J., Tie, X. X., Shen, Z. X., Liu, S. X., Ding, H., et al. (2011). Water-soluble Ions in Atmospheric Aerosols Measured in Xi'an, China: Seasonal Variations and Sources. Atmos. Res. 102, 110–119. doi:10.1016/j.atmosres.2011.06.014
Zhang, X., Li, Z. Q., Ming, J., and Wang, F. T. (2019). Characteristics of Black Carbon Aerosol and Source Apportionment at the Headwater of Urumqi River. Acta Sientiae Circumstantiae (in Chin. 39 (1), 212–221. doi:10.13671/j.hjkxxb.2018.0354
Zhang, X., Li, Z., Zhou, P., and Wang, S. J. (2016a). Characteristics and Source of Aerosols at Shiyi Glacier, Qilian Mountains, China. Sci. Cold Arid Regions 8 (2), 0135–0146. doi:10.3724/SP.J.1226.2016.00135
Zhang, X. Y., Li, Z. Q., Wang, F. T., and Wang, S. J. (2012b). Chemistry and Environmental Significance of Snow on Glacier No. 72, Mt. Tumur, Tianshan Mountains, Central Asia. Sci. Geogr. Scinica 32 (5), 636–641.
Zhang, X. Y., Wang, S. J., Zhang, X., and Wang, S. J. (2017). Chemistry and Environmental Significance of Aerosols Collected in the Eastern Tianshan. Sci. Cold Arid Regions 9 (5), 455–466. doi:10.3724/SP.J.1226.2017.00455
Zhang, X., Chen, X., Guo, Y., Wang, Z., Liu, L., Paul, C., et al. (2014b). Ambient TSP Concentration and Dustfall Variation in Urumqi, China. J. Arid. Land 6 (6), 668–677. doi:10.1007/s40333-014-0069-6
Zhang, X. Y., Wang, Y. Q., Niu, T., Zhang, X. C., Gong, S. L., Zhang, Y. M., et al. (2012c). Atmospheric Aerosol Compositions in China: Spatial/temporal Variability, Chemical Signature, Regional Haze Distribution and Comparisons with Global Aerosols. Atmos. Chem. Phys. 12, 779–799. doi:10.5194/acp-12-779-2012
Zhang, Y., Huang, W., Cai, T., Fang, D., Wang, Y., Song, J., et al. (2016b). Concentrations and Chemical Compositions of Fine Particles (PM2.5) during Haze and Non-haze Days in Beijing. Atmos. Res. 174-175, 62–69. doi:10.1016/j.atmosres.2016.02.003
Zhang, Y., Lang, J., Cheng, S., Li, S., Zhou, Y., Chen, D., et al. (2018b). Chemical Composition and Sources of PM1 and PM2.5 in Beijing in Autumn. Sci. Total Environ. 630, 72–82. doi:10.1016/j.scitotenv.2018.02.151
Zhao, M., Huang, Z., Qiao, T., Zhang, Y., Xiu, G., and Yu, J. (2015). Chemical Characterization, the Transport Pathways and Potential Sources of PM2.5 in Shanghai: Seasonal Variations. Atmos. Res. 158-159, 66–78. doi:10.1016/j.atmosres.2015.02.003
Zhao, S., Li, Z., and Zhou, P. (2011). Ion Chemistry and Individual Particle Analysis of Atmospheric Aerosols over Mt. Bogda of Eastern Tianshan Mountains, Central Asia. Environ. Monit. Assess. 180, 409–426. doi:10.1007/s10661-010-1796-6
Zhao, S., Ming, J., Xiao, C., Sun, W., and Qin, X. (2012). A Preliminary Study on Measurements of Black Carbon in the Atmosphere of Northwest Qilian Shan. J. Environ. Sci. 24, 152–159. doi:10.1016/s1001-0742(11)60739-0
Zhao, Z., and Li, Z. (2004). Determination of Soluble Ions in Atmospheric Aerosol by Ion Chromatography. Mod. Sci. Instrum. 5, 46–49.
Zhao, Z. Z., Cao, J. J., Shen, Z. X., Xu, B. Q., Zhu, C. S., Antony Chen, L. W., et al. (2013). Aerosol Particles at a High-Altitude Site on the Southeast Tibetan Plateau, China: Implications for Pollution Transport from South Asia. J. Geophys. Research-Atmospheres 118 (11), 11360–11375. doi:10.1002/jgrd.50599
Keywords: organic and elemental carbon, water-soluble inorganic ions, seasonal variation, backward trajectory, potential source contribution function (PSCF)
Citation: Zheng C, Li Z, Zhang X, Jiang H and Zhou X (2022) Seasonal Variation in Chemical Composition of Total Suspended Particles During the COVID-19 Pandemic in the Source Area of Urumqi River, Tianshan, China. Front. Earth Sci. 10:859203. doi: 10.3389/feart.2022.859203
Received: 24 January 2022; Accepted: 13 April 2022;
Published: 02 May 2022.
Edited by:
Ravi Bhushan, Physical Research Laboratory, IndiaReviewed by:
Srinivas Bikkina, Council of Scientific and Industrial Research (CSIR), IndiaCopyright © 2022 Zheng, Li, Zhang, Jiang and Zhou. This is an open-access article distributed under the terms of the Creative Commons Attribution License (CC BY). The use, distribution or reproduction in other forums is permitted, provided the original author(s) and the copyright owner(s) are credited and that the original publication in this journal is cited, in accordance with accepted academic practice. No use, distribution or reproduction is permitted which does not comply with these terms.
*Correspondence: Zhongqin Li, lizq@lzb.ac.cn
Disclaimer: All claims expressed in this article are solely those of the authors and do not necessarily represent those of their affiliated organizations, or those of the publisher, the editors and the reviewers. Any product that may be evaluated in this article or claim that may be made by its manufacturer is not guaranteed or endorsed by the publisher.
Research integrity at Frontiers
Learn more about the work of our research integrity team to safeguard the quality of each article we publish.