 Yiqiu Yu1,2
 Yihe Fang
 Zhiqiang Gong
- 1Regional Climate Center of Shenyang, Shenyang, China
- 2Key Opening Laboratory for Northeast China Cold Vortex Research, China Meteorological Administration, Shenyang, China
- 3Liaoning Provincial Meteorological Service Center, Shenyang, China
- 4Laboratory for Climate Studies, National Climate Research Center, China Meteorological Administration, Beijing, China
- 5College of Physics and Electronic Engineering, Changshu Institute of Technology, Suzhou, China
- 6Shenyang Central Meteorological Observatory, Shenyang, China
In this study, the northward-moving tropical cyclones (TCs) that influence Northeast China (NEC) in July–September are identified based on the distance between the TC center and the boundaries of NEC. Then, based on a machine learning algorithm named hierarchical agglomerative clustering, the tracks of northward-moving TCs that influence NEC are classified into the eastern-track type and the turning type. In NEC, the precipitation induced by eastern-track type TCs gradually decreases from east to west, and the precipitation induced by turning-type TCs gradually decreases from south to north. For eastern-track type TCs, negative Niño3 sea surface temperature (SST) anomalies in preceding January–March can induce cyclonic circulation anomalies and positive vorticity anomalies over the Philippine Sea during subsequent July–September, which favors the genesis of TCs. Moreover, the westerly anomaly in the subtropical western north Pacific and the strengthening of cyclonic steering flow over the Philippines jointly steer the TCs to move northward along the northerly airflow on the west of the western Pacific subtropical high, which favors the genesis of eastern-track type TCs. For turning-type TCs, the positive SST anomalies in the West Wind Drift area during preceding May–July cause positive vorticity anomalies from the northern Philippines to Taiwan from July to September. The cyclonic steering flow over the Philippines and the anticyclonic steering flow over the Sea of Japan lead the TCs to move northwestwards and then turn to northeast, which is conducive to the genesis of turning type northward-moving TCs. Finally, the results of numerical experiments have confirmed these findings.
1 Introduction
China is severely affected by typhoons, and suffers substantial economic losses and great casualties from typhoons every year. In recent years, northward-moving typhoons have significantly influenced the precipitation in Northeast China (NEC) during the flood season, which may even result in severe flooding. In the summer of 2020, NEC was hit by three strong northward-moving tropical cyclones (TCs) successively. Frequent northward-moving TCs have attracted considerable attention. Previous studies have mainly analyzed intermonthly characteristics, interannual and interdecadal variations, climate incidents and oscillation period of the TCs influencing northern China. The TCs influencing northern China exhibit remarkable intermonthly and interannual variations. The main TC season in northern China is from July to September (Wang and Liang, 2006). The TCs affecting the Liaodong Peninsula from different source regions have different impacts and disaster distributions (Liang and Chen, 2005). The landing northward-moving and turning TCs are able to bring heavy rainstorm and gale (Zhou et al., 2007; Gao Q. Q. et al., 2017). The position and intensity of the western Pacific subtropical high (WPSH), the middle-latitude westerlies and the South Asian high have an important influence on TC’s northward movement (Jin et al., 2006). The influence of northward-moving TCs on NEC can vary significantly with the TC tracks (Gao S. Y. et al., 2017). Therefore, only considering the overall TC intensity or frequency is insufficient for predicting the weather and climate in NEC. It is necessary to classify the northward-moving TCs objectively. Many studies have tried to classify the tracks of TCs and northeast cold vortices. For example, following Nakamura et al. (2009), Zheng et al. (2013) and Peng et al. (2019) used K-means clustering algorithm to classify TC tracks in the western north Pacific based on the location, intensity, track length and moving direction of TCs. Wang et al. (2019) and Fang et al. (2020) also used K-means clustering algorithm to classify the tracks of Madden-Julian Oscillation (MJO) and the northeast cold vortex.
Sea surface temperature (SST) and its distribution can significantly influence the genesis and development of TCs (Huang et al., 2005; Yamasaki, 2007). Air-sea interactions can alter the distribution of atmospheric circulation (Wang et al., 1999; Huang et al., 2011), and then result in the changes of TC tracks (Cheung and Chan, 2010). Therefore, such interactions are the fundamental for TC development. Seasonal-scale movement of TCs is regulated mainly by the large-scale and slowly-moving background fields. El Niño-Southern Oscillation (ENSO) events are the most significant interannual variation signals occurring in tropical oceans, and their relationship with TCs in the western north Pacific has been studied extensively (Zuki and Lupo, 2008; Guo and Tan, 2021). The changes of large-scale circulations in tropical regions caused by ENSO events can be used to explain the relationships between TCs and ENSO, such as the Walker circulation and the western north Pacific monsoon trough (Chen and Huang, 2006a; Feng et al., 2013).
In El Niño years, the western north Pacific monsoon trough deepens towards the east, and TCs are generated in the southeastern areas of the western north Pacific. In La Niña years, the monsoon trough is shallow, and the location of TC genesis is more northwesterly (Chen et al., 1998; Wang and Chan, 2002; Huang and Xu, 2009; Tao and Cheng, 2012). However, the effect of ENSO on the frequency of TCs generated has not reached an agreement by researchers. Some scholars pointed out that the total frequency of TCs generated in an El Niño year is smaller than the climatic mean (Wu and Lau, 1992; Chan, 2000). But some other studies showed that there are no substantial correlations between the frequency of TC and the ENSO index (Lander, 1994; Chen et al., 2006). At present, the influence of central Pacific El Niño events on TCs has become a hot topic. Previous studies have indicated that the TC activities during a central Pacific El Niño year are more westward and extend to the northwest part of the western north Pacific, which could affect the coastal areas of East Asia (Kim et al., 2011; Ha et al., 2012). The western Pacific warm pool can also influence TC activity. Specifically, the warm pool is correlated with the onset of the South China Sea summer monsoon and the variation of the WPSH through the East Asia-Pacific (EAP) teleconnection, influencing the TC activities in the western north Pacific. In addition, the western Pacific warm pool influences the genesis and movement of TCs in the western north Pacific through the monsoon trough (Chen and Huang, 2006b; Huang and Chen, 2007; Huang and Wang, 2010; Huang et al., 2016). Moreover, the tropical Atlantic SST anomalies can also regulate the atmospheric circulation over the western north Pacific, affecting TC activities (Huo et al., 2016; Yu et al., 2016). In contrast, the warming of the Indian Ocean Basin negatively correlates with the frequency of TC genesis in the western north Pacific. The Indian SST anomaly can remotely influence the low-level anticyclone circulation anomaly and strengthen the vertical wind shear, resulting in fewer TCs over the western North Pacific (Zhan et al., 2011a, 2011b, 2012; Ha et al., 2015).
The TC activity in the North Indian Ocean is found to correlate well with the Indian Ocean dipole-like SST anomaly. The adjustment of atmospheric circulation caused by such anomaly can influence the genesis environment and movement of TCs (Yuan and Cao, 2013). Related studies were conducted to study the genesis, development and movement of TCs, and provided substantial theoretical support for governmental decision-making in disaster prevention and mitigation plans.
However, relatively few studies have analyzed the different types of northward-moving TCs that affect NEC, Although classifying TC tracks can benefit the prediction of TC track. To this end, this study uses geographic information technology to isolate the northward-moving TCs that affect NEC. Then, based on the precipitation data during the TC influence period, the rationality of the derived TC data is verified. Furthermore, the machine learning method (hierarchical agglomerative clustering) is used to classify the tracks of northward-moving TCs objectively. Then, the influence mechanisms of precedent SST on the tracks of northward-moving TCs are investigated from an air-sea interaction perspective. It is expected to provide an important reference for the refined diagnosis, forecasting and scientific research of northward-moving TCs.
The remainder of this paper is organized as follows. Section 2 introduces the data and method used in this study. The variation characteristics of two types of northward-moving TCs that affect NEC are detailedly presented in Section 3. The relationships between the two types of TCs and SST are analyzed in Section 4. Section 5 discusses the effects of Pacific SST on the two types of northward-moving TCs. In Section 6, we conduct some sensitivity experiments and try to explore the influence of SST on atmospheric circulations. Section 7 presents the discussions and conclusions.
2 Data and Method
2.1 Observation Data and Statistical Method
The best track dataset of TCs from 1949 to 2019 in the western north Pacific is provided by the Shanghai Typhoon Research Institute of China Meteorological Administration (CMA; Ying et al., 2014; Lu et al., 2021). The daily precipitation data in northeastern China from 1951 to 2019 is obtained from the National Meteorology Information Center of CMA. The monthly SST data from 1951 to 2019 with a horizontal resolution of 1° × 1° are provided by the United Kingdom Met Office Hadley Center (Rayner et al., 2003). The daily and monthly reanalysis data between 1951 and 2019 are obtained from the National Centers for Environmental Prediction (NCEP)/National Center for Atmospheric Research (NCAR; Kalnay et al., 1996) of the United States National Oceanic and Atmospheric administration (NOAA), with a horizontal resolution of 2.5° × 2.5° and 17 vertical layers. The Niño3 index and the West Wind Drift index are provided by the National Climate Center of CMA.
To analyze the reasons for the anomaly of northward-moving TCs, some statistical methods are used, including composite analysis, regression analysis and partial correlation analysis. The peak season of TC activities is defined as July–September in this study. The pressure-weighted mean airflow method is used to calculate the steering flow. The pressure-weighted mean airflow between 850 and 300 hPa is considered as the steering flow (Holland, 1993) in this study. The formula is as follows:
where P1 and P2 represent geopotential heights of 850 and 300 hPa, respectively.
2.2 Model Introduction
The NCAR atmospheric circulation model (CAM5.3) is used to run the sensitivity experiments. The atmospheric section of the general Earth model (CESM1.2.2) can be operated independently or coupled with ocean, land surface and other models. The model uses the finite volume dynamical core. The horizontal resolution is 1.9° × 2.5°, with 96 (meridional) × 144 (zonal) grid points. In the vertical direction, a δ-p hybrid coordinate system is adopted, and there are 30 vertical layers.
2.3 Judgement Method for Whether Tropical Cyclones Influence Northeast China
TCs that can influence NEC are identified by using an objective method, which can estimate TC’s influence on NEC based on the range of strong wind and rainfall caused by TC. Relevant studies have shown that, thunderstorms (Molinari et al., 1999), strong winds (Mueller et al., 2006) and severe precipitation (Lonfat et al., 2007) frequently occur within around 200 km from the TC center. This study evaluates the TC influence radius by applying a cartographic python library (Cartopy, developed by the United Kingdom Met Office). With the help of geographic information technology, the buffer zone (i.e., the influence range) is defined as the circular region with a radius of 2° (about 222 km in the Cartesian coordinate system in middle latitudes) centered on the TC center. Then the spatial relationship between the influence range and the NEC boundary is analyzed. Any intersection between the TC influence range and the NEC boundary indicates that the TC process has influenced NEC. After selection, 81 TC processes are considered to have possible influence on NEC between 1949 and 2019. Figure 1 shows the tracks of TCs influencing NEC. Most northward-moving TCs influencing NEC are generated in the tropical western Pacific and the adjacent sea areas, and they first move to the northwest and then moves to the northeast, presenting recurving tracks. The centers of most TCs reach the eastern or southern NEC. But a few TCs travel northeastward along the coastal areas of China instead of landfall. The dissipation locations of most TCs are in southern or eastern NEC, the Korean Peninsula, the Sea of Okhotsk and as far as the Bering Sea. Some of the TCs can deeply reach the inland of China and dissipate on the east side of the Mongolian Plateau.
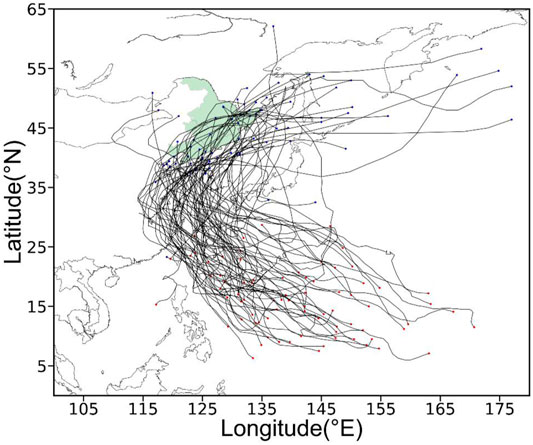
FIGURE 1. The tracks of TCs that can influence Northeast China (NEC) during 1949 and 2019. The red (blue) dots represent the genesis (dissipation) locations of TCs.
2.4 Classification of the Tracks of Northward-Moving Tropical Cyclones Influencing Northeast China
The northward-moving TCs with different types of tracks have different characteristics and influences. Therefore, based on the machine learning method we perform clustering analysis on the tracks of northward-moving TCs, so as to distinguish the differences among the tracks.
2.4.1 Hierarchical Agglomerative Clustering Method
The hierarchical agglomerative clustering method is used in this study because its advantage that the number of clusters is not predetermined. In this study, scattered adjacent clusters are merged from bottom to top. The clustering ends when all samples are merged into the same cluster. The hierarchical agglomerative clustering has several methods for calculating the cluster proximity. In this study, the Ward method which is based on the explained sum of squares (ESS) is applied (Ward, 1963):
where xi is the score of the i-th individual cluster. First, the sum of the original ESS of the whole data is calculated by totaling the individual ESS of all clusters. Second, one of the clusters is selected for merging with another one to calculate the ESS. Then, the ESSs of the merged clusters and remained ones are added to obtain the merged ESS value. The difference between the original ESS and merged ESS is the merge cost. The merged cluster corresponds to the minimum value of the
2.4.2 Selection Scheme for the Tropical Cyclone Characteristic Parameters
The TC track information is presented as several TC characteristic parameters, and then we perform the hierarchical agglomerative clustering on these parameters. Because this study focuses on the TCs that can influence NEC, we narrow the scope by setting the tracks when TCs influencing NEC as the characteristic parameter. The initial location of the TCs influencing NEC is widely distributed in the range of 117°E–134°E and 36.8°N–45°N. The region of TC activities when NEC is influenced is generally in the south of 50°N. In the clustering analysis of TC tracks, the initial location and track characteristics of TCs are considered as the characteristic parameters. The longitude and latitude of the TC center when NEC is firstly influenced by TC are selected as classification parameters for characterizing the initial location of TC. Considering that the TC track when influencing NEC is generally in a southwest-northeast orientation and the meridional span is large, so selecting the average longitude and initial location as the parameters can well cover the information of location and span. Therefore, the average longitude of the TC track when influencing NEC is included in the classification parameters. Before clustering, the characteristic parameters are standardized by the Z-score, and the processed data conform to the standard normal distribution. The conversion function is
where Z is the value after Z-score normalization, μ is the average, and δ is the standard deviation. The Z value indicates the relationship between the data and the average. Z > 0 means that the data is greater than the average.
2.4.3 Classification Results of Northward-Moving Tropical Cyclones
After comprehensively considering the subsequent classification of TC track characteristics and the circulation characteristics, the hierarchical agglomerative clustering is conducted for all TCs influencing NEC according to the cluster number (from two to five). The silhouette coefficients of the clustering results are shown in Figure 2. When the number of clusters is two or three, the silhouette coefficient is obviously greater than that of 4–5 clusters. Further analysis on the classification data shows that, when the number of clusters is 3–5 the number of samples in certain cluster is less than 5, which is too less to be statistically significant. Therefore, considering the silhouette coefficient and sample distribution, the number of clusters is finally set as two. Figure 3 depicts the detailed process of hierarchical agglomerative clustering. Figure 4 illustrates the classification of TC tracks. The first type of TC tracks is relatively easterly and is named as the eastern-track type (Figure 4A). This type of TCs move northward through the East China Sea and the Yellow Sea, and then travel northeastward in the Korean Peninsula and its east. Most TCs of this type do not pass through mainland China, and a few move eastwards out of China after passing through the southeastern NEC. Generally, the tracks of the eastern-track type TCs are relatively straight. Differently, most of the second type of TCs move northwestwards after their genesis, making landfall in the coastal areas between the southeastern NEC and southern NEC. Afterward, they turn northeastwards and pass through the southern and eastern NEC. This type is named as the turning-type (Figure 4B). Most of the turning-type TCs dissipate in the southern NEC or the oceans near the Korean Peninsula, while a few dissipate after moving away from the eastern NEC. Figure 5 shows the frequency of the two types of northward-moving TCs. It is found that the eastern-track type TCs affect mainly parts of the southeastern and eastern NEC. However, the turning-type TCs influence most parts of NEC. Thus, the turning-type TCs should have more substantial effects on NEC. Accordingly, we should pay more attention to the turning-type TCs when studying the influence of TCs on NEC.
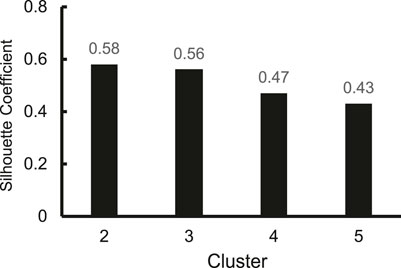
FIGURE 2. Silhouette coefficients of various clustering results.
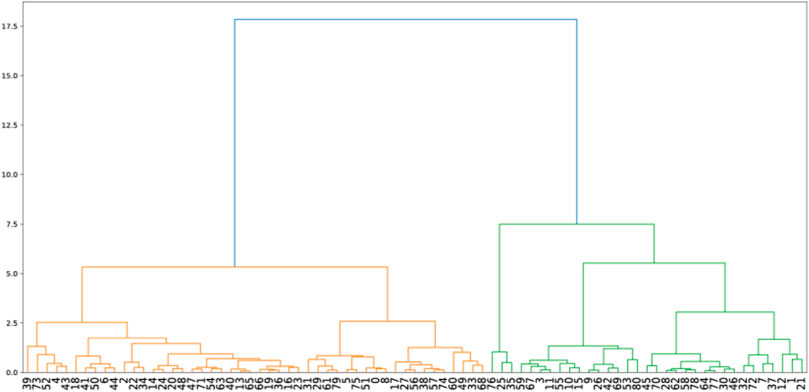
FIGURE 3. Pedigree chart of hierarchical agglomerative clustering. The x-axis represents 81 samples, and the y-axis is the relative distance between the samples. Green and orange lines represent the clustering results obtained by hierarchical agglomerative clustering for the first and second type of TC tracks, respectively.
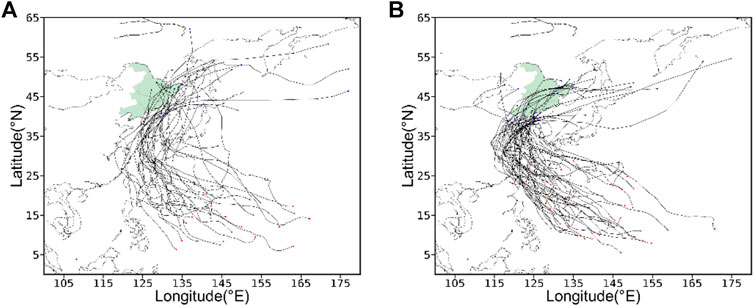
FIGURE 4. Classification of the tracks of TCs influencing NEC. (A) Eastern-track type TCs; (B) turning type TCs. The red (blue) dots represent the genesis (dissipation) locations of TCs.
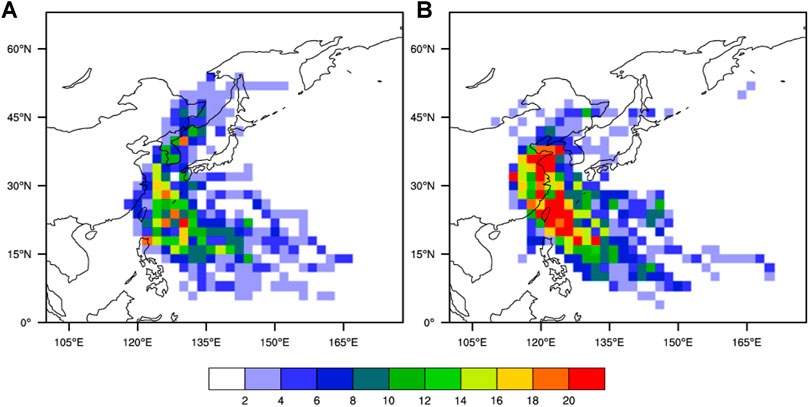
FIGURE 5. TC Track frequencies at 2° × 2° spatial resolution for (A) eastern-track type TCs, and (B) turning type TCs.
3 Variation Characteristics of Northward-Moving Tropical Cyclones Influencing Northeast China
The interannual variations of the number and duration of the two types of TCs are presented in Figure 6. During 1949–2019, 81 northward-moving TCs have influenced NEC in 45 of the total 71 years, and there are 2–4 TCs in 22 years and 1 TC in 23 years. Specifically, 32 of them belong to the eastern–track type and 49 of them belong to the turning-type, accounting for 39.5% and 60.5%, respectively. In particular, the total days when NEC is influenced by the eastern-track type and turning-type TCs are 30 and 54, respectively, with an average of 0.94 and 1.10, respectively. Therefore, the influence period of the turning-type TCs on NEC is longer. Figure 7 shows the average precipitation and precipitation anomaly percentage in NEC in the period influenced by the two types of TCs. Figures 7A,C show that the NEC precipitation anomaly induced by the eastern-track type TCs gradually decreases from east to west. These TCs mainly affect the eastern part of NEC, particularly the eastern Heilongjiang and the northeastern Jilin. The precipitation amount and the precipitation anomaly percentage reach 12 mm/day and 300%/day, respectively. As is seen from Figures 7B,D, the NEC precipitation anomaly induced by the turning-type TCs gradually decreases from south to north. These TCs mainly affect Liaoning Province which is in southern NEC, especially the south-eastern Liaoning. The average precipitation and precipitation anomaly percentage reach 24 mm/day and the 300%/day, respectively. The distribution of the anomalous precipitation in the active days of TCs in the NEC is consistent with the TC track characteristics shown in Figure 5. Hence, the obtained TC cases are reasonable.
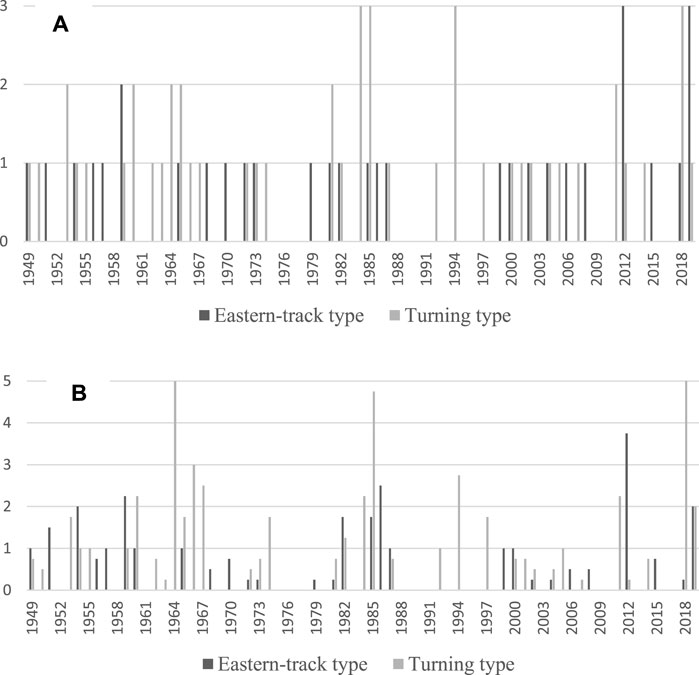
FIGURE 6. Time series of (A) TC number and (B) influence days of the two types of northward-moving TCs.
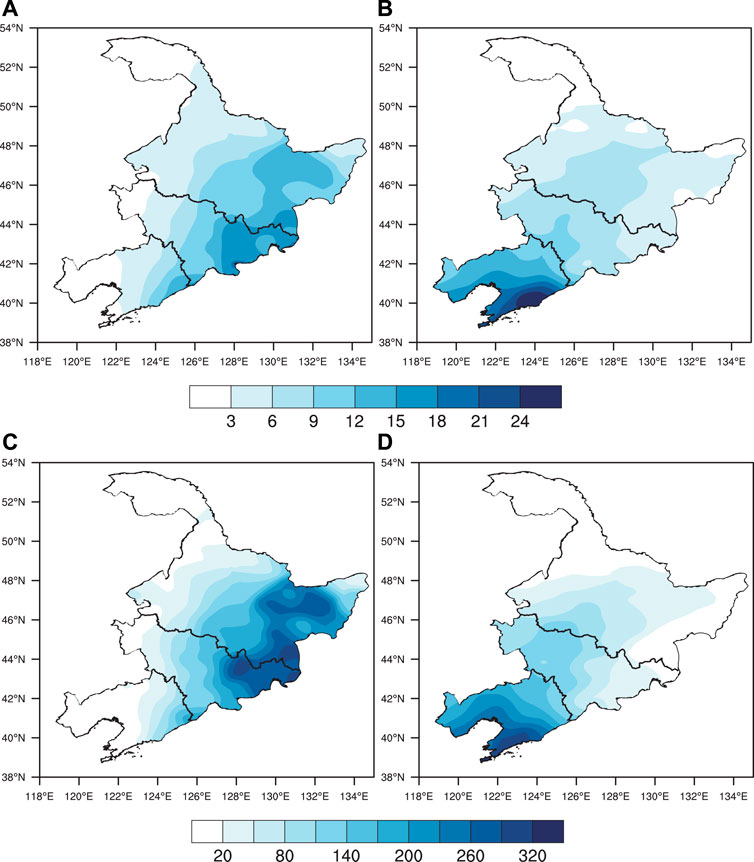
FIGURE 7. (A,B) Average precipitation in NEC (mm/day) and (C,D) precipitation anomaly percentages (%) for the different types of northward-moving TCs. (A,C) are for the eastern-track type TCs; (B,D) are for the turning type TCs.
4 Relationship Between Sea Surface Temperature and the Two Types of Northward-Moving Tropical Cyclones
Figure 8 provides the 850 hPa wind on the initiation day of the two types of TCs, and notable differences can be found in the locations of the monsoon trough and western north Pacific subtropical anticyclone. For the eastern-track type TCs, the monsoon trough is located in the south of 15°N, 130°E, while the western north Pacific subtropical anticyclone is located in the eastern and western north Pacific with a center in the southeastern Japan. The western ridge of the WPSH is located around 30°N, 130°E. In the initiation day of the turning-type TCs, the monsoon trough shows a northwestward shift. The center of the western north Pacific subtropical anticyclone is over Japan, and the western end of the WPSH ridge is located at 35°N, 125°E. The location of the western north Pacific subtropical anticyclone on the initiation days of two types of TCs is generally more eastward, which is conducive to the northward movement of the TCs along the northerly wind on the left side of the anticyclone. Some past studies have indicated that most TCs are generated in the monsoon trough (Wang et al., 2006; Gao et al., 2008). The mean genesis location of eastern-track type TCs is 14.6°N, 144.1°E, while that of the turning-type TCs is 16.5°N, 139°E. The latter is slightly northwestward than that of the eastern-track type, which is consistent with the location of monsoon trough. The locations of the monsoon trough and WPSH are different between the two types of TCs, resulting in the difference in TC tracks.
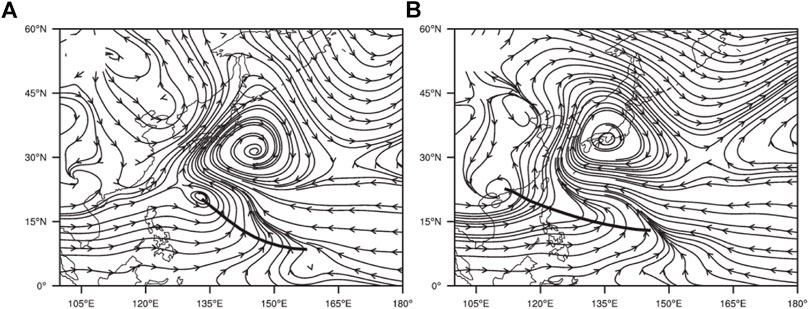
FIGURE 8. Composite of 850 hPa flow field on the genesis day of the two types of TCs (m/s): (A) eastern-track type; (B) turning type.
Figure 9 shows the composite SST anomalies (SSTAs) for the two types of TCs during late winter and early spring (January–March), late spring and early summer (May–July), and the peak season of TC activities (July–September). The selected composite years are listed in Table 1. For the eastern-track type TCs, the SSTA distribution corresponds to the La Niña state during late winter and early spring. Significant negative SSTA appears in the tropical central-eastern Pacific (Figure 9A), while positive SSTA appears in the subtropical North Pacific Ocean. During the peak season of TC activities, the SSTA is positive in the tropical central and eastern Pacific (Figure 9E). Thus, the eastern-track type TCs are more likely to occur in the decay year of La Niña. For the turning-type TCs, the negative SSTA in January–March is relatively weak in the tropical central-eastern Pacific (Figure 9B). In May–July, the composite SST shows a significant positive anomaly in the West Wind Drift area in the subtropical central North Pacific (Figure 9D). The composite results suggest that the SSTA is important to the tracks. The Niño3 area (5°S–5°N, 150°W–90°W) of the equatorial Central and Eastern Pacific in late winter and early spring (January–March) is the key location for the eastern-track type TCs. Whereas the West Wind Drift area (35°N–45°N, 160°E–160°W) in late spring and early summer (May–July) is crucial for the turning-type TCs.
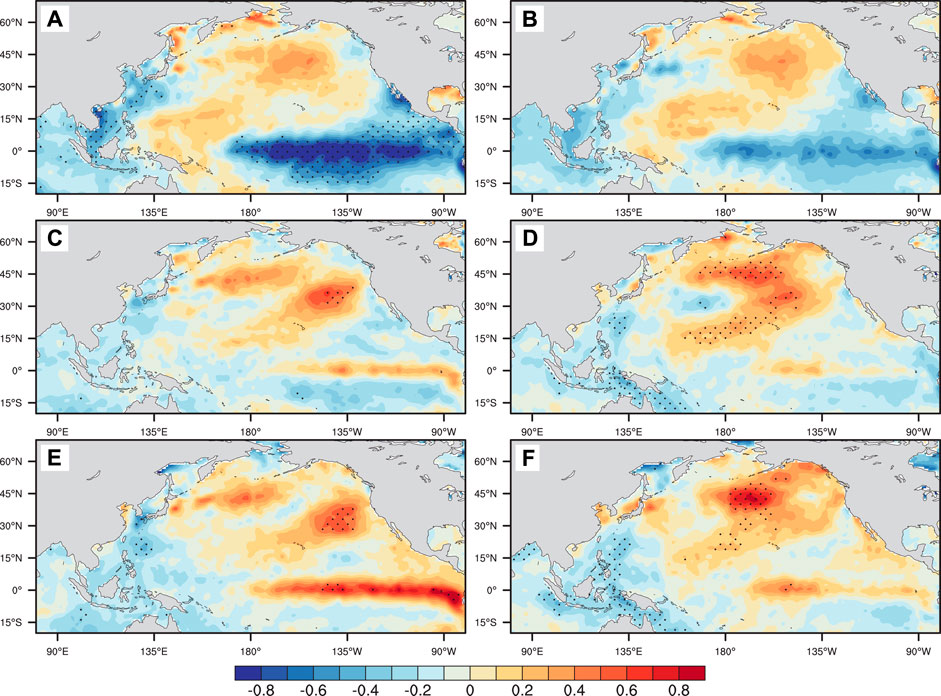
FIGURE 9. Composite of SST anomalies (°C) in (A,B) late winter and early spring (January–March), (C,D) late spring and early summer (May–July), and (E,F) peak season of TC activities (July–September). (A,C,E): eastern-track type; (B,D,F): turning type. The dotted areas indicate the anomalies that are significant at the 95% confidence level.

TABLE 1. List of the years when two types of northward-moving TCs occur independently.
5 Effects of Pacific Sea Surface Temperature on the Two Types of Northward-Moving Tropical Cyclones
To understand the mechanisms for the impacts of SST in various key areas on TC tracks, two SST indexes are used. The first is the Niño3 index, which is defined as the area-mean SSTA over 5°S–5°N, 150°W–90°W. The second is the West Wind Drift index, which is defined as the area-mean SSTA over 35°N–45°N, 160°E–160°W. Figure 10 shows the distribution of correlation coefficients between the January–March mean Niño3 index (multiplied by −1) and the 850 hPa stream function and rotational wind from January to March, from April to June, and from July to September. The negative SSTA in the tropical eastern Pacific can stimulate a Gill type Rossby wave through the diabatic heating (Gill, 1980). An anticyclonic circulation appears in the tropical northeastern Pacific during January–March, and meanwhile a cyclonic circulation appears on the Northwest Pacific. The southerly wind on the west side of the anticyclonic circulation transports warm air to the subtropical western north Pacific and weaken the atmosphere stability. Additionally, the southerly wind acts to decelerate the trade wind and warm SST in the subtropical western north Pacific. The SST warming and the weakened atmosphere stability favor the convection in the tropical eastern and western north Pacific, further emanating a cyclonic circulation over the western Northwest Pacific. The cyclonic circulation can further sustain and expand to Northeast Asia from July to September through local air-sea interaction or the capacitor effect of the Indian Ocean, which in turn affects the circulation that is important for the genesis and movement of TCs.
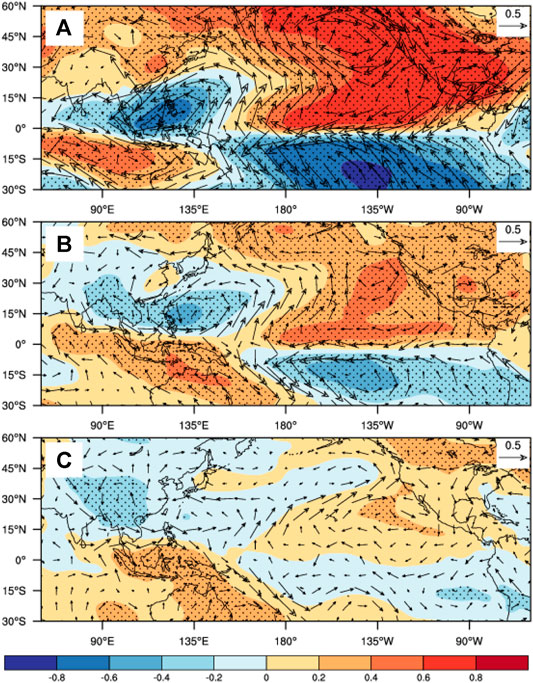
FIGURE 10. The correlation coefficients between the sign-reversed Niño3 index in January–March and the 850 hPa stream function anomaly (shading) and rotational wind anomaly (vector) in (A) January–March, (B) April–June and (C) July–September. The dotted areas indicate the correlations that are significant at the 90% confidence level.
To eliminate the influence of West Wind Drift index in the early stage, partial correlation analysis is conducted on the Niño3 index and the atmospheric circulation during the peak season of TC activities. Figure 11A shows the distribution of partial correlation coefficients between the sign-reversed January–March mean Niño3 index and the 500 hPa geopotential height and 850 hPa wind during the peak season of TC activities. The negative SSTA in the Niño3 area during January–March is conducive to the decrease of the 500 hPa geopotential height in tropical and subtropical North Pacific. The anomalous cyclonic circulation occurs in the Northwest Pacific, which is conducive to the genesis and development of TCs. Table 2 lists the correlation coefficients between the sign-reversed January–March mean Niño3 index and the WPSH index in the peak season of TC activities. The sign-reversed Niño3 index shows a significant negative correlation with the area, intensity and the location of the WPSH northern boundary, which is significant at the 99% confidence level. When the Niño3 SST shows negative anomalies during January–March, the area of WPSH is relatively small, and its intensity is relatively weak. The weakened and eastward WPSH is favorable for the northward movement of TCs along the northerly wind to the west of the WPSH and is conducive to the TC landfall in NEC, North Korea, the Republic of Korea, Japan and other subtropical regions. Figure 11B shows the partial correlation coefficients between the sign-reversed January–March mean Niño3 index and the 500 hPa zonal wind during the peak season of TC activities. Significant positive correlation coefficients can be found in the tropical western Pacific. Thus, when the Niño3 SST shows negative anomalies during January–March, the WPSH in the peak season of TC activities is weakened and moves eastwards. At the same time, the associated westerly wind anomalies in the tropical western Pacific can weaken the southeasterly wind on the south of the WPSH, which is conducive to the northward movement of TCs to higher latitudes. Figure 11C shows that the sign-reversed Niño3 index and the 850 hPa vorticity are significantly positively correlated in the subtropical western north Pacific near 140°E–150°E, which is the main genesis region of eastern-track type TCs (Figure 8A). When the Niño3 area SST shows negatively anomalies during January–March, the positive low-level vorticity in the western north Pacific near 150°E during the late stage of the peak season of TC activities is conducive to the genesis of the eastern-track type TCs in this area. As shown in Figure 11D, the negative Niño3 SST anomaly during January–March generates a cyclonic steering circulation in the vicinity of the Philippine Basin. The anomalous westerly steering flow associated with the cyclonic circulation can weaken the easterly wind on the south of the WPSH. Meanwhile, the northerly steering flow on the east of the cyclonic circulation is conducive to the northward movement of TCs. Therefore, the zonal circulation is weakened and the meridional circulation is strengthened, which is favorable for TC’s northward movement along the northerly steering flow rather than moving westwards or turning. As a result, more TCs will influence NEC.
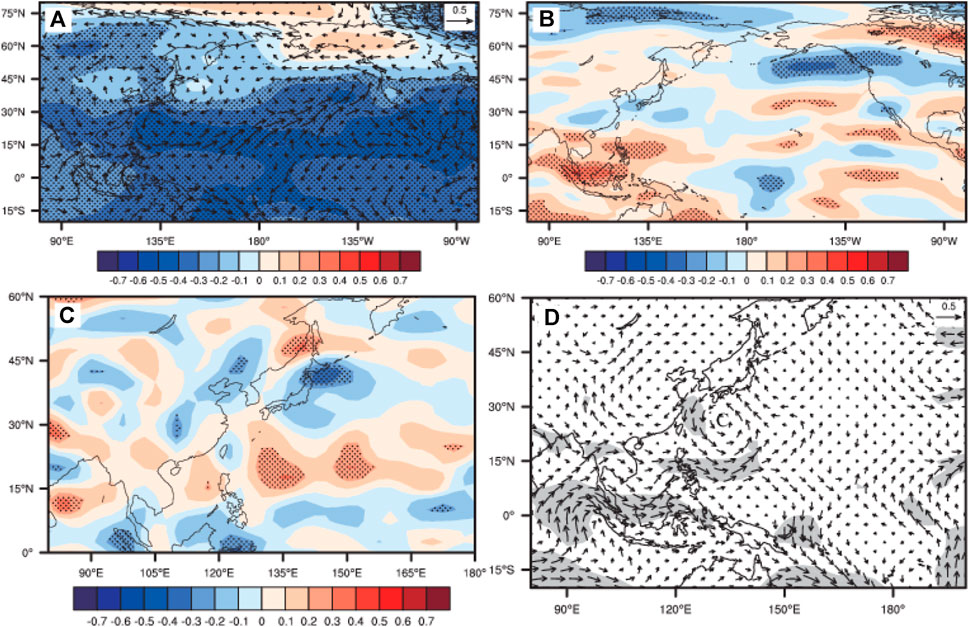
FIGURE 11. The partial correlation coefficients between the sign-reversed Niño3 index in January–March and the (A) 500 hPa geopotential height anomaly (shading) and 850 hPa wind anomaly (vector), (B) 500 hPa zonal wind anomaly, (C) 850 hPa vorticity anomaly, and (D) steering flow in July–September. Both the dotted areas and shaded areas indicate the correlations that are significant at the 90% confidence level.
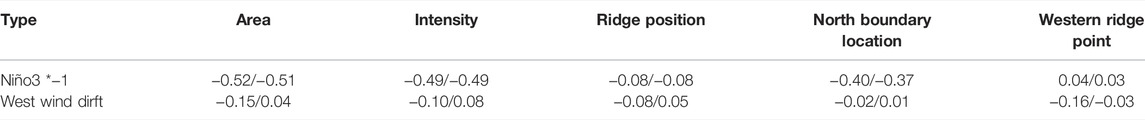
TABLE 2. Correlation/partial correlation coefficients between the SST index and the West Pacific Subtropical high index in different key areas.
In summary, the negative SSTA in the Niño3 area during January–March can stimulate Gill-type Rossby wave, which can cause atmospheric circulation anomalies that last to the peak season of TC activities. The negative SSTA in the Niño3 area during January–March favors the generation of cyclonic circulations and positive vorticity anomalies in the lower levels in the vicinity of Philippines during the peak season of TC activities. The anomalous circulation corresponds to an eastward extension of the monsoon trough, facilitating TC genesis in the vicinity of Philippines. In addition, the westerly anomalies associated with the weakened WPSH can weaken the strong easterly wind on the south side of the WPSH, hindering the westward movement of TCs. The cyclonic large-scale steering flow in the vicinity of Philippine Sea further enables the TCs to move northwards along the northerly steering flow on the west of the WPSH.
The upper-level disturbances could propagate downstream along the jet in the mid-high latitudes of the Northern Hemisphere, producing teleconnection wave trains and affecting the atmospheric circulation around the entire Northern Hemisphere (Gong et al., 2006). Figure 12 shows the distribution of regression coefficients of the 500 hPa height and wave action flux anomalies from July to September against the May–July mean West Wind Drift index. There are anomalous teleconnection wave trains with alternative positive and negative anomalies along the middle latitudes of the Northern Hemisphere from the central North Pacific to East Asia. It indicates that the SSTA in the West Wind Drift area may affect the geopotential height and circulations over the Northwest Pacific and East Asia through the teleconnection wave train, and thereby regulating the movement of TCs.
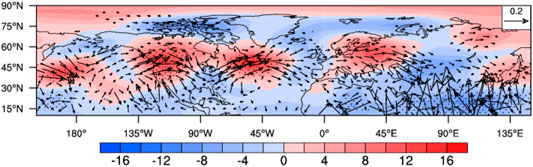
FIGURE 12. Regression coefficients of West Wind Drift index in May–July with 500 hPa geopotential height anomaly (shading, gpm) and wave activity flux from July to September (vector, m2/s2). The dotted areas indicate the coefficients that are significant at the 90% confidence level. Only the part with the regression coefficient of wave activity flux greater than 0.02 m2/s2 is shown.
To eliminate the influence of the January–March mean Niño3 index on the atmospheric circulation in the peak season of TC activities, we conduct a partial correlation analysis. Figure 13A shows the partial correlation coefficients between the May–July averaged West Wind Drift index and the 500 hPa geopotential height anomaly and 850 hPa wind anomaly in the peak season of TC activities. The May–July averaged West Wind Drift index shows a negative correlation with the 500 hPa geopotential height in the Northern Hemisphere tropics except a positive correlation to the north of 30°N, with significant anomalies in the Korean Peninsula, Japan, the West Wind Drift area and North America. The partial correlation coefficients between the May–July averaged West Wind Drift index and the 500 hPa zonal wind during the peak season of TC activities are shown in Figure 13B. A positive correlation appears in the tropical western Pacific, while a negative correlation appears along the zonal band in 15°N–30°N. Moreover, a positive correlation occurs in the East Asia to the north of 30°N and the northeastern Pacific. When the SST in the West Wind Drift area is high, the anomalous westerly wind to the north of 15°N is favorable for enabling the TCs to enter the South China Sea. However, the easterly wind anomaly in the zonal band in 15°N–30°N facilitates northwestward movement of TCs. Moreover, the westerly wind anomaly over East Asia (to the north of 35°N) deflects the northwestward moving TCs and steers the TCs to move eastward. Figure 13C shows that the West Wind Drift index and the 850 hPa vorticity anomaly are positively correlated in Taiwan, the Philippines, and the southeastern part of the tropical western north Pacific. When the SSTA in the May–July West Wind Drift area is positive, the positive low-level vorticity anomalies in the western north Pacific during the late stage of the peak season of TC activities facilitate the genesis of turning-type TCs. Figure 13D indicates that the positive SSTA in the West Wind Drift area in May–July corresponds to the cyclonic steering flow over the northern Philippines during the peak season of TC activities. The southeasterly steering flow on the northeast of the cyclonic circulation steers the TCs generated in the western part of the western north Pacific to move northwestward and eventually make landfall in China. An anticyclonic circulation anomaly appears in the Japan Sea. The southwesterly wind in front of the anticyclonic circulation makes the TCs to turn around and move to the northeast. In summary, the positive SSTA in the West Wind Drift area during May–July is conducive to the formation of the cyclonic circulation anomalies and positive vorticity anomalies over the northern Philippines and Taiwan during the peak season of TC activities, which facilitates TC genesis in this region. In addition, the cyclonic steering flow over the Philippines and the anticyclonic steering flow over Japan Sea steer TCs to move northwestward. Then TCs turn to NEC.
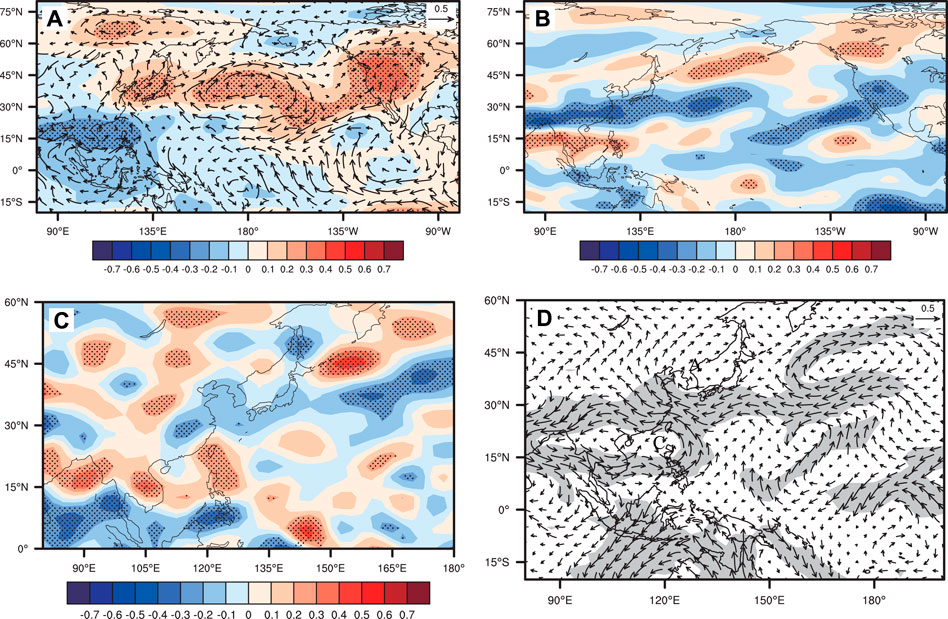
FIGURE 13. The partial correlation coefficients between the West Wind Drift index in May–July and (A) 500 hPa geopotential height anomaly (shading) and 850 hPa wind anomaly (vector), (B) 500 hPa zonal wind anomaly, (C) 850 hPa vorticity anomaly, and (D) steering flow in July–September. The dotted areas and shaded areas indicate the correlations that are significant at the 90% confidence level.
6 Numerical Experiment Validation on the Effects of Sea Surface Temperature on Atmospheric Circulations
As discussed above, the SSTA in Niño3 area during January–March influences the geopotential height and circulation in the western Pacific during the peak season of TC activities, and further influences the northward movement of TCs. The SSTA in the West Wind Drift area during May–July results in cyclonic circulation anomalies in the western north Pacific and anticyclonic anomalies in the Japan Sea. The associated steering flow steers TCs to move northwestwards and then northeastward. To verify this proposed mechanism in two key areas, four groups of sensitivity experiments are designed (Table 3). Each group is continuously integrated for 15 years. To remove the possible influence of the initial condition, we only use the model results of the last 5 years are used to remove the possible influence of the initial condition and spinning up of the model. In the sensitivity experiments, the positive (negative) SSTAs are added to the climatological SST, which is referred to as the warm (cold) phase experiment. Niño3_W (Niño3_C) represents that warm (cold) SSTA forcing is added to the Niño3 area (5°S–5°N, 150°W–90°W) from January to March. The West Wind Dirft_W (West Wind Dirft_C) represents that warm (cold) SSTA forcing is added to the West Wind Dirft area (35°N–45°N, 160°E–160°W) from May to July. Figure 14 shows the differences in the 500 hPa geopotential height and the 850 hPa wind between the cold and warm phase experiments for the Niño3 area in the peak season of TC activities. When the SSTs in January–March are low, a negative anomaly of the 500 hPa geopotential height occurs in the western north Pacific to the south of 30°N. Meanwhile, there is a low-level cyclonic circulation anomaly to the south of Japan and an anticyclonic circulation anomaly to the east of Japan. The simulated low-level wind anomalies are generally consistent with the observed steering flow (Figure 11D). However, compared with the observations, a positive geopotential height anomaly is presented over North China, and the cyclonic circulation in southern Japan is slightly northeastward. Figure 15 shows the differences in 500 hPa geopotential height and the 850 hPa wind between the warm and cold phase experiments in the West Wind Drift area in the peak season of TC activities. As shown in Figure 15, a positive geopotential height anomaly occurs over East Asia. A cyclonic circulation anomaly is presented over the low-level troposphere in the southern part of Japan, and an anticyclonic circulation anomaly appears over East Asia. The geopotential height over the western north Pacific and East Asia are in anti-phase, and the anomalous configuration of the cyclonic-anticyclonic circulation anomaly is generally consistent with the observation (Figures 13A,D). However, the locations of the cyclonic circulation in the southern part of Japan and the anticyclonic circulation over East Asia are slightly northeastward than the observation.
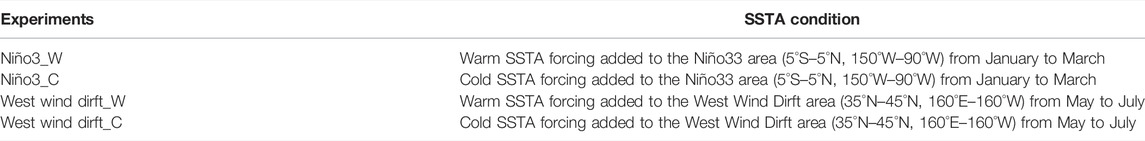
TABLE 3. Design of numerical experiments.
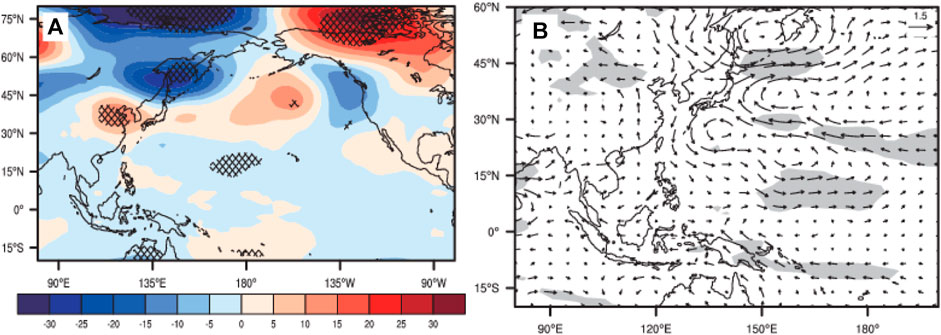
FIGURE 14. Ensemble-mean differences of (A) 500 hPa geopotential height (gpm), (B) 850 hPa wind (m/s) anomalies in July–September between Niño3-C and Niño3-W. (A) Dotted areas and (B) shaded areas indicate the differences that are significant at the 90% confidence level.
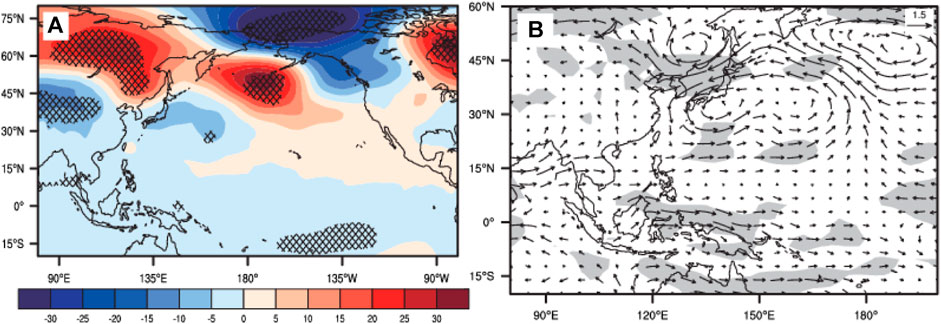
FIGURE 15. Ensemble-mean differences of (A) 500 hPa geopotential height (gpm), (B) 850 hPa wind (m/s) anomalies in July–September between West Wind Dirft_W and West Wind Dirft_C. Dotted areas and shaded areas indicate the differences that are significant at the 90% confidence level.
Overall, the numerical experiments have generally reproduced the low geopotential height in the middle troposphere over the western north Pacific and the cyclonic circulation anomaly in the lower troposphere during the peak season of TC activities when the SSTA is negative in the Niño3 area in January–March. Moreover, the results well reproduce, the observed anti-phase of geopotential height over the western north Pacific and East Asia during the peak season of TC activities when the SSTA is positive in the West Wind Drift area in May–July. Therefore, the numerical experiments have well confirmed the proposed mechanism.
7 Discussion and Conclusion
A machine learning method is used in this study to objectively classify the selected northward-moving TCs that can influence NEC into eastern-track type and turning type. Then, the possible influences of SST on TC tracks are discussed. In July–September between 1949 and 2019, 81 TCs affecting NEC are identified. For the eastern-track type TCs, the TC induced precipitation in NEC gradually decreases from east to west. Differently, for the turning type TCs the TC induced precipitation in NEC gradually decreases from south to north, which means the southern NEC is more influenced by TCs (i.e., Liaoning).
Notable interannual variabilities are found in the number of TCs and the days with TC influencing NEC. The genesis location of the eastern-track type TCs is relatively southeastward. The genesis location of the turning type TCs is more northward, and the influence time is longer. The interannual variability has a close relationship with the Pacific SST. For the eastern-track type TCs, negative SSTA in the tropical central-eastern Pacific Ocean during January–March is conducive to development of anti-cyclonic circulation anomalies by stimulating Gill-type Rossby wave. The southerly wind on the west of the anticyclonic circulation transports warm air to the subtropical western north Pacific and weakens the atmospheric stability there. Additionally, the southerly wind can decelerate the trade wind and the warming up of SST in the subtropical western north Pacific. The SST warming and the weakened atmospheric stability favor the convection in the tropical eastern Northwest Pacific, which then further emanates a cyclonic circulation over the western Northwest Pacific. The cyclonic circulation can further sustain and expand to Northeast Asia from July to September and facilitate the TC genesis in that area. Also, the associated westerly wind anomalies in the tropical western Pacific can weaken the southeasterly wind on the south of the WPSH, which is conducive to the northward movement of TCs along the northerly steering flow to the north of the subtropical high. For the turning type TCs, the positive SSTA in the West Wind Drift area in May–July induces positive vorticity anomalies in the northern Philippines and Taiwan from late July to September. The associated cyclonic steering flow over the Philippines and the anticyclonic steering flow over the Japan Sea steer TCs to move northwestward and then turn to northeast, which is favorable for the genesis of the turning type TCs.
The numerical experiments have successfully reproduced the negative SSTA in the Niño3 area in January–March, the low geopotential height in the middle troposphere over the western north Pacific during the peak season of TC activities, and the cyclonic circulation anomaly in the lower troposphere. Moreover, the simulation results have well reproduced the positive SSTA in May–July in the West Wind Drift area. In addition, the observed anti-phase of geopotential height over the Northwest Pacific and East Asia during the peak season of TC activities is also reproduced. The numerical experiments can well confirm the proposed mechanism.
Previous studies have shown that the sea ice out of the tropics (Fan, 2007; Gao Q. Q. et al., 2017; Sato et al., 2018) and the snow cover on the Tibetan Plateau (Lian et al., 2005; Xie and Yan, 2007) also have influences on TC activities over the Northwest Pacific. Their effects will be analyzed in our future studies. In this study, the influence of SST in different sea areas on the circulation is discussed. But, the year with the simultaneous occurrence of different types of northward-moving TC is not discussed, which will be the focus of our subsequent research.
Data Availability Statement
Publicly available datasets were analyzed in this study. This data can be found here: NCEP/NCAR reanalysis are provided by NOAA/OAR/ESRLPSL, Boulder, Colorado, United States, from their web site at https://psl.noaa.gov/data/gridded/data.ncep.reanalysis.pressure. The HadISST data are provided by the Met Office Hadley Centre, from their web site at https://www.metoffice.gov.uk/hadobs/hadisst/data/download.html. The tropical cyclones data are provided by the Shanghai Typhoon Research Institute of the China Meteorological Administration, from their web site at https://tcdata.typhoon.org.cn/zjljsjj_zlhq.html.
Author Contributions
YY and YF conceived the study and wrote the article. CZ and ZG provided critical feedback. Other authors helped the data analysis. All authors contributed to the article and approved the submitted version.
Funding
This work was jointly supported by the National Natural Science Foundation of China (Grant No. 42005037); Special Project of Innovative Development, CMA (CXFZ2021J022 and CXFZ2021Z011); Liaoning Provincial Natural Science Foundation Project (Ph.D. Start-up Research Fund 2019-BS214); and Research Project of the Institute of Atmospheric Environment, CMA (2020SYIAE08 and 2021SYIAEKFMS09).
Conflict of Interest
The authors declare that the research was conducted in the absence of any commercial or financial relationships that could be construed as a potential conflict of interest.
Publisher’s Note
All claims expressed in this article are solely those of the authors and do not necessarily represent those of their affiliated organizations, or those of the publisher, the editors and the reviewers. Any product that may be evaluated in this article, or claim that may be made by its manufacturer, is not guaranteed or endorsed by the publisher.
References
Chan, J. C. L. (2000). Tropical Cyclone Activity over the Western North Pacific Associated with El Niño and La Niña Events. J. Clim. 13 (16), 2960–2972. doi:10.1175/1520-0442(2000)0132.0.CO;210.1175/1520-0442(2000)013<2960:tcaotw>2.0.co;2
Chen, G. H., and Huang, R. H. (2006b). Research on Climatological Problems of Tropical Cyclone and Typhoon Activity in Western North Pacific. Adv. Earth Sci. 21 (6), 610–616. doi:10.3321/j.issn:1001-8166.2006.06.008
Chen, G. H., and Huang, R. H. (2006a). The Effect of Warm Pool Thermal States on Tropical Cyclone in West Northwest Pacific. J. Trop. Meteorol. 22 (6), 527–532. doi:10.3969/j.issn.1004-4965.2006.06.002
Chen, T.-C., Wang, S.-Y., and Yen, M.-C. (2006). Interannual Variation of the Tropical Cyclone Activity over the Western North Pacific. J. Clim. 19 (21), 5709–5720. doi:10.1175/JCLI3934.1
Chen, T.-C., Weng, S.-P., Yamazaki, N., and Kiehne, S. (1998). Interannual Variation in the Tropical Cyclone Formation over the Western North Pacific. Mon. Wea. Rev. 126 (4), 1080–1090. doi:10.1175/1520-0493(1998)126<1080:ivittc>2.0.co;2
Cheung, K. K. W., and Chan, J. C. L. (2010). Ensemble Forecasting of Tropical Cyclone Motion Using a Barotropic Model. Part I: Perturbations of the Environment. Mon. Weather Rev. 127 (6), 2617–2640. doi:10.1175/1520-0493(1999)1272.0.CO;2
Fan, K. (2007). North Pacific Sea Ice Cover, a Predictor for the Western North Pacific Typhoon Frequency? Sci. China Ser. D. 50 (8), 1251–1257. doi:10.1007/s11430-007-0076-y
Fang, Y., Chen, H., Lin, Y., Zhao, C., and Zhou, F. (2020). Classification of Northeast China Cold Vortex Activity Paths in Early Summer Based on K-Means Clustering and Their Climate Impact. Adv. Atmos. Sci. 38 (3), 400–412. doi:10.1007/s00376-020-0118-3
Feng, T., Huang, R. H., Chen, G. H., Wu, L., Huang, P., and Wang, L. (2013). Progress in Recent Climatological Research on Tropical Cyclone Activity over the Western North Pacific. Chin. J. Atmos. Sci. 38 (3), 400–412. doi:10.3878/j.issn.1006-9895.2012.12307
Gao, J. Y., Zhang, X. Z., and You, L. J. (2008). Anomalous Western North Pacific Monsoon Trough and Tropical Cyclone Activities. Acta. Oceanol. Sin. 30 (3), 35–47. doi:10.3321/j.issn:0253-4193.2008.03.005
Gao, Q. Q., Wu, H. M., Zhu, T. M., Xu, C. S., and Cao, B. (2017). Characteristics of Winter-Spring Arctic Sea-Ice and its Relationship with Tropical Cyclone in the Northwest Pacific. Chin. J. Polar Res. 29 (4), 506–512. doi:10.13679/j.jdyj.2017.4.506
Gao, S. Y., Zhao, T. T., Song, L. L., Meng, Z. X., Luo, J. X., Xu, L. L., et al. (2017). Study of Northward Moving Tropical Cyclones in 1945-2015. Meteor. Sci. Technol. 45 (2), 313–323. doi:10.19517/j.1671-6345.20160229
Gill, A. E. (1980). Some Simple Solutions for Heat-Induced Tropical Circulation. Q.J R. Metall. Soc. 106 (449), 447–462. doi:10.1002/qj.49710644905
Gong, Y. F., He, J. H., Duan, T. Y., and Pan, P. (2006). Numerical Experiment on the Influences of Minus-SSTA over Mid-latitude Northern Pacific on the Subtropical Anticyclone. J. Trop. Meteorol. 22 (4), 386–392. doi:10.3969/j.issn.1004-4965.2006.04.011
Guo, Y. P., and Tan, Z. M. (2021). Influence of Different ENSO Types on Tropical Cyclone Rapid Intensification over the Western North Pacific. JGR Atmos. 126 (11), 033059. doi:10.1029/2020JD033059
Ha, K.-J., Yoon, S.-J., Yun, K.-S., Kug, J.-S., Jang, Y.-S., and Chan, J. C. L. (2012). Dependency of Typhoon Intensity and Genesis Locations on El Niño Phase and SST Shift over the Western North Pacific. Theor. Appl. Climatol. 109 (3), 383–395. doi:10.1007/s00704-012-0588-z
Ha, Y., Zhong, Z., Yang, X., and Sun, Y. (2015). Contribution of East Indian Ocean SSTA to Western North Pacific Tropical Cyclone Activity under El Niño/La Niña Conditions. Int. J. Climatol. 35 (4), 506–519. doi:10.1002/joc.3997
Holland, G. J. (1993). Tropical Cyclone Motion. Global Guide to Tropical Cyclone Forecasting, Document WMO/TD 560, Tropical Cyclone Programme Rep. Geneva Switzerland: World Meteorological Organization Tech.
Huang, F., and Xu, S. B. (2009). Characteristics of Super Typhoon Activity over Western North Pacific and Ites Relationship with ENSO. Periodical ocean Univ. China 39 (5), 883–888. doi:10.3969/j.issn.1672-5174.2009.05.009
Huang, G., Qu, X., and Hu, K. (2011). The Impact of the Tropical Indian Ocean on South Asian High in Boreal Summer. Adv. Atmos. Sci. 28 (2), 421–432. doi:10.1007/s00376-010-9224-y
Huang, L. W., Wu, G. X., and Yu, R. C. (2005). The Effects of Mesoscale Air-Sea Interaction on Heavy Rain in Two Typhoon Progresses. Acta. Meteorol. Sin. 63 (4), 455–467. doi:10.3321/j.issn:0577-6619.2005.04.007
Huang, R. H., and Chen, G. H. (2007). Research on Interannual Variations of Tracks of Tropical Cyclones over Northwest Pacific and Their Physical Mechanism. Acta. Meteorol. Sin. 65 (5), 683–694. doi:10.3321/j.issn:0577-6619.2007.05.004
Huang, R. H., Huangfu, J. L., Liu, Y., Feng, T., Wu, L., Chen, J. L., et al. (2016). Progress in Recent Research on the Processes and Physical Mechanisms Involved in the Influence of the Western Pacific Warm Pool on the Monsoon Trough and Tropical Cyclone Activity over the Western North Pacific. Chin. J. Atmos. Sci. 40 (5), 877–896. doi:10.3878/j.issn.1006-9895.1512.15251
Huang, R. H., and Wang, L. (2010). Interannual Variation of the Landfalling Locations of Typhoons in China and its Association with the Summer East Asia/ Pacific Pattern Teleconnection. Chin. J. Atmos. Sci. 34 (5), 853–864. doi:10.3878/j.issn.1006-9895.2010.05.01
Huo, L. W., Guo, P. W., and Zhang, F. Y. (2016). Impact of Summer Tropical Atlantic SST Anomaly on Western North Pacific Tropical Cyclone Genesis. Trans. Atmos. Sci. 39 (1), 55–63. doi:10.13878/j.cnki.dqkxxb.20150403002
Jin, R. H., Gao, S. Z., Gu, H., and Liu, Z. K. (2006). An Analysis on Characteristics of Landing and Going Northward Typhoons and its Causes during 1975-2005. Meteor. Mon. 32 (7), 33–39. doi:10.7519/j.issn.1000-0526.2006.7.005
Kalnay, E., Kanamitsu, M., Kistler, R., Collins, W., Deaven, D., and Gandin, L. (1996). The NCEP/NCAR 40-Year Reanalysis Project. B. Am. Meteorol. Soc. 77 (3), 437–472. doi:10.1175/1520-0477(1996)077<0437:tnyrp>2.0.co;2
Kim, H. M., Webster, P. J., and Curry, J. A. (2011). Modulation of North Pacific Tropical Cyclone Activity by Three Phases of ENSO. J. Clim. 24 (6), 1839–1849. doi:10.1175/2010JCLI3939.1
Lander, M. A. (1994). An Exploratory Analysis of the Relationship between Tropical Storm Formation in the Western North Pacific and ENSO. Mon. Weather Rev. 122 (4), 333–360. doi:10.1175/1520-0493(1994)122<0636:aeaotr>2.0.co;2
Lian, X., Yan, T., Pietrafesa, L., Karl, T., and Xu, X. (2005). Relationship between Western North Pacific Typhoon Activity and Tibetan Plateau Winter and Spring Snow Cover. Geophys. Res. Lett. 321. doi:10.1029/2005GL023237
Liang, J., and Chen, L. S. (2005). Motion and Intensity and Impact Characteristics of Tropical Cyclone Affecting the Liaodong Peninsula. J. Trop. Meteorol. 21 (4), 410–419. doi:10.3969/j.issn.1004-4965.2005.04.009
Lonfat, M., Rogers, R., Marchok, T., and Marks, F. D. (2007). A Parametric Model for Predicting Hurricane Rainfall. Mon. Weather Rev. 135 (9), 3086–3097. doi:10.1175/MWR3433.1
Lu, X., Yu, H., Ying, M., Zhao, B., Zhang, S., Lin, L., et al. (2021). Western North Pacific Tropical Cyclone Database Created by the China Meteorological Administration. Adv. Atmos. Sci. 38 (4). doi:10.1007/s00376-020-0211-7
Molinari, J., Moore, P., and Idone, V. (1999). Convective Structure of Hurricanes as Revealed by Lightning Locations. Mon. Weather Rev. 127 (4), 520–534. doi:10.1175/1520-0493(1999)127<0520:CSOHAR>2.0.CO;2
Mueller, K. J., Demaria, M., Knaff, J., Kossin, J. P., and Haar, T. V. (2006). Objective Estimation of Tropical Cyclone Wind Structure from Infrared Satellite Data. Weather Forecast. 21 (6), 990–1005. doi:10.1175/WAF955.1
Nakamura, J., Lall, U., Kushnir, Y., and Camargo, S. J. (2009). Classifying North Atlantic Tropical Cyclone Tracks by Mass Moments. J. Clim. 22 (20), 5481–5494. doi:10.1175/2009JCLI2828.1
Peng, Y. H., Yi, D. J., Wang, T., Wang, S., and Liu, B. (2019). Clustering Analysis of Typhoon Track in the North-west Pacific Ocean. Mar. Forecasts 36 (5), 63–70. doi:10.11737/j.issn.1003-0239.2019.05.008
Rayner, N. A., Parker, D. E., Horton, E. B., Folland, C. K., Alexander, L. V., Rowell, D. P., et al. (2003). Global Analyses of Sea Surface Temperature, Sea Ice, and Night Marine Air Temperature since the Late Nineteenth Century. J. Geophys. Res.-Atmos. 108 (D14), D14. doi:10.1029/2002JD002670
Sato, K., Inoue, J., Yamazaki, A., Kim, J. H., Makshtas, A., Kustov, V., et al. (2018). Impact on Predictability of Tropical and Mid-latitude Cyclones by Extra Arctic Observations. Sci. Rep. 8 (1). doi:10.1038/s41598-018-30594-4
Tao, L., and Cheng, S. C. (2012). Impact of Indian Ocean Basin Warming and ENSO on Tropical Cyclone Activities over the Western Pacific. Chin. J. Atmos. Sci. 36 (6), 1223–1235. doi:10.3878/j.issn.1006-9895.2012.12031
Wang, B., and Chan, J. C. L. (2002). How Strong ENSO Events Affect Tropical Storm Activity over the Western North Pacific. J. Clim. 15 (13), 1643–1658. doi:10.1175/1520-0442(2002)015<1643:hseeat>2.0.co;2
Wang, B., Chen, G., and Liu, F. (2019). Diversity of the Madden-Julian Oscillation. Sci. Adv. 5 (7), 1–8. doi:10.1126/sciadv.aax0220
Wang, C., Weisberg, R. H., and Virmani, J. I. (1999). Western Pacific Interannual Variability Associated with the El Nino Southern Oscillation. J. Geophys. Res.-Ocean. 104 (C3), 5131–5149. doi:10.1029/1998JC900090
Wang, H., Ding, Y. H., and He, J. H. (2006). Influence of Western North Pacific Summer Monsoon Changes on Typhoon Genesis. Acta. Meteorol. Sin. 64 (3), 345–356. doi:10.3321/j.issn:0577-6619.2006.03.009
Wang, X. P., and Liang, J. (2006). Some Climatic Features of Tropical Cyclones Influencing Northern China for Recent 52 Years. Meteor. Mon. 32 (10), 76–80. doi:10.3969/j.issn.1000-0526.2006.10.012
Ward, J. H. (1963). Hierarchical Grouping to Optimize Objective Function. J. Am. Stat. Assoc. 69, 236–244. doi:10.1080/01621459.1963.10500845
Wu, G., and Lau, N. C. (1992). A GCM Simulation of the Relationship between Tropical-Storm Formation and ENSO. Mon. Weather Rev. 120 (6), 958. doi:10.1175/1520-0493(1992)120<0958:agsotr>2.0.co;2
Xie, L., and Yan, T. (2007). West North Pacific Typhoon Track Patterns and Their Potential Connection to Tibetan Plateau Snow Cover. Nat. Hazards. 42 (2), 317–333. doi:10.1007/s11069-006-9087-9
Yamasaki, M. (2007). Numerical Experiment of Tropical Cyclone Formation in the Intertropical Convergence Zone. J. Meteorl. Soc. Jan. 67 (4), 529–540. doi:10.2151/jmsj1965.67.4_529
Ying, M., Zhang, W., Yu, H., Lu, X., Feng, J., Fan, Y., et al. (2014). An Overview of the china Meteorological Administration Tropical Cyclone Database. Atmos. Ocean. Tech. 31 (2), 287–301. doi:10.1175/JTECH-D-12-00119.1
Yu, J., Li, T., Tan, Z., and Zhu, Z. (2016). Effects of Tropical North Atlantic SST on Tropical Cyclone Genesis in the Western North Pacific. Clim. Dynam. 46 (3-4), 1–13. doi:10.1007/s00382-015-2618-x
Yuan, J. P., and Cao, J. (2013). North Indian Ocean Tropical Cyclone Activities Influenced by the Indian Ocean Dipole Mode. Sci. China Earth Sci. 56, 855–865. doi:10.1007/s11430-012-4559-0
Zhan, R., Wang, Y., and Lei, X. (2011a). Contributions of ENSO and East Indian Ocean SSTA to the Interannual Variability of Northwest Pacific Tropical Cyclone Frequency. J. Clim. 24 (2), 509–521. doi:10.1175/2010JCLI3808.1
Zhan, R., Wang, Y., and Wu, C.-C. (2011b). Impact of SSTA in the East Indian Ocean on the Frequency of Northwest Pacific Tropical Cyclones: A Regional Atmospheric Model Study. J. Clim. 24 (23), 6227–6242. doi:10.1175/JCLI-D-10-05014.1
Zhan, R., Wang, Y., and Ying, M. (2012). Seasonal Forecasts of Tropical Cyclone Activity over the Western North Pacific: a Review. Trop. Cyclone Res. Rev. 1 (3), 307–324. doi:10.6057/2012TCRR03.07
Zheng, Y. Q., Yu, J. H., Wu, Q. S., Lin, J. G., and Gong, Z. B. (2013). K-means Clustering Method for Classification Oh the Northwestern Pacific Tropical Cyclone Tracks. J. Trop. Meteorol. 29 (04), 607–615. doi:10.3969/j.issn.1004-4965.2013.04.009
Zhou, X. S., Yang, Y., Yang, S., and Chen, J. Y. (2007). Climatic Characteristics of North-Going Tropical Cyclone. J. Meteor. Environ. 23 (6), 1–5. doi:10.3969/j.issn.1673-503X.2007.06.001
Keywords: machine learning, hierarchical agglomerative clustering, tropical cyclone track, air-sea interactions, West wind drift, steering flow
Citation: Yu Y, Fang Y, Zhao C, Lin Y, Lin Y, Gong Z and Li Y (2022) Modulation of Pacific Sea Surface Temperature on Two Types of Tropical Cyclone Tracks Affecting Northeast China. Front. Earth Sci. 10:810943. doi: 10.3389/feart.2022.810943
Received: 08 November 2021; Accepted: 25 April 2022;
Published: 31 May 2022.
Edited by:
Qingqing Li, Nanjing University of Information Science and Technology, ChinaReviewed by:
Yipeng Guo, Nanjing University, ChinaChao Wang, Nanjing University of Information Science and Technology, China
Copyright © 2022 Yu, Fang, Zhao, Lin, Lin, Gong and Li. This is an open-access article distributed under the terms of the Creative Commons Attribution License (CC BY). The use, distribution or reproduction in other forums is permitted, provided the original author(s) and the copyright owner(s) are credited and that the original publication in this journal is cited, in accordance with accepted academic practice. No use, distribution or reproduction is permitted which does not comply with these terms.
*Correspondence: Yihe Fang, NDk5NTQ1NzBAcXEuY29t; Yi Lin, bGlueWlfMDMzMEAxNjMuY29t