 Hanyu Wang
 Lei Liu
 Longxing Yang
 Fengxia Sun
 Li Yi
Li Yi Hong Liu
- 1United Laboratory of High-Pressure Physics and Earthquake Science, Institute of Earthquake Forecasting, CEA, Beijing, China
- 2State Key Laboratory of Geological Processes and Mineral Resources, and School of Earth Sciences and Resources, China University of Geosciences, Beijing, China
The structure, electrical properties, elasticity, and anisotropy of the newly discovered mantle mineral, CaO3, are obtained under 10–50 GPa by first-principles simulation to understand their relations with the composition and structure of the mantle transition zone. Crystal structure and phonon frequencies under 0–50 GPa indicate that CaO3 can exist stably under 10–50 GPa. Here, the band gap of CaO3 is 2.32–2.77 under the explored pressure and indicates its semiconductor property. The Mulliken population analysis shows that the Ca–O bond is an ionic bond, and O–O bond is a covalent bond, and the strength of the O–O bond is higher than that of the Ca–O bond. The density, bulk modulus, and shear modulus of CaO3 increase with increasing pressure. The compressional wave velocity (Vp) and shear wave velocity (Vs) of CaO3 increase with increasing pressure. The seismic wave velocity of CaO3 is smaller than that of the Preliminary Reference Earth Model (PREM) and common mantle transition zone minerals, and it is a very exceptional low seismic wave velocity phase. The anisotropies of Vs are 36.47, 26.41, 23.79, and 18.96%, and the anisotropies of Vp are 18.37, 13.91, 12.75, and 10.64% under 15, 25, 35, and 50 GPa, respectively. Those seismic velocity anisotropies are larger than those of the mantle transition zone’s main component, so CaO3 may be an important source of seismic wave velocity anisotropy in the mantle transition zone. Our results provide new evidence for understanding the material composition and the source of anisotropy in the mantle transition zone.
1 Introduction
The research studies on the physical and chemical behavior of rocks and minerals under deep Earth conditions through high-temperature and high-pressure experiments and simulation are two of the important ways to understand the composition, structure, and dynamic processes of the Earth. Due to the difficulty in entering the Earth’s interior, most of our understanding of the Earth’s interior derives from seismic and geophysical observation. By comparing observed seismic properties of the Earth with properties of particular minerals under deep Earth conditions, the physical and chemical properties of the Earth can be constrained (Sun, 2019).
The Earth’s mantle plays a vital role in the evolution of the crust and provides the thermal and mechanical driving forces for plate tectonics. The mantle transition zone is a particular area in the mantle with a particular structure and composition (Birch, 1952; Frost, 2008). The mantle transition zone refers to the part of the Earth between the 410 and 660 km that is of great significance in the study of structure and dynamics in the Earth’s interior (Zhou et al., 2010). The seismic discontinuities at 410 and 660 km depths that distinguish the transition zone from the upper and lower mantle are globally observed (Dziewonski and Anderson, 1981; Flanagan and Shearer, 1998). The seismic discontinuities provide important clues that clarify the physical and chemical nature of the transition zone (Anderson, 1989; Lay, 1989). The pressure in the mantle transition zone begins at ∼ 14 GPa (410 km depth) (Wei and Shearer, 2017; Zhang et al., 2018), where (Mg,Fe)2SiO4 olivine transforms into wadsleyite with a denser structure (Ringwood and Major, 1970; Ringwood, 1979; Katsura and Ito, 1989), sometimes referred to as β-phase or modified spinel. At ∼ 17.5 GPa (520 km), wadsleyite transforms into ringwoodite (Gossler and King, 1996; Shearer, 1996; Gu et al., 1998; Deuss and Woodhouse, 2001), sometimes termed γ-phase or silicate spinel (Ringwood, 1975; Shearer, 1990). At approximately 23–24 GPa (660 km), ringwoodite breaks down into an assemblage of perovskite-structured (Mg,Fe)SiO3 and (Mg,Fe)O magnesiowüstite (Ito and Takahashi, 1989), which marks the beginning of the lower mantle. Except for the olivine and its high pressure polymorphic phases, garnet is also an important component of the mantle transition zone (Palke et al., 2015; Fan et al., 2018). The clinopyroxene and orthopyroxene components would be incorporated into garnet with increasing pressure (Akaogi and Akimoto, 1977; Ringwood, 1991). Garnet accepts Mg and Fe into the octahedral site but not Ca, and all pyroxene components are hosted by garnet under the mid-transition zone conditions. At pressures higher than 18 GPa, CaSiO3 perovskite starts to exsolve from garnet (Canil, 1994). At depths greater than 660 km, garnet also transforms into (Mg,Fe) (Al,Si)O3 perovskite (Kubo and Akaogi, 2000; Akaogi et al., 2002) over a wider pressure interval than the ringwoodite transformation (Chantel et al., 2016). If the Al content is low, the (Mg,Fe)SiO3 pyroxene component will not be entirely incorporated into garnet under transition zone conditions. However, an additional phase, akimotoite, will form at approximately 600 km (Ishii et al., 2011).
The most apparent seismic wave discontinuity in the mantle is at 660 km, which was confirmed worldwide (Dziewonski and Anderson, 1981; Flanagan and Shearer, 1998). At 660 km, the seismic wave velocity increases rapidly, the shear wave velocity changes from 5.61 to 5.96 km/s, and the compression wave velocity changes from 10.2 to 10.79 km/s, but there are different opinions on the exact causes of the mutation. It is generally believed that olivine’s post-spinel transformation causes such changes (Ito and Takahashi, 1989). However, with further research, garnet–ilmenite transformation and ilmenite–perovskite transformation (Kubo and Akaogi, 2000; Akaogi et al., 2002) have been proved, which can also explain the seismic wave discontinuity at 660 km. The pressure relationship between them is still controversial and needs further study. At the same time, some scholars believe that phase transition is not the only solution to explain the discontinuous splitting of seismic waves. The change of the mantle material composition can also explain this phenomenon, such as the discontinuity of seismic waves caused by the stagnant slab material (Fukao et al., 2009).
Recently, Wang et al. (2020) proposed an alternative mechanism, that is, CaO3 may decompose into CaO and O2 at 20 GPa, resulting in the change of the material composition at this depth to explain seismic wave velocity anomalies near 660 km depth in the Earth’s mantle. CaO3 is a newly discovered material that may exist in the mantle transition zone, and CaO3 may form at 35 GPa and existence under reduced pressure to 20 GPa. Once reaching the transition zone at depths of less than 500 km, CaO3 would decompose to provide a sporadic source of extra O2 that would work its way up toward the surface of the Earth to complete the oxygen cycle (Wang et al., 2020). Therefore, this new mineral and reaction phenomenon may affect the composition and structure of the mantle transition zone and the lower mantle. However, the crystal structure and elastic properties of the CaO3 under high pressure are still not well constrained. The first-principles calculation is an algorithm to directly solve the Schrodinger equation according to the principle of interaction between the nucleus and electron and its fundamental motion law, starting from specific requirements and after some approximate processing (Kohn and Sham, 1965). Based on the principle of quantum mechanics and density functional theory, it uses the Hohenberg–Kohn theorem (Hohenberg and Kohn, 1964) to determine the system’s energy and calculate the properties of molecules and condensed matter. First-principles calculations have been successfully applied to geosciences for understanding mineral properties such as structural, elastic, and electrical properties under high pressure and temperature (Gillan et al., 2006; Jahn and Kowalski, 2014; Karki, 2014; Liu et al., 2015; Zhang et al., 2015a; Zhang et al., 2015b; Zhao et al., 2015; Wu and Wentzcovitch, 2016; Lv et al., 2017; Umemoto et al., 2017). Therefore, we investigate the crystal structural and elastic properties of CaO3 under high pressure using first-principles calculations to discover the far-reaching significance and influence of CaO3 in the mantle transition zone and lower mantle.
2 Simulation Methods
CaO3 belongs to the tetragonal system, and the space group is p-421 m (Wang et al., 2020). In this study, first-principles calculations are performed using the density functional theory (Hohenberg and Kohn, 1964; Kohn and Sham, 1965) with the plane wave pseudopotential. The calculations are implemented in the CASTEP code (Clark et al., 2005), and the generalized gradient approximation (GGA) with PBE parameterization (Perdew et al., 1996) is used to describe exchange–correlation interactions. OTFG norm-conserving pseudopotential (Bachelet and Schlüter, 1982) is used to model electron–ion interactions with a plane-wave energy cutoff of 700 eV. A 3 × 3 × 5 Monkhorst–Pack grid of k-points is adopted for sampling the Brillouin zone. The self-consistent-field calculations use a convergence criterion of 5 × 10⁻⁷ a.u. for total energy.
The structures of the CaO3 at given pressures are calculated by simultaneously optimizing both atomic positions and lattice constants under Hellmann–Feynman forces and stresses acting on nuclei and lattice parameters, respectively (Nielsen and Martin, 1983). The phonon is calculated by finite displacement (Baroni et al., 2001) to determine the molecular stability. The Mulliken population analysis (Mayer, 1995; Segall et al., 1996a) is used to determine the bonding characters. The elastic constants are determined by stress–strain relations (Karki et al., 2001). The magnitudes of all applied strains are 0.003, and the linear relation was ensured for this strain range.
3 Results and Discussion
3.1 Benchmark Calculation
To assess the performance of the total-energy density functional theory approach used in our calculations, we calculated the bond angle, density, and volume of CaO3 and compared them with the reported values.
As shown in Table 1, the differences between the calculated lattice parameters and the reported values are less than 0.3%, and the differences in volume are between 0.09 and 0.86%.
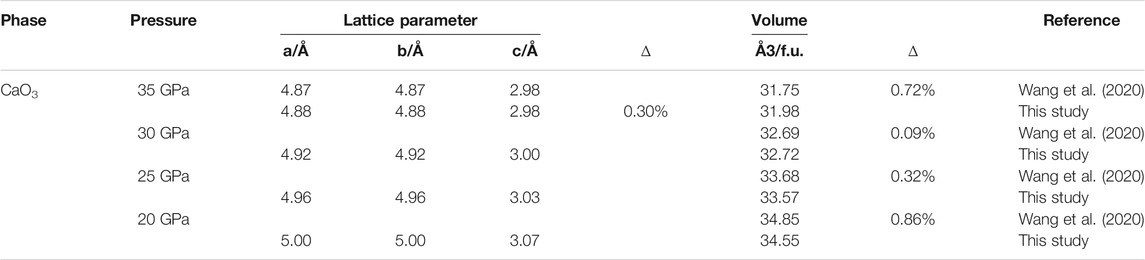
TABLE 1. Structural and volume of CaO3 at 20, 25, 30, and 35 GPa.
To further verify the validity of our calculation approach, the O–O bond length and bond angle of the O–O–O bond were calculated under 0–50 GPa (Figure 1) and compared with the previous experimental results. With the increase of pressure, the O–O bond length and O–O–O bond angle decrease linearly. The calculated O–O bond lengths (Figure 1A) are 1.45–1.87% larger than the previous values (Wang et al., 2020); however, the calculated O–O–O bond angles (Figure 1B) are 0.08–0.11% smaller.
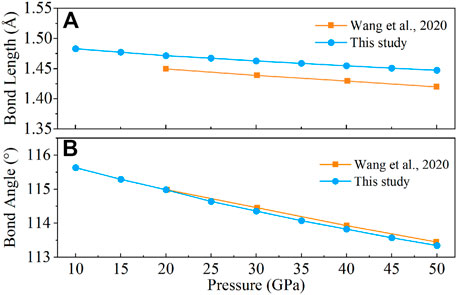
FIGURE 1. Bond length (A) and bond angle (B) of the O–O–O bond under 0–50 GPa.
Those slight differences between our calculated values with previous results are mainly due to the calculated temperature difference and the insufficient binding energy of GGA (Liu et al., 2018). Therefore, the general agreement of our calculations with previous results demonstrates the validity of our computational method and its ability to reproduce the properties of CaO3.
3.2 Crystal Structure Under High Pressure
3.2.1 Lattice Constants
The lattice constants (a, b, and c) of the CaO3 are calculated from 10 to 50 GPa (Figure 2) by the CASTEP code. The lattice constants of the CaO3 decrease linearly with increasing pressure, and the fitted result is also listed in Figure 2. The results indicate that the influence of pressure on the lattice constants of CaO3 is uniform.
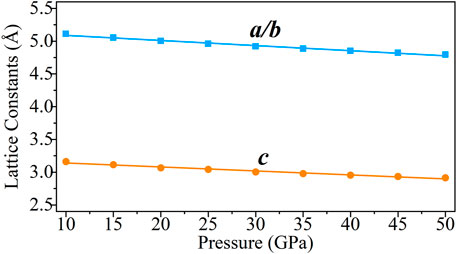
FIGURE 2. Lattice constants of CaO3 under 10–50 GPa. The blue squares represent the lattice constant of a and b, and the orange circles represent the lattice constant of c.
3.2.2 The Phonon Dispersion
The thermodynamic properties of crystals can be evaluated by the phonon frequencies across the Brillouin zone (Sham, 1965; Ashcroft and Mermin, 1976; Kern et al., 1999). For understanding the structural stability of CaO3, the phonon dispersion along select high-symmetry points in the Brillouin zone is calculated at 0–100 GPa (Figure 3).
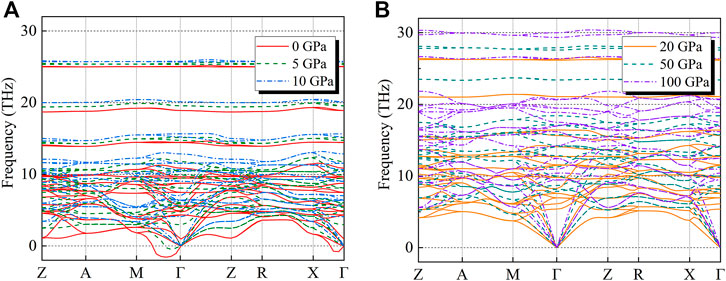
FIGURE 3. (A,B) show the phonon dispersion relations along with select high-symmetry points in the Brillouin zone for CaO3 at (A) 0 (solid red lines), 5 (dashed olive green lines), 10 (dot-dash blue lines), (B) 20 (solid orange lines), 50 (dashed dark green lines), and 100 GPa (dot-dash purple lines).
Under 0–10 GPa, the lattice vibration produces a negative value (frequency less than 0) in the Brillouin region (Figure 3A) which means the CaO3 structure is not stable (Gonze, 1997), but it is stable in the range of 10–100 GPa (Figure 3B). These results are consistent with the previous result (Wang et al., 2020) that the CaO3 may exist stably in the mantle transition zone.
3.2.3 Density
The CaO3 density increases linearly with the increased pressure (Earth’s depth) (Figure 4). The CaO3 is dynamically stable at 20–50 GPa and may exist in the mantle transition zone and the lower mantle (Wang et al., 2020). Therefore, the densities of several main mineral phases in this area are also listed in Figure 4, including wadsleyite (Inoue et al., 1998), ringwoodite (Inoue et al., 1998), CaSiO3 perovskite (Karki and Crain, 1998), and MgSiO3 perovskite (Karki et al., 1997) under high pressure and density of the Preliminary Reference Earth Model (PREM) (Dziewonski and Anderson, 1981).
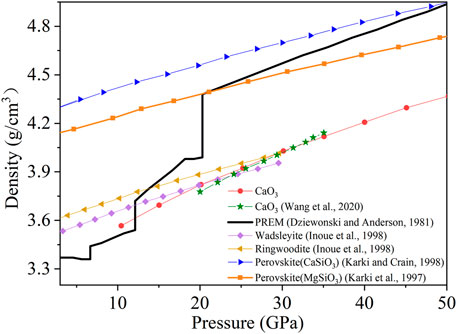
FIGURE 4. Density of CaO3 and some selected phases for comparison under 3–50 GPa. The red circles represent CaO3, the green stars represent the previous data of CaO3, the black thick solid line represents the PREM model, the purple diamonds represent wadsleyite, the yellow left triangles represent ringwoodite, the blue right triangles represent perovskite (CaSiO3), and the orange squares represent perovskite (MgSiO3).
The density of CaO3 increases with pressure, but the density is lower than the typical density structure profile of the Earth. During 10–20 GPa, the density of CaO3 is lower than that of wadsleyite and ringwoodite. During 20–30 GPa, the density of CaO3 is higher than that of wadsleyite but still lower than that of ringwoodite. When the pressure increases to 30 GPa, the density of CaO3 becomes higher than that of wadsleyite and ringwoodite. At all pressure, the density of CaO3 is less than that of two kinds of perovskite (CaSiO3 and MgSiO3). At the same time, the density of CaSiO3 perovskite is higher than that of the MgSiO3 perovskite. So, the content of Ca and the Ca-bearing mineral such as CaO3 maybe have an important effect on the composition of the mantle.
3.3 Electrical Property
To explore the electrical property of CaO3, its energy band structure, density of states, and Mulliken population were calculated under 10–50 GPa. Here, the band gap of CaO3 is 2.32–2.77 under the explored pressure and indicates its semiconductor property (Guo et al., 2009) (Figure 5). With the increase of pressure, the band gap increases and conductivity decreases.
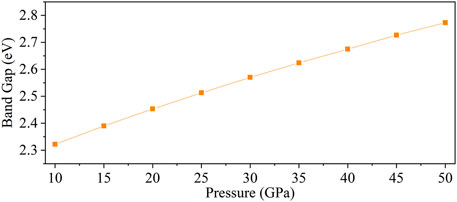
FIGURE 5. Band gap of CaO3 under 10–50 GPa.
The characteristics of the electronic density of states (DOS) are mainly contributed by p-orbits (Figure 6). The contribution of the p-orbitals for the total DOS is about 54.8 and 55.0%, and the rest is contributed by the s-orbitals (22.4 and 22.2%) and the d-orbitals (22.8 and 22.8%) at 25 and 50 GPa, respectively. With the increase of pressure, the distance between the conduction band and valence band increases; however, the morphological characteristics of the electronic density of states do not change.
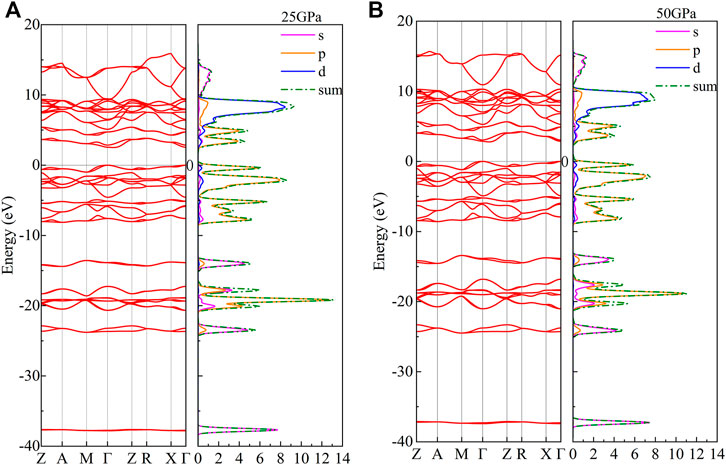
FIGURE 6. Density of states and band structure of CaO3 at (A) 25 GPa and (B) 50 GPa. The red curve represents the band structure; the magenta curve, orange curve, and blue curve represent the DOS of s-orbitals, p-orbitals, and d-orbitals, respectively; and the green dot-dash line represents the total value of the DOS.
The d-orbits of the DOS have relatively large peaks (Figure 6). The electrons are relatively local, and the corresponding energy band is observed to be narrow, showing transition metal-like properties (Imai et al., 2000). The bottom of the valence band is mainly contributed by s-orbitals. The upper part of the valence band is mainly contributed by s-orbitals and p-orbitals. Most of the conduction band is contributed by p-orbitals and d-orbitals. The lowest point of the conduction band and the highest point of the valence band are located at the different K points, and the band gap is an indirect gap.
In order to further verify the electrical relationship among atoms, we calculate the Mulliken population of CaO3 (Table 2). The spilling parameter of the spin component in the system is less than 1%, ranging from 0.26 to 0.28%, which means that our calculation results are reasonable and reliable (Segall et al., 1996b).
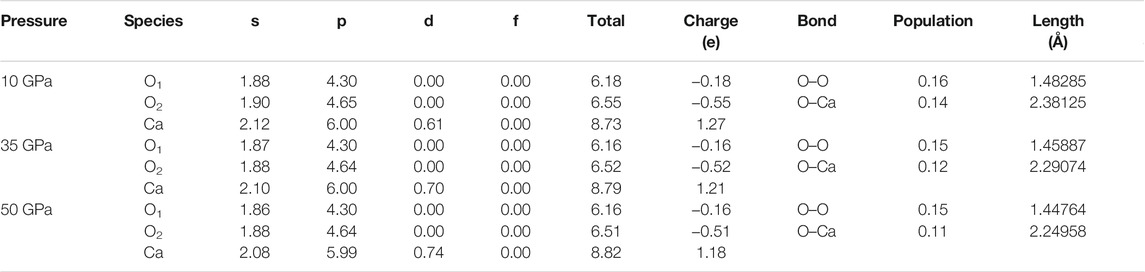
TABLE 2. Mulliken population analysis of CaO3 at 10, 35, and 50 GPa.
Through the Mulliken population analysis, the overlap population may be used to assess the covalent or ionic nature of the atomic bond. The Mulliken population analysis shows that the Ca–O bond is an ionic bond, and the O–O bond is a covalent bond (Table 2), and the strength of the O–O bond is higher than that of the Ca–O bond. When the pressure increases from 10 to 50 GPa, the population value of the Ca–O bond decreases from 0.14 to 0.11 (21.43%), but the population value of the O–O bond decreases from 0.16 to 0.15 (6.25%). The electron localization function in CaO3 shows the strong charge localization between the nearest-neighbor O atoms in the O3 units that indicates the clear covalent O–O bond, and less localized charge distribution on the asymmetric Ca–O bonds indicates its ionicity (Wang et al., 2020). Our calculations are consistent with those previous results and deepen the understanding of the electrical characteristics of CaO3.
3.4 Elasticity and Seismic Wave Velocity
The elastic parameters of minerals and their dependence on pressure are essential in earth science to understand processes ranging from brittle failure to flexure to the propagation of elastic waves. Seismology revealed the structure of the Earth, including the radial (one-dimensional) profile, lateral heterogeneity, and anisotropy. These results are mainly determined by the elastic parameters of minerals and their dependence on pressure (Karki et al., 2001).
CaO3 belongs to the tetragonal system and has six independent elastic constants (C11, C12, C13, C33, C44, and C66). In Figure 7, we calculated the elastic constants under 10–50 GPa according to the relationship between stress and strain:
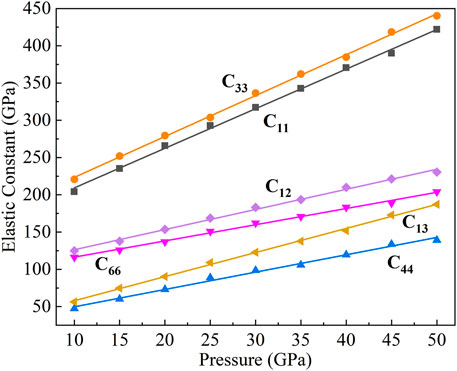
FIGURE 7. Elastic constants of CaO3 under 10–50 GPa. The black squares represent C11, the purple diamonds represent C12, the oblique yellow triangles represent C13, the orange circles represent C33, the regular blue triangles represent C44, and the inverted magenta triangles represent C66.
Among the six elastic constants, C33 and C11 are the largest, which means that C33 and C11 have the highest elastic strength. When the pressure increases, the elastic constants of C33 and C11 increase faster. The slopes are 5.48 and 5.31, respectively, which is determined by the nonbonding atomic force between Ca atoms in the c-axis direction (C33) and a-axis direction (C11). The distance between Ca and Ca atoms on the c-axis is less than that on the a-axis, which makes the nonbonding atomic force on the c-axis greater than that on the a-axis, so C33 has a larger elastic constant and a higher elastic strength than C11.
The elastic constants of C44 and C66 linearly increase with pressure and have similar pressure derivatives (2.32 and 2.17). The value of C44 is the lowest that caused by the relatively weak bond of Ca–O in the [111] direction. The elastic constants of C12 and C13 also linearly increase with pressure, and C13 tends to approach C66 with the increase of pressure.
An elastic modulus is an important parameter to describe minerals’ physical and chemical properties. In polycrystalline systems, assuming that the arrangement direction is random, the bulk modulus and shear modulus can be obtained by Voigt, Reuss, and Hill formulas (Finger, 1983). The Hill formula of elasticity is used in this article (Hill, 1952), which is the average of Voigt and Reuss formulas.
The bulk modulus (K) and shear modulus (G) of CaO3 from 10 to 50 GPa are shown in Figure 8. The K and G linearly increase with increasing pressure. The pressure derivatives of the bulk and shear moduli, K′ and G′, are directly calculated from the pressure dependence of K and G and yield 3.82 and 1.81, respectively.
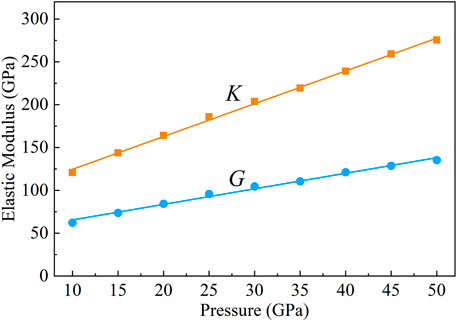
FIGURE 8. Bulk modulus (K) and shear modulus (G) of CaO3 under 10–50 GPa. The orange squares represent bulk modulus, and the blue circles represent shear modulus.
Simulated and laboratory studies of the seismic wave velocities in minerals at high pressure and temperature be conducive to scientists to describe seismic data for the variation of sound velocities and density with depth in the Earth’s interior (Li and Liebermann, 2014).
As a potentially important component in the lower mantle and mantle transition zone, the seismic wave velocity of CaO3 under high pressure is of great significance for understanding the structure and composition of the deep Earth. We calculated the shear wave velocity (Vs) (Figure 9A) and compressional wave velocity (Vp) (Figure 9B) of CaO3 under 10–50 GPa with the following formula:
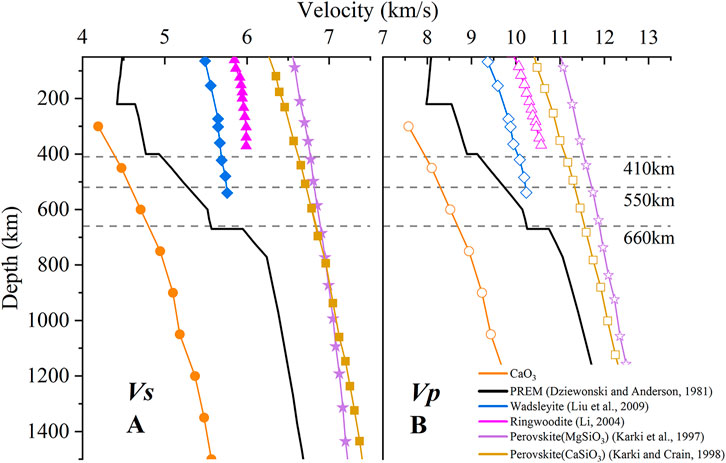
FIGURE 9. Shear wave velocity (A) and compressional wave velocity (B) of CaO3, PREM model, wadsleyite, ringwoodite, perovskite (MgSiO3), and perovskite (CaSiO3) within 50–1500 km. The hollow legend represents Vs, the solid legend represents Vp, the orange circle represents CaO3, the solid black line represents the PREM model, the blue diamonds represent wadsleyite, the regular magenta triangles represent ringwoodite, the yellow squares represent perovskite (MgSiO3), and the purple stars represent perovskite (CaSiO3).
For exploring the effect of CaO3 on the structure of the mantle, the seismic wave velocity of the wadsleyite (Liu et al., 2009), ringwoodite (Li, 2004), MgSiO3 perovskite (Karki et al., 1997), and CaSiO3 perovskite (Karki and Crain, 1998) under high pressure and the seismic wave velocity of PREM (Dziewonski and Anderson, 1981) are also listed in Figure 9. The Vs and Vp values of CaO3 increase with increasing pressure. Under pressure explored in this work, Vs and Vp of CaO3 are smaller than mantle seismic wave velocity (PREM). At the same time, the seismic wave velocity of CaO3 is also lower than the seismic wave velocities of the main mineral phases of the mantle, including wadsleyite, ringwoodite, MgSiO3 perovskite, and CaSiO3 perovskite. So, CaO3 is an exceptional low seismic wave velocity phase.
The formation of CaO3 at about 20 GPa was proposed to explain seismic wave velocity anomalies near 660 km depth in the Earth’s mantle (Wang et al., 2020). Our calculated results show no evident increase in CaO3 seismic wave velocity at 660 km. CaO3 also has very low seismic wave velocity, which means that CaO3 is unlikely to be the cause of the sharp seismic wave velocity increase of the 660 km depth. However, the existence of the CaO3 in the mantle may lead to the formation of a low velocity zone because of its low seismic wave velocity.
3.5 Anisotropy
Seismic wave anisotropy of the material reveals the difference in physical and chemical properties of the mineral in various directions. Seismic anisotropy describes the dependence of seismic velocity on the propagation or polarization directions of seismic waves. It is produced by two primary deformation mechanisms within the Earth: the lattice-preferred orientation (LPO) of anisotropic minerals or the shape-preferred orientations (SPOs) of distinct isotropic materials.
When the elastic constants Cij and density ρ are known, the Christoffel equation (Musgrave, 1970) can be solved to obtain the compressional wave velocity (Vp) and two orthogonally polarized shear wave velocities with different velocities (Vs1, Vs2, and defined Vs1 > Vs2):
where n, ρ, V, and δij represent the propagation direction of seismic elastic wave, medium density, seismic elastic wave velocity, and the Kronecker symbol, respectively.
The seismic wave velocities at different crystal axis directions are different. So, the azimuthal anisotropy coefficient (A) of compressional wave (P wave) and shear wave (S wave) is defined as:
where AVp, Vpmax, Vpmin, and Vp are the maximum azimuthal anisotropy coefficient of P wave, the maximum velocity of P wave in all directions of the crystal, the minimum velocity of P wave in all directions of the crystal, and the compressional wave velocity at the same pressure, respectively; AVs, Vs1, Vs2, and Vs are the maximum azimuthal anisotropy coefficient of S wave, Vs1 and Vs2 are the velocities in the same crystal direction, and shear wave velocity at the same pressure, respectively.
In Figure 10, we can find that the Vp and Vs have the same wave velocity from the [010] direction to the [001] direction. Vs has the largest wave velocity differences in the [100] and [001] directions, and the anisotropies are 36.47, 26.41, and 23.79% at 15, 25, and 35 GPa, respectively (Figures 10, 11). The largest wave velocity difference of Vs under 50 GPa is between [100] and [110] direction, and the AVs = 18.96%. In general, the anisotropy of Vs decreases with increasing pressure (Figure 11).
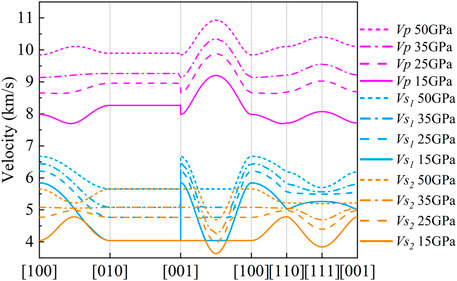
FIGURE 10. Seismic wave velocity of CaO3 at different crystal axis directions at 15, 25, 35, and 50 GPa. The solid lines represent 15 GPa, dashed lines represent 25 GPa, dot-dash lines represent 35 GPa, dotted lines represent 50 GPa, blue represents Vs1, orange represents Vs2, and magenta represents Vp.
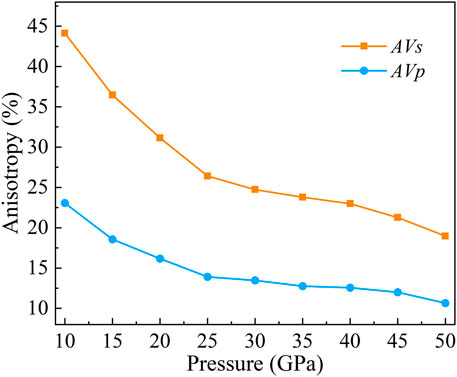
FIGURE 11. Anisotropy of CaO3 at 10–50 GPa. The orange squares represent AVs, and the blue circles represent AVp.
The maximum value of Vp is always in the [101] direction (Figure 10). However, the direction of the minimum value of Vp changes with increasing pressure. At 15 GPa, the minimum value of Vp is close to the [110] direction, and the anisotropy is 18.37%. At 25 GPa, the minimum value of Vp is in the middle of the [100] to [110] direction, and the anisotropy is 13.91%. At 35 GPa and 50 GPa, the minimum value of Vp is in the [100] direction, and the anisotropy is 12.75 and 10.64%, respectively. In general, the anisotropy of Vp decreases with increasing pressure (Figure 11).
The observation of shear wave splitting shows seismic anisotropy near the 660 km discontinuity beneath the Tonga-Kermadec subducting slabs (Wookey et al., 2002). Li et al. (2018) used the moment tensor of deep, non-double-couple earthquakes to invert for in situ seismic anisotropy assuming the shear-dislocation faulting mechanism and found 25% anisotropy in the mantle transition zone. Under the mantle transition zone conditions, wadsleyite has 14% S-wave anisotropy (Sawamoto et al., 1984; Zha et al., 1997; Sinogeikin et al., 1998); ringwoodite, present in 520–660 km of the mantle transition zone, is nearly isotropic with only ∼2% shear wave anisotropy (Weidner et al., 1984; Kiefer et al., 1997; Sinogeikin et al., 2003; Li et al., 2006). At the same time, the same abundant majorite-rich garnet in the mantle transition zone is also close to isotropy (Bass and Kanzaki, 1990; Pamato et al., 2016). Therefore, it is difficult to explain anisotropy in the mantle transition zone with combinations of the known mineral phases in the uppermost mantle and the transition-zone regions.
Here, we calculated the anisotropy of CaO3 under high pressure. The results show that the anisotropies of Vs are 36.47, 26.41, 23.79, and 18.96%, and the anisotropies of Vp are 18.37, 13.91, 12.75, and 10.64% under 15, 25, 35, and 50 GPa, respectively. The anisotropy of CaO3 is larger than that of the main components of the mantle transition zone, including the wadsleyite (Sawamoto et al., 1984; Zha et al., 1997; Sinogeikin et al., 1998), ringwoodite (Weidner et al., 1984; Kiefer et al., 1997; Sinogeikin et al., 2003; Li et al., 2006), and majorite (Bass and Kanzaki, 1990; Pamato et al., 2016). The results are very close to the anisotropy of the mantle transition zone (Li et al., 2018). Therefore, CaO3 may be an important source of seismic wave velocity anisotropy in the mantle transition zone.
4 Conclusion
CaO3 is a newly discovered mineral that may exist in the mantle transition zone. However, its physical properties under high pressure are still not well understood. Here, the structural parameters, stability, and electronic and elastic properties of CaO3 under 0–50 GPa are calculated by the first-principles method. Crystal structure and phonon frequencies under 0–50 GPa indicate that CaO3 can exist stably under 10–50 GPa. Here, the band gap of CaO3 is 2.32–2.77 under the explored pressure, indicating its semiconductor property, and the band gap increases with the increase of pressure. The Mulliken population analysis shows that the Ca–O bond is an ionic bond, and the O–O bond is a covalent bond, and the strength of the O–O bond is higher than that of the Ca–O bond. The bulk modulus and shear modulus of CaO3 increase linearly with increasing pressure from 10 to 50 GPa, and their pressure derivatives are 3.82 and 1.81, respectively. The seismic wave velocity of CaO3 is significantly lower than that of the PREM and the major minerals of the mantle transition zone, including wadsleyite, ringwoodite, MgSiO3 perovskite, and CaSiO3 perovskite. There is also no obvious increase in CaO3 seismic wave velocity at 660 km, which means that CaO3 is unlikely to be the cause of the sharp wave velocity increase at 660 km depth. However, the existence of the CaO3 in the mantle may lead to the formation of a low velocity zone because of its very low seismic wave velocity. The anisotropy of CaO3 is larger than that of the main compositions of the mantle transition zone and very close to the anisotropy of the mantle transition zone, so it may be an important source of seismic wave velocity anisotropy in the mantle transition zone. Our work provides new data for studying the influence of CaO3 in the mantle transition zone.
Data Availability Statement
The original contributions presented in the study are included in the article/Supplementary Material; further inquiries can be directed to the corresponding author.
Author Contributions
HW and LL contributed to the conception and design of this study. HW built the model and calculated the data and plotted them. LoY and FS performed supplementary calculations on the data. LiY and HL checked and modified the data. HW wrote the first draft of the manuscript. All authors reviewed the manuscript and read and approved the submitted version.
Funding
This work was supported by the State Key Laboratory of Earthquake Dynamics (Project No. LED2021B02), the Special Fund of the Institute of Earthquake Forecasting, CEA (Grant Nos 2021IEF0101-1, 2019IEF0502, and 2017KLEP03), and the National Natural Science Foundation of China (Grant No. 42174115).
Conflict of Interest
The authors declare that the research was conducted in the absence of any commercial or financial relationships that could be construed as a potential conflict of interest.
Publisher’s Note
All claims expressed in this article are solely those of the authors and do not necessarily represent those of their affiliated organizations, or those of the publisher, the editors, and the reviewers. Any product that may be evaluated in this article, or claim that may be made by its manufacturer, is not guaranteed or endorsed by the publisher.
References
Akaogi, M., and Akimoto, S. (1977). Pyroxene-Garnet Solid-Solution Equilibria in the Systems Mg4Si4O12-Mg3Al2Si3O12 and Fe4Si4O12-Fe3Al2Si3O12 at High Pressures and Temperatures. Phys. Earth Planet. Interiors 15 (1), 90–106. doi:10.1016/0031-9201(77)90013-9
Akaogi, M., Tanaka, A., and Ito, E. (2002). Garnet–Ilmenite–Perovskite Transitions in the System Mg4Si4O12-Mg3Al2Si3O12 at High Pressures and High Temperatures: Phase Equilibria, Calorimetry and Implications for Mantle Structure. Phys. Earth Planet. Interiors 132 (4), 303–324. doi:10.1016/S0031-9201(02)00075-4
Bachelet, G. B., and Schlüter, M. (1982). Relativistic Norm-Conserving Pseudopotentials. Phys. Rev. B 25 (4), 2103–2108. doi:10.1103/PhysRevB.25.2103
Baroni, S., de Gironcoli, S., dal Corso, A., and Giannozzi, P. (2001). Phonons and Related Crystal Properties from Density-Functional Perturbation Theory. Rev. Mod. Phys. 73 (2), 515–562. doi:10.1103/RevModPhys.73.515
Bass, J. D., and Kanzaki, M. (1990). Elasticity of a Majorite-Pyrope Solid Solution. Geophys. Res. Lett. 17 (11), 1989–1992. doi:10.1029/GL017i011p01989
Birch, F. (1952). Elasticity and Constitution of the Earth's interior. J. Geophys. Res. 57 (2), 227–286. doi:10.1029/JZ057i002p00227
Canil, D. (1994). Stability of Clinopyroxene at Pressure-Temperature Conditions of the Transition Region. Phys. Earth Planet. Inter. 86 (1-3), 25–34. doi:10.1016/0031-9201(94)05059-7
Chantel, J., Manthilake, G. M., Frost, D. J., Beyer, C., Ballaran, T. B., Jing, Z., et al. (2016). Elastic Wave Velocities in Polycrystalline Mg3Al2Si3O12-Pyrope Garnet to 24 GPa and 1300 K. Am. Mineral. 101 (4), 991–997. doi:10.2138/am-2016-5335
Clark, S. J., Segall, M. D., Pickard, C. J., Hasnip, P. J., Probert, M. I. J., Refson, K., et al. (2005). First Principles Methods Using CASTEP. Z. für Kristallographie. 220 (5-6), 567–570. doi:10.1524/zkri.220.5.567.65075
Deuss, A., and Woodhouse, J. (2001). Seismic Observations of Splitting of the Mid-Transition Zone Discontinuity in Earth's Mantle. Science 294 (5541), 354–357. doi:10.1126/science.1063524
Dziewonski, A. M., and Anderson, D. L. (1981). Preliminary Reference Earth Model. Phys. Earth Planet. Interiors 25 (4), 297–356. doi:10.1016/0031-9201(81)90046-7
Fan, D., Li, B., Chen, W., Xu, J., Kuang, Y., Ye, Z., et al. (2018). The Research Progress of the Equation of State for Garnet Minerals. Chin. J. High Press. Phys. 32 (1), 597. doi:10.11858/gywlxb.20170597
Finger, L. W. (1983). Physical Properties of Crystals, Their Representation by Tensors and Matrices. Eos Trans. AGU 64 (45), 643. doi:10.1029/EO064i045p00643-01
Flanagan, M. P., and Shearer, P. M. (1998). Global Mapping of Topography on Transition Zone Velocity Discontinuities by stackingSSprecursors. J. Geophys. Res. 103 (B2), 2673–2692. doi:10.1029/97JB03212
Frost, D. J. (2008). The Upper Mantle and Transition Zone. Elements 4 (3), 171–176. doi:10.2113/GSELEMENTS.4.3.171
Fukao, Y., Obayashi, M., and Nakakuki, T. (2009). Stagnant Slab: A Review. Annu. Rev. Earth Planet. Sci. 37 (1), 19–46. doi:10.1146/annurev.earth.36.031207.124224
Gillan, M. J., Alfè, D., Brodholt, J., Vočadlo, L., and Price, G. D. (2006). First-Principles Modelling of Earth and Planetary Materials at High Pressures and Temperatures. Rep. Prog. Phys. 69 (8), 2365–2441. doi:10.1088/0034-4885/69/8/R03
Gonze, X. (1997). First-Principles Responses of Solids to Atomic Displacements and Homogeneous Electric Fields: Implementation of a Conjugate-Gradient Algorithm. Phys. Rev. B 55 (16), 10337–10354. doi:10.1103/PhysRevB.55.10337
Gossler, J., and Kind, R. (1996). Seismic Evidence for Very Deep Roots. Earth Planet. Sci. Lett. 138 (1-4), 1–13. doi:10.1016/0012-821X(95)00215-X
Gu, Y., Dziewonski, A. M., and Agee, C. (1998). Global De-Correlation of the Topography of Transition Zone Discontinuities. Earth Planet. Sci. Lett. 157 (1-2), 57–67. doi:10.1016/S0012-821X(98)00027-2
Guo, L., Wu, H., Liu, J., Ma, H., Song, K., and Li, D. (2009). Density Functional Theory Study on Energy Band and Density of States of ZnO. J. Synth. Crystals 38, 440–444.
Hill, R. (1952). The Elastic Behaviour of a Crystalline Aggregate. Proc. Phys. Soc. A. 65 (5), 349–354. doi:10.1088/0370-1298/65/5/307
Hohenberg, P., and Kohn, W. (1964). Inhomogeneous Electron Gas. Phys. Rev. B 136 (3), B864. doi:10.1007/s12045-017-0529-3
Imai, Y., Mukaida, M., and Tsunoda, T. (2000). Comparison of Density of States of Transition Metal Disilicides and Their Related Compounds Systematically Calculated by a First-Principle Pseudopotential Method Using Plane-Wave Basis. Intermetallics 8 (4), 381–390. doi:10.1016/S0966-9795(99)00125-9
Inoue, T., Weidner, D., Northrup, P., and Parise, J. (1998). Elastic Properties of Hydrous Ringwoodite (γ-phase) in Mg2SiO4. Earth Planet. Sci. Lett. 160 (1-2), 107–113. doi:10.1016/S0012-821X(98)00077-6
Ishii, T., Kojitani, H., and Akaogi, M. (2011). Post-Spinel Transitions in Pyrolite and Mg2SiO4 and Akimotoite-Perovskite Transition in MgSiO3: Precise Comparison by High-Pressure High-Temperature Experiments with Multi-Sample Cell Technique. Earth Planet. Sci. LettersSci. Lett. 309 (3), 185–197. doi:10.1016/j.epsl.2011.06.023
Ito, E., and Takahashi, E. (1989). Postspinel Transformations in the System Mg2SiO4-Fe2SiO4and Some Geophysical Implications. J. Geophys. Res. 94, 10637–10646. doi:10.1029/JB094iB08p10637
Jahn, S., and Kowalski, P. M. (2014). Theoretical Approaches to Structure and Spectroscopy of Earth Materials. Rev. Mineralogy Geochem. 78 (1), 691–743. doi:10.2138/rmg.2014.78.17
Karki, B. B., and Crain, J. (1998). First-principles Determination of Elastic Properties of CaSiO3perovskite at Lower Mantle Pressures. Geophys. Res. Lett. 25 (14), 2741–2744. doi:10.1029/98GL51952
Karki, B. B., Stixrude, L., Clark, S. J., Warren, M. C., Ackland, G. J., and Crain, J. (1997). Elastic Properties of Orthorhombic MgSiO3perovskite at Lower Mantle Pressures. Am. Mineral. 82 (5-6), 635–638. doi:10.2138/am-1997-5-623
Karki, B. B., Stixrude, L., and Wentzcovitch, R. M. (2001). High-Pressure Elastic Properties of Major Materials of Earth's Mantle from First Principles. Rev. Geophys. 39 (4), 507–534. doi:10.1029/2000RG000088
Karki, B. B. (2014). First-Principles Computation of Mantle Materials in Crystalline and Amorphous Phases. Phys. Earth Planet. Interiors 240, 43–69. doi:10.1016/j.pepi.2014.11.004
Katsura, T., and Ito, E. (1989). The System Mg2SiO4-Fe2SiO4at High Pressures and Temperatures: Precise Determination of Stabilities of Olivine, Modified Spinel, and Spinel. J. Geophys. Res. 94 (B11), 15663–15670. doi:10.1029/JB094iB11p15663
Kern, G., Kresse, G., and Hafner, J. (1999). Ab Initiocalculation of the Lattice Dynamics and Phase Diagram of boron Nitride. Phys. Rev. B 59 (13), 8551–8559. doi:10.1103/PhysRevB.59.8551
Kiefer, B., Stixrude, L., and Wentzcovitch, R. M. (1997). Calculated Elastic Constants and Anisotropy of Mg2SiO4spinel at High Pressure. Geophys. Res. Lett. 24 (22), 2841–2844. doi:10.1029/97GL02975
Kohn, W., and Sham, L. J. (1965). Self-Consistent Equations Including Exchange and Correlation Effects. Phys. Rev. 140 (4A), A1133–A1138. doi:10.110310.1103/physrev.140.a1133
Kubo, A., and Akaogi, M. (2000). Post-Garnet Transitions in the System Mg4Si4O12-Mg3Al2Si3O12 up to 28 GPa: Phase Relations of Garnet, Ilmenite and Perovskite. Phys. Earth Planet. Inter. 121 (1-2), 85–102. doi:10.1016/S0031-9201(00)00162-X
Lay, T. (1989). Structure of the Core-Mantle Transition Zone. Eos Trans. AGU 70 (4), 49. doi:10.1029/89EO00024
Li, B., and Liebermann, R. C. (2014). Study of the Earth's Interior Using Measurements of Sound Velocities in Minerals by Ultrasonic Interferometry. Phys. Earth Planet. Interiors 233, 135–153. doi:10.1016/j.pepi.2014.05.006
Li, L., Weidner, D. J., Brodholt, J., Alfè, D., and Price, G. D. (2006). Elasticity of Mg2SiO4 Ringwoodite at Mantle Conditions. Phys. Earth Planet. Interiors 157 (3‐4), 181–187. doi:10.1016/j.pepi.2006.04.002
Li, J., Zheng, Y., Thomsen, L., Lapen, T. J., and Fang, X. (2018). Deep Earthquakes in Subducting Slabs Hosted in Highly Anisotropic Rock Fabric. Nat. Geosci 11, 696–700. doi:10.1038/s41561-018-0188-3
Li, B. (2004). Compressional and Shear Wave Velocities of Ringwoodite γ-Mg2SiO4to 12 GPa. Am. Mineral. 88 (8-9), 1312–1317. doi:10.2138/am-2003-8-913
Liu, L., Du, J., Zhao, J., Liu, H., Gao, H., and Chen, Y. (2009). Elastic Properties of Hydrous Forsterites under High Pressure: First-Principle Calculations. Phys. Earth Planet. Interiors 176 (1), 89–97. doi:10.1016/j.pepi.2009.04.004
Liu, L., Lv, C.-J., Zhuang, C.-Q., Yi, L., Liu, H., and Du, J.-G. (2015). First-Principles Simulation of Raman Spectra and Structural Properties of Quartz up to 5 GPa. Chin. Phys. B 24 (12), 127401. doi:10.1088/1674-1056/24/12/127401
Liu, L., Yi, L., Liu, H., Li, Y., Zhuang, C.-Q., Yang, L.-X., et al. (2018). The Structure and Elasticity of Phase B Silicates under High Pressure by First Principles Simulation. Chin. Phys. B 27 (4), 047402. doi:10.1088/1674-1056/27/4/047402
Lv, C.-J., Liu, L., Gao, Y., Liu, H., Yi, L., Zhuang, C.-Q., et al. (2017). Structural, Elastic, and Vibrational Properties of Phase H: A First-Principles Simulation. Chin. Phys. B 26 (6), 067401. doi:10.1088/1674-1056/26/6/067401
Mayer, I. (1995). Non-Orthogonal Localized Orbitals and Orthogonal Atomic Hybrids Derived from Mulliken’s Population Analysis. Chem. Phys. Lett. 242 (4-5), 499–506. doi:10.1016/0009-2614(95)00748-S
Mouhat, F., and Coudert, F.-X. (2014). Necessary and Sufficient Elastic Stability Conditions in Various Crystal Systems. Phys. Rev. B 90, 22. doi:10.1103/PhysRevB.90.224104
Musgrave, M. J. P. (1970). Crystal Acoustics: Introduction to the Study of Elastic Waves and Vibrations in Crystals. San Francisco: Holden Day.
Nielsen, O. H., and Martin, R. M. (1983). First-Principles Calculation of Stress. Phys. Rev. Lett. 50 (9), 697–700. doi:10.1103/PhysRevLett.50.697
Palke, A. C., Stebbins, J. F., Geiger, C. A., and Tippelt, G. (2015). Cation Order-Disorder in Fe-Bearing Pyrope and Grossular Garnets: A 27Al and 29Si MAS NMR and 57Fe Mossbauer Spectroscopy Study. Am. Mineral. 100 (2-3), 536–547. doi:10.2138/am-2015-5062
Pamato, M. G., Kurnosov, A., Boffa Ballaran, T., Frost, D. J., Ziberna, L., Giannini, M., et al. (2016). Single Crystal Elasticity of Majoritic Garnets: Stagnant Slabs and Thermal Anomalies at the Base of the Transition Zone. Earth Planet. Sci. Lett. 451, 114–124. doi:10.1016/j.epsl.2016.07.019
Perdew, J. P., Burke, K., and Ernzerhof, M. (1996). Generalized Gradient Approximation Made Simple. Phys. Rev. Lett. 77 (18), 3865–3868. doi:10.1103/PhysRevLett.77.3865
Ringwood, A. E., and Major, A. (1970). The System Mg2SiO4 Fe2SiO4 at High Pressures and Temperatures. Phys. Earth Planet. Interiors 3 (2), 89–108. doi:10.1016/0031-9201(70)90046-4
Ringwood, A. E. (1991). Phase Transformations and Their Bearing on the Constitution and Dynamics of the Mantle: Geochim. Geochim. Cosmochim. Ac. 55 (8), 2083–2110. doi:10.1016/0016-7037(91)90090-R
Sawamoto, H., Weidner, D. J., Sasaki, S., and Kumazawa, M. (1984). Single-Crystal Elastic Properties of the Modified Spinel (Beta) Phase of Magnesium Orthosilicate. Science 224 (4650), 749–751. doi:10.1126/science.224.4650.749
Segall, M. D., Pickard, C. J., Shah, R., and Payne, M. C. (1996a). Population Analysis in Plane Wave Electronic Structure Calculations. Mol. Phys. 89 (2), 571–577. doi:10.1080/002689796173912
Segall, M. D., Shah, R., Pickard, C. J., and Payne, M. C. (1996b). Population Analysis of Plane-Wave Electronic Structure Calculations of Bulk Materials. Phys. Rev. B 54 (23), 16317–16320. doi:10.1103/PhysRevB.54.16317
Sham, L. (1965). A Calculation of the Phonon Frequencies in Sodium. Proc. R. Soc. Lond. A. 283 (1392), 33–49. doi:10.1098/rspa.1965.0005
Shearer, P. M. (1990). Seismic Imaging of Upper-Mantle Structure with New Evidence for a 520-km Discontinuity. Nature 344 (6262), 121–126. doi:10.1038/344121a0
Shearer, P. M. (1996). Transition Zone Velocity Gradients and the 520-km Discontinuity. J. Geophys. Res. 101 (B2), 3053–3066. doi:10.1029/95JB02812
Sinogeikin, S. V., Katsura, T., and Bass, J. D. (1998). Sound Velocities and Elastic Properties of Fe-Bearing Wadsleyite and Ringwoodite. J. Geophys. Res. 103 (B9), 20819–20825. doi:10.1029/98JB01819
Sinogeikin, S. V., Bass, J. D., and Katsura, T. (2003). Single‐Crystal Elasticity of Ringwoodite to High Pressures and High Temperatures: Implications for 520 Km Seismic Discontinuity. Phys. Earth Planet. Inter. 136 (1‐2), 41–66. doi:10.1016/S0031-9201(03)00022-0
Sun, N. (2019). High Pressire-Temperature Experimental Studies on the Physical Properties of Lower-Mantle Minerals. [dissertation]. Hefei(Anhui): University of Science and Technology of China.
Umemoto, K., Wentzcovitch, R. M., Wu, S., Ji, M., Wang, C.-Z., and Ho, K.-M. (2017). Phase Transitions in MgSiO3 post-perovskite in Super-Earth Mantles. Earth Planet. Sci. Lett. 478, 40–45. doi:10.1016/j.epsl.2017.08.032
Wang, Y., Xu, M., Yang, L., Yan, B., Qin, Q., Shao, X., et al. (2020). Pressure-Stabilized Divalent Ozonide CaO3 and its Impact on Earth's Oxygen Cycles. Nat. Commun. 11 (1), 4702. doi:10.1038/s41467-020-18541-2
Wei, S. S., and Shearer, P. M. (2017). A Sporadic Low‐Velocity Layer Atop the 410 Km Discontinuity beneath the Pacific Ocean. J. Geophys. Res. Solid Earth 122 (7), 5144–5159. doi:10.1002/2017JB014100
Weidner, D. J., Sawamoto, H., Sasaki, S., and Kumazawa, M. (1984). Single-Crystal Elastic Properties of the Spinel Phase of Mg2SiO4. J. Geophys. Res. 89 (B9), 7852–7860. doi:10.1029/JB089iB09p07852
Wookey, J., Kendall, J.-M., and Barruol, G. (2002). Mid-Mantle Deformation Inferred from Seismic Anisotropy. Nature 415, 777–780. doi:10.1038/415777a
Wu, Z., and Wentzcovitch, R. M. (2016). Composition Versus Temperature Induced Velocity Heterogeneities in a Pyrolitic Lower Mantle. Earth Planet. Sci. Lett. 457, 359–365. doi:10.1016/j.epsl.2016.10.009
Zha, C. S., Duffy, T. S., Mao, H. K., Downs, R. T., Hemley, R. J., and Weidner, D. J. (1997). Single‐Crystal Elasticity of β‐Mg2SiO4 to the Pressure of the 410 Km Seismic Discontinuity in the Earth’s Mantle. Earth Planet. Sci. Lett. 147 (1‐4), E9–E15. doi:10.1016/S0012-821X(97)00010-1
Zhang, P., Kong, C.-G., Zheng, C., Wang, X.-Q., Ma, Y., Feng, J.-B., et al. (2015a). First-Principles Study of Structure and Nonlinear Optical Properties of CdHg(SCN) 4 crystal. Chin. Phys. B 24 (2), 024221. doi:10.1088/1674-1056/24/2/024221
Zhang, S., Cottaar, S., Liu, T., Stackhouse, S., and Militzer, B. (2015b). High-pressure, Temperature Elasticity of Fe- and Al-Bearing MgSiO3: Implications for the Earth’s Lower Mantle. Earth Planet. Sci. Lett. 434, 264–273. doi:10.1016/j.epsl.2015.11.030
Zhang, J. S., Bass, J. D., and Schmandt, B. (2018). The Elastic Anisotropy Change Near the 410‐km Discontinuity: Predictions from Single‐Crystal Elasticity Measurements of Olivine and Wadsleyite. J. Geophys. Res. Solid Earth 123 (4), 2674–2684. doi:10.1002/2017JB015339
Zhao, W., Dong, Z., Shao, X.-H., Lu, Y., and Zhang, P. (2015). First-Principles Study of Structural, Elastic, and Thermodynamic Properties of ZrHf alloy. Chin. Phys. B 24 (4), 043102. doi:10.1088/1674-1056/24/4/043102
Keywords: structure, electrical properties, elastic and anisotropic properties, CaO3, mantle transition zone, high pressure, first-principles simulation
Citation: Wang H, Liu L, Yang L, Sun F, Yi L and Liu H (2022) The Structure and Elasticity of CaO3 Under High Pressure by First-Principles Simulation. Front. Earth Sci. 10:848763. doi: 10.3389/feart.2022.848763
Received: 05 January 2022; Accepted: 17 January 2022;
Published: 16 February 2022.
Edited by:
Lidong Dai, Institute of Geochemistry (CAS), ChinaReviewed by:
Jin Liu, Center for High Pressure Science and Technology Advanced Research, ChinaQiaomu Qi, Chengdu University of Technology, China
Copyright © 2022 Wang, Liu, Yang, Sun, Yi and Liu. This is an open-access article distributed under the terms of the Creative Commons Attribution License (CC BY). The use, distribution or reproduction in other forums is permitted, provided the original author(s) and the copyright owner(s) are credited and that the original publication in this journal is cited, in accordance with accepted academic practice. No use, distribution or reproduction is permitted which does not comply with these terms.
*Correspondence: Lei Liu, bGl1bGVpQGllZi5hYy5jbg==