
95% of researchers rate our articles as excellent or good
Learn more about the work of our research integrity team to safeguard the quality of each article we publish.
Find out more
ORIGINAL RESEARCH article
Front. Earth Sci. , 22 February 2022
Sec. Geohazards and Georisks
Volume 10 - 2022 | https://doi.org/10.3389/feart.2022.811658
This article is part of the Research Topic Near-earth Electromagnetic Environment and Natural Hazards Disturbances View all 10 articles
Due to the complex processes of earthquake preparation, the observations and studies associated with earthquakes have attracted the attention of geophysicists for many years. The CSES was successfully launched on 2 February 2018. This satellite can provide global data of the electromagnetic field, plasma, and energetic particles in the ionosphere to monitor and study the ionospheric perturbations associated with earthquakes. Focusing on the characteristics of CSES, a spatial analysis method was proposed to extract the disturbances of electron density prior to earthquakes. Taking Indonesia Mw6.9 earthquake that occurred on 5 August 2018 as an example, the spatial method was illustrated and verified by another analysis method also using the data of electron density and GPS TEC data with the same analysis method. Based on the electron density of CSES for more than 2 years, this method was applied to carry out the statistical study prior to Mw ≥ 6.0 global earthquakes using the superposed epoch and space approach (SESA) method. It was found that 1) relative to the epicenters, seismo-ionospheric disturbances are more obvious in the equator direction than those in the polar direction; 2) the anomalies within 300 km distance from the epicenter are significant 11, 3, and 2 days prior to Mw ≥ 6.0 earthquakes; 3) the influence region of perturbances associated with earthquakes enlarges with the magnitude increase, and the stronger magnitude is the earlier disturbance appears. These statistical characteristics were not detected for the random earthquakes. Comparing the statistical result with the simulation output, the electric field pathway could be considered as the main channel of lithosphere–atmosphere–ionosphere coupling.
The abnormal ionospheric plasma density variations before and/or after earthquakes have attracted much attention from the geophysicists for many years (e.g., Pulinets and Legen’ka, 2003; Pulinets and Boyarchuk, 2004; Le et al., 2015). In general, ionospheric measuring techniques are categorized as ground and space observations to obtain the ionospheric parameters (Xiong et al., 1999). The former one includes the ground-based ionosonde, global position system (GPS) or global navigation satellite system (GNSS) receivers, and incoherent scatter radar (Rishbeth and Garriott 1969; Schunk and Nagy 2009). The latter involves topside ionospheric sounding and in situ observation by satellites and rockets (Pulinets, 1998; Pulinets, 2006). The total electron content (TEC) of time series and global ionosphere map (GIM) has been widely used to detect seismo-ionospheric anomalies. Focused on the earthquakes that occurred at Taiwan, Liu et al. (2000) found the critical frequency of the F2 layer (foF2) which fell below the lower threshold 1–6 days prior to Mw ≥ 6.0 earthquakes, and Liu et al. (2004a) also detected foF2 and TEC both decreased 4 days before M ≥ 5.0 earthquakes. The GPS TEC data for 11 Sulawesi earthquakes from 1993 to 2002 were analyzed by Saroso et al. (2008), and they reported the negative anomalies of TEC within 2–7 days before earthquakes. Liu et al. (2009) found the GPS TEC at the epicenters decreased 3–5 days before 17 M ≥ 6.3 earthquakes among 35 M ≥ 6.0 earthquakes in China. Kon et al. (2011) indicated the TEC-positive anomalies 1–5 days before M ≥ 6.0 earthquakes in Japan and within 1,000 km from the epicenters by analyzing GIM TEC data. Combining the observation data of GNSS ground receivers and ionosondes, Liu et al. (2018) constructed a three-dimensional tomography of ionospheric electron density to further understand the structure and dynamics of seismo-ionospheric precursors.
The first report mentioned the seismo-ionospheric perturbations detected by a satellite could be attributed to the beginning of 1980s (Larkina et al., 1983; Gokhberg et al., 1983a; Gokhberg et al., 1983b). With the continuous launch of low-Earth orbital (LEO) satellites, studies about topside electron density (Ne) disturbances related to earthquakes have been reported, which makes the major contribution toward understanding the nature of the seismo-ionospheric coupling. Based on Cosmos-1809 satellite data, Chmyrev et al. (1997) found the Ne disturbances with dNe/Ne ≈ 3%–8% from minutes to hours before 5 aftershocks of Spitak earthquakes that occurred on December 7, 1988. Using the topside sounding of Alouette, AE-C, and Interkosmos-19 satellites, Pulinets and Legen’ka (2003) and Pulinets et al. (2003) established major features of the ionospheric precursors for topside foF2 or Ne, including the occurrence time of anomaly between 5 days to a few hours and the disturbance position shifting equatorward. Sarkar et al. (2007) analyzed the data of the Detection of Electro-Magnetic Emissions Transmitted from Earthquake Regions (DEMETER) satellite and found the anomalies of electron and ion densities several days before some earthquakes. Parrot (2012) used automatic software to detect the abrupt enhancement of ion density observed by the DEMETER satellite. Based on the statistical analysis of 17,366 M > 4.8 earthquakes, Parrot (2012) found that perturbations in ionospheric ion density before earthquakes are more obvious than those prior to randomly selected pseudo-earthquake events. By analyzing the electron density and temperature data from the DEMETER satellite, Liu et al. (2014) extracted the disturbances of plasma parameters before 49 earthquakes among 82 Ms ≥ 7.0 earthquakes during 2005–2010. Ryu et al. (2014) reported the equatorial ionization anomaly (EIA) enhancements prior to M > 5.0 earthquakes in the low-latitude region based on the statistical analysis of Ne measured by the DEMETER satellite. Yan et al. (2017) applied the statistics method to analyze the ion density of the DEMETER satellite and found that perturbations occur around 200 km from the epicenters in 5 days before the earthquakes. De Santis et al. (2019) carried out a statistical study of 1,312 M > 5.5 earthquakes and found that the in situ ionospheric precursors are significant from a few days to 80 days before earthquakes by analyzing the electron density and magnetic field data of Swarm constellation.
The China Seismo-Electromagnetic Satellite (CSES), which is also called ZhangHeng-1 (ZH-1), was successfully launched on 2 February 2018. CSES can provide global electromagnetic data to study the seismo-ionospheric perturbations, especially those due to the strong earthquakes (Shen et al., 2018a). From the comparisons between CSES Ne and other observations/models (Wang et al., 2019; Yan et al., 2020; Liu et al., 2021), it confirms that the Ne data can reliably reveal the ionospheric characteristics at the satellite altitude of 507 km. So far, using the CSES data, some case studies of seismo-ionospheric disturbances have been reported (e.g., Yan et al., 2018; Piersanti et al., 2020; Song et al., 2020; Zhang et al., 2020). A statistical study was carried out by Li et al. (2020) based on 1-year Ne data. Using Ne data of CSES during 10 non-contiguous months, De Santis et al. (2021) analyzed the statistical correlation between ionospheric anomalies and M5.5 + shallow earthquakes. However, different analysis methods, long time data, and more cases studies are also needed to detect the characteristics of seismo-ionospheric disturbances. In this work, according to the characteristics of CSES, a spatial analysis method for identifying the seismo-ionospheric disturbances was proposed. Then, taking Indonesia Mw6.9 earthquake that occurred on 5 August 2018 as an example, this method was verified using other methods and observations. Finally, a statistical study prior to Mw ≥ 6.0 global earthquakes was carried out to investigate the characteristics of seismo-ionospheric anomalies using the CSES Ne data from 1 May 2018 to 30 September 2020.
The CSES, with a circular orbit, is a Sun-synchronous satellite. The altitude of this satellite is 507 km, and its inclination is 97.4°. The ascending and descending nodes are 02:00 LT (local time) and 14:00 LT, respectively. The revisiting cycle of CSES is 5-day, so the global electromagnetic environment in the topside ionosphere can be obtained every 5 days. CSES is equipped with eight scientific payloads (Shen et al., 2018b), including a high-precision magnetometer (HPM), an electric field detector (EFD), a search coil magnetometer (SCM), a plasma analyzer package (PAP), a Langmuir probe (LAP), a high energetic particle package (HEPP), high energetic particle detector (HEPD), a GNSS occultation receiver (GOR), and a tri-band beacon (TBB).
In this work, the Ne data observed by a LAP payload were downloaded from the website http://www.leos.ac.cn/. The Ne range of LAP measurement is 5 × 10²–1 × 107 cm−3, with the relative accuracy of 10% (Liu et al., 2019). Two sensors are equipped on the LAP payload. Sensor 1 is a larger one with the diameter of 5 cm, and the diameter of sensor 2 is 1 cm, which is designed as a backup. All the data used in this study were derived from sensor 1. CSES includes two operation modes, survey and burst modes. When the satellite flies over China, the Circum-Pacific, and Eurasia seismic belts, the burst mode will be automatically triggered with higher time resolution—1.5 s. In other places, the satellite works in the survey mode with a 3-s sampling rate.
The time and location of satellite data are both changing along the flight orbit. Unlike the ionospheric observation by remote sensing on the ground, such as TEC or foF2 data, some well-known analytical methods (e.g., running mean method) cannot be applied to analyze the satellite data. Based on the characteristics of CSES data, a spatial analysis method was proposed in this study.
The local time of descending and ascending nodes for CSES is 14:00 (LT) and 02:00 (LT), which represent the daytime and nighttime observations. In a certain local time, the global Ne distribution can be considered as within the same spatial environment; thus, the satellite observations in each day were divided into two groups (daytime and nighttime data) to carry out the spatial analysis. Three steps were taken to extract Ne disturbances before earthquakes. First, the dataset was divided into 2.5° (latitude)×5° (longitude) cells, selecting a geomagnetically quiet day as an example (the nighttime data on 29 July 2018 shown in Figure 1A). The median value of the data falling into each cell was calculated to represent the observational values in every day (Figure 1B). We used median value, instead of mean value, to exclude some eventual spikes from the data. Regarding the number of data to calculate the median value, the cell is 2.5° in latitude, which means a number of survey and burst mode data in each cell is about 13 and 26, respectively. Second, the relative change (Rc) was obtained using the following expression:
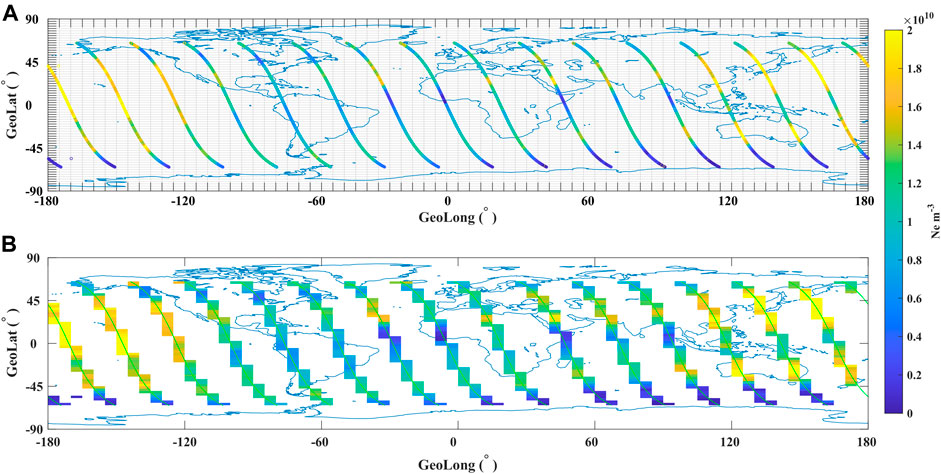
FIGURE 1. Ne distribution of global data in the nighttime on 28 July 2018 from CSES. (A) Raw data along the orbits and the 2.5°(latitude)×5°(longitude) cells. (B) Median values in each cell, which is utilized to exhibit the Ne distribution in 1 day.
where Od is observation data calculated according to the first step, and Bd represents the background, which is the median value of 27-day data before Od. Due to the solar rotation, the ionospheric parameters, for example, topside Ne, also show variations with a 27-day period (Brace et al., 1987; Rich et al., 2003; Min et al., 2009). Therefore, a 27-day window was selected to obtain the ionospheric background. Finally, maximum or minimum values of Rc for 1 day were considered as disturbances potentially related to earthquakes if:
- far from high latitudes (excluding disturbances from the polar region);
- occurring in the geomagnetically quiet day (F10.7 < 160 and Kp < 3 and |Dst|<30nT); and
- just appearing near the epicenter, exhibiting the local characteristics.
The ionosphere is a complex system affected by many sources, such as the solar, geomagnetic storms, substorms, planetary waves, and tides. The disturbances caused by these aforementioned sources usually cover a large scale (Schunk and Sojka, 1996; Tsurutani, 2004; Liu et al., 2011), which means the extrema of Ne relative change may not only appear in the seismic region; thus, local anomalies just around the epicenters may have a potential relationship with earthquakes (Pulinets et al., 2021).
At the southwest of Loloan, Indonesia, a Mw6.9 earthquake with the location of 8.258°S, 116.438°E occurred at 11:46:38 (UT, universal time) on 5 August 2018. Focused on this earthquake, some research studies have been made by analyzing CSES data. Zhang et al. (2020) found the signal-to-noise ratio (SNR) for VLF transmitters of NWC and JJI stations reduced around the epicenter within 10 days prior to the earthquake. Song et al. (2020) extracted the Ne disturbances in the daytime and nighttime on 31 July. Based on atmospheric temperature, GPS TEC, EFD, and LAP data of CSES, Piersanti et al. (2020) reported the existence of atmospheric gravity waves (AGWs) 6 h before the earthquake and the co-seismic phase. We also selected this earthquake as an example to verify the spatial analysis method.
Before the analysis, the 10.7-cm solar radio flux (F10.7), Kp, Dst, and AE indices were checked to analyze the active solar and geomagnetic environment, which is shown in Figure 2. The level of solar activity was low, and the geomagnetic environment was relatively quiet during this period, except for some magnetic perturbations on 21, 24, and 25 July for Kp more than 3 and AE more than 500 nT. Using the spatial analysis method, relative changes of Ne data observed by CSES in the daytime and nighttime were analyzed from 21 July to 5 August 2018, which includes 15 days before and the occurrence day of Indonesia Mw6.9 earthquake. During geomagnetically quiet days, there were 2 days for daytime data, in which the maximum of Ne relative change just occurred around the epicenter. On 31 July (Figure 3A), the maximum of relative Ne was found in the northeastern direction of the epicenter, while the value decreased at the northwest. The enhancements at the west of the epicenter and its conjugate point were detected on 4 August (Figure 3B), and the maximum of Ne relative change reached up to 120%. Marchetti et al. (2020) analyzed the ionospheric data before Mw7.5 Indonesia earthquake (0.258°S, 119.845°E) occurred on 28 September 2018 and detected magnetic field anomalies in the Y-component by Swarm constellation on 31 July and CSES HPM payload on 4 August. Although they were different earthquakes, the locations of the two cases were not far. The magnetic field anomalies in the 2 days may have some relationships with disturbances of electron density detected by our study. The synchronous anomalies of magnetic field, electron field, and plasma parameters prior to earthquakes were also reported using the DEMETER satellite (Zhang et al., 2010; Zhang et al., 2011) and CSES (Piersanti et al., 2020) observation data.
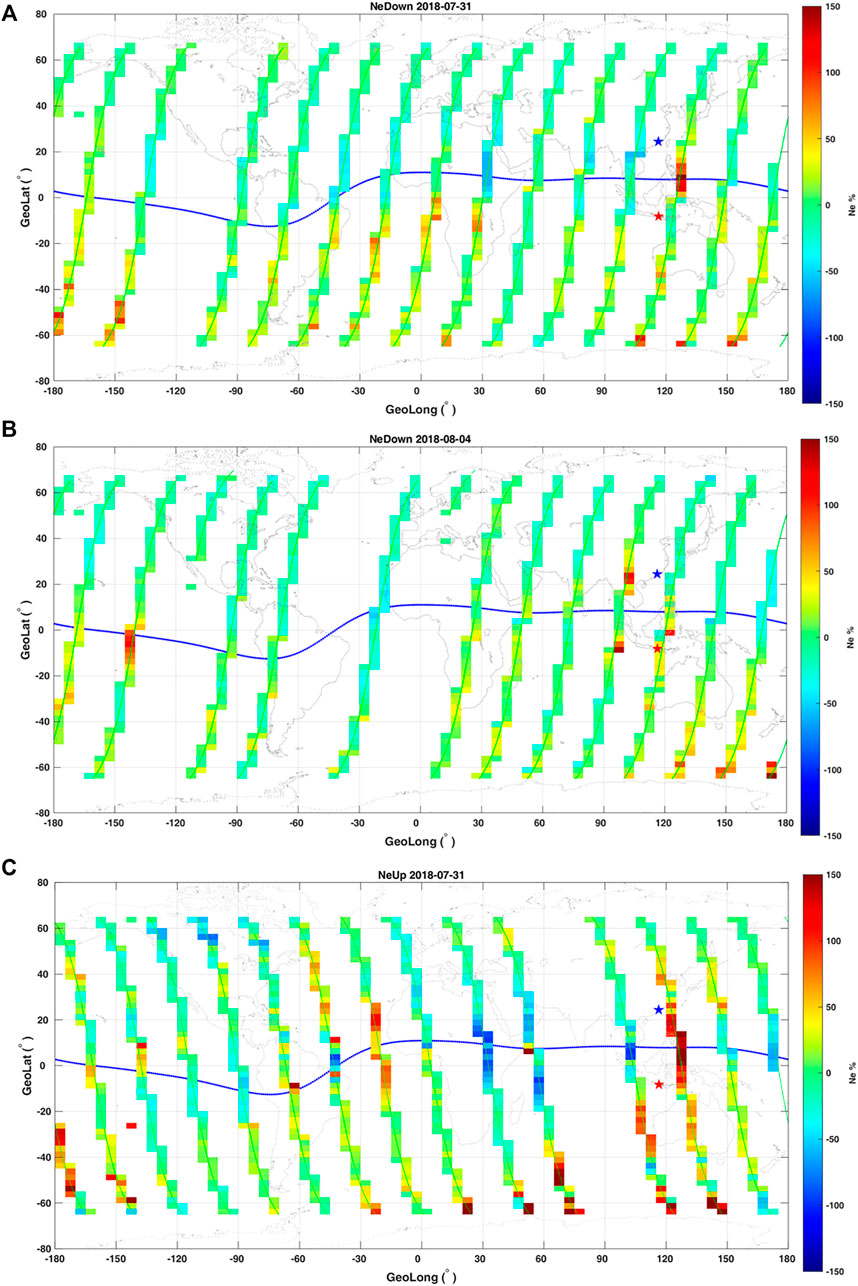
FIGURE 3. Relative change of Ne data observed by CSES in the daytime on 31 July (A), August 4 (B), and in the nighttime on 31 July (C). Blue line represents the magnetic equator. Green lines are the flight orbits of CSES. Red star shows the epicenter, and blue one indicates its conjugate point.
Among these 16-day data in the nighttime, one disturbance was found using the spatial analysis method during geomagnetically quiet days. At the east of epicenter, the maximum of Ne relative change was located around the magnetic equator on 31 July, and the highest value was about 270% (Figure 3C). On the other side, the electron density decreased at the northwest of epicenter. In the nighttime, the equatorial plasma bubble (EPB) is another phenomenon of local disturbances. Based on the study of Kil and Heelis (1998), the EPB mainly occurs during 19:00 (LT)–21:00 (LT) and its occurrence decays after midnight. Furthermore, besides the large density depletion for EPB, the density in the depletion region is irregular (Hanson and Urquhart, 1994; Xiong et al., 2010). The local time of CSES ascending node is 02:00 LT, when the occurrence of EPB decays. An example of EPB for CSES (red line in Figure 4) was shown to compare with the disturbances in the nighttime on 31 July (blue line in Figure 4). The electron density slightly increased around the latitude of epicenter, and a peak emerged around the latitude of epicenter conjugate point on 31 July (above the blue star). The irregular shape like the EPB was not detected from the pattern of Ne. Therefore, the source of local anomaly in the nighttime on 31 July was different from that of EPB. The positive anomalies of Ne deviation during the daytime and nighttime on 31 July were also detected by Song et al. (2020), while the disturbance on 4 August was not reported by them. Although both of us paid attention to the Ne deviation, the different periods of background and different resampling resolution brought differences in detected anomalies.
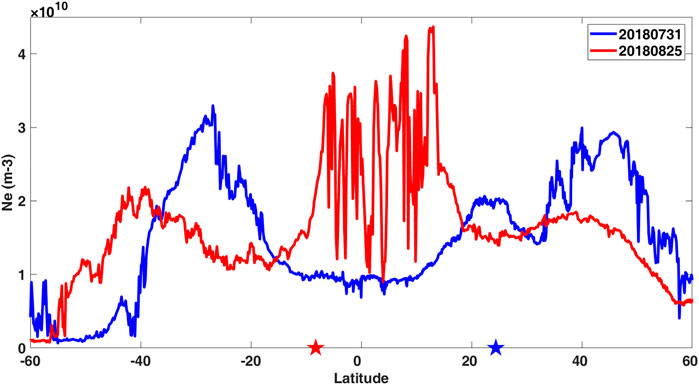
FIGURE 4. Electron densities distribute along the latitude for two orbits in the nighttime. Blue line is on 31 July 2018. Red line is on 25 August 2018. Note that the Ne change around the magnetic equator for the orbit on 25 August 2018 is affected by EPB. Red and blue stars represent the epicenter of Indonesia Mw6.9 earthquake and its conjugate point, respectively.
The CSES strictly revisits previous orbits, so observation data in the same place can be obtained for each 5 days. In order to confirm the anomalies extracted using the spatial analysis method, revisiting data analysis was carried out to check if the observation data of extracted anomalies have some differences in the value and pattern from those of other revisiting orbits over the same place. The data of three revisiting orbits before and two after the anomalies were selected, which means that the time range of analyzing data can cover almost 1 month.
Figures 5A,B show the Ne distribution along the latitude in the daytime on 31 July, 4 August, and their revisiting dates which are marked in the legend. The red and blue stars represent the epicenter and its conjugate point, respectively, and the latitude of two blue lines has 20° distance from that of epicenter. The electron density in the northern direction of epicenter on 31 July exceeded the data of other revisiting orbits during 1 month (Figure 5A). The AE values on 16 July were higher than 500 nT. It was considered that in this day, the Ne enhancement around the magnetic equator and the ionospheric irregularities at the high and middle latitudes in the southern hemisphere may have a potential relationship with the substorm. On 4 August (Figure 5B), the Ne value near the epicenter was slightly higher than that of other orbits, except the data on 14 August. The Ne pattern on 14 August exhibited the spreading of equator crests, which may be caused by an eastward electric field around the magnetic equator, just like the phenomenon of ionospheric fountain effect (Anderson, 1981; Walker et al., 1994). The obvious enhancement around the conjugate point was detected compared with the other revisiting data. As the season of August is local summer for the northern hemisphere, the content of electron density is higher in the northern hemisphere than that in the southern hemisphere. If there were some disturbance sources, the change of electron density may be stronger in the northern hemisphere for the relative high value of background data. However, the influence of seasonal variation can be reduced by subtracting the background for the spatial analysis method; thus, the enhancements of electron density were both obvious for the epicenter and its conjugate point on 4 August. The enhancement of Ne close to the equator on 9 August may be caused by day-to-day variation in the ionosphere, for a little high F10.7 index. Figure 5C shows the electron density change of revisiting orbits in the nighttime on 31 July. Except for the jumps on 16 July (AE more than 500 nT), the Ne data on 31 July were higher than those of other revisiting orbits above the epicenter and its conjugate point. Possibly affected by the influence of seasonal variation, the anomaly of conjugate point was more obvious than that of the epicenter. In a word, disturbances detected by the spatial analysis method also exhibited some differences from the revisiting data around the epicenter and its conjugate point, which means the spatial analysis method proposed by this study could be used to extract seismo-ionospheric anomalies.
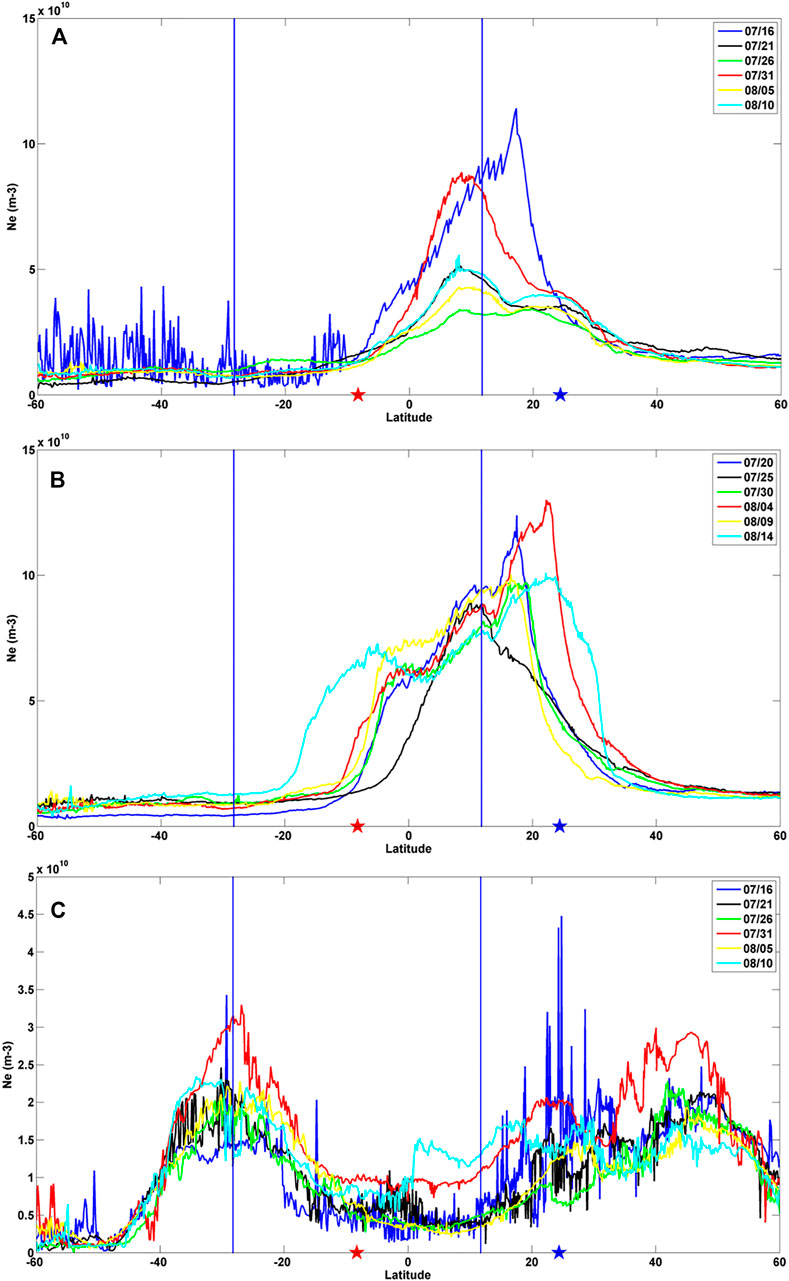
FIGURE 5. Electron densities distribute along the latitude for the revisiting orbits in the daytime on 31 July (A), 4 August (B), and in the nighttime on 31 July (C). The red curve represents the orbit with detected anomalies, and the other color curves represent its revisiting orbits whose dates are marked in the legend. The red and blue stars represent epicenter and its conjugate point, and two blue lines have the distance of 20° away from the latitude of epicenter.
From the previous analyses, some seismo-ionospheric disturbances were detected by analyzing the CSES Ne data. Except for the same observation data studied by different methods, GIM TEC data were also applied to check the synchronous perturbations.
Global/local ionospheric maps using GNSS observation data can be traced back to 1992, when Wilson and Mannucci of Jet Propulsion Laboratory (JPL) first mapped the global ionosphere with 8th order spherical harmonics (Wilson et al., 1992; Mannucci et al., 1998). The GIM TEC of JPL is supported by about 150 stations of IGS (International GNSS Service) and other organizations, with the spatial resolution of 2.5° in latitude and 5° in longitude for each 2 h, which can be downloaded from the website ftp://cddis.gsfc.nasa.gov/pub/gps/products/ionex.
In order to compare the TEC data with the electron density of CSES, GIM TEC at UT was converted to that at LT. Relative changes of GIM TEC data in the whole world at 14:00 (LT) and 02:00 (LT) were obtained using the same spatial analysis method (described in Section 3). Checking relative changes of GIM TEC when Ne disturbances occurred, the GIM TEC synchronous anomalies with Ne data were found in the daytime on 4 August, shown in Figure 6. The enhancements of TEC data were detected at the west of epicenter and its conjugate region at 14:00 (LT) on 4 August (Figure 6B), which was almost the same as the result of CSES Ne (Figure 6A). All cells in the whole world have data for GIM TEC, while the Ne median data can be obtained just for cells that the CSES flies over. Possibly affected by this reason, the region of GIM TEC anomaly was larger than that of CSES.
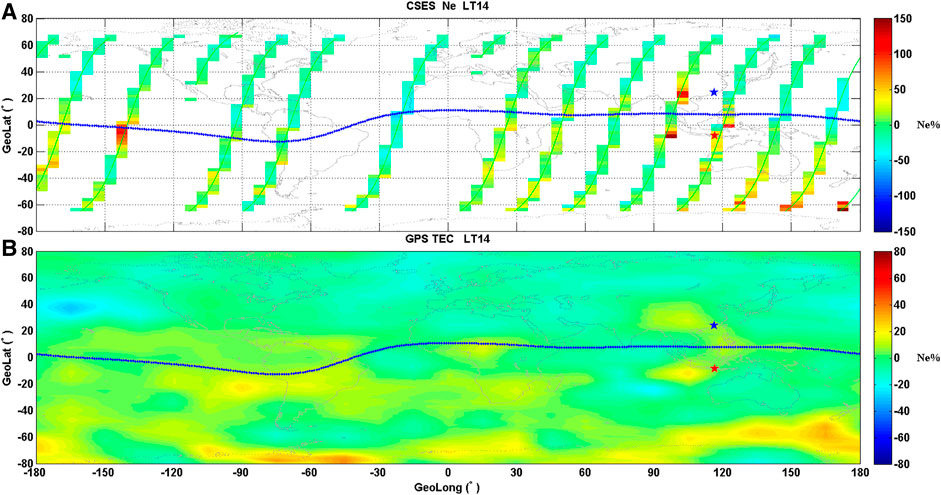
FIGURE 6. Relative change of CSES Ne (A) and GIM TEC (B) in the daytime on 4 August 2018. Blue line represents magnetic equator. Red star shows the epicenter and blue one indicates its conjugate point.
Through the same observation with different analysis methods and different data with the same analysis method, the case study showed that disturbances associated with earthquakes can be detected by the spatial analysis. Therefore, the statistical study prior to strong earthquakes was carried out using the spatial analysis method, in order to find some characteristics of seismo-ionospheric disturbances.
For the 27-day background data that will be used to extract the disturbance, the time range of selected earthquakes in the statistical study is from 1 June 2018 to 30 September 2020. The list of global Mw ≥ 6.0 earthquakes that occurred during this period was downloaded from the website of the U.S. Geological Survey (USGS, https://earthquake.usgs.gov/earthquakes/search/), which is usually considered as strong earthquakes. The earthquakes with the geomagnetic latitude exceeding ±40° were excluded to avoid the influence at the high latitude. To exclude the post-seismic effect, the earthquakes were omitted if they were within 15 days and ±10° away from the previous one. At last, 206 Mw ≥ 6.0 earthquakes were selected, and the locations of epicenters are shown in Figure 7. The summarized information of earthquakes is listed in Table 1, including the magnitude and location.
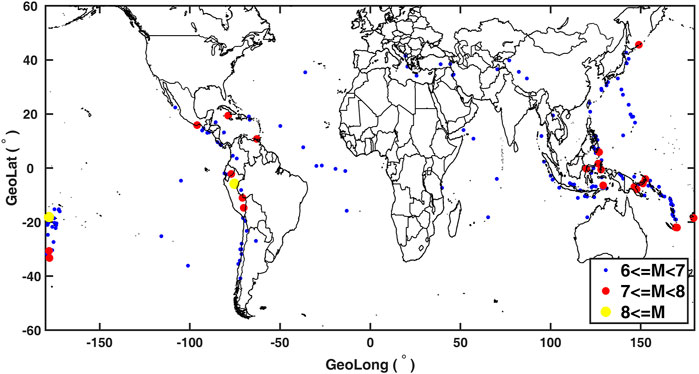
FIGURE 7. Epicenters locations of global Mw ≥ 6.0 earthquakes from 1 June 2018 to 30 September 2020. Blue points represent the earthquakes with magnitude greater than 6 but less than 7. Red points represent the earthquakes with magnitude greater than 7 but less than 8. Yellow points represent the earthquakes with magnitude greater than 8.
A dataset of Ne from 30 days before the selected earthquakes to the occurrence day was created, which includes the daytime and nighttime data during 31 days for each earthquake. According to the study of Kon et al. (2011), Hattori et al. (2013), and De Santis et al. (2021), the superposed epoch and space approach (SESA) analysis method is accepted in this statistical study. The processing procedure involves four steps. First, for each earthquake, the area within ±20° away from the epicenter was selected as the study region, which means the cell data have 17 lines with the 2.5° latitude resolution and 9 columns with the 5° longitude resolution each day. Second, if the Ne relative changes in each cell were maximum or minimum compared to the values of the rest of cells out of ±20° away from the epicenter, from which the disturbances with the latitude greater than 40° were also excluded, the observation data were considered as potential seismo-ionospheric anomalies and were automatically marked as “1” (positive anomaly) or “−1” (negative anomaly). The other data which were not the extrema were marked as “0.” We suppose that disturbances around the epicenter are significant after excluding the background and some known perturbation sources (e.g., solar activity and magnetic storm), same as the opinions of Liu et al. (2010) and Le et al. (2012). Therefore, if the Ne relative change is not the extremum around the epicenter (e.g., another higher value exists in another region), it will not be considered as a seismo-ionospheric anomaly in our study. Third, to exclude the disturbances induced by solar activity and magnetic storm, the anomalies that occurred in the day with an F10.7 ≥ 160 or Kp ≥ 3 or |Dst|≥-30 nt or AE ≥ 500 nT were omitted and were also marked as “0.” Finally, the markers (“−1,” “0,” and “−1”) for 206 earthquakes during the daytime and nighttime were superposed together to obtain the SESA result.
The distributions of disturbances were exhibited in equator-polar direction for earthquakes locating in the geomagnetically southern or northern hemispheres. The summed result from 15 days before earthquakes to the occurrence day is shown in Figure 8. Both the positive and negative anomalies in the equator direction of epicenters were more obvious than those in the poleward direction of epicenters. The depletion of electron density was obvious near the epicenter 11 days before earthquakes. Around the locations of earthquakes, the positive disturbances enhanced 7 days before earthquakes and negative disturbances emerged 4 days prior to earthquakes. Three days before earthquakes, the electron density increased and decreased in the eastern and western directions, respectively. Near the occurrence of earthquakes, the anomalies around the epicenter were mainly positive in 1 day before earthquakes.
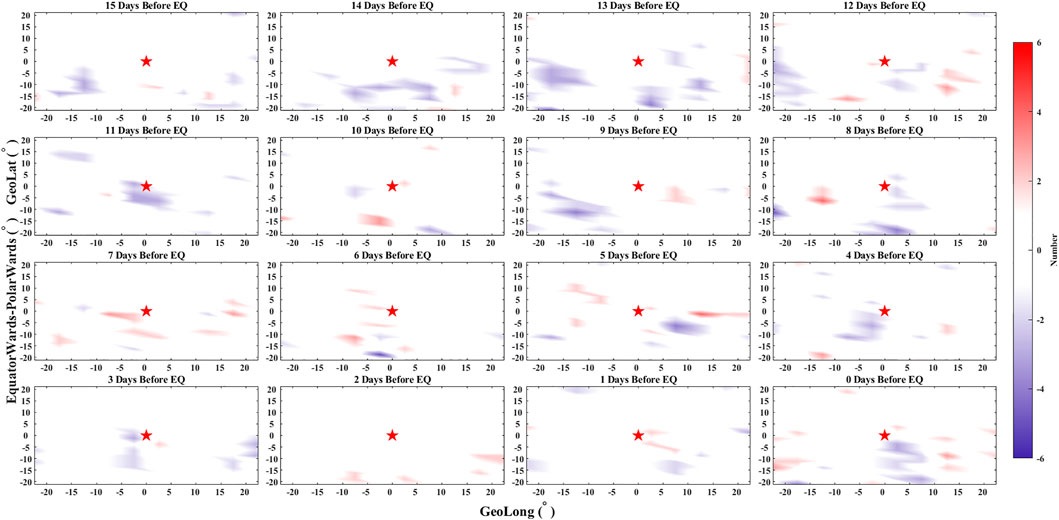
FIGURE 8. Distributions of Ne anomalies from 15 days before earthquakes to the occurrence day. The red star represents the epicenter. In each subplot, X and Y axes are degrees from the epicenter in the geographic longitude and geographic latitude, respectively. The days before earthquakes are marked on the top of each panel.
The distance between the center of each cell and epicenter was calculated to analyze the relationship of the distance from the epicenter, seismic magnitude, and occurrence time of the anomalies based on the statistical study. Meanwhile, similar to studies by Parrot (2012) and Ouyang et al. (2020), a random dataset with 206 Mw ≥ 6.0 earthquakes was obtained to carry out comparative analysis with real earthquakes. De Santis et al. (2019) compared their real results between real earthquakes and random anomalies. Although there is a little difference between De Santis et al. (2019) and our study for random events, their purpose and ours are to verify the statistical significance of real earthquakes with pseudo disturbances which have no relationship with real earthquakes. Same as real earthquakes, the spatial analysis method, anomalies excluded in the days of magnetic disturbances, and SESA statistical method were also applied to analyze random earthquakes. Through the statistical analysis of real and random earthquakes, Figures 9, 11, 12 gave out the results of seismo-ionospheric disturbances with three parameters, including the occurrence time of anomalies, seismic magnitude, and distance from the epicenter. The increase and depletion of electron density were not distinguished in these figures, and numbers of positive and negative anomalies were summed together to show the number of anomalies, which means “1” and “−1” were both counted as “1.” In order to avoid the difference brought by the sample size of distance and magnitude, the numbers of anomalies were normalized. Figures 9A,B, 11A,B, 12A,B represent statistical results of real and random earthquakes, respectively, and the colors mean normalized number by SESA.
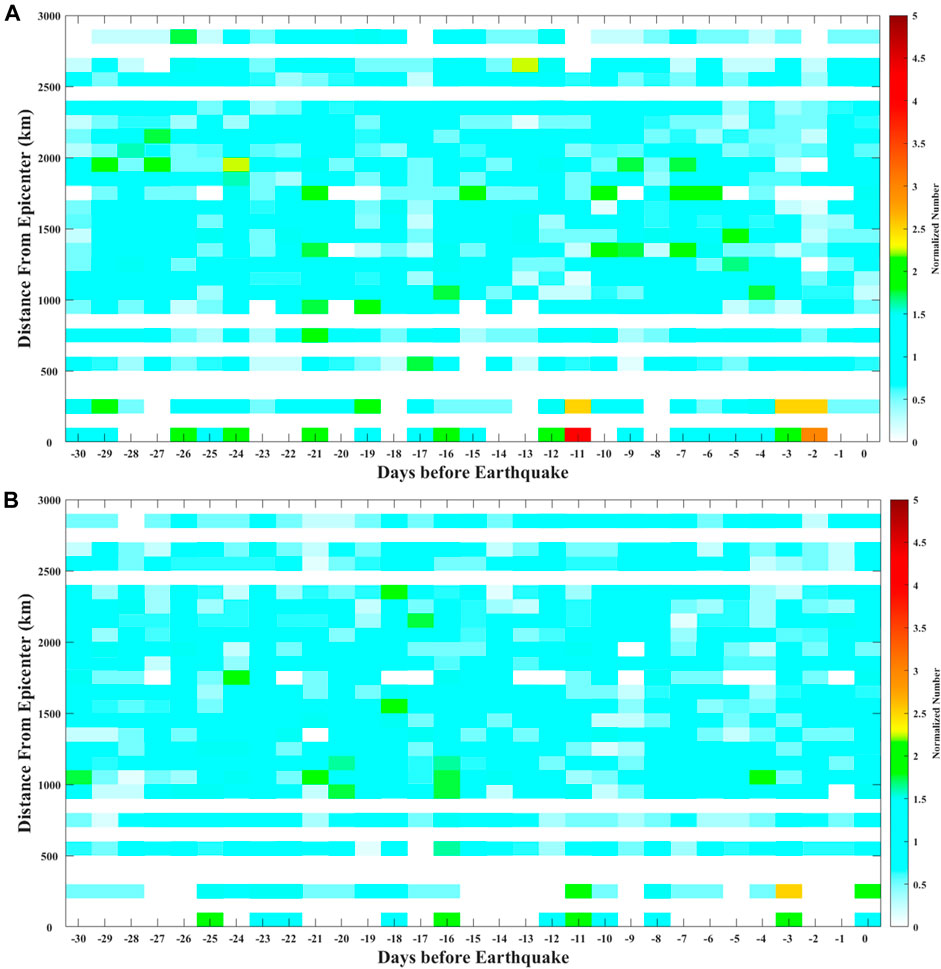
FIGURE 9. Statistical result of seismo-ionospheric disturbances with the days before earthquake (X axis) and distance from the epicenter (Y-axis) by SESA. (A,B) Statistical results of real and random earthquakes, respectively. The color represents the normalized number by SESA, which is illustrated in the text. The horizontal white band of the picture means there is no data in this distance.
A time–distance diagram is constructed in Figure 9 with 1-day step for X-axis and 100-km step for Y-axis, where the origin (0, 0) was set as the location and the temporal occurrence of each earthquake. The normalized number is the ratio between the counted number of anomalies and the number of cells with the same distance. The horizontal white band of the picture means that there is no data in this distance. In panel (A), although there are some seismo-ionospheric disturbances in other distances and days, those anomalies within 300 km from the epicenter are more obvious. De Santis et al. (2021) found the anomalies of electron density were concentrating within 380 km from epicenters by analyzing CSES data before M ≥ 5.5 shallow earthquakes. In the time, the anomalies are more in 11, 3, and 2 days prior to earthquakes. While in the result of random earthquakes (Figure 9B), anomalies randomly distribute along with the days and distances and do not exhibit the potential relationship with the distance to epicenter and occurrence time of real earthquake. It is supposed that seismo-ionospheric anomalies cannot be detected for random earthquakes, which could be considered as the background to assess the significance of real earthquakes statistics (He et al., 2021). The numbers within 300 km from the epicenter were summed in each day for real and random earthquakes. The data of real earthquakes results were plotted along with the days before earthquakes, as shown in Figure 10. The mean value (M) and standard deviation (std) of random earthquakes results in all 31 days were calculated, and M ± 2*std was selected as the upper and lower thresholds, which possess a 95% confidence interval. The numbers of anomalies in 11, 3, and 2 days prior to earthquakes all exceeded the upper threshold. According to the study of De Santis et al. (2019), the parameter d was calculated, as illustrated in Supplementary Supplementary Appendix S1. The d value of statistical result within 300 km distance from the epicenter is 1.42, and that with the distance from 300 to 3,000 km is 0.93, which verifies the statistical significance of the former one.
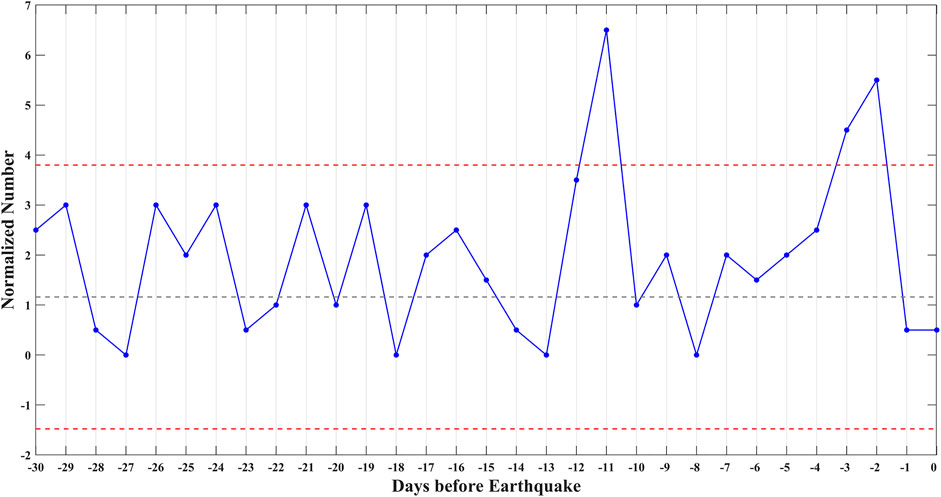
FIGURE 10. Summed number of anomalies with 300 km distance from epicenter for real earthquakes. X-axis represents the days before earthquakes. Y-axis represents the total number of the data in first three lines in Figure 9. The gray dash line is the mean value (M) of random earthquakes results in all 31 days. Red dash lines are the upper and lower thresholds with M ± 2*std, where M and std are the mean value and standard deviation of random earthquakes results in all 31 days, respectively.
To analyze the anomaly characteristics with the time and magnitude, the numbers of cells with ±20° away from the epicenter were all counted in each day for the same magnitude, which is shown in Figure 11. The normalized number represents the ratio between the counted number in 1 day and the number of earthquakes with the same magnitude. The statistical result in Figure 11A is not comprehensive for the limited sample size of Mw ≥ 8.0 earthquakes, while it can still be seen that the stronger the magnitude is, the earlier the disturbance appears. Based on the analysis of ground magnetic observations for Japan earthquakes, Rikitake (1987) proposed the general empirical law between precursor time (T) and magnitude (M) with the equation logT = a+bM, which also represents the linear relationship between the occurrence of anomalies and the magnitude of earthquakes, as confirmed by De Santis et al. (2019) for satellite data. In Figure 11, the occurrence time of disturbances prior to Mw ≥ 8.0 earthquakes can reach to 29 days. The maximum for Mw ≥ 8.0 earthquakes is earlier than that for 7.5 ≤ Mw < 8.0 earthquakes. A similar phenomenon is also exhibited for 7.5 ≤ Mw < 8.0 and 7.0 ≤ Mw < 7.5 earthquakes. Furthermore, the number of anomalies for earthquakes with a magnitude greater than 7 is larger than that for earthquakes with a magnitude less than 7. While in the result of random earthquakes (Figure 11B), normalized numbers are almost at the same level for all the days and magnitudes. The statistical characteristics of real earthquakes were not detected in the analysis of random earthquakes.
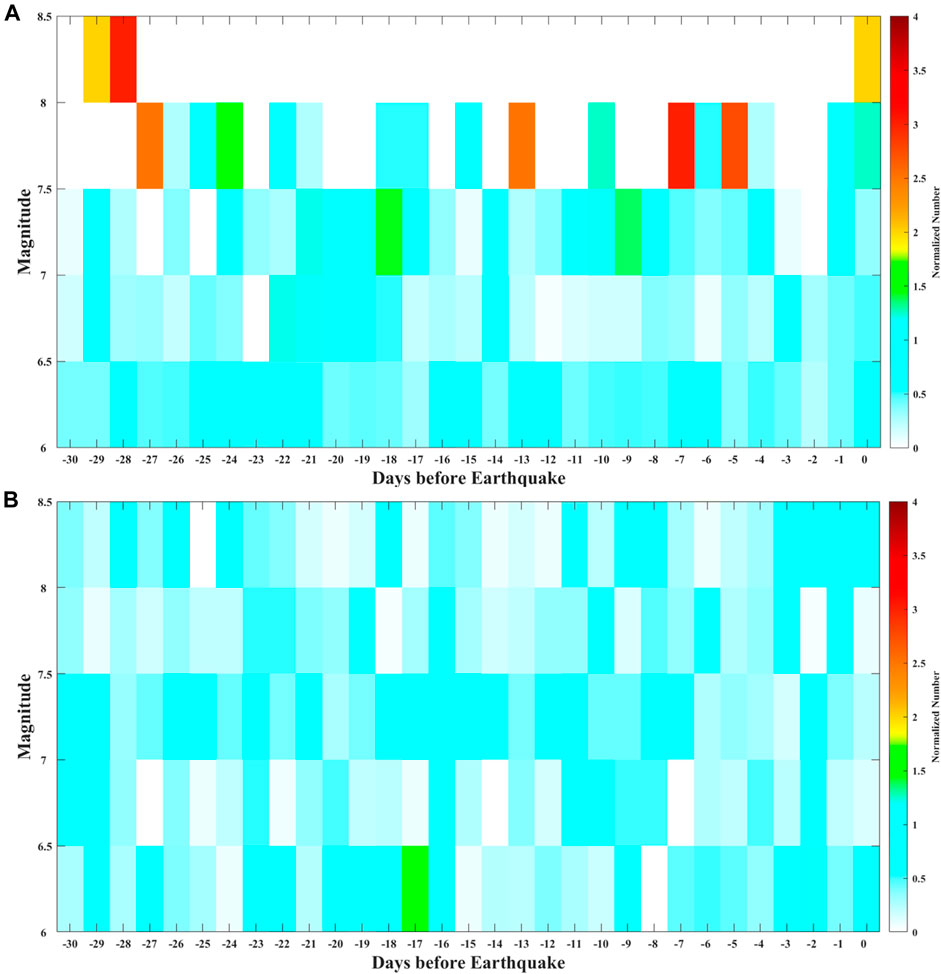
FIGURE 11. Statistical result of seismo-ionospheric disturbances with the days before earthquakes (X-axis) and seismic magnitude (Y-axis) by SESA. (A,B) Statistical results of real and random earthquakes, respectively. The color represents the normalized number by SESA, which is illustrated in the text.
The numbers in all 31 days were summed together to analyze the anomaly characteristics with the magnitude and distance, which is shown in Figure 12. The normalized number represents the ratio between the counted number and the number of earthquakes with the same magnitude and the number of cells with the same distance. In Figure 12A, with the enhancement of seismic magnitude, the influence region of the seismo-ionospheric disturbances gradually enlarges. The maximum value can be found in 2,900–3,000 km distance from the epicenter for earthquakes with the magnitude between 7.5 and 8. In the lithosphere, the preparation region of earthquakes can be estimated by the formula R = 100.43M, where R is the radius of the seismic effect zone and M is the seismic magnitude (Dobrovolsky et al., 1979). For the earthquake with a magnitude of 8.0, the R is 2,754 km, which is almost the same as the distance of statistical result. Unlike the statistical characteristics of real earthquakes, the relationship between the distance and earthquake magnitude is not obvious for random earthquakes, shown in Figure 12B.
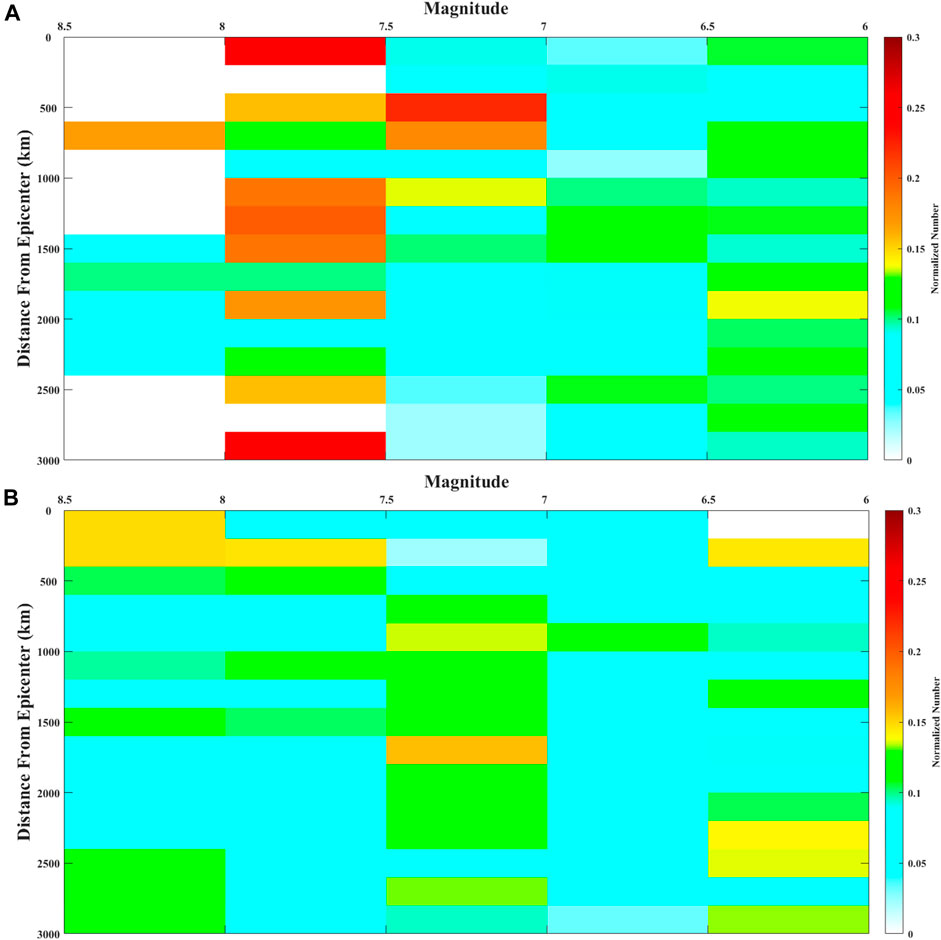
FIGURE 12. Statistical result of seismo-ionospheric disturbances with the seismic magnitude (X-axis) and distance from the epicenter (Y-axis) by SESA. (A,B) Statistical results of real and random earthquakes, respectively. The color represents the normalized number by SESA, which is illustrated in the text.
The earthquakes were divided into shallow and deep ones according to the depth greater than 60 km or not. If the counted number of all cells in the 31-day dataset was larger than 1, the anomaly associated with the earthquake was considered as successfully detected. After the calculation, the probabilities of detected anomalies are 86.03% and 91.43% for shallow and deep earthquakes, respectively. For differences between the two probabilities are not significant, it is considered that the depth of earthquake is not the main factor for detecting anomalies. Whether the disturbance can propagate to the Earth’s surface around the earthquake may mainly depend on the underground structure and material composition.
From the previous analyses, not only the case study but also the statistical result shows that the seismo-ionospheric disturbances are more obvious in the equatorward direction for earthquakes located in the geomagnetically southern or northern hemispheres. Due to E×B drifts induced by the penetration of the ground anomalous electric field into the ionosphere, researchers reported that the location of the seismo-ionospheric anomalies might shift equatorward (Pulinets and Boyarchuk, 2004; Kuo et al., 2011; Liu et al., 2014; Kuo et al., 2015). Taking Indonesia Mw6.9 earthquake as an example, a simulation study using electric field penetration and the thermosphere–ionosphere–electrodynamics general circulation model (TIEGCM, Richmond et al., 1992) was carried out, and the comparison between the output and observation was applied to further understand the seismo-ionospheric coupling mechanism.
According to Zhou et al.’s (2017) study, ionospheric electric potential equations can be obtained in spherical coordinates based on the external electric current theory. The simulation results indicate that a vertical current generated by an additional vertical electric field at the ground can flow into the ionosphere without divergence in the neutral atmosphere and consequently induce the abnormal electric field in the ionosphere. This model can be used to calculate the additional lithosphere–atmosphere–ionosphere coupling (LAIC) electric field penetration at different altitudes by taking into account the inhomogeneous conductivity. Not only the laboratory experiment but also the real observation, an upward electric field in atmosphere before earthquakes, was reported by scientists (Smirnov, 2008; Choudhury et al., 2013); thus, a vertical upward electric current was added around the epicenter (8.258°S, 116.438°E) on 31 July 2018 when the anomalies can be detected both in the daytime and nighttime. According to the observation, the magnitude of atmospheric vertical electric field before earthquakes almost reaches to the level of kV/m (Hao et al., 1998; Smirnov, 2008; Choudhury et al., 2013). The disturbed atmospheric conductivity before earthquakes was assumed as 10−12–10−11 S/m near the ground in the model for Schumann resonance (Nickolaenko et al., 2006; Galuk et al., 2020; Hayakawa et al., 2020). From the calculation using the formula J = σ*E, the magnitude of disturbed electric current near the Earth’s surface is 10−9–10−8 A/m2. Therefore, in this simulation, the maximum value of electric current was set as 8 × 10⁻⁹ A/m2. Pulinets and Boyarchuk (2004) pointed out that when the diameter of anomalous field on the ground exceeds 200 km, the vertical electric field can effectively penetrate from the ground into the ionosphere. To obtain obvious disturbance of electron density in the ionosphere, the radius of the current near the Earth’s surface was assumed as 200 km with a Gaussian distribution, which is the same as the input of Zhou et al.’s (2017) study. Through the calculation using the detailed formulations given in Supplementary Appendix S2, the distribution of electric field at the bottom of ionosphere (∼90 km) in a different direction is shown in Figure 13, which was induced by the additional electric current.
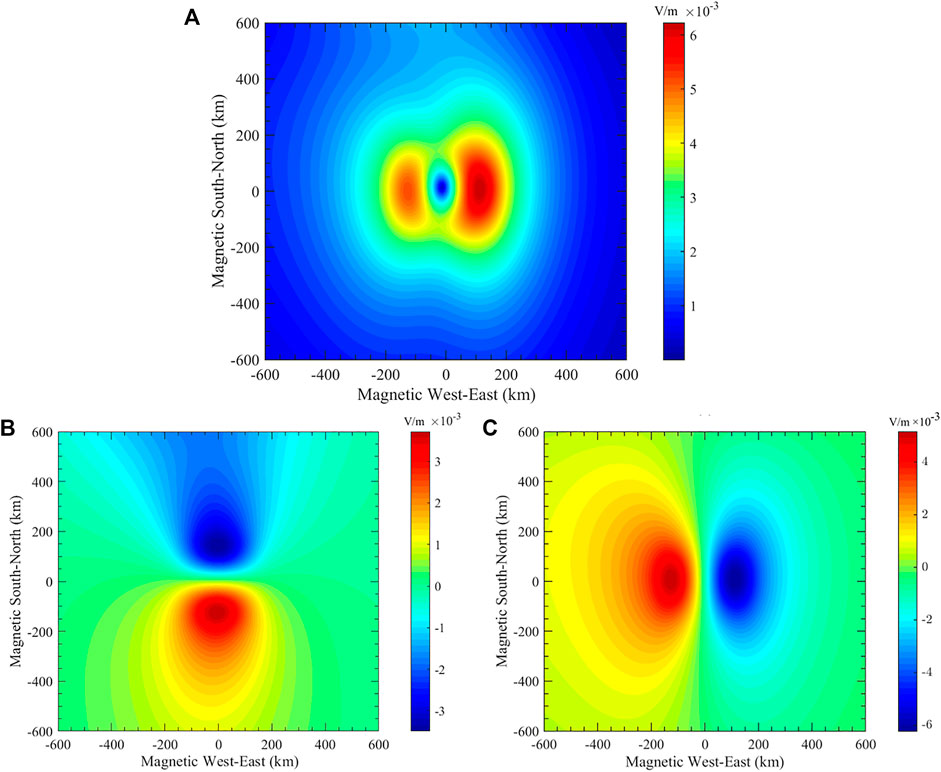
FIGURE 13. Distribution of penetrating electric field at the bottom of ionosphere (∼90 km) by LAIC simulation. (A) Total horizontal electric field. (B) Horizontal electric field in the south–north direction. (C) Horizontal electric field in the west–east direction. In each panel, X and Y coordinate axes represent magnetic west–east and south–north direction, respectively.
The National Center for Atmospheric Research (NCAR) TIEGCM is a time-dependent, three-dimensional model of the coupled thermosphere and ionosphere system. The model self-consistently solves the energy, momentum, and continuity equations of the neutral gas (Richmond et al., 1992). The horizontal resolution of the TIEGCM is 2.5°(latitude)×2.5°(longitude), and the vertical resolution is a quarter scale height from 97 to ∼500 km (Wu et al., 2012). The code of TIEGCM is open, which is available at the High Altitude Observatory website (http://www.hao.ucar.edu/modeling/tgcm/download.php). The penetrated electric field calculated from the previous simulation (Figure 13) was applied to drive the TIEGCM, in order to check the Ne anomalies at the satellite altitude. To compare the modeling output with the observation data, the Ne relative change with and without the penetrated electric field was also obtained by Eq. 1, where Od represents the modeling Ne with the penetrated electric field and Bd is the simulation Ne without this electric field.
Figure 14 shows the Ne relative change at 14:00 (LT) on 31 July 2018 at about 500 km altitude (with the same atmospheric pressure). Disturbed by the penetrating electric field, the electron density increases and decreases in the northeast and northwest directions of the epicenter, respectively. In the northern hemisphere, the location of the enhancement and depletion is symmetric with the epicenter region along the magnetic equator, which also situates in the equator direction of conjugate point. No matter in the daytime or nighttime (Figures 3A,C), the Ne disturbance on 31 July for Indonesia Mw6.9 earthquake was almost the same as the simulation output, with the patterns of increasing in the northeast and decreasing in the northwest of the earthquake locating in the geomagnetic southern hemisphere. The disturbed electric field in the ionosphere drives the electron density to move from one side to another side and makes the positive and negative anomalies exhibit the characteristics of right–left symmetry. Limited by the resolution of satellite, the circular morphology of simulation was not detected by the observation. Both positive and negative anomalies of ionospheric electron densities before earthquakes have been reported in previous studies (Liu et al., 2000; Kon et al., 2011). According to the simulation, the enhancement and depletion of electron density situate on different sides of the epicenter. Same as our result, Zhao et al. (2010) also showed that TEC positive and negative anomalies occurred on the east and west sides of the epicenter on 9 May before the Wenchuan earthquake on 12 May 2008. In addition to that, the occurrence of positive or negative anomalies can also depend on the altitude and time of observations. For the same Wenchuan earthquake, Zhang et al. (2009) reported that the oxygen-ion density at 660 km altitude decreased around the epicenter on 9 May using the DEMETER data, and Liu et al. (2009) found the negative anomalies of GIM TEC on 6 May.
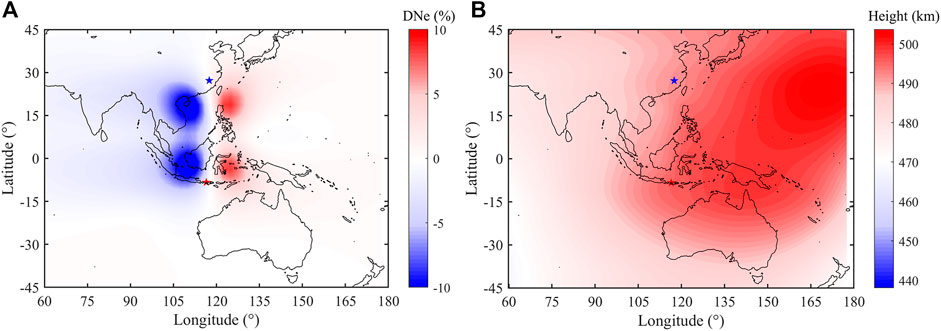
FIGURE 14. Simulation result at 14:00 (LT) on 31 July 2018. (A) Distribution of Ne relative change with and without penetrating the electric field, and (B) altitude of Ne in (A). Red and blue stars represent epicenter and its conjugate point, respectively.
In the simulation, Ne disturbance shows two peaks in the north and south of the magnetic equator. Ne relative changes in the daytime and nighttime on 31 July were plotted along the satellite orbits, as shown in Figures 15A,B. Like the simulation, there are also two peaks in the observation data, which is denoted by the red circle. Different from the simulation, no matter the daytime or nighttime, there is another strong peak around the magnetic equator. There may be two reasons that induce the differences between observations and simulations. First, limited by one satellite, the spatial resolution of CSES observation is lower than that of TIEGCM, indicating that there are no observation data in some regions. Second, in the topside of ionosphere, the ionospheric models have some differences from observation data (Bilitza et al., 2007; Lühr and Xiong, 2010; Lomidze et al., 2017). Ne usually exhibits a single peak around the magnetic equator in the topside of ionosphere (Zhang, 2014; Yan et al., 2020), while the ionospheric model (e.g., IRI model) shows two peaks in this region (Liu et al., 2021). The enhancement on August 4 was located in the west (Figure 3B), which was reversed with the simulation. The additional electric field was set in the upward direction in this simulation, which means the negative anomaly of electrostatic field around the epicenter, while some researchers also reported the positive variation of electric field prior to earthquakes in real observations (Mikhailov et al., 2006; Kachakhidze et al., 2009; Jin et al., 2020). The different directions of additional electric field may make the enhancement and depletion of electron density appear in different directions of epicenters. Affected by magnetic lines of the Earth, the disturbed electric field makes the electron density fluctuate in the equator direction, which is shown in the modeling simulation. The disturbances detected by CSES prior to Indonesia Mw6.9 earthquake were shifting equatorward. Furthermore, the Ne anomalies obtained by statistical analysis (Figure 8) were also obvious in the equator direction as the simulation, and the phenomenon of one side enhancing and the other side reducing was found in 3 days before earthquakes. The location consistency of anomalies between observation and simulation proposes that the electric field pathway may be the main channel of LAIC.
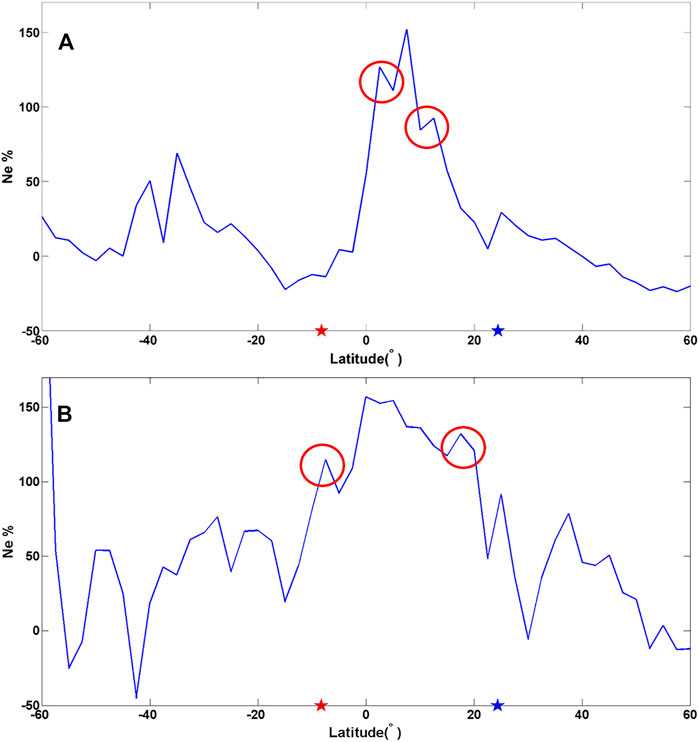
FIGURE 15. Ne relative change along orbit in the daytime (A) and nighttime (B) on 31 July 2018. The red and blue stars represent the epicenter and its conjugate point, respectively.
From the statistical analysis, the seismo-ionospheric disturbances within 300 km distance from the epicenter are relatively obvious 11, 3, and 2 days prior to Mw ≥ 6.0 earthquakes. De Santis et al. (2019) suggested that ionospheric Ne anomalies may occur from a few days to 80 days before earthquakes, which is related to the earthquake magnitude. Some researchers considered the advance time of precursors may depend on the regions of earthquakes. By analyzing the GPS TEC and foF2 data, Liu et al. (2004b), Liu et al. (2006) detected that the ionospheric anomalies appear within 5 days before strong earthquakes in the Taiwan area. In Greece, Davidenko and Pulinets (2019) found the majority of precursors appear 1 day before M ≥ 6.0 earthquakes by analyzing vertical sounding data and TEC data. Pulinets et al. (2021) detected the precursory phenomena of ionospheric parameters 5–7 days before two strong earthquakes occurred in California.
In this study, we found that the occurrence time of disturbances has a relationship with the seismic magnitude. The stronger magnitude is the earlier disturbance appears. In the statistical study of Le et al. (2011), the occurrence time of abnormal GPS TEC rates prior to Mw > 7.0 earthquakes is earlier than that of other magnitudes. Based on case studies of earthquakes in China, Wang et al. (2018) reported that the duration of pre-earthquake phenomena have a positive relationship with the magnitude of future earthquake.
Another question is that why the anomalies are not continuous after their emergence. From the previous simulation, we consider the penetrating electric field is the main channel of LAIC. The anomalies of electric field near the ground have been found 3–16 days (Myachkin et al., 1972) and 2–40 days (Hao et al., 1998) prior to earthquakes, and these anomalies are not persistent till the occurrence of earthquakes. It is currently not clear why an anomaly of electric field occurs at a particular day or time before an earthquake. Furthermore, for the solar-synchronized orbit of CSES, the satellite can just support observations in two local times (ascending and descending nodes), whereas the ionospheric precursors strongly depend on the local time (Pulinets and Davidenko, 2018; Liu et al., 2000). Therefore, the observation data not in continuous time may reduce the detected probability of seimo-ionospheric disturbances. In addition to that, there may be other factors that the anomalies are not observed prior to earthquakes: the abnormal electric field on the ground does not penetrate into the ionosphere subject to the transition pathway; due to the limitation of the observation, including the time and location, the anomalies are not detected in the ionospheric topside. In a word, integration of ionospheric observation from both ground and space can support more comprehensive data to investigate disturbances prior to earthquakes.
Based on the characteristics of CSES, a spatial analysis method was applied to extract Ne disturbances prior to strong earthquakes. Focused on the Indonesia Mw6.9 earthquake, the anomalies were found in the daytime and nighttime on 31 July, and in the daytime on 4 August, the location of which almost shifted equatorward. Furthermore, these anomalies can also be detected by the revisiting orbit method using CSES Ne and GIM TEC data with the same analyzing method, which verifies the spatial analysis method, is effective to extract the seismo-ionospheric disturbances.
Through the statistical study prior to 206 Mw ≥ 6.0 global earthquakes using CSES Ne data from 1 May 2018 to 30 September 2020, some conclusions were obtained as follows: 1) Both the positive and negative anomalies in the equator direction are more obvious than those in the polar direction of earthquakes; 2) the anomalies within 300 km distance from the epicenter are more obvious than those at longer distances, and the number of anomalies in this distance exceeds 2*std threshold of random case in 11, 3, and 2 days prior to Mw ≥ 6.0 earthquakes; 3) with the enhancement of seismic magnitude, the influence region of seismo-ionospheric disturbances gradually enlarges and the occurrence time of anomalies associated with earthquakes becomes early. In the comparitive analysis of random earthquakes, these statistical characteristics were not detected. Through the modeling of electric field LAIC and TIEGCM, the simulation result supports the Ne anomalies induced by the disturbed electric field will shift equatorward and exhibit the characteristics of magnetic conjugate effect. Comparing the statistical result with the simulation output, the electric field pathway could be considered as the main channel of LAIC.
Although we identified some characteristics of ionospheric anomalies associated with strong earthquakes by analyzing the electron density observed by CSES, more studies are needed in the future, including more cases for improving the statistics and more observations analyses (such as Swarm dataset in the same period), in order to fully understand the physical mechanism of the seismo-ionospheric coupling.
The original contributions presented in the study are included in the article/Supplementary Material; further inquiries can be directed to the corresponding author.
JL analyzed the data and wrote the manuscript. XQ analyzed the data and wrote some programs. XZ proposed the topic and conceived the study. ZW and CZ completed the simulation work. YZ collected the data and did some analyses. All authors read and approved the final manuscript.
This work is supported by the National Key R&D Program of China (2018YFC1503506, 2018YFF01013705), the Specialized Research Funds of the National Key Laboratory of Electromagnetic Environment (202001002), and APSCO Earthquake Research Project Phase II and ISSI-Beijing (2019-IT33).
The authors declare that the research was conducted in the absence of any commercial or financial relationships that could be construed as a potential conflict of interest.
All claims expressed in this article are solely those of the authors and do not necessarily represent those of their affiliated organizations, or those of the publisher, the editors, and the reviewers. Any product that may be evaluated in this article, or claim that may be made by its manufacturer, is not guaranteed or endorsed by the publisher.
The authors acknowledge CSES mission for providing the electron density, JPL for providing the GIM TEC data and USGS for the earthquake list. The websites for downloading these data are as follows: CSES data from http://www.leos.ac.cn/, JPL TEC data from ftp://cddis.gsfc.nasa.gov/pub/gps/products/ionex and earthquake list from https://earthquake.usgs.gov/earthquakes/search/. The authors also acknowledge the World Data Center for Geomagnetism, Kyoto for supplying AE and Dst indices, GFZ for providing Kp index, and Space Weather Canada for supporting F10.7 index. The authors acknowledge the High Altitude Observatory for supporting the model of TIEGCM, which is available at the website (http://www.hao.ucar.edu/modeling/tgcm/download.php).
The Supplementary Material for this article can be found online at: https://www.frontiersin.org/articles/10.3389/feart.2022.811658/full#supplementary-material
Anderson, D. N. (1981). Modeling the Ambient, Low Latitude F-Region Ionosphere-A Review. J. Atmos. Terr. Phys. 43, 753–762. doi:10.1016/0021-9169(81)90051-9
Bilitza, D., Truhlik, V., Richards, P., Abe, T., and Triskova, L. (2007). Solar Cycle Variations of Mid-latitude Electron Density and Temperature: Satellite Measurements and Model Calculations. Adv. Space Res. 39, 779–789. doi:10.1016/j.asr.2006.11.022
Brace, L. H., Theis, R. F., and Hoegy, W. R. (1987). Ionospheric Electron Temperature at Solar Maximum. Adv. Space Res. 7 (6), 99–106. doi:10.1016/0273-1177(87)90281-X
Chmyrev, V. M., Isaev, N. V., Serebryakova, O. N., Sorokin, V. M., and Sobolev, Y. P. (1997). Small-scale Plasma Inhomogeneities and Correlated ELF Emissions in the Ionosphere over an Earthquake Region. J. Atmos. solar-Terr. Phys. 59 (9), 967–974. doi:10.1016/S1364-6826(96)00110-1
Choudhury, A., Guha, A., De, B. K., and Roy, R. (2013). A Statistical Study on Precursory Effects of Earthquakes Observed through the Atmospheric Vertical Electric Field in Northeast India. Ann. Geophys. 56 (3), 1861–1867. doi:10.4401/ag-6235
Davidenko, D. V., and Pulinets, S. A. (2019). Deterministic Variability of the Ionosphere on the Eve of Strong (M ≥ 6) Earthquakes in the Regions of Greece and Italy According to Long-Term Measurements Data. Geomagn. Aeron. 59 (4), 493–508. doi:10.1134/s001679321904008x
De Santis, A., Marchetti, D., Pavón-Carrasco, F. J., Cianchini, G., Perrone, L., Abbattista, C., et al. (2019). Precursory Worldwide Signatures of Earthquake Occurrences on Swarm Satellite Data. Sci. Rep. 9 (1), 20287. doi:10.1038/s41598-019-56599-1
De Santis, A., Marchetti, D., Perrone, L., Campuzano, S. A., Cianchini, G., Cesaroni, C., et al. (2021). Statistical Correlation Analysis of strong Earthquakes and Ionospheric Electron Density Anomalies as Observed by CSES-01. Il Nuovo Cimento 44, 119. doi:10.1393/ncc/i2021-21119-1
Dobrovolsky, I. P., Zubkov, S. I., and Miachkin, V. I. (1979). Estimation of the Size of Earthquake Preparation Zones. Pageoph 117 (5), 1025–1044. doi:10.1007/BF00876083
Galuk, Y. P., Kudintseva, I. G., Nickolaenko, A. P., and Hayakawa, M. (2020). Modifications of Schumann Resonance Spectra as an Estimate of Causative Earthquake Magnitude: The Model Treatment. J. Atmos. Solar-Terr. Phys. 209, 105392. doi:10.1016/j.jastp.2020.105392
Gokhberg, M. B., Pilipenko, V. A., and Pokhotelov, O. A. (1983a). Satellite Observations of Electromagnetic Radiation above the Epicentral Region of an Imminent Earthquake. Dokl. USSR Acad. Sci. 268 (1), 53–55.
Gokhberg, M. B., Pilipenko, V. A., and Pokhotelov, O. A. (1983b). Seismic Precursors in the Ionosphere. Izvestiya Earth Phys. 19, 762–765.
Hanson, W. B., and Urquhart, A. L. (1994). High Altitude Bottomside Bubbles? Geophys. Res. Lett. 21, 2051–2054. doi:10.1029/94GL01580
Hao, J., Tang, T., and Li, D. (1998). Advancement of the Study on Taking the Anomalies of Static Atmospheric Field as index of Short-Term and Imminent Earthquake Prediction. Earthquake 18, 245–256. (in Chinese with English abstract).
Hattori, K., Han, P., Yoshino, C., Febriani, F., Yamaguchi, H., and Chen, C.-H. (2013). Investigation of ULF Seismo-Magnetic Phenomena in Kanto, Japan during 2000-2010: Case Studies and Statistical Studies. Surv. Geophys. 34, 293–316. doi:10.1007/s10712-012-9215-x
Hayakawa, M., Nickolaenko, A. P., Galuk, Y. P., and Kudintseva, I. G. (2020). Scattering of Extremely Low Frequency Electromagnetic Waves by a Localized Seismogenic Ionospheric Perturbation: Observation and Interpretation. Radio Sci. 55, e2020RS007130. doi:10.1029/2020RS007130
He, Y., Zhao, X., Yang, D., Wu, Y., and Li, Q. (2021). A Study to Investigate the Relationship between Ionospheric Disturbance and Seismic Activity Based on Swarm Satellite Data. Phys. Earth Planet. Interiors, 106826. doi:10.1016/j.pepi.2021.106826
Jin, X., Zhang, L., Bu, J., Qiu, G., Ma, L., Liu, C., et al. (2020). Discussion on Anomaly of Atmospheric Electrostatic Field in Wenchuan Ms8.0 Earthquake. J. Electrost. 104, 103423. doi:10.1016/j.elstat.2020.103423
Kachakhidze, N., Kachakhidze, M., Kereselidze, Z., and Ramishvili, G. (2009). Specific Variations of the Atmospheric Electric Field Potential Gradient as a Possible Precursor of Caucasus Earthquakes. Nat. Hazards Earth Syst. Sci. 9, 1221–1226. doi:10.5194/nhess-9-1221-2009
Kil, H., and Heelis, R. A. (1998). Global Distribution of Density Irregularities in the Equatorial Ionosphere. J. Geophys. Res. 103, 407–417. doi:10.1029/97JA02698
Kon, S., Nishihashi, M., and Hattori, K. (2011). Ionospheric Anomalies Possibly Associated with M⩾6.0 Earthquakes in the Japan Area during 1998-2010: Case Studies and Statistical Study. J. Asian Earth Sci. 41, 410–420. doi:10.1016/j.jseaes.2010.10.005
Kuo, C. L., Huba, J. D., Joyce, G., and Lee, L. C. (2011). Ionosphere Plasma Bubbles and Density Variations Induced by Pre-earthquake Rock Currents and Associated Surface Charges. J. Geophys. Res. 116 (A10). doi:10.1029/2011JA016628
Kuo, C.-L., Lee, L.-C., and Heki, K. (2015). Preseismic TEC Changes for Tohoku-Oki Earthquake: Comparisons between Simulations and Observations. Terr. Atmos. Ocean. Sci. 26, 63–72. doi:10.3319/tao.2014.08.19.06(grt)
Larkina, V. I., Migulin, V. V., Nalivaiko, A. V., Gershenzon, N. I., Gokhberg, M. B., Liperovsky, V. A., et al. (1983). Observation of VLF Emissions, Related with Seismic Activity, on the Intercosmos-19 Satellite. Geomagn. Aeronom. 23, 684–687.
Le, H., Liu, J. Y., and Liu, L. (2011). A Statistical Analysis of Ionospheric Anomalies before 736M6.0+ Earthquakes during 2002-2010. J. Geophys. Res. 116 (A2). doi:10.1029/2010JA015781
Le, H., Liu, L., Liu, J.-Y., Zhao, B., Chen, Y., and Wan, W. (2013). The Ionospheric Anomalies Prior to the M9.0 Tohoku-Oki Earthquake. J. Asian Earth Sci. 62, 476–484. doi:10.1016/j.jseaes.2012.10.034
Le, H., Liu, J., Zhao, B., and Liu, L. (2015). Recent Progress in Ionospheric Earthquake Precursor Study in China: A Brief Review. J. Asian Earth Sci. 114, 420–430. doi:10.1016/j.jseaes.2015.06.024
Li, M., Shen, X., Parrot, M., Zhang, X., Zhang, Y., Yu, C., et al. (2020). Primary Joint Statistical Seismic Influence on Ionospheric Parameters Recorded by the CSES and DEMETER Satellites. J. Geophys. Res. Space Phys. 125, e2020JA028116. doi:10.1029/2020JA028116
Liu, J. Y., Chen, Y. I., Pulinets, S. A., Tsai, Y. B., and Chuo, Y. J. (2000). Seismo-ionospheric Signatures Prior to M≥6.0 Taiwan Earthquakes. Geophys. Res. Lett. 27 (19), 3113–3116. doi:10.1029/2000GL011395
Liu, J. Y., Chen, Y.-I., Jhuang, H.-K., and Lin, Y.-H. (2004a). Ionospheric foF2 and TEC Anomalous Days Associated with M >= 5.0 Earthquakes in Taiwan during 1997-1999. Terr. Atmos. Ocean. Sci. 15, 371–383. doi:10.3319/tao.2004.15.3.371(ep)
Liu, J. Y., Chuo, Y. J., Shan, S. J., Tsai, Y. B., Chen, Y. I., Pulinets, S. A., et al. (2004b). Pre-Earthquake Ionospheric Anomalies Registered by Continuous GPS TEC Measurements. Ann. Geophys. 22, 1585–1593. doi:10.5194/angeo-22-1585-2004
Liu, J. Y., Chen, Y. I., Chuo, Y. J., and Chen, C. S. (2006). A Statistical Investigation of Preearthquake Ionospheric Anomaly. J. Geophys. Res. 111, A05304. doi:10.1029/2005JA011333
Liu, J. Y., Chen, Y. I., Chen, C. H., Liu, C. Y., Chen, C. Y., Nishihashi, M., et al. (2009). Seismoionospheric GPS Total Electron Content Anomalies Observed before the 12 May 2008Mw7.9 Wenchuan Earthquake. J. Geophys. Res. 114, 231–261. doi:10.1029/2008JA013698
Liu, J. Y., Chen, Y. I., Chen, C. H., and Hattori, K. (2010). Temporal and Spatial Precursors in the Ionospheric Global Positioning System (GPS) Total Electron Content Observed before the 26 December 2004 M9.3 Sumatra-Andaman Earthquake. J. Geophys. Res. 115. doi:10.1029/2010JA015313
Liu, L., Wan, W., Chen, Y., and Le, H. (2011). Solar Activity Effects of the Ionosphere: A Brief Review. Chin. Sci. Bull. 56 (12), 1202–1211. doi:10.1007/s11434-010-4226-9
Liu, J., Huang, J., and Zhang, X. (2014). Ionospheric Perturbations in Plasma Parameters before Global strong Earthquakes. Adv. Space Res. 53 (5), 776–787. doi:10.1016/j.asr.2013.12.029
Liu, J.-Y., Hattori, K., and Chen, Y.-I. (2018). “Application of Total Electron Content Derived from the Global Navigation Satellite System for Detecting Earthquake Precursors,” in Pre-Earthquake Processes: A Multidisciplinary Approach to Earthquake Prediction Studies. Editors . Editors D. Ouzounov, S. Pulinets, K. Hattori, and P. Taylor (Wiley), 305–317. doi:10.1002/9781119156949.ch17
Liu, C., Guan, Y., Zheng, X., Zhang, A., Piero, D., and Sun, Y. (2019). The Technology of Space Plasma In-Situ Measurement on the China Seismo-Electromagnetic Satellite. Sci. China Technol. Sci. 62, 829–838. doi:10.1007/s11431-018-9345-8
Liu, J., Guan, Y., Zhang, X., and Shen, X. (2021). The Data Comparison of Electron Density between CSES and DEMETER Satellite, Swarm Constellation and IRI Model. Earth Space Sci. 8, e2020EA001475. doi:10.1029/2020EA001475
Lomidze, L., Knudsen, D. J., Burchill, J., Kouznetsov, A., and Buchert, S. C. (2018). Calibration and Validation of Swarm Plasma Densities and Electron Temperatures Using Ground-Based Radars and Satellite Radio Occultation Measurements. Radio Sci. 53, 15–36. doi:10.1002/2017RS006415
Lühr, H., and Xiong, C. (2010). IRI-2007 Model Overestimates Electron Density during the 23/24 Solar Minimum. Geophys. Res. Lett. 37, a–n. doi:10.1029/2010GL045430
Mannucci, A. J., Wilson, B. D., Yuan, D. N., Ho, C. H., Lindqwister, U. J., and Runge, T. F. (1998). A Global Mapping Technique for GPS-Derived Ionospheric Total Electron Content Measurements. Radio Sci. 33 (3), 565–582. doi:10.1029/97RS02707
Marchetti, D., De Santis, A., Shen, X., Campuzano, S. A., Perrone, L., Piscini, A., et al. (2020). Possible Lithosphere-Atmosphere-Ionosphere Coupling Effects Prior to the 2018 Mw = 7.5 Indonesia Earthquake from Seismic, Atmospheric and Ionospheric Data. J. Asian Earth Sci. 188, 104097. doi:10.1016/j.jseaes.2019.104097
Mikhailov, Y. M., Mikhailova, G. A., Kapustina, O. V., Druzhin, G. I., and Smirnov, S. E. (2006). Electric and Electromagnetic Processes in the Near-Earth Atmosphere before Earthquakes on Kamchatka. Geomagn. Aeron. 46 (6), 796–808. doi:10.1134/s0016793206060156
Min, K., Park, J., Kim, H., Kim, V., Kil, H., Lee, J., et al. (2009). The 27-day Modulation of the Low-Latitude Ionosphere during a Solar Maximum. J. Geophys. Res. 114. doi:10.1029/2008JA013881
Myachkin, V. I., Sobolev, G. A., Dolbilkina, N. A., Morozow, V. N., and Preobrazensky, V. B. (1972). The Study of Variations in Geophysical fields Near Focal Zones of Kamchatka. Tectonophysics 14 (3-4), 287–293. doi:10.1016/0040-1951(72)90077-7
Nickolaenko, A. P., Hayakawa, M., Sekiguchi, M., Ando, Y., and Ohta, K. (2006). Model Modifications in Schumann Resonance Intensity Caused by a Localized Ionosphere Disturbance over the Earthquake Epicenter. Ann. Geophys. 24, 567–575. doi:10.5194/angeo-24-567-2006
Ouyang, X. Y., Parrot, M., and Bortnik, J. (2020). ULF Wave Activity Observed in the Nighttime Ionosphere above and Some Hours before Strong Earthquakes. J. Geophys. Res. Space Phys. 125 (9), e2020JA028396. doi:10.1029/2020ja028396
Parrot, M. (2012). Statistical Analysis of Automatically Detected Ion Density Variations Recorded by DEMETER and Their Relation to Seismic Activity. Ann. Geophys. 55 (1), 149–155. doi:10.4401/527010.4401/ag-5270
Piersanti, M., Materassi, M., Battiston, R., Carbone, V., Cicone, A., D’Angelo, G., et al. (2020). Magnetospheric-Ionospheric-Lithospheric Coupling Model. 1: Observations during the 5 August 2018 Bayan Earthquake. Remote Sens. 12, 3299. doi:10.3390/rs12203299
Pulinets, S., and Boyarchuk, K. (2004). Ionospheric Precursors of Earthquakes. New York: Springer Berlin Heidelberg.
Pulinets, S. A., and Davidenko, D. V. (2018). The Nocturnal Positive Ionospheric Anomaly of Electron Density as a Short-Term Earthquake Precursor and the Possible Physical Mechanism of its Formation. Geomagn. Aeron. 58 (4), 559–570. doi:10.1134/s0016793218040126
Pulinets, S. A., and Legen’ka, A. (2003). Spatial-temporal Characteristics of the Large Scale Disturbances of Electron Concentration Observed in the F-Region of the Ionosphere before strong Earthquakes. Cosm. Res. 41, 221–230. doi:10.1023/A:1024046814173
Pulinets, S. A., Legen'ka, A. D., Gaivoronskaya, T. V., and Depuev, V. K. (2003). Main Phenomenological Features of Ionospheric Precursors of strong Earthquakes. J. Atmos. solar-terrestrial Phys. 65 (16-18), 1337–1347. doi:10.1016/j.jastp.2003.07.011
Pulinets, S., Tsidilina, M., Ouzounov, D., and Davidenko, D. (2021). From Hector Mine M7.1 to Ridgecrest M7.1 Earthquake. A Look from a 20-Year Perspective. Atmosphere 12, 262. doi:10.3390/atmos12020262
Pulinets, S. A. (1998). Strong Earthquake Prediction Possibility with the Help of Topside Sounding from Satellites. Adv. Space Res. 21 (3), 455–458. doi:10.1016/S0273-1177(97)00880-6
Pulinets, S. A. (2006). Space Technologies for Short-Term Earthquake Warning. Adv. Space Res. 37 (4), 643–652. doi:10.1016/j.asr.2004.12.074
Rich, F. J., Sultan, P. J., and Burke, W. J. (2003). The 27-day Variations of Plasma Densities and Temperatures in the Topside Ionosphere. J. Geophys. Res. 108 (A7), 1297. doi:10.1029/2002JA009731
Richmond, A. D., Ridley, E. C., and Roble, R. G. (1992). A Thermosphere/ionosphere General Circulation Model with Coupled Electrodynamics. Geophys. Res. Lett. 19, 601–604. doi:10.1029/92GL00401
Rikitake, T. (1987). Earthquake Precursors in Japan: Precursor Time and Detectability. Tectonophysics 136, 265–282. doi:10.1016/0040-1951(87)90029-1
Rishbeth, H., and Garriott, O. K. (1969). Introduction to Ionospheric Physics. New York: Academic Press, 344.
Ryu, K., Lee, E., Chae, J. S., Parrot, M., and Pulinets, S. (2014). Seismo-ionospheric Coupling Appearing as Equatorial Electron Density Enhancements Observed via DEMETER Electron Density Measurements. J. Geophys. Res. Space Phys. 119 (10), 8524–8542. doi:10.1002/2014JA020284
Sarkar, S., Gwal, A. K., and Parrot, M. (2007). Ionospheric Variations Observed by the DEMETER Satellite in the Mid-latitude Region during strong Earthquakes. J. Atmos. Solar-Terr. Phys. 69 (13), 1524–1540. doi:10.1016/j.jastp.2007.06.006
Saroso, S., Liu, J.-Y., Hattori, K., and Chen, C.-H. (2008). Ionospheric GPS TEC Anomalies and M ≧ 5.9 Earthquakes in Indonesia during 1993 - 2002. Terr. Atmos. Ocean. Sci. 19, 481–488. doi:10.3319/tao.2008.19.5.481(t)
Schunk, R., and Nagy, A. (2009). Ionospheres: Physics, Plasma Physics, and Chemistry. England: Cambridge University Press, 628.
Schunk, R. W., and Sojka, J. J. (1996). Ionosphere-thermosphere Space Weather Issues. J. Atmos. Terr. Phys. 58 (14), 1527–1574. doi:10.1016/0021-9169(96)00029-3
Shen, X. H., Zhang, X., Yuan, S., Wang, L., Cao, J., Huang, J., et al. (2018a). The State-Of-The-Art of the China Seismo-Electromagnetic Satellite mission. Sci. China Technol. Sci. 61, 634–642. doi:10.1007/s11431-018-9242-0
Shen, X. H., Zong, Q. G., and Zhang, X. M. (2018b). Introduction to Special Section on the China Seismo-Electromagnetic Satellite and Initial Results. Earth Planet. Phys. 2 (6), 3–7. doi:10.26464/epp2018041
Smirnov, S. (2008). Association of the Negative Anomalies of the Quasistatic Electric Field in Atmosphere with Kamchatka Seismicity. Nat. Hazards Earth Syst. Sci. 8 (4), 745–749. doi:10.5194/nhess-8-745-2008
Song, R., Hattori, K., Zhang, X., and Sanaka, S. (2020). Seismic-ionospheric Effects Prior to Four Earthquakes in Indonesia Detected by the China Seismo-Electromagnetic Satellite. J. Atmos. Solar-Terr. Phys. 205, 105291. doi:10.1016/j.jastp.2020.105291
Tsurutani, B. (2004). Global Dayside Ionospheric Uplift and Enhancement Associated with Interplanetary Electric fields. J. Geophys. Res. 109 (A8), A08302. doi:10.1029/2003ja010342
Walker, G. O., Ma, J. H. K., and Golton, E. (1994). The Equatorial Ionospheric Anomaly in Electron Content from Solar Minimum to Solar Maximum for South East Asia. Ann. Geophys. 12, 195–209. doi:10.1007/s00585-994-0195-0
Wang, H., Zhang, Y., Liu, J., Shen, X., Yu, H., Jiang, Z., et al. (2018). “Pre-Earthquake Observations and Their Application in Earthquake Prediction in China,” in Pre-Earthquake Processes: A Multidisciplinary Approach to Earthquake Prediction Studies, Geophysical Monograph 234. Editors D. Ouzounov, S. Pulinets, K. Hattori, and P. Taylor (United States of America: John Wiley & Sons, Inc. & American Geophysical Union), 19–39. doi:10.1002/9781119156949.ch3
Wang, X., Cheng, W., Yang, D., and Liu, D. (2019). Preliminary Validation of In Situ Electron Density Measurements Onboard CSES Using Observations from Swarm Satellites. Adv. Space Res. 64 (4), 982–994. doi:10.1016/j.asr.2019.05.025
Wilson, B., Mannucci, A., Edwards, C., and Roth, T. (1992). “Global Ionospheric Maps Using a Global Network of GPS Receivers,” in Paper Presented at URSI Beacon Satellite Symposium, Cambridge, MA, July, 1992.
Wu, Q., Ortland, D. A., Foster, B., and Roble, R. G. (2012). Simulation of Nonmigrating Tide Influences on the Thermosphere and Ionosphere with a TIMED Data Driven TIEGCM. J. Atmos. Solar-Terr. Phys. 90-91, 61–67. doi:10.1016/j.jastp.2012.02.009
Xiong, N. L., Tang, C. C., and Li, X. J. (1999). Introduction to the Ionosphere Physics. Wuhan: Wuhan University press, 354–433. (In Chinese).
Xiong, C., Park, J., Lühr, H., Stolle, C., and Ma, S. Y. (2010). Comparing Plasma Bubble Occurrence Rates at CHAMP and GRACE Altitudes during High and Low Solar Activity. Ann. Geophys. 28 (9), 1647–1658. doi:10.5194/angeo-28-1647-2010
Yan, R., Parrot, M., and Pinçon, J.-L. (2017). Statistical Study on Variations of the Ionospheric Ion Density Observed by DEMETER and Related to Seismic Activities. J. Geophys. Res. Space Phys. 122, 12,421–12,429. doi:10.1002/2017JA024623
Yan, R., Shen, X. H., Shen, X., Huang, J., Wang, Q., Chu, W., et al. (2018). Examples of Unusual Ionospheric Observations by the CSES Prior to Earthquakes. Earth Planet. Phys. 2, 515–526. doi:10.26464/epp2018050
Yan, R., Zhima, Z., Xiong, C., Shen, X., Huang, J., Guan, Y., et al. (2020). Comparison of Electron Density and Temperature from the CSES Satellite with Other Space‐Borne and Ground‐Based Observations. J. Geophys. Res. Space Phys. 125 (10), e2019JA027747. doi:10.1029/2019JA027747
Zhang, X., Shen, X., Liu, J., Ouyang, X., Qian, J., and Zhao, S. (2009). Analysis of Ionospheric Plasma Perturbations before Wenchuan Earthquake. Nat. Hazards Earth Syst. Sci. 9, 1259–1266. doi:10.5194/nhess-9-1259-2009
Zhang, X., Shen, X., Liu, J., Ouyang, X., Qian, J., and Zhao, S. (2010). Ionospheric Perturbations of Electron Density before the Wenchuan Earthquake. Int. J. Remote Sens. 31 (13), 3559–3569. doi:10.1080/01431161003727762
Zhang, X., Zeren, Z., Parrot, M., Battiston, R., Qian, J., and Shen, X. (2011). ULF/ELF Ionospheric Electric Field and Plasma Perturbations Related to Chile Earthquakes. Adv. Space Res. 47 (6), 991–1000. doi:10.1016/j.asr.2010.11.001
Zhang, X., Wang, Y., Boudjada, M., Liu, J., Magnes, W., Zhou, Y., et al. (2020). Multi-Experiment Observations of Ionospheric Disturbances as Precursory Effects of the Indonesian Ms6.9 Earthquake on August 05, 2018. Remote Sens. 12, 4050. doi:10.3390/rs12244050
Zhang, X. (2014). Electron Density Comparison between IRI 2007 and DEMETER Satellite Data in Solar Minimum Year. Terr. Atmos. Ocean. Sci. 25, 559–571. doi:10.3319/TAO.2014.02.24.0110.3319/tao.2014.02.24.01(aa)
Zhao, B., Wang, M., Yu, T., Xu, G., Wan, W., and Liu, L. (2010). Ionospheric Total Electron Content Variations Prior to the 2008 Wenchuan Earthquake. Int. J. Remote Sens. 31 (13), 3545–3557. doi:10.1080/01431161003727622
Keywords: CSES, analysis method, electron density, ionospheric disturbance, earthquake
Citation: Liu J, Qiao X, Zhang X, Wang Z, Zhou C and Zhang Y (2022) Using a Spatial Analysis Method to Study the Seismo-Ionospheric Disturbances of Electron Density Observed by China Seismo-Electromagnetic Satellite. Front. Earth Sci. 10:811658. doi: 10.3389/feart.2022.811658
Received: 09 November 2021; Accepted: 26 January 2022;
Published: 22 February 2022.
Edited by:
Mirko Piersanti, National Institute of Astrophysics (INAF), ItalyReviewed by:
Angelo De Santis, Istituto Nazionale di Geofisica e Vulcanologia (INGV), ItalyCopyright © 2022 Liu, Qiao, Zhang, Wang, Zhou and Zhang. This is an open-access article distributed under the terms of the Creative Commons Attribution License (CC BY). The use, distribution or reproduction in other forums is permitted, provided the original author(s) and the copyright owner(s) are credited and that the original publication in this journal is cited, in accordance with accepted academic practice. No use, distribution or reproduction is permitted which does not comply with these terms.
*Correspondence: Jing Liu, bGl1amluZ2V2YUAxNjMuY29t
Disclaimer: All claims expressed in this article are solely those of the authors and do not necessarily represent those of their affiliated organizations, or those of the publisher, the editors and the reviewers. Any product that may be evaluated in this article or claim that may be made by its manufacturer is not guaranteed or endorsed by the publisher.
Research integrity at Frontiers

Learn more about the work of our research integrity team to safeguard the quality of each article we publish.