 Lei Liu
 Jun Yao1,2*
95% of researchers rate our articles as excellent or good
Learn more about the work of our research integrity team to safeguard the quality of each article we publish.
Find out more
ORIGINAL RESEARCH article
Front. Earth Sci. , 04 January 2023
Sec. Solid Earth Geophysics
Volume 10 - 2022 | https://doi.org/10.3389/feart.2022.1104401
This article is part of the Research Topic Advances in Petrophysics and Formation Evaluation of Unconventional Resources View all 9 articles
Introduction: Shale oil and gas reservoirs contain a variety of inorganic and organic pores that differ significantly from conventional reservoirs, making traditional experiments ineffective. Instead, the pore-scale imaging and modeling method, regarded as a novel and practical approach, is proposed to characterize shale microstructure and petrophysical properties. Therefore, it is of great significance to accurately reconstruct the three-dimensional (3D) microstructure of the porous medium, that is, the digital rock. However, microstructural images of shale at high-resolution, obtained through scanning electron microscopy (SEM) are constrained in the two-dimensional (2D) scale.
Method: In this work, a novel iterative algorithm to reconstruct 3D multi-phase shale digital rock from a 2D image using multi-point statistics has been proposed. A multi-grid data template was used to capture the conditional probabilities and data events. The novelty of this work stems from an accurate representation of different types of pores and the mineral characteristics of shale rock from 2D images.
Result: A series of simulations were conducted to reconstruct 2D shale digital rock from a 2D segmented training image, 3D shale digital rock from a 2D segmented training image, a 2D gray training image to reconstruct 2D shale digital rock, and a 2D gray training image to reconstruct 3D shale digital rock.
Discussion: To corroborate the accuracy of the reconstructed digital rock and evaluate the reliability of the proposed algorithm, we compared the construction image with the training image with the two-point correlation function, geometry, morphological topology structure, and flow characteristics. The reconstruction accuracy indicates that the proposed algorithm can replicate the higher-order statistical information of the training image.
Shale reservoirs are distributed worldwide and are gaining more attention (Ma et al., 2018; Feng et al., 2020; Kang et al., 2020; Solarin et al., 2020; Katz et al., 2021; Jiang et al., 2022). The microstructure of shale is complex and includes different types of inorganic pores, porous and non-porous organic matter, and various mineral phases. Furthermore, different phases and their shapes are distributed randomly and disorderly. Moreover, the pore structures of shale range from nanometers to micrometers and exhibit multi-scale features, which make the petrophysical properties and flow mechanism of shale thoroughly distinct compared with conventional reservoirs (Josh et al., 2012; Yang et al., 2013; Sakhaee-Pour and Bryant, 2015; Deng et al., 2016; Ilgen et al., 2017; Huang et al., 2018). Therefore, traditional, widely used experimental methods are difficult to apply directly to shale research.
In the last decade, with the increase in computing power and the development of advanced imaging equipment, pore-scale imaging and modeling combined with numerical algorithms have become a new promising and outstanding petrophysical technology for imaging the microstructure of porous media, which is utilized to calculate the rock properties such as porosity, permeability, and relative permeability (Andrä et al., 2013a; Andrä et al., 2013b). Because of their advantages in terms of speed, accuracy, low cost, and reuse, pore-scale imaging and modeling have been widely used in petroleum engineering (Blunt et al., 2013). This process involves obtaining the shale rock microstructure and modeling transport in porous media (Bultreys et al., 2015). It is very important, while building 3D digital rocks, to get an accurate 3D microstructure of porous media. This is because the reconstructed porous structure is closely related to petrophysical properties and flow characteristics. At present, two main methods can be applied for digital rock reconstruction, namely physical experimental and numerical reconstruction approaches (Zhu et al., 2019). Advanced optical instruments were used in the physical experiments to obtain the microstructure of the rock samples. These include confocal laser scanning (Hackley and Kus, 2015; Hackley et al., 2020), X-ray micro- and nano-computed tomography (XCT) scanning (Gu et al., 2015; Tang et al., 2016; Zhou et al., 2016), and focused ion beam scanning electron microscopy (FIB-SEM) imaging (Cnudde and Boone, 2013; Ma et al., 2017; Zhang et al., 2020). Although physical experiments can accurately obtain the actual microstructure of a rock sample, the method is time-consuming and expensive and cannot balance image resolution with rock sample size. Due to these disadvantages, it is difficult to establish a 3D model for heterogeneous shale rock with high resolution using physical experiments. SEM is easily and widely used to reveal the microstructure of shale in a two-dimensional (2D) format with high resolution (Klaver et al., 2016; Saif et al., 2017). As a consequence, it is of great significance to develop accurate, stable, and effective 3D digital rock reconstruction algorithms based on 2D slices.
Numerical reconstruction employs a small amount of information to reconstruct 3D digital rocks using mathematical methods. In general, they can be divided into three types. The first is referred to as a “process-based reconstruction method,” which simulates the real settlement, compaction, and diagenesis processes of rocks (Tian et al., 2019). It has the advantage of better connectivity in reconstructed 3D digital rocks, and the pore structure is ideal. This is not suitable for shale, which has a complex diagenetic environment. The second method includes the Gaussian field simulation method (Hyman and Winter 2014), the simulated annealing method (SA) (Gerke et al., 2012; Shojaeefard et al., 2016), and Markov Chain Monte Carlo (MCMC) (Wu et al., 2006), which reconstructs 3D digital rocks with statistical information such as the connectivity function obtained from 2D images. The 3D digital rocks constructed according to the Gaussian field simulation approach exhibit poor connectivity. The SA method is suitable for reconstructing 3D digital rocks with large porosity, high permeability, and a simple microstructure. Both computational efficiency and accuracy decrease with an increase in microstructure complexity. The MCMC approach is feasible for building reliable 3D digital rocks. However, it failed to reproduce the microstructure of the anisotropic porous medium. These two methods use low-order statistical information from training images. Thus, it is difficult to reconstruct the global connectivity of the porous medium. The last method for establishing 3D digital rocks is to use high-order characteristic information obtained from training images as well as multi-point statistics (MPS) with spatial uncertainty interpolation (Wu et al., 2018). Compared to the first two methods, the MPS method uses high-order statistical information that reflects the microstructure of the training images. Thus, the adoption of the MPS method to construct the 3D digital rock can be viewed as a feasible approach to achieving the best long-term connectivity. Additionally, newer machine learning algorithms (Zha et al., 2020; Wang et al., 2021; Shan et al., 2022) for reconstruction are also widely used, and convolutional deep belief networks (CDBN) are used to construct stochastic models of porous media (Cang et al., 2017). To reconstruct relatively homogeneous sandstone and heterogeneous carbonate samples, generative adversarial networks and related variant-based methods are used (Mosser et al., 2017; Feng et al., 2019; Shams et al., 2020). Algorithms require a large amount of data for training, consume a lot of memory, limit the size of the reconstructed volume, must be retrained for different types of rocks, and cannot be migrated.
The MPS method for reconstructing 3D digital rocks includes three steps. First, we need to define training images and data templates. Second, it is to sample with the defined training images and data templates. The last step is to recover the microstructure based on Monte Carlo simulations and interpolation. One can divide sampling and recovery methods into two groups: those that use pixels and those that use patterns. Okabe and Blunt first proposed the MPS approach for establishing 3D digital rocks from 2D training images that are isotropic in each direction (Okabe and Blunt, 2005). Because the MPS method is restricted by its poor reconstruction efficiency, many scholars have transplanted MPS reconstruction from CPU devices to GPU devices or developed other algorithms to speed it up (Huang et al., 2013; Zhang et al., 2015). An excellent MPS approach on the basis of the cross-correlation function geostatistical method (CCSIM) to reconstruct 3D digital rock was put forward by Tahmasebi and Sahimi, (2012). The isomap-based MPS that adopts the isomap approach for reducing dimensions and redundancy was developed by Zhang et al, (2016). Also, they came up with a pattern-based method called FILTERSIM. This method uses filters to reduce the number of dimensions in patterns and put them into finite classes (Zhang et al., 2006). In practical applications, it is often difficult to reconstruct 3D porous media using only 2D training images. One solution is to build 3D porous media by rotating 2D training images and establishing probabilities in different directions to achieve probability fusion, but this assumes that all directions are isotropic and cannot solve the problem of anisotropy (Comunian et al., 2012). An alternate solution is to adopt the MPS algorithm to construct systematic images based on 2D training images to form a 3D porous medium by stacking, which leads to the final porous medium reproducing noise and discontinuous structures (Gao et al., 2015). To integrate the advantages of both methods, a hybrid approach generates multiple 2D slices as conditional data and 3D training images (Tahmasebi et al., 2015), and the rest of the region is simulated by the MPS algorithm. However, it is challenging to select an applicable switching point between these two approaches, and there are still drawbacks. In this study, an iterative algorithm has been proposed that can use a single training image to rebuild 3D digital rocks.
Even though the MPS method is the most common way to reconstruct 3D two-phase (pore and grain phase) digital rock for conventional reservoirs like sandstone, it still needs to be improved for unconventional reservoirs like shale reservoirs, especially for reconstructing 3D multi-phase digital rocks (Yang et al., 2015; Liu et al., 2018; Yan et al., 2018). Nie et al. came up with a multi-phase reconstruction method with the MCMC reconstruction algorithm to obtain a large-scale multi-phase 3D digital rock (Nie et al., 2016). They also adopted the reconstructed 3D digital rock to perform electrical simulations. Zhu and Yu proposed an approach to incorporate cemented phases into digital sandstone rocks that have already been reconstructed (Zhu et al., 2012). Based on digital rock physics, Saad et al. could reconstruct a multi-phase porous rock (Saad et al., 2018). Most methods proposed to generate multi-phase digital rocks are reconstructed (Li et al., 2022) and then nested directly, without correlating the geology and minerals (for instance, organics and pyrite are frequently found inn correlation with one another). In conclusion, it is a great challenge to reconstruct multi-phase 3D digital rocks, and more research needs to be conducted in the future. Given the various types of pores and mineral characteristics found in shale, developing multi-phase digital rocks from shale is critical and must be pursued further.
In this study, we adopted multi-point statistics to generate a 3D multi-phase shale digital rock considering minerals, different types of pores, and organic components from 2D images. The remaining parts of this paper are structured as follows: In Section 2, the MPS method and workflow for reconstructing the 3D multi-mineral shale digital rocks are explained. Section 3 introduces the evaluation methods for the reconstruction of shale digital rocks. Section 4 depicts various reconstruction cases, such as a 2D segmented training image to reconstructed 2D shale digital rocks, a 2D segmented training image to reconstructed 3D shale digital rocks, and a 2D grayscale training image to reconstructed 3D shale digital rocks. The study is summarized in Section 5.
In this section, the basic theory related to MPS is introduced. The basic principle for reconstructing digital rocks based on MPS is briefly described to explain why the simulation spaces can reproduce the microstructure of the training images. A reconstruction workflow is also presented.
MPS were proposed using traditional two-point statistics based on variograms. The key components include training images, data templates, and data events (Caers and Zhang, 2004; Pyrcz and Deutsch, 2014). The training images contain various feature patterns to be reconstructed in the simulations, as shown in Figure 1A). The black region indicates the grain phase, while the white one depicts the pore phase. It is a collection of conceptual feature patterns that require stability instead of high precision or specific distribution. The training image directly determines the reconstruction quality.
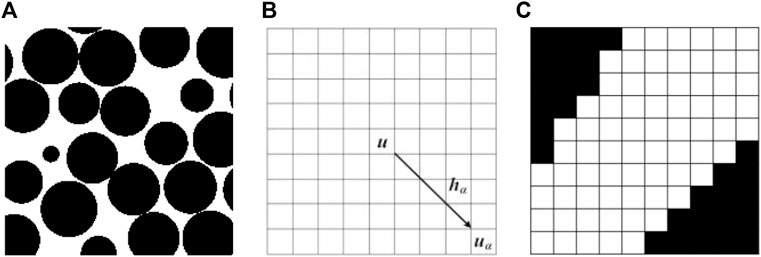
FIGURE 1. Illustration of (A) an image used for training purposes, split into a grain phase (black) and a pore phase (white), (B) a 9×9 2D data template, and (C) a data event acquired after a 9×9 2D data template scanned the training image.
A data template consists of n vectors, which is set to τn={hα;α=1, 2, … , n}. The point u in the template is the center, while the additional positions are denoted by the notation uα=u+ hα, where α can represent any value from one to n. Figure 1B shows a 2D data template consisting of 9×9 nodes, where uα is decided by the center point u and 80 vectors hα.
For a data template with attribute S representing the pore, grain, mineral or organic phases, it can take m state values {sk; k = 1, 2, … , m}. The “data event” d(u) consisting of n state values of the n vector uα positions in the data template, is expressed as:
where S (uα) represents the state value at the uα position, d(u) represents the S (u1), …, S (un) of the n vectors, and is the state value
Data templates are used to scan training images to capture the data events, which can be considered as microstructure features of the training data. It is possible to obtain all of the data events contained in the training image if the training images are scanned while simultaneously moving data templates from the top left to the bottom right node, one node at a time. During the course of scanning the training image with any data template, a data event (composed of the simulated point data u and the condition data in its data template) is captured by the data template. As to the training image, if a data event is repeated N times, the number of repetitions is N. For any point u to be simulated, it is necessary to decide on a function referred to as the conditional probability distribution function (CPDF) of attribute S(u) which can be expressed by the Bayesian conditional probability formula, for any K state value at the condition of a given n data value S (uα) as:
where the denominator is the pattern occurrence probability, and the numerator is the probability that a pattern and a state value to be simulated occur simultaneously. Therefore, the above expression can be rewritten as:
Here, c (dn) stands for the total number of times a particular pattern is repeated, and ck (dn) is the number of points S(u) to be simulated in the repeated pattern, equal to sk.
The “search tree” consists of a set of nodes, where each node in the tree data structure is a data event. The memory space and the scanned training images can be reduced when the CPDF are stored using the data structure of the “search tree.” Using numerous data templates is a viable option for extracting detailed information about the pore structure at multiple scales from the training image. This method not only improves sampling efficiency but also allows for the collection of large-scale porous geometry from training images. The MPS method has mainly been applied in the field of macroscopic geological modeling since it was proposed. For digital rock reconstruction, the MPS method is applied to homogeneous and two-phase (pore and grain) sandstone rocks, based mainly on the pixel method. This approach is ineffective for reconstructing the shale digital rock, particularly multi-scale and multi-phase shale digital rock. The microstructure of shale is heterogeneous, and the long-distance connectivity functions of the different phases are inconsistent. In the process of reconstructing a digital rock using the MPS technique, it may be necessary for recovering the pore structure of the training images via spatial interpolation in the area to be simulated. A pixel-based method is used to recover the pore structure of the training images. Based on the microstructure information of the training images, the areas were simulated using the Monte Carlo method, restricted by the CPDF and data events. Once the area to be simulated was traversed, the spatial structure of the entire area to be simulated was reconstructed. Because the probability estimation method was adopted, the simulation results were random. In addition, the entire process was based on the information from the training images, so it could reveal the various possible distributions of the state values in space very well.
Step 1: Input a representative 2D shale image, which is a gray-scale image or segmented image with different phases. The training image can be obtained using different scanning equipment such as XCT, SEM, etc.
Step 2: Set the representative 2D shale image as the training image. Multiple data templates were used to scan and store the obtained data events and CPDF in the search tree.
Step 3: Specify a random path to access the path of the simulated area. A selected phase (such as the pore, grain, or another phase) is randomly placed in the path, which is treated as the starting point of the simulation. The CPDF is updated and the next simulation point based on a random path using the Monte Carlo method is generated.
Step 4: Determine the dimensionality of the space to be simulated, as shown in the workflow in Figure 2. If the simulation space is 2D, the 2D digital rock will be generated directly based on steps 1–3.
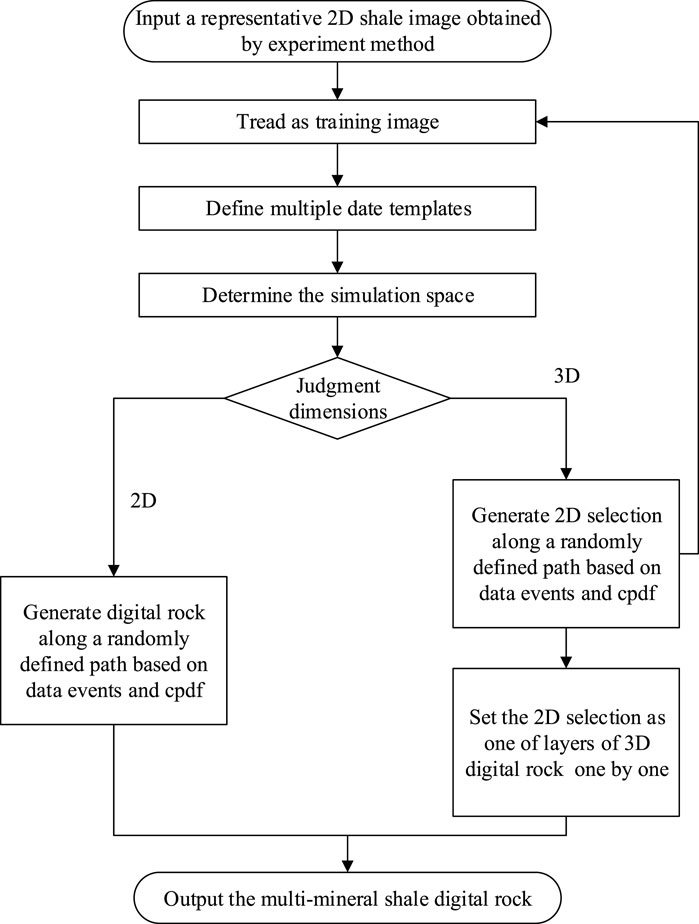
FIGURE 2. Flow chart of multi-mineral shale digital rock reconstruction using MPS.
Step 5: If the simulation is 3D, based on Step 4, a 2D selection will be generated and regarded as a new training image, as shown in the workflow in Figure 2. Repeat steps one to four to generate another new cross-section. The 3D digital rock was reconstructed from the series of 2D cross-sections one by one on the basis of the interactive approach.
After reconstructing the multi-mineral shale digital rock, it is necessary to analyze its quality by evaluating the divergence between the reconstructed results and the training image of the shale. The feasibility of this reconstruction method should also be evaluated. Then, the two-point correlation function, the petrophysical properties, and the pore structure would be compared.
The MPS reconstruction method differs significantly from traditional reconstruction methods, particularly with respect to quality evaluation standards. The similarity between the reconstructed image obtained by the traditional reconstruction approach and the original image is evaluated by the ratio of voxels with the same state value at the same position as the total voxel. A higher ratio indicates better reconstruction similarity. However, this criterion does not apply to MPS reconstruction. The MPS simulation doesn’t rely on an exact match between the simulated and training images during reconstruction. The primary goal is to extract details about the training image’s microstructure and replicate them in the digital rock that has been reconstructed. Multiple results can be obtained using the MPS simulation, and all of these results can reflect the microstructure characteristics of the training image. The quality of the reconstruction results depends on whether these microstructural features can be copied to the reconstructed digital rock.
When the spatial microstructure changes, the two-point correlation function can show how the phases are related and how they vary and can be used as the evaluation basis of the reconstruction. If two images have the same trend in the two-point correlation function, this indicates that the attribute phases have similar microstructural features, and vice versa. For the evaluation of multi-mineral shale digital rocks, the two-point correlation function can be defined as the possibility that two voxel positions with a spacing h in the digital rock image demonstrate the same phase state and can be expressed as (Hashemi et al., 2014):
where
In the context of statistical analysis, the two-point correlation function just reflects the similarity degree between the training and the reconstruction images. However, it usually occurs when the low-order statistical functions of each phase in the training image are identical but the morphological microstructure is very different. From a practical application point of view, the reconstructed digital rocks will be adopted to investigate their reservoir physical properties, such as flow features and conductivity. These physical properties are closely correlated to the spatial features, pore structure, distribution, and different phases. Therefore, we need to evaluate the reconstructed digital rocks by analyzing the morphological characteristics of the different attribute phases.
Due to the inherent differences in scale between 2D and 3D images, different morphological feature parameters must be chosen in order to probe the discrepancy between the reconstructed model and the training model used as a benchmark. For comparison and evaluation with 2D images, the percentage of different attribute phases, number, and variety of pore characteristics such as average radius, tortuosity, and fractal dimension were analyzed as the criteria for morphological feature analysis (Maurer et al., 2003; Müllner et al., 2016). Similarly, for comparison and evaluation with 3D images, the percentages of different attribute phases, radius distribution curves (Dong and Blunt, 2009), fractal dimension, tortuosity, and coordination number distribution were used for comparison and evaluation with 3D images.
The percentage of different attribute phases is the proportion of voxels in the overall space of the target attribute phase. Porosity, for example, is the percentage of the pore phase. The radii of the different attribute phases are defined here as the equivalent circle or sphere radius of the target attribute phase, as shown in Figure 3, to solve the pore radius of the 2D image. The number of equivalent circles or spheres is the number of target attribute phases, and the distribution curve of the radii of the whole number corresponds to the target attribute phase radius distribution curve. Fractal dimensions can be adopted to show the spatial topology of different attribute phases. The size of the target attribute phase is self-similar to that of the interval with
where
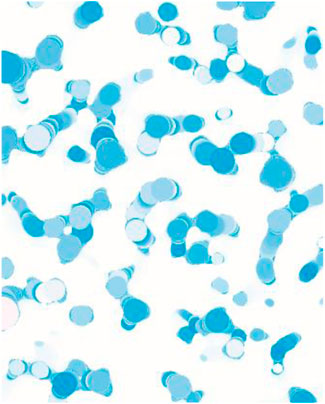
FIGURE 3. Schematic showing the pore radius location of the 2D image, pure white shown in solid pixels, and different depths of blue represent the process of locating the pore radius.
The tortuosity, as an important parameter describing the seepage path, depends mainly on material transport properties, including permeability, electrical and thermal conductivity in porous rocks, and is calculated as the proportion of the real length of the seepage channel to the apparent length through the porous medium (Latour et al., 1995; Fu et al., 2021). The coordination number, which is also an important parameter influencing the seepage law, refers to the number of throats connecting the pore to the surrounding pores.
Investigating fluid flow in digital rocks, as well as the coexistence and distribution pattern of multi-phase fluids, will shed light on the relationship between a rock’s morphological structure and its flow characteristics and provide a solid scientific foundation for studies of relevant applications. The image-based microscopic flow simulation method was developed based on digital rocks combined with computational fluid dynamics methods, which is a common method to simulate the unidirectional and two-phase seepage characteristics of complex rock structures.
For single-phase fluid flow, the finite volume method was utilized to calculate the incompressible Navier–Stokes Equation to determine the velocity field of the digital rocks (Aziz et al., 2018), and the permeability of the digital rocks was calculated. In the flow direction, the inlet and outlet are imposed constant pressure boundary conditions. The fluid-solid interface is a non-slip boundary.
For water-oil two-phase flow, the entire experimental process included oil and water immersion. To simulate oil accumulation in the reservoir, the digital rock was first saturated with water in a drainage process followed by an oil imbibition process. The pore was completely occupied by water after the drainage due to its hydrophilicity. After oil imbibition, the non-wetting oil phase was usually in the pore center, while the wetting water phase preferred to stay at the corners. Then water was injected from the inlet to displace the oil, which aimed to imitate the water flooding process in the realistic reservoir. The simulation approach described above led to the determination of the relative permeability of phases (Soulaine et al., 2021; Yang et al., 2021).
Four different types of reconstructed simulation cases were adopted to illustrate the practical application capability of the developed algorithm. The two-point correlation function was viewed as a statistical indicator. To evaluate the reconstructed reliability of images and validate the accuracy of the proposed method, the training (reference) image and the reconstructed models were compared with morphological pore structure and fluid flow parameters incorporating absolute and relative permeability curves.
The reconstruction of 2D shale digital rocks based on 2D segmented images was chosen as the first case of reconstruction simulation in this study because it is the basis for the subsequent construction of 3D models based on 2D images. In this simulation case, a 2D shale segmentation image of 1000×1000 pixel size was selected as the training image, as illustrated in Figure 4A), which was scanned at a resolution of 60 nm/voxel and generated through combining the proposed algorithm to obtain realizations 1 and 2, as depicted in Figures 4B, C. The images contained organic and inorganic pores, organic matter, matrix, and pyrite. Visually comparing the reconstructed images and the training image, it was found that there was a good similarity between different phases, both in terms of their appearance and shapes. Despite the visual similarity, the visual perception was relatively subjective and could not be quantified for comparison. Therefore, for quantitative comparison, three parameters were selected, namely, the two-point correlation function, morphological structural characteristics, and fluid flow characteristics.
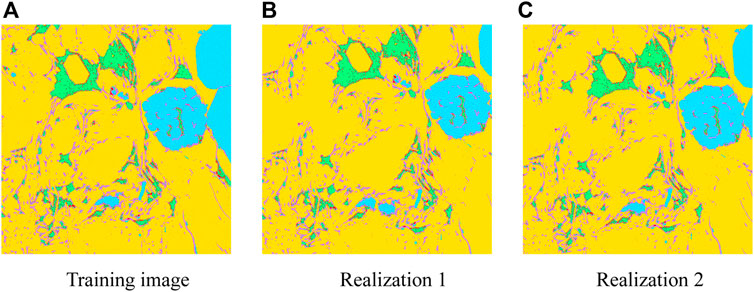
FIGURE 4. Comparison of 2D shale segmented digital rocks from the training image and different realizations. (A) Training image. (B) and (C) Realization 1 and 2, respectively, which were reconstructed using the suggested model. Red indicates the organic pore phase, green shows the organic matter phase, purple indicates the inorganic pore phase, yellow indicates the matrix, and light blue indicates the pyrite phase.
The two-point correlation function was plotted for the evaluation of the statistical change characteristics of the topological relationship between the training image and the reconstructed model, as plotted in Figure 5. The x-axis indicates the hysteresis distance, and the y-axis depicts the calculated value of the two-point correlation function of the training image and different reconstructed models of organic and inorganic pores, organic matter phases, and pyrite phases, which show a high degree of agreement, as reflected by the corresponding values of the hysteresis distance and two-point correlation function when the curve ripples and begins to smooth.
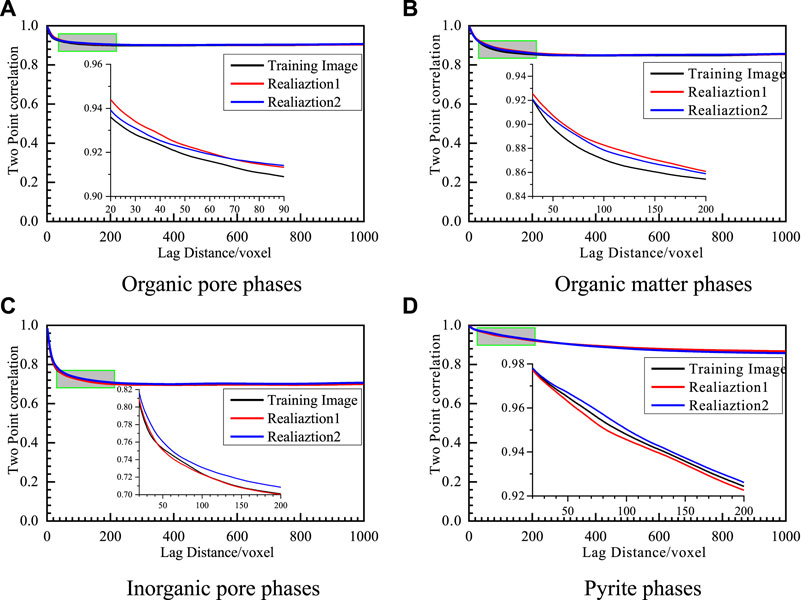
FIGURE 5. Two-point correlation functions of different phases for the training image and two realizations generated by the suggested model, (A), (B), (C), and(D) are comparisons of two-point correlation functions of the training image and different realizations (realizations one and 2) for organic pore, organic matter, inorganic pore, and pyrite phase, respectively. Black represents the training image, red represents realization one and blue is realization 2.
In a statistical perspective, the two-point correlation function may not be a reliable indicator of spatial morphology and geometric structure, and spatial pore structures with similar two-point correlation functions can also have very different morphological characteristics. For this reason, the relevant morphological structural characteristics are summarized in Table 1. From the percentage of different phases, the values of the percentage of organic pores, organic matter, and inorganic pores in realizations one and two and the training image are very similar. The error ratios are calculated using Eq. 6 to quantify the difference between the reconstructed and training models in terms of the percentage of different phases. Compared with the training images, the error ratios of the percentages of organic pores, organic matter, and inorganic pores in realization one are 1.35%, 3.24%, and 3.05%, respectively, and 4.05%, 3.09%, and 0.7%, respectively, in realization 2. The values of the percentages of matrix and pyrite in realizations one and two are different from those in the training image. Compared with the training image, the error ratios of the percentages of matrix and pyrite in realization one were 6.7% and 40.02%, respectively, and the error ratios of the percentages of matrix and pyrite in realization two were 5.52% and 31.08%, respectively.
where
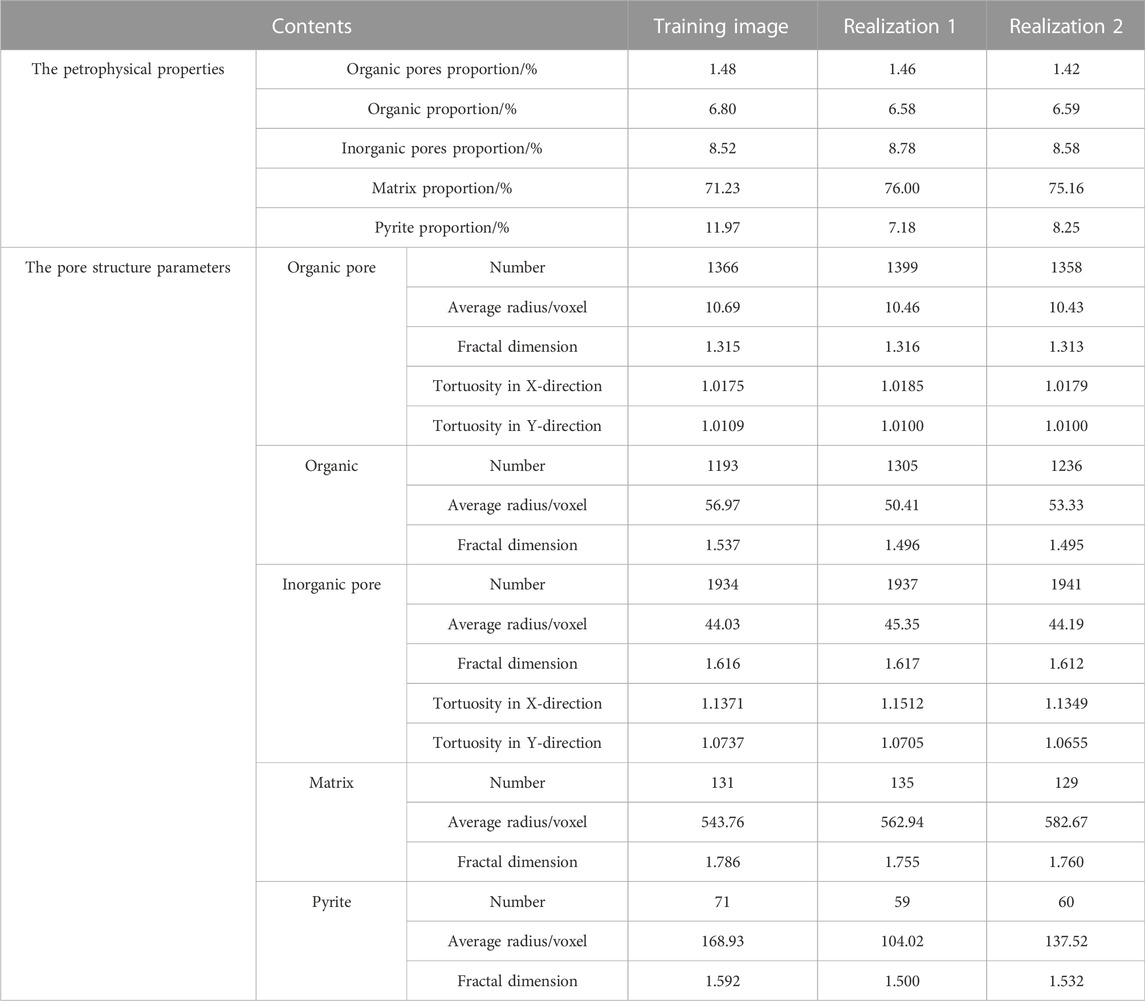
TABLE 1. Petrophysical properties and pore structure parameters of the training image and two realizations obtained by the proposed approach.
Considering the number of equivalent regular structures, average radii, and fractal dimensions of organic and inorganic pores, organic matter, matrix, and pyrite, it can be seen that the numerical differences between realizations one and two and the training image are not significant, which indicates that the reconstructed models and the training image exhibit similar morphological structural characteristics. Realizations one and two agree well with the training image in relation to the tortuosity of organic and inorganic pores in x and y-directions, which shows that the reconstructed model and the training image have similar connectivity. The above analysis further confirms the reliability of the proposed algorithm. Because the 2D images involved in this simulation example are mostly discrete, unconnected organic and inorganic pore spaces, the simulation of unidirectional and two-phase fluid flow cannot be carried out, so the permeability and relative permeability cannot be calculated. Therefore, a comparison of the relevant fluid flow characteristics could not be carried out in this simulation example.
This study further developed the method of constructing 3D shale digital rocks based on 2D segmented images based on the reconstruction of 2D shale digital rocks based on 2D segmented images to evaluate the algorithm’s practical application capability. Figure 6A and B show a real reference model with a pixel size of 400 × 400 × 400 used in this simulation and a cross-Section 2D shale segmentation image selected as the training image, which was scanned at a resolution of 4 nm/voxel and reconstructed by combining the algorithm proposed in this paper to obtain realizations one and two Figure 6C and D. From the figures, it is visible that the images are made of organic pores, organic matter, matrix, and pyrite. Moreover, comparing the reconstructed images with the reference image shows that there is some noise in the reconstructed models, which is unavoidable in the stochastic method. However, there is a lot similarity between the different phases in terms of their appearance and shape. Despite the visual similarity, visual perception is relatively subjective and cannot be compared quantitatively; thus, two-point correlation function, morphological structure features, and fluid flow features are selected for quantitative comparison.
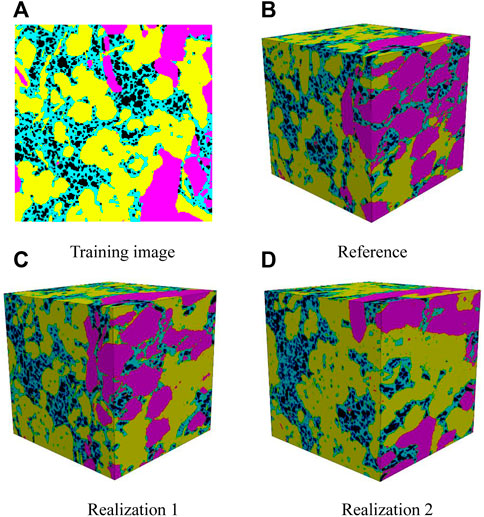
FIGURE 6. Comparison of (A) the 2D training image (B) 3D reference image and (C) and (D) realizations one and two which are reconstructed from the training image using the proposed approach. Black indicates the organic pores, light blue indicates the organic matter, yellow indicates the matrix, and pink represents the pyrite.
Figure 7 shows the change in the two-point correlation function with distance for different phases. The results demonstrate a high degree of consistency, which is reflected in the corresponding values of the hysteresis distance and two-point correlation function when the curve ripples and begins to smooth. When the curve is smoothed, the two-point correlation functions of the matrix have different values compared to the ones of organic pores and organic matter. This discrepancy can be traced back to a proportional change in the matrix between the reference image and the reconstructed versions of the image. However, the consistent trends of both curves indicate that the statistical characteristics of the matrix are similar.
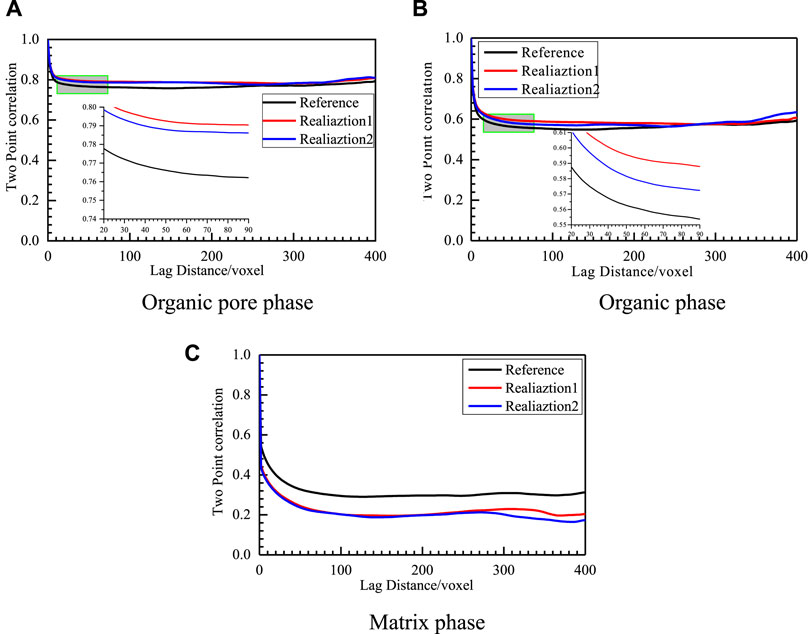
FIGURE 7. Comparison of two-point correlation functions of reference image and reconstructed images for different phases(A) organic pore phase (B) organic phase, (C) matrix phase Black represents the training image, red represents realization one and blue represents realization 2.
Spatial pore structures with similar two-point correlation functions may have very different morphological characteristics. Table 2 calculates the petrophysical properties and pore structure parameters. The percentage values of the organic pores and organic matter in realizations 1 and 2, and the reference image were very close. Furthermore, the percentage values of matrix and pyrite in realizations 1 and 2, and reference image were somewhat different. In order to further quantify the percentage values of the various phase differences in the considered images, the error ratios were calculated using Eq. 6. Compared with the reference image, the error ratios of the occupancy ratios of organic pores and organic matter in realization one were 11.10% and 6.80%, respectively, and 9.13% and 3.25% in realization 2. On the other hand, the error ratios of the percentages of matrix and pyrite in realization one were 20.65% and 39.66%, respectively, and 23.49% and 54.86% in realization 2. Despite the significant differences in the ratios of matrix and pyrite in the reconstructed models, the pore space parameters of organic pores and organic matter have the most impact on the flow.
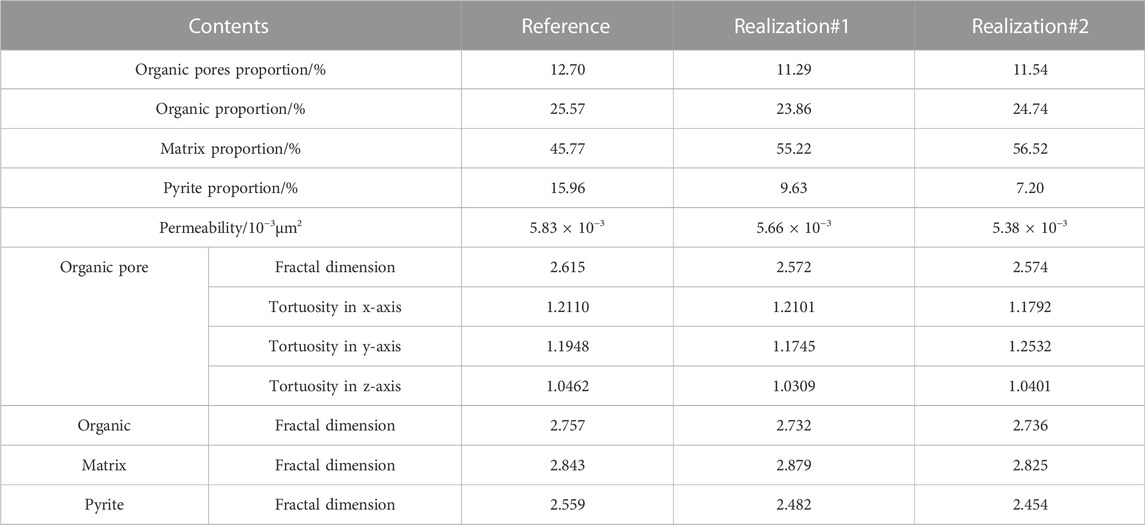
TABLE 2. Petrophysical properties and pore structure parameters of the reference image and two realizations obtained from the proposed approach.
Comparing the equivalent rule radius distributions of organic pores, organic matter, matrix, and pyrite, as depicted in Figure 8, the distribution curves of both realizations one and two are close to those of the reference image. This demonstrates that the reference and reconstructed images have similarity in morphological structure characteristics, which can also be confirmed by the comparison of the fractal dimensions in Table 2. The distribution curves of the coordination numbers of the models are calculated and plotted, as shown in Figure 8B, showing a similar distribution, which indicates that the reference and reconstructed images have similar connectivity. The above analysis provides proof that the proposed algorithm is reliable.
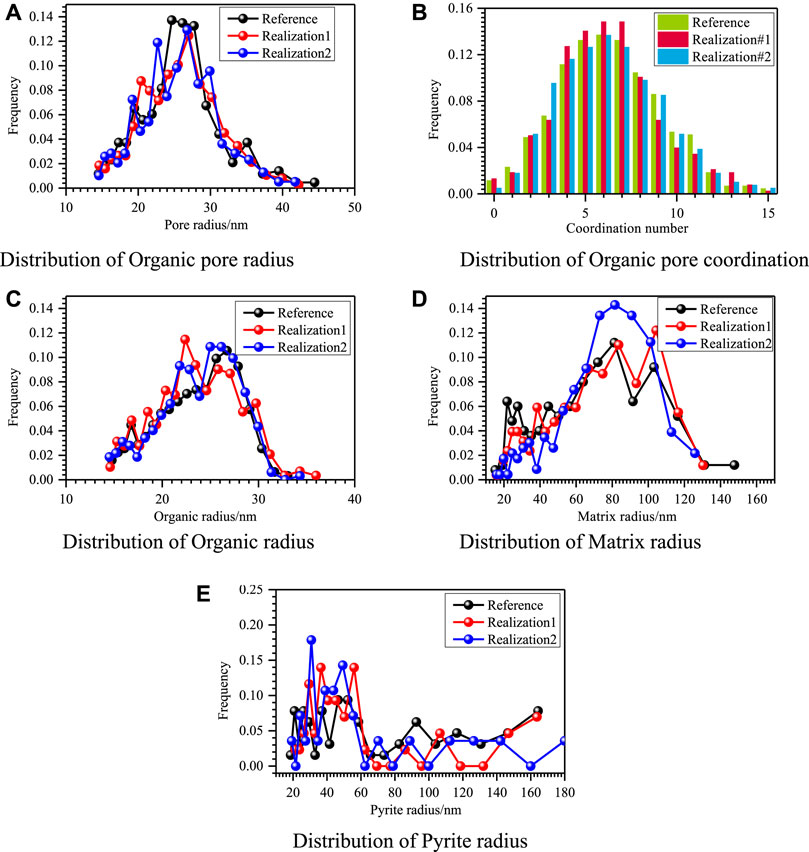
FIGURE 8. Comparison of pore structure distribution of the reference image and two realizations for different phases. (A) Distribution of organic pore radius, (B) distribution of organic pore coordination, (C) distribution of organic matter radius, (D) distribution of matrix radius, and (E) distribution of pyrite radius.
An examination of the two-point correlation function and morphological structure features shows that the proposed algorithms are accurate. However, both parameters are based on small amounts statistical data, and the prediction of absolute and relative permeability based on fluid flow simulation laws is the key to assessing the quality of the reconstructed images. Table 2 shows that the difference between the absolute permeability of the reconstructed images and that of the reference image is small, which further verifies the reliability of the reconstructed model. Compared with the testing of absolute permeability, the testing of the relative permeability is quite difficult because it is highly sensitive to the morphological structure and 3D connectivity. By plotting the relative permeability of the reconstructed models and the reference model, one can note that for the relative permeability of water, the reference and reconstructed model curves follow the same trend and almost overlap (see Figure 9). However, for oil-phase permeability, they have some differences, but their basic curve trends are similar. Comparing the values of connate water saturation, residual oil saturation, and iso-permeability point, the reconstructed models were close to the reference model.
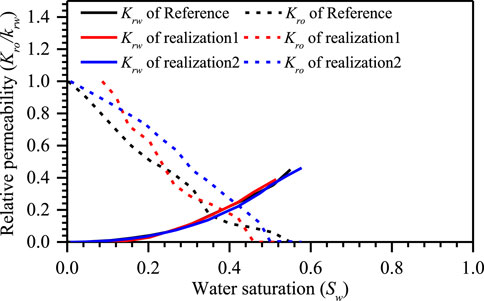
FIGURE 9. Comparison of the predicted relative permeability during the imbibition displacement. Black represents the computed relative permeability of reference, and red and blue are the computed relative permeabilities of realizations 1 and 2, respectively. The solid line is the water relative permeability, and the dashed line is the oil relative permeability.
The simulation cases illustrate how the proposed algorithm is used in this study for multi-mineral digital rock reconstruction with segmented images. In the simulated instances below, we further exhibit the capability of the algorithm in continuous-phase porous media reconstruction applications. As shown in Figure 10A, a 2D shale gray image of 1000×1000 pixel size was chosen as the training image. It was scanned at a resolution of 60 nm/voxel, combined with the proposed algorithm for obtaining realizations one and 2 (see Figure 10B and C).
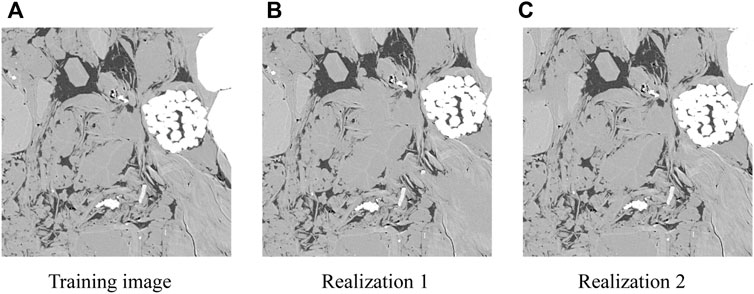
FIGURE 10. Comparison of 2D shale gray digital rocks (A) Training image, (B) realization 1and (C) realization 2. Realizations are reconstructed based on the training image using the proposed approach.
Figure 11 shows the gray value distribution curves of the reconstructed and the training images. It can be shown that the gray value distribution curves of the reconstructed and the training images show a similar three-peak distribution, especially the performance at the peak, which indicates that the two have similar texture characteristics. Based on the delineated gray value as the threshold, the gray image is segmented into different organic pores, organic matter, inorganic matter pores, matrix, and pyrite (see Figure 12). A visual comparison between the reconstructed models and the training image revealed a good similarity between the different phases, both in terms of their appearance and shape. Although the visual perception is relatively subjective and cannot be quantified, two-point correlation functions, morphological structure features, and fluid flow characteristics were selected for quantitative comparison.

FIGURE 11. Comparison of the gray value distribution of the training image and different realizations based on the proposed method. Black is the gray value distribution of the training image. Red and blue are the gray value distributions of realizations 1 and 2, respectively. The green dotted line is the gray value used to segment 2D shale gray digital rocks to obtain 2D shale segmented digital rocks.
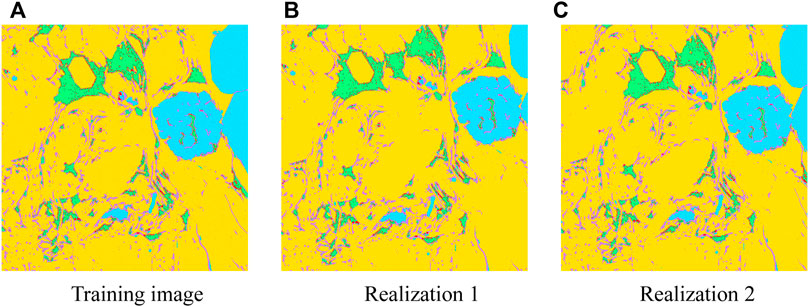
FIGURE 12. 2D shale segmented digital rocks (A) training image, (B) and (C) are realizations 1 and 2, respectively, which are obtained by segmenting the reconstructed gray images. Red indicates the organic pore phase; green indicates the organic matter phase, purple indicates the inorganic pore phase, yellow indicates the matrix, and light blue indicates the pyrite phase.
To evaluate the variation features of the spatial distribution on the reconstructed and training images for different phases, the change of the two-point correlation function was plotted (Figure 13). As evidenced by the corresponding values of the lag distance when the curves ripple trend and the points start to smooth out, the two-point correlation functions of the training image and various reconstructed models of different phases such as the organic pore, organic matter, inorganic pore, and pyrite phases exhibit a high degree of agreement.
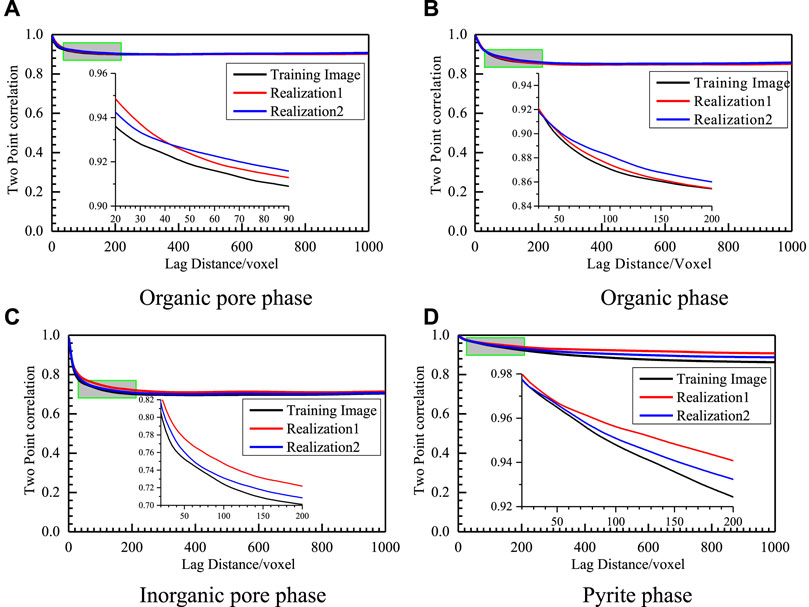
FIGURE 13. Different phases two-point correlation functions (A) Organic pore, (B) organic, (C) inorganic pore phase, and (D) pyrite phase. It should be noted that the images were obtained by segmenting the reconstructed gray images.
The reconstructed models were eventually used to simulate the fluid flow process and predict the seepage properties, which mainly depend on the morphological structure characteristics computed in Table 3. In terms of the percentage of different phases, the percentages of different phases in realizations one and two and the training image are very close to each other. Compared with the training image, the error ratios of the percentages of the organic pore, organic matter, and inorganic pore phases in realization one were 0.68%, 4.56%, and 4.23%, respectively, and 3.38%, 3.82%, and 0.59%, respectively, in realization 2. The values of the percentages of matrix and pyrite in realizations one and two and the training image are somewhat different. Compared with the training image, the error ratios of the percentages of matrix and pyrite in realization one are 6.25% and 36.84%, respectively, and the error ratios of the percentages of matrix and pyrite in realization two are 3.96% and 20.55%, respectively.
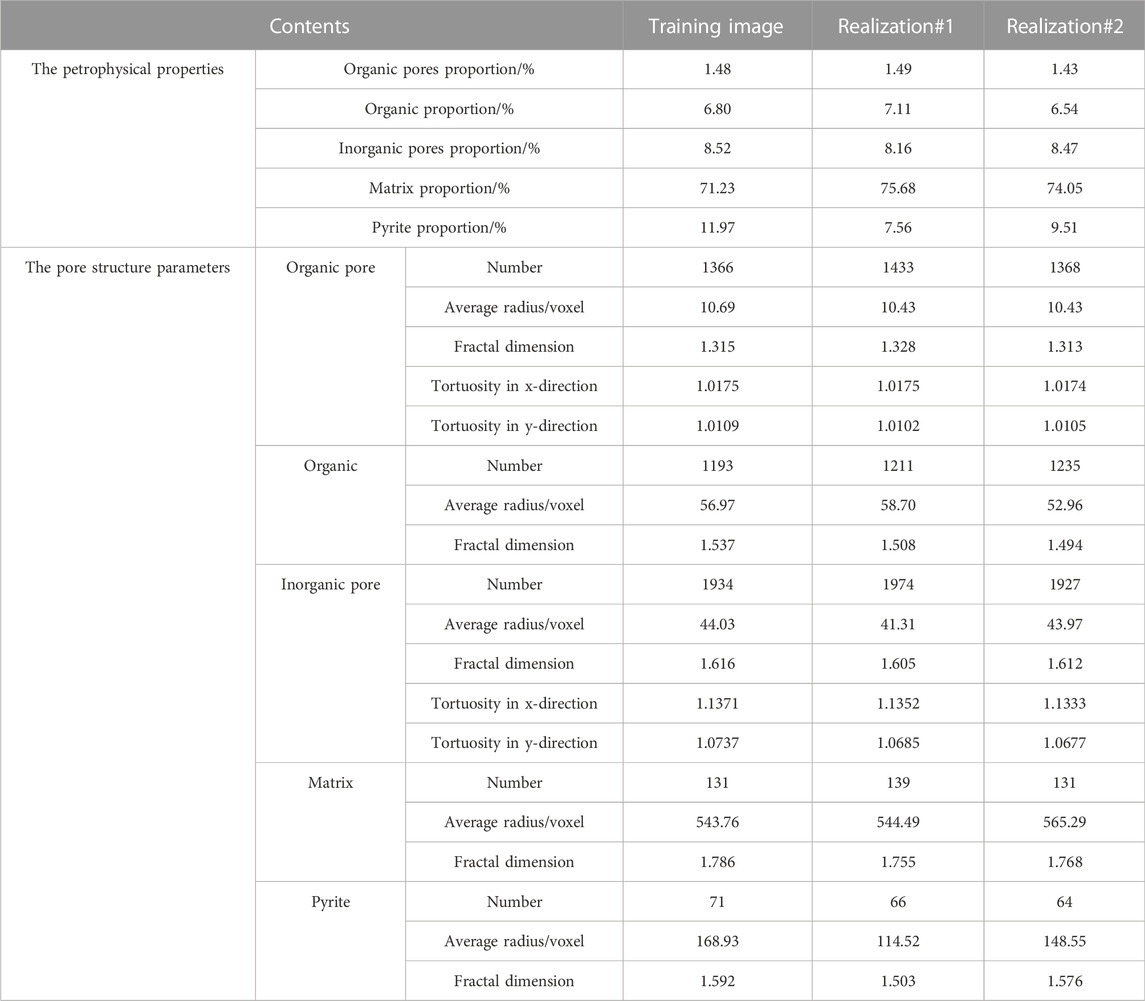
TABLE 3. Petrophysical properties and pore structure parameter of the training image and the realizations obtained by segmenting the reconstructed gray images.
Considering the number of equivalent regular structures, mean radii, and fractal dimensions of phases, it can be understood that the numerical differences between realizations one and two and the training image are not significant, which indicates that the reconstructed model and the training image have similar morphological structure characteristics. The tortuosity of Realizations one and two match well with the training image for organic and inorganic pores in x and y directions, which shows that the reconstructed model and the training images have similar connectivity. The above analysis further confirms the reliability of the proposed algorithm. Unidirectional and two-phase fluid flow simulations cannot be performed in this simulation example because the majority of the 2D images are discontinuous, disconnected organic and inorganic pore spaces. As a result, the permeability and relative permeability cannot be obtained. Therefore, a comparison of the relevant fluid flow characteristics is not carried out in this simulation example.
The study further develops the construction of 3D models based on 2D gray-scale images to evaluate the practical application capability of the proposed algorithm. In this simulation case, a 400×400×400 pixel size is chosen as the real reference model, as shown in Figure 14B, from which a cross-sectional 2D shale gray image is chosen as the training image (see Figure 14A), which was scanned at a resolution of 4 nm/voxel, and reconstructed by combining the proposed algorithm in this paper to obtain realizations 1 and 2, as depicted in Figure 14C and D.
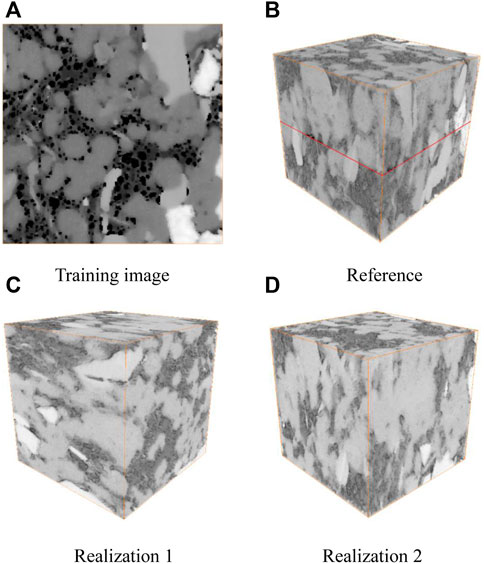
FIGURE 14. Comparison of 3D shale digital rocks (A) Training image, (B) Reference model, (C) and (D) are realizations one and two which are reconstructed based on the training image using the proposed method. Red represents the organic pore phase; green represents the organic phase, purple represents the inorganic pore phase, yellow represents the matrix phase, and light blue represents the pyrite phase.
Figure 15 shows the gray value distribution curves of the reconstructed and the reference images. It can be shown that the gray value distribution curves of the reconstructed model image and the reference image show a similar multi-peak distribution, especially the performance at the peak, which indicates that the two have similar texture characteristics. Based on the demarcated gray values as the thresholds, the gray image is segmented into different organic and inorganic pores, organic matter, matrix, and pyrite (see Figure 16). From the figure, it can be shown that the image contains organic pores, organic matter, matrix, and pyrite and visually compares the reconstructed models with the reference image. However, there is considerable noise in the reconstructed model, which is inevitable with the stochastic method. There is a good resemblance between the various phases in terms of their appearance and shape. However, it cannot be quantitatively compared since it is so subjective. As a result, three types of indicators were chosen for quantitative comparison: two-point correlation functions, morphological pore structure features, and fluid flow features.
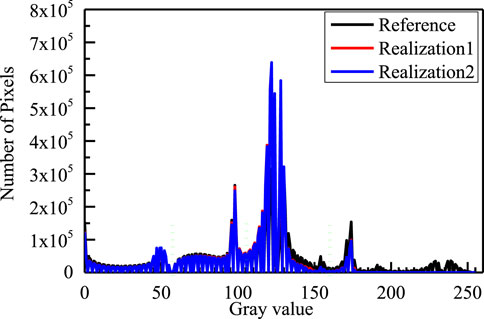
FIGURE 15. Comparison of the gray value distribution of the reference image and different realizations based on the proposed approach. The green dotted line is the gray value used to segment 3D shale gray digital rocks to obtain 3D shale segmented digital rocks.
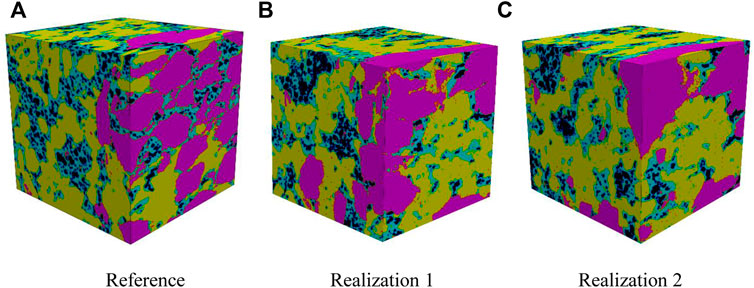
FIGURE 16. 3D shale segmented digital rocks (A) Reference image, (B) and (C) are realizations one and two which are obtained by segmenting the reconstructed gray images. Black represents the organic pore phase, light blue represents the organic phase, yellow represents the matrix phase, and pink represents the pyrite phase.
Here again, the two-point correlation functions of the reference images of organic pores (see Figure 17A) and organic matter (see Figure 17B) of different reconstructed models and the reference image show a high degree of consistency, which is reflected when the curve ripples and begins to smooth. Compared to the organic pore and organic matter, the two-point correlation function of the matrix (see Figure 17C) has different values when it is smoothed, which is related to the difference in pyrite in the reconstructed images. This is related to the difference in the proportion of pyrite in the reconstructed image and the reference model. However, the consistent trends of the two curves indicate that the statistical characteristics of pyrite are similar.
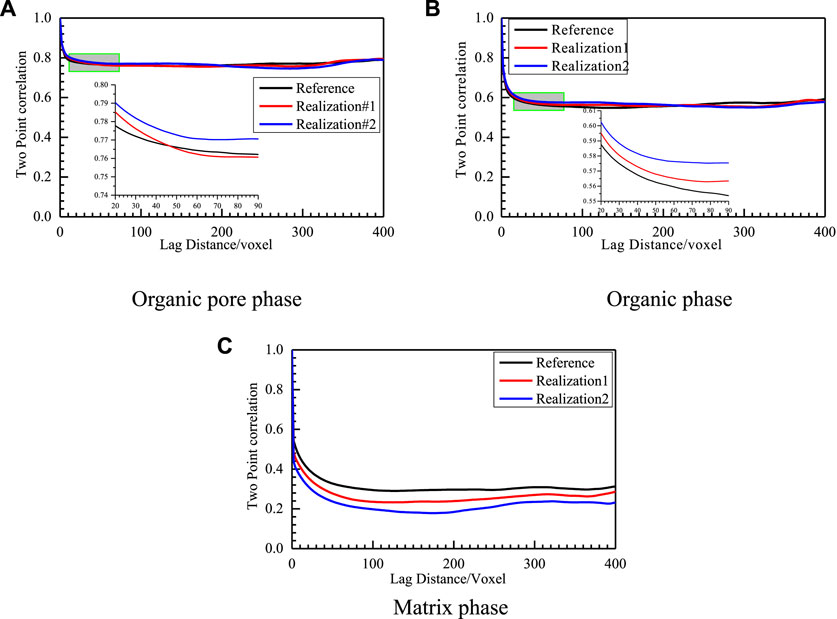
FIGURE 17. Two-point correlation functions of different phases for the training image and two realizations obtained by segmenting the reconstructed gray images, (A), (B), and (C) are comparisons of two-point correlation functions of the reference image and different realizations (realization one and 2) obtained by segmenting the reconstructed gray images for the organic pore, organic matter, and matrix phase, respectively. Black represents the training image, red represents realization one and blue represents realization 2.
The relevant pore structure parameters are computed in Table 4, and the occupancy ratio values of the organic pore and organic matter in realizations one and two and the reference image are very close. For further quantitative measurements of the different phase occupancy ratios in the reconstructed and the reference models, differences were evaluated by calculating the error ratios defined in Eq. 6. Compared with the reference image, the error ratios of organic pores and organic matter occupancy ratios in realization one were 2.13% and 0.82%, respectively, and 0.008% and 2.62%, respectively, in realization 2. The values of the percentages of matrix and pyrite in realizations one and two and the reference image were somewhat different. Compared with the reference image, the error ratios of the percentage of matrix and pyrite in realization one were 12.37% and 35.84%, respectively, and the error ratios of the percentages of matrix and pyrite in reconstructed realization two were 18.72% and 49.56%, respectively. In spite of the significant disparities in the reconstructed models’ percentages of pyrite and matrix, the pore structure characteristics had the biggest impact on the fluid flow characteristics.
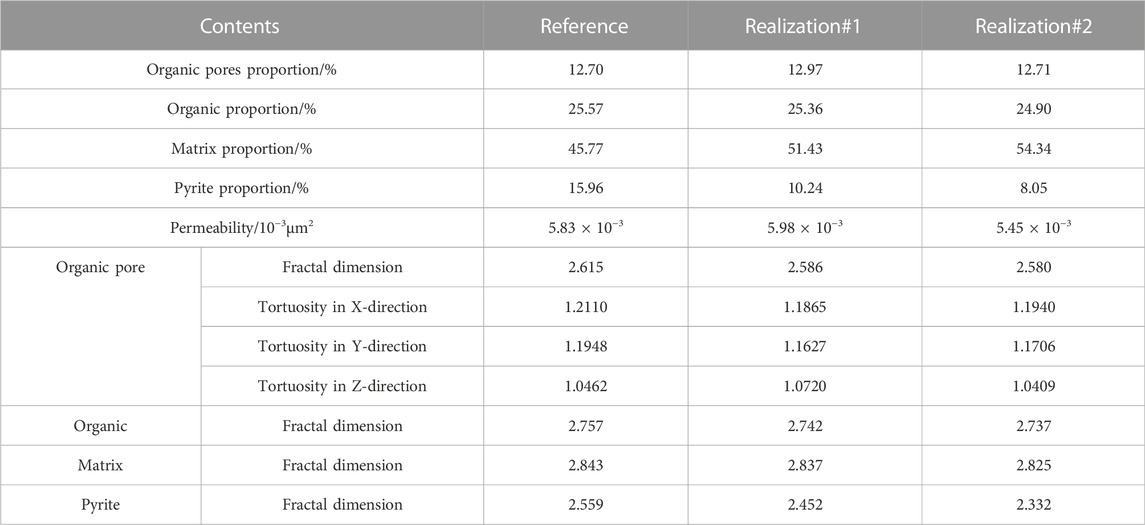
TABLE 4. Petrophysical properties and pore structure parameters of the training image and two realizations were obtained through segmentation of the reconstructed gray images.
Comparing the equivalent rule radius distributions of organic pores, organic matter, matrix, and pyrite, as depicted in Figure 18, the distribution curves of both realizations one and two are close to those of the reference image. This means that the reconstructed images and the reference image show similar morphological and structural features, which can also be confirmed by the comparison of fractal dimensions in Table 4. Furthermore, the plot of their coordination numbers reveals similarity in distribution, which means that they have similar connectivity (see Figure 18). The above analysis further confirms the reliability of the proposed algorithm.
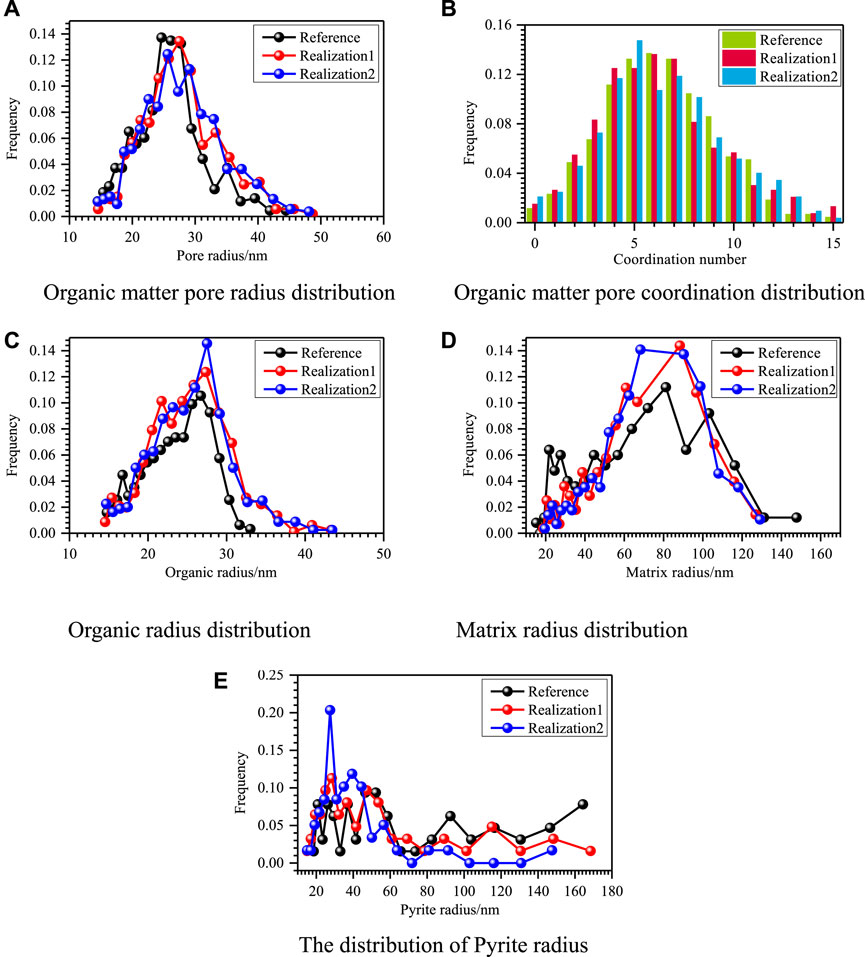
FIGURE 18. Comparison of pore structure distribution of the reference model and two realizations reconstructed by the proposed approach. (A) Organic pore radius distribution, (B) organic pore coordination distribution, (C) organic radius distribution, (D) matrix radius, and (E) pyrite radius. In the pictures (A), (C), (D), and (E), black is the training image distribution, and red and blue are the distributions of realizations 1 and 2, respectively. In (B), green is the training image distribution, and red and blue are the distributions of realizations 1 and 2, respectively.
Once again, the assessment of the two-point correlation function and morphological structure features shows that the proposed algorithms are accurate. However, as previously stated, both have the disadvantage of being limited to small data sets. Thus, the prediction of absolute and relative permeability based on fluid flow simulation laws is the key to assessing the quality of the reconstructed images. The results in Table 4 reveal that the difference between the absolute permeability of the reconstructed images and that of the reference image is slight, further validating the accuracy of the proposed approach. Testing the oil-water relative permeability is difficult, because it is highly sensitive to the morphological structure and 3D connectivity. By plotting the relative permeability of the reconstructed images and the reference image, as depicted in Figure 19, it can be shown that for the relative permeability of water, their curves follow a similar trend and almost overlap, but for oil relative permeability, the reconstructed models differ slightly from the reference model. However, their basic trends are similar. Compared to the values of the connate water saturation, residual oil saturation, and iso-permeability point, the reconstructed models are close to the reference model.
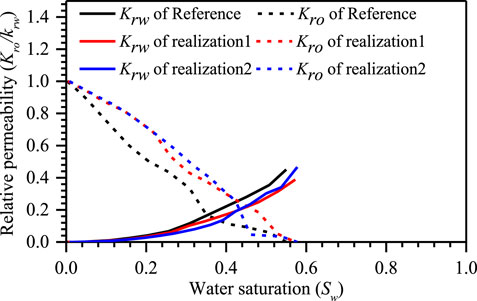
FIGURE 19. Comparison of predicted relative permeabilities to the oil and water phases during imbibition process. Black represents the computed relative permeability of the reference model, red and blue are the computed relative permeabilities of realizations 1 and 2, respectively. The solid line is the relative permeability of the water phase, and the dashed line is the relative permeability of the oil phase.
Given that shale oil and gas reservoirs develop multiple types of complex pores and minerals and exhibit multi-scale characteristics, the most widely used experimental physical methods are limited by the contradiction of resolution and representative elementary volume, which makes it difficult to accurately construct shale multi-mineral digital rocks and thus carry out subsequent fluid flow simulation studies. Therefore, it is of utmost importance to develop a numerical approach to construct shale multi-mineral digital rocks.
1 This paper proposes an innovative approach for constructing shale multi-mineral digital rocks from 2D images (segmented or gray), which is based on multi-point statistics, and can realize the construction of segmented and gray phase shale multi-mineral digital rocks in 2D and 3D. This work shows that it is possible to obtain 3D shale multi-mineral digital rocks using only one 2D training image as the input, combined with the proposed algorithm, while reproducing the pore structures in a real model.
2 In different simulation cases, the two-point correlation function and morphological pore space features of each phase are well reproduced in the process of constructing 2D shale digital rocks based on 2D training images, both in the segmented and gray regions. However, for the process of constructing 3D shale digital rocks based on 2D images, the two-point correlation function and morphological structure of organic pores and organic matter are well reproduced, both in the segmented and gray, unfortunately, the matrix and pyrite are relatively poorly reconstructed. Mathematically, the construction of 3D images from 2D images can be viewed as a spatially inverse problem that only borrows the pore structure from 2D images and restores the pore structure in 3D images, which has a large amount of randomness and uncertainty. However, based on the performance of absolute and relative permeability, the values and curve distributions of the reconstructed images are similar to those of the reference image, which indicates that the reconstructed model reproduces the microstructure of the real 3D space. Improving the accuracy of the algorithm is a critical task for moving the research forward in the next step.
3 The algorithm proposed in this paper provides a straightforward and fast tool for 3D multi-mineral reconstruction of 2D slices. The application of the proposed algorithm through multiple simulation cases shows that the algorithm is reliable and time- and cost-effective compared to experimental methods. Although the algorithm is proposed in the context of shale, but the algorithm can be extended to other types of reservoirs as well.
The raw data supporting the conclusion of this article will be made available by the authors, without undue reservation.
LL, HS, and JY conceived the project; LL coded the related software and carried out the simulation and analyses and wrote the original manuscript; GI suggested the organization of the manuscript; HS and LZ provided technical advice throughout the project; YY and KZ assisted with the writing of this paper; JY supervised the overall project, and all author contributed to revising and improving the manuscript.
The author thanks the sponsors of this research: the National Natural Science Foundation of China (No. 52122402, 12,172,334, 42,090,024), Shandong Provincial Natural Science Foundation (No. ZR2022JQ23), the Fundamental Research Funds for the Central Universities (No. 22CX01001A-4), and Program for Changjiang Scholars and Innovative Research Team in University (IRT_16R69).
The authors declare that the research was conducted in the absence of any commercial or financial relationships that could be construed as a potential conflict of interest.
All claims expressed in this article are solely those of the authors and do not necessarily represent those of their affiliated organizations, or those of the publisher, the editors and the reviewers. Any product that may be evaluated in this article, or claim that may be made by its manufacturer, is not guaranteed or endorsed by the publisher.
Andrä, H., Combaret, N., Dvorkin, J., Glatt, E., Han, J., Kabel, M., et al. (2013). Digital rock physics benchmarks—Part I: Imaging and segmentation. Comput. Geosciences 50, 25–32. doi:10.1016/j.cageo.2012.09.005
Andrä, H., Combaret, N., Dvorkin, J., Glatt, E., Han, J., Kabel, M., et al. (2013). Digital rock physics benchmarks—Part II: Computing effective properties. Comput. Geosciences 50, 33–43. doi:10.1016/j.cageo.2012.09.008
Aziz, R., Joekar-Niasar, V., and Martinez-Ferrer, P. (2018). Pore-scale insights into transport and mixing in steady-state two-phase flow in porous media. Int. J. Multiph. Flow 109, 51–62. doi:10.1016/j.ijmultiphaseflow.2018.07.006
Blunt, M. J., Bijeljic, B., Dong, H., Gharbi, O., Iglauer, S., Mostaghimi, P., et al. (2013). Pore-scale imaging and modelling. Adv. Water Resour. 51, 197–216. doi:10.1016/j.advwatres.2012.03.003
Bultreys, T., Van Hoorebeke, L., and Cnudde, V. (2015). Multi-scale, micro-computed tomography-based pore network models to simulate drainage in heterogeneous rocks. Adv. Water Resour. 78, 36–49. doi:10.1016/j.advwatres.2015.02.003
Caers, J., and Zhang, T. (2004). Multiple-point geostatistics: A quantitative vehicle for integrating geologic analogs into multiple reservoir models. AAPG Mem. 80, 383–394.
Cang, R., Xu, Y., Chen, S., Liu, Y., Jiao, Y., and Yi Ren, M. (2017). Microstructure representation and reconstruction of heterogeneous materials via deep belief network for computational material design. J. Mech. Des. 139 (7), 071404. doi:10.1115/1.4036649
Cnudde, V., and Boone, M. N. (2013). High-resolution X-ray computed tomography in Geosciences: A review of the current technology and applications. Earth-Science Rev. 123, 1–17. doi:10.1016/j.earscirev.2013.04.003
Comunian, A., Renard, P., and Straubhaar, J. (2012). 3D multiple-point statistics simulation using 2D training images. Comput. Geosciences 40, 49–65. doi:10.1016/j.cageo.2011.07.009
Deng, H., Hu, X., Li, H. A., Luo, B., and Wang, W. (2016). Improved pore-structure characterization in shale formations with fesem technique. J. Nat. Gas Sci. Eng. 35, 309–319. doi:10.1016/j.jngse.2016.08.063
Dong, H., and Blunt, M. J. (2009). Pore-network extraction from micro-computerized-tomography images. Phys. Rev. E 80 (3), 036307. doi:10.1103/PhysRevE.80.036307
Feng, J., He, X., Teng, Q., Ren, C., and Chen, H. (2019). Reconstruction of porous media from extremely limited information using conditional generative adversarial networks. Phys. Rev. E 100 (3), 033308. doi:10.1103/PhysRevE.100.033308
Feng, Q., Xu, S., Xing, X., Zhang, W., and Wang, S. (2020). Advances and challenges in shale oil development: A critical review. Adv. Geo-Energy Res. 4 (4), 406–418. doi:10.46690/ager.2020.04.06
Fu, J., Thomas, H. R., and Li, C. (2021). Tortuosity of porous media: Image analysis and physical simulation. Earth-Science Rev. 212, 103439. doi:10.1016/j.earscirev.2020.103439
Gao, M., He, X., Teng, Q., Zuo, C., and Chen, D. (2015). Reconstruction of three-dimensional porous media from a single two-dimensional image using three-step sampling. Phys. Rev. E 91 (1), 013308. doi:10.1103/PhysRevE.91.013308
Gerke, K., Karsanina, M., and Skvortsova, E. (2012). Description and reconstruction of the soil pore space using correlation functions. Eurasian Soil Sci. 45 (9), 861–872. doi:10.1134/S1064229312090049
Gu, X., Cole, D. R., Rother, G., Mildner, D. F. R., and Brantley, S. L. (2015). Pores in marcellus shale: A neutron scattering and fib-sem study. Energy & Fuels 29 (3), 1295–1308. doi:10.1021/acs.energyfuels.5b00033
Hackley, P. C., Jubb, A. M., Burruss, R. C., and Beaven, A. E. (2020). Fluorescence spectroscopy of ancient sedimentary organic matter via confocal laser scanning microscopy (ClSM). Int. J. Coal Geol. 223, 103445. doi:10.1016/j.coal.2020.103445
Hackley, P. C., and Kus, J. (2015). Thermal maturity of tasmanites microfossils from confocal laser scanning fluorescence microscopy. Fuel 143, 343–350. doi:10.1016/j.fuel.2014.11.052
Hashemi, S., Javaherian, A., Ataee-pour, M., and Khoshdel, H. (2014). Two-point versus multiple-point geostatistics: The ability of geostatistical methods to capture complex geobodies and their facies associations—an application to A channelized carbonate reservoir, southwest Iran. J. Geophys. Eng. 11 (6), 065002. doi:10.1088/1742-2132/11/6/065002
Huang, L., Liu, J., Ji, Y., Gong, X., and Qin, L. (2018). A review of multiscale expansion of low permeability reservoir cracks. Petroleum 4 (2), 115–125. doi:10.1016/j.petlm.2017.09.002
Huang, T., Lu, D-T., Li, X., and Wang, L. (2013). Gpu-based snesim implementation for multiple-point statistical simulation. Comput. Geosciences 54, 75–87. doi:10.1016/j.cageo.2012.11.022
Hyman, J. D., and Winter, C. L. (2014). Stochastic generation of explicit pore structures by thresholding Gaussian random fields. J. Comput. Phys. 277, 16–31. doi:10.1016/j.jcp.2014.07.046
Ilgen, A. G., Heath, J. E., Akkutlu, I. Y., Bryndzia, L. T., Cole, D. R., Kharaka, Y. K., et al. (2017). Shales at all scales: Exploring coupled processes in mudrocks. Earth-Science Rev. 166, 132–152. doi:10.1016/j.earscirev.2016.12.013
Jiang, W., Zhang, P., Li, D., Li, Z., Wang, J., Duan, Y., et al. (2022). Reservoir characteristics and gas production potential of deep coalbed methane: Insights from the no. 15 coal seam in shouyang block, Qinshui Basin, China. Unconv. Resour. 2, 12–20. doi:10.1016/j.uncres.2022.06.001
Josh, M., Esteban, L., Delle Piane, C., Sarout, J., Dewhurst, D., and Clennell, M. (2012). Laboratory characterisation of shale properties. J. Petroleum Sci. Eng. 88, 107–124. doi:10.1016/j.petrol.2012.01.023
Kang, Z., Zhao, Y., and Yang, D. (2020). Review of oil shale in-situ conversion technology. Appl. Energy 269, 115121. doi:10.1016/j.apenergy.2020.115121
Katz, B., Gao, L., Little, J., and Zhao, Y. R. (2021). Geology still matters – unconventional petroleum system disappointments and failures. Unconv. Resour. 1, 18–38. doi:10.1016/j.uncres.2021.12.001
Klaver, J., Desbois, G., Littke, R., and Urai, J. L. (2016). Bib-sem pore characterization of mature and post mature posidonia shale samples from the hils area, Germany. Int. J. Coal Geol. 158, 78–89. doi:10.1016/j.coal.2016.03.003
Latour, L., Kleinberg, R. L., Mitra, P. P., and Sotak, C. (1995). Pore-size distributions and tortuosity in heterogeneous porous media. J. Magnetic Reson. Ser. A 112 (1), 83–91. doi:10.1006/jmra.1995.1012
Li, B., Nie, X., Cai, J., Zhou, X., Wang, C., and Han, D. (2022). U-Net model for multi-component digital rock modeling of shales based on CT and QEMSCAN images. J. Petroleum Sci. Eng. 216, 110734. doi:10.1016/j.petrol.2022.110734
Liu, L., Yao, J., Sun, H., Zhang, L., and Yang, Y. (2018). Reconstruction of digital rock considering micro-fracture based on multi-point statistics. Chin. Sci. Bull. 63 (30), 3146–3157. doi:10.1360/N972018-00221
Ma, L., Fauchille, A-L., Dowey, P. J., Figueroa Pilz, F., Courtois, L., Taylor, K. G., et al. (2017). Correlative multi-scale imaging of shales: A review and future perspectives. Geol. Soc. Lond. Spec. Publ. 454 (1), 175–199. doi:10.1144/SP454.11
Ma, Y., Cai, X., and Zhao, P. (2018). China's shale gas exploration and development: Understanding and practice. Petroleum Explor. Dev. 45 (4), 589–603. doi:10.1016/S1876-3804(18)30065-X
Maurer, C. R., Qi, R., and Raghavan, V. (2003). A linear time algorithm for computing exact euclidean distance transforms of binary images in arbitrary dimensions. IEEE Trans. Pattern Analysis Mach. Intell. 25 (2), 265–270. doi:10.1109/TPAMI.2003.1177156
Mosser, L., Dubrule, O., and Blunt, M. J. (2017). Reconstruction of three-dimensional porous media using generative adversarial neural networks. Phys. Rev. E 96 (4), 043309. doi:10.1103/PhysRevE.96.043309
Müllner, T., Unger, K. K., and Tallarek, U. (2016). Characterization of microscopic disorder in reconstructed porous materials and assessment of mass transport-relevant structural descriptors. New J. Chem. 40 (5), 3993–4015. doi:10.1039/C5NJ03346B
Nie, X., Zou, C., Li, Z., Meng, X. H., and Qi, X. (2016). Numerical simulation of the electrical properties of shale gas reservoir rock based on digital core. J. Geophys. Eng. 13 (4), 481–490. doi:10.1088/1742-2132/13/4/481
Okabe, H., and Blunt, M. J. (2005). Pore space reconstruction using multiple-point statistics. J. Petroleum Sci. Eng. 46 (1-2), 121–137. doi:10.1016/j.petrol.2004.08.002
Pyrcz, M. J., and Deutsch, C. V. (2014). Geostatistical reservoir modeling. Oxford, United Kingdom: Oxford University Press.
Saad, B., Negara, A., and Syed Ali, S. (2018). “Digital rock physics combined with machine learning for rock mechanical properties characterization,” in Abu Dhabi International Petroleum Exhibition & Conference, Abu Dhabi, UAE, November 2018. doi:10.2118/193269-MS
Saif, T., Lin, Q., Butcher, A. R., Bijeljic, B., and Blunt, M. J. (2017). Multi-scale multi-dimensional microstructure imaging of oil shale pyrolysis using X-ray micro-tomography, automated ultra-high resolution SEM, maps mineralogy and fib-sem. Appl. Energy 202, 628–647. doi:10.1016/j.apenergy.2017.05.039
Sakhaee-Pour, A., and Bryant, S. L. (2015). Pore structure of shale. Fuel 143, 467–475. doi:10.1016/j.fuel.2014.11.053
Sakhaee-Pour, A., and Li, W. (2016). Fractal dimensions of shale. J. Nat. Gas Sci. Eng. 30, 578–582. doi:10.1016/j.jngse.2016.02.044
Shams, R., Masihi, M., Boozarjomehry, R. B., and Blunt, M. J. (2020). Coupled generative adversarial and auto-encoder neural networks to reconstruct three-dimensional multi-scale porous media. J. Petroleum Sci. Eng. 186, 106794. doi:10.1016/j.petrol.2019.106794
Shan, L., Bai, X., Liu, C., Feng, Y., Liu, Y., and Qi, Y. (2022). Super-resolution reconstruction of digital rock CT images based on residual attention mechanism. Adv. Geo-Energy Res. 6 (2), 157–168. doi:10.46690/ager.2022.02.07
Shojaeefard, M., Molaeimanesh, G., Nazemian, M., and Moqaddari, M. (2016). A review on microstructure reconstruction of pem fuel cells porous electrodes for pore scale simulation. Int. J. Hydrogen Energy 41 (44), 20276–20293. doi:10.1016/j.ijhydene.2016.08.179
Solarin, S. A., Gil-Alana, L. A., and Lafuente, C. (2020). An investigation of long range reliance on shale oil and shale gas production in the us market. Energy 195, 116933. doi:10.1016/j.energy.2020.116933
Soulaine, C., Pavuluri, S., Claret, F., and Tournassat, C. (2021). Porousmedia4foam: Multi-Scale open-source platform for hydro-geochemical simulations with openfoam®. Environ. Model. Softw. 145, 105199. doi:10.1016/j.envsoft.2021.105199
Tahmasebi, P., Javadpour, F., and Sahimi, M. (2015). Three-dimensional stochastic characterization of shale SEM images. Transp. Porous Media 110 (3), 521–531. doi:10.1007/s11242-015-0570-1
Tahmasebi, P., and Sahimi, M. (2012). Reconstruction of three-dimensional porous media using a single thin section. Phys. Rev. E 85 (6), 066709. doi:10.1103/PhysRevE.85.066709
Tang, X., Jiang, Z., Jiang, S., and Li, Z. (2016). Heterogeneous nanoporosity of the silurian longmaxi formation shale gas reservoir in the sichuan basin using the qemscan, fib-sem, and nano-ct methods. Mar. Petroleum Geol. 78, 99–109. doi:10.1016/j.marpetgeo.2016.09.010
Tian, Z., Xiao, L. Z., Liao, G. Z., Dong, H., Tian, S. C., and Song, X. Z. (2019). Study on digital rock reconstruction method based on sedimentological process. Chin. J. Geophys. 62 (1), 248–259. doi:10.6038/cjg2019L0457
Wang, Y. D., Blunt, M. J., Armstrong, R. T., and Mostaghimi, P. (2021). Deep learning in pore scale imaging and modeling. Earth-Science Rev. 215, 103555. doi:10.1016/j.earscirev.2021.103555
Wu, K., Van Dijke, M. I., Couples, G. D., Jiang, Z., Ma, J., Sorbie, K. S., et al. (2006). 3D stochastic modelling of heterogeneous porous media–applications to reservoir rocks. Transp. Porous Media 65 (3), 443–467. doi:10.1007/s11242-006-0006-z
Wu, Y., Lin, C., Ren, L., Yan, W., An, S., Chen, B., et al. (2018). Reconstruction of 3D porous media using multiple-point statistics based on a 3D training image. J. Nat. Gas Sci. Eng. 51, 129–140. doi:10.1016/j.jngse.2017.12.032
Xia, Y., Cai, J., Perfect, E., Wei, W., Zhang, Q., and Meng, Q. (2019). Fractal dimension, lacunarity and succolarity analyses on CT images of reservoir rocks for permeability prediction. J. Hydrology 579, 124198. doi:10.1016/j.jhydrol.2019.124198
Yan, W., Sun, J., Zhang, J., Yuan, W., Zhang, L., Cui, L., et al. (2018). Studies of electrical properties of low-resistivity sandstones based on digital rock technology. J. Geophys. Eng. 15 (1), 153–163. doi:10.1088/1742-2140/aa8715
Yang, F., Ning, Z. F., Hu, C. P., Wang, B., Peng, K., and Liu, H. Q. (2013). Characterization of microscopic pore structures in shale reservoirs. Acta Pet. Sin. 34 (2), 301–311. doi:10.7623/syxb201302012
Yang, Y., Cai, S., Yao, J., Zhong, J., Zhang, K., Song, W., et al. (2021). Pore-scale simulation of remaining oil distribution in 3D porous media affected by wettability and capillarity based on volume of fluid method. Int. J. Multiph. Flow 143, 103746. doi:10.1016/j.ijmultiphaseflow.2021.103746
Yang, Y., Yao, J., Wang, C., Gao, Y., Zhang, Q., An, S., et al. (2015). New pore space characterization method of shale matrix formation by considering organic and inorganic pores. J. Nat. Gas Sci. Eng. 27, 496–503. doi:10.1016/j.jngse.2015.08.017
Zha, W., Li, X., Xing, Y., He, L., and Li, D. (2020). Reconstruction of shale image based on Wasserstein Generative Adversarial Networks with gradient penalty. Adv. Geo-Energy Res. 4 (1), 107–114. doi:10.26804/ager.2020.01.10
Zhang, J., Tang, Y., He, D., Sun, P., and Zou, X. (2020). Full-scale nanopore system and fractal characteristics of clay-rich lacustrine shale combining Fe-sem, nano-ct, gas adsorption and mercury intrusion porosimetry. Appl. Clay Sci. 196, 105758. doi:10.1016/j.clay.2020.105758
Zhang, T., Du, Y., Huang, T., and Li, X. (2015). Gpu-accelerated 3D reconstruction of porous media using multiple-point statistics. Comput. Geosci. 19 (1), 79–98. doi:10.1007/s10596-014-9452-910.1016/j.cageo.2012.11.022
Zhang, T., Du, Y., Huang, T., Yang, J., Lu, F., and Li, X. (2016). Reconstruction of porous media using isomap-based mps. Stoch. Environ. Res. Risk Assess. 30 (1), 395–412. doi:10.1007/s00477-015-1142-1
Zhang, T., Switzer, P., and Journel, A. (2006). Filter-based classification of training image patterns for spatial simulation. Math. Geol. 38 (1), 63–80. doi:10.1007/s11004-005-9004-x
Zhou, S., Yan, G., Xue, H., Guo, W., and Li, X. (2016). 2D and 3D nanopore characterization of gas shale in longmaxi formation based on fib-sem. Mar. Petroleum Geol. 73, 174–180. doi:10.1016/j.marpetgeo.2016.02.033
Zhu, L., Zhang, C., Zhang, C., Zhou, X., Zhang, Z., Nie, X., et al. (2019). Challenges and prospects of digital core-reconstruction research. Geofluids 2019, 1–29. doi:10.1155/2019/7814180
Keywords: multi-point statistics, multi-phase, shale, digital rock, reconstruction
Citation: Liu L, Yao J, Imani G, Sun H, Zhang L, Yang Y and Zhang K (2023) Reconstruction of 3D multi-mineral shale digital rock from a 2D image based on multi-point statistics. Front. Earth Sci. 10:1104401. doi: 10.3389/feart.2022.1104401
Received: 21 November 2022; Accepted: 09 December 2022;
Published: 04 January 2023.
Edited by:
Xinmin Ge, China University of Petroleum, ChinaReviewed by:
Weichao Yan, Ocean University of China, ChinaCopyright © 2023 Liu, Yao, Imani, Sun, Zhang, Yang and Zhang. This is an open-access article distributed under the terms of the Creative Commons Attribution License (CC BY). The use, distribution or reproduction in other forums is permitted, provided the original author(s) and the copyright owner(s) are credited and that the original publication in this journal is cited, in accordance with accepted academic practice. No use, distribution or reproduction is permitted which does not comply with these terms.
*Correspondence: Jun Yao, cmNvZ2ZyX3VwY0AxMjYuY29t; Hai Sun, c3VuaGFpdXBjQHNpbmEuY29t
Disclaimer: All claims expressed in this article are solely those of the authors and do not necessarily represent those of their affiliated organizations, or those of the publisher, the editors and the reviewers. Any product that may be evaluated in this article or claim that may be made by its manufacturer is not guaranteed or endorsed by the publisher.
Research integrity at Frontiers
Learn more about the work of our research integrity team to safeguard the quality of each article we publish.