 Juehao Huang1,2
 Jun Hu
 Jian Chen
- 1State Key Laboratory of Geomechanics and Geotechnical Engineering, Institute of Rock and Soil Mechanics, Chinese Academy of Sciences, Wuhan, China
- 2School of Engineering Science, University of Chinese Academy of Sciences, Beijing, China
- 3School of Civil Engineering, Chang’an University, Xi’an, China
- 4China Railway Eryuan Engineering Group Co Ltd., Chengdu, China
The excess pore water pressure is main factor affecting the dynamic response of saturated soft clay under traffic loads. Recognize that, cyclic triaxial tests with and without cyclic confining pressure were carried out to study the development of excess pore water pressure of saturated soft clay. The impacts of factors, such as cyclic stress ratio (CSR), loading frequency, and cyclic confining pressure, were analyzed. Excess pore water pressure increases with increasing cyclic stress ratios, while decreases with increasing loading frequencies. Nevertheless, with increasing cyclic confining pressures, the maximum excess pore water pressure increases, while the minimum excess pore water pressure remains unchanged. Besides that, the greater CSR and cyclic confining pressure deliver an increment of both maximum and minimum excess pore water pressure rate. However, the excess pore water pressure rate - time curves coincide under different loading frequencies. Meanwhile, both the normalized maximum and minimum excess pore water pressure rates are linearly proportional with time under different test conditions in logarithmic coordinates. Based on that, both maximum and minimum excess pore water pressure prediction models, relating to the above factors, are proposed, and the predicted results accord well with the measured data.
1 Introduction
Many traffic infrastructures have been constructed, especially on soft clay subgrade (Huang et al., 2020; Huang et al., 2020a; Huang et al., 2020b). The traffic loading induced excess pore water pressure not only leads to additional deformation but also results in the degradation of soil strength (Wichtmann et al., 2013; Jiang et al., 2018). Therefore, it is necessary to study the development of excess pore water pressure of soft clay to properly design and plan transportation facilities on soft clay subsoils.
Some researchers have conducted experimental investigations on the development of excess pore water pressure (Hyde and Ward 1985; Hyodo et al., 1992; Hyde et al., 1993; Wang et al., 2013; Ren et al., 2018; Du et al., 2022; Fu et al., 2022), and many empirical formulas to predict excess pore water pressure have been proposed (Nie et al., 2007; Paul et al., 2014; Cary and Zapata, 2016). For example, Ohara and Matsuda (1988) proposed a hyperbolic model to predict the excess pore water pressure, relating to the number of cycles. Reviewing the previous researches, cyclic triaxial tests with constant confining pressure (CCP tests) have been usually employed, in which only cyclic deviator stress was used to simulate the traffic loading. However, it has been widely recognized that the CCP tests are not appropriate for reflecting the real conditions induced by the traffic.
The real traffic-induced stress field acting on the soil elements is composed of a simultaneous cyclic variation of deviator stress, confining pressure, and shear stress (Lekarp et al., 2000). The traffic loading is often simulated with the simultaneous application of the cyclic confining pressure and cyclic deviator stress in laboratory tests, i.e., cyclic triaxial tests with variable confining pressure (VCP tests) (Wichtmann et al., 2007; Rondon et al., 2009; Cai et al., 2013; Gu et al., 2016, 2017). For example, Rondon et al. (2009) found that the deformation of unbound granular materials (UGMs) under CCP tests was underestimated, compared with that under VCP tests. Additionally, both the development of excess pore water pressures and accumulated axial strains of soft clay were influenced significantly by cyclic confining pressure (Cai et al., 2013). Gu et al. (2016) found that the development of permanent volumetric strain and axial strain speeded up with increasing cyclic confining pressure for overconsolidated and normally-consolidated specimens. All these studies indicated that the effect of cyclic confining pressure cannot be ignored.
Besides, the response frequency of soft clay under train loads changes continuously with the train passing (Tang et al., 2008; Gu et al., 2012; Guo et al., 2013; Yang et al., 2018; Zhou et al., 2022). Some experimental investigations, such as those by Matsui et al. (1992), and Guo et al. (2016), have studied the effect of loading frequency on mechanical behaviors of soils under cyclic loading. However, there are conflicting observations regarding this problem. For example, Hyde et al. (1993) conducted CCP tests on Ariake clay and found that the development of excess pore water pressure was independent of frequency. Guo et al. (2016) found that the lower frequency delivered the larger vertical strain. However, the effect of cyclic confining pressure was not taken into consideration in their study. Therefore, the impacts of loading frequency and cyclic confining pressure on the mechanical behaviors of soils under traffic loads need to study in-depth.
This study consists of three parts: firstly, both CCP and VCP tests were carried out under undrained conditions, and the development of excess pore water pressure was evaluated and compared under different cyclic confining pressures, CSRs, and loading frequencies; Then, maximum and minimum excess pore water pressure prediction models were proposed and the effects of cyclic confining pressures, CSRs, and loading frequencies on fitting parameters were analyzed in detail. Finally, the verifications of models were made based on other test data.
2 Experimental program
2.1 Test materials
The original clays were sampled about a depth of 28.0–30.0 m beneath the ground surface from Jiangshan Station of Ningbo subway line No. 3 in Ningbo city, China. To eliminate the effect of soil structure and obtain specimens with good homogeneity, the remolded samples were used in this study. Table 1 shows the physico-mechanical indices of the tested clay following MWR (2019, GB/T 50123-2019), indicating that the tested soil was classified as CH (i.e., high plasticity) according to the Unified Soil Classification System (USCS) soil classification method of ASTM (2017).
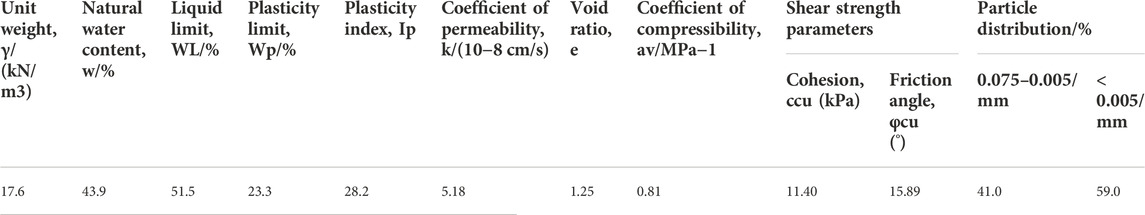
TABLE 1. Physico-mechanical indices of the remolded Ningbo clay.
2.2 Test procedures
The advanced cyclic triaxle device (i.e., DYNTTS) was employed. The axial deviator stress and confining pressure can vary simultaneously with multiple loading waveforms, such as triangular, sinusoidal, square, and customized wave shapes.
According to MWR (2019, GB/T 50123-2019, 2019), cylindrical specimens (i.e., diameter: 38 mm and height: 76 mm) were prepared and mounted in the triaxle cell. Following this, all of the remolded specimens were saturated at a back pressure of 300 kPa with an effective stress of 20 kPa, until all samples were saturated completely (namely, Skempton’s B value more than 0.95). After that, the specimens were isotropically consolidated. When the drainage volume was less than 100 mm3/h, the consolidation was considered completed (Sun et al., 2015). Finally, considering the low permeability of the tested specimens, cyclic loading was applied under undrained conditions.
To simulate traffic loading as reality as possible, cyclic deviator stress and cyclic confining pressures were applied with a phase difference of zero in semi-sine wave (Cai et al., 2013). For the sake of analysis, the cyclic stress ratio (CSR) is employed (Sakai et al., 2003). CSR is defined as
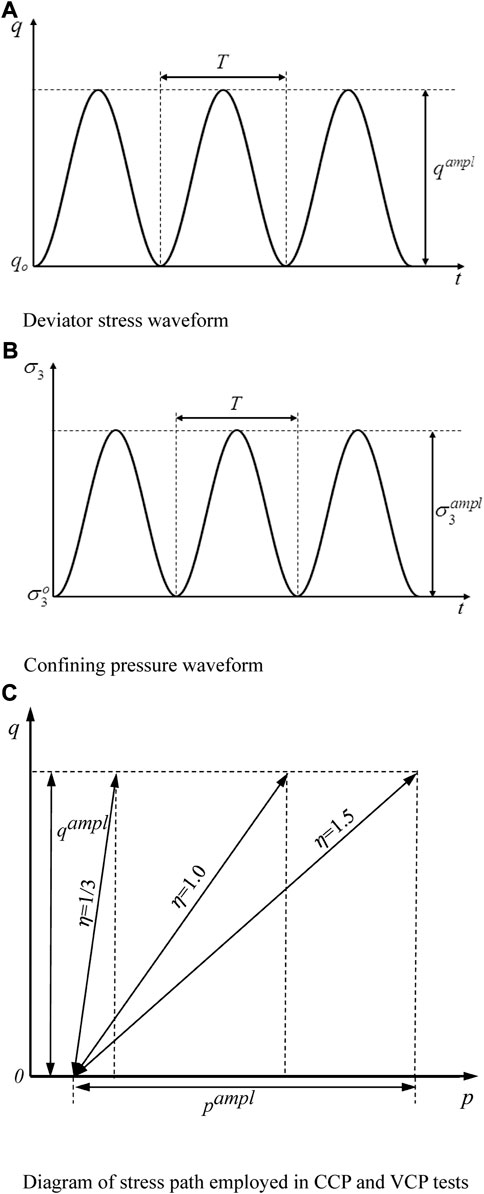
FIGURE 1. (A) Deviator stress waveform; (B) Confining pressure waveform; (C) Diagram of stress path employed in CCP and VCP tests.
Herein, five CSR values of 0.10, 0.15, 0.20, 0.25, and 0.30 are employed. At a certain CSR, the selection of η values depends on the operation situation of the advance advice in the laboratory. The greater η value leads to the more badly wear of sealing rings of the confining pressure controller, directly causing the instability of the loading waveform. Therefore, for a specific CSR, η = 1/3, 1.0, and 1.5 were employed, in which η = 1/3 represented CCP tests and η = 1.0 and 1.5 represented VCP tests. Additionally, it should be noted that the maximum frequency of the device used in the test is 5 Hz, and the frequency of qampl and
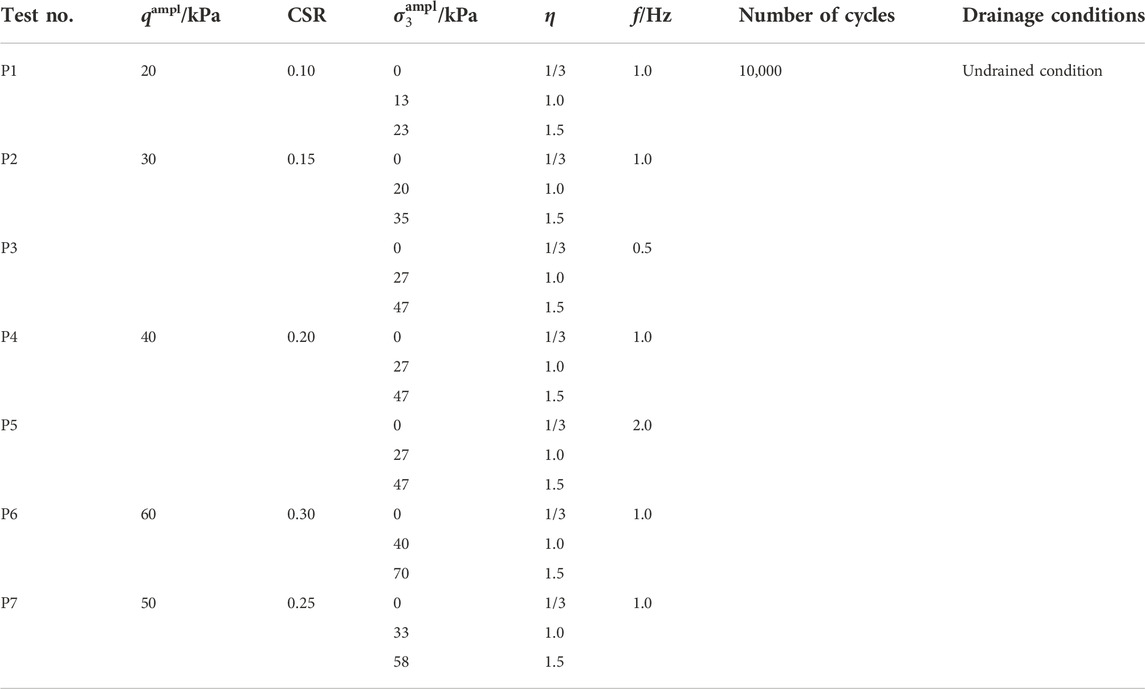
TABLE 2. Summary of cyclic triaxial tests.
3 Test results
The development of excess pore water pressure of soft clay in CCP and VCP tests are investigated in this study. Further discussions on the test results considering the several factors are detailed as follows, respectively.
3.1 Influence of cyclic confining pressure
Figure 2 presents excess pore water pressure (i.e., u) versus the number of cycles (i.e., N) with different η values. The CSR value is 0.20 and the frequency is 1.0 Hz. The maximum and minimum values of excess pore water pressure per cycle are denoted as umax and umin, respectively. As a whole, both umax and umin generally accumulate at the beginning and then tend to be stable with a gradually decreasing accumulation rate. Generally, at a certain number of cycles, umax is relatively larger under VCP tests comparing with that obtained in CCP tests: the greater amplitude of cyclic confining pressure, the greater maximum excess pore water pressure. For example, when f = 1.0 Hz and CSR = 0.20, umax at N = 10,000 are 59.26 and 75.98 kPa under η = 1.0, and 1.5, respectively, while it is 35.34 kPa under CCP test (η = 0.33). However, umin remains unchanged under CCP and VCP tests. When f = 1.0 Hz and CSR = 0.20, umin are, 29.95, 30.08, and 27.70 kPa at 10,000 cycles under η = 0.33, 1.00, and 1.50, respectively.
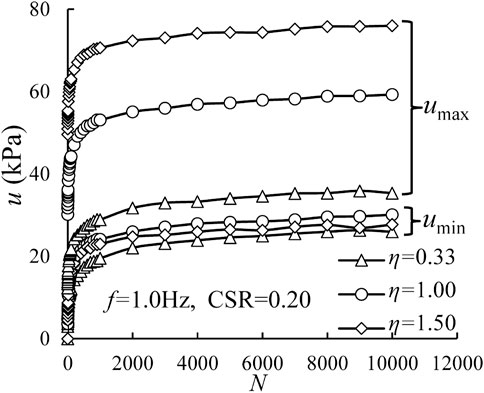
FIGURE 2. Variations of excess pore water pressure with number of cycles under different η for CSR = 0.20 and f = 1.0 Hz.
Recalling Figure 2, the increasing rates of excess pore water pressure are different under different η values. Therefore, the effect of cyclic confining pressure on excess pore water pressure is further analyzed from the perspective of excess pore water pressure rate (i.e.,
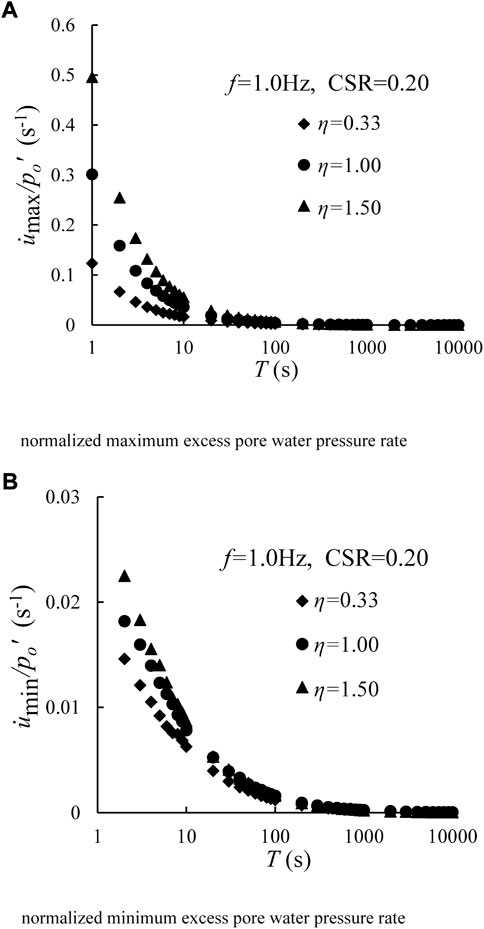
FIGURE 3. Developments of the normalized excess pore water pressure rate versus loading time under different η for CSR = 0.20 and f = 1.0 Hz. (A) Normalized maximum excess pore water pressure rate and (B) normalized minimum excess pore water pressure rate.
3.2 Influence of cyclic stress ratio
Figure 4 presents excess pore water pressure versus the number of cycles with different CSRs under f = 1.0 Hz and η = 1.00. Herein, with increasing of CSR, both umax and umin increase under the same number of cycles. For example, in Figure 4, at the end of 10,000 cycles, the umax are 21.11, 39.10, 59.26, and 85.32 kPa, and umin are 13.41, 20.31, 30.08, and 45.76 kPa at CSR = 0.10, 0.15, 0.20, and 0.30, respectively.
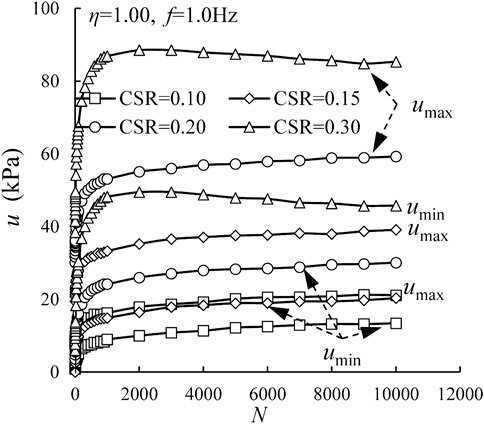
FIGURE 4. Variations of excess pore water pressure with number of cycles under different CSRs for f = 1.0 Hz and η = 1.00.
To quantify the influence of CSR on excess pore water pressure, both umax and umin at 10,000 cycles (denoted as
where e, f, m, and n are fitting parameters. Table 3 summarizes the fitting parameters by using regression analysis and the respective curves are shown as the dotted lines in Figure 5. It is observed that the Eqs 1, 2 have a good prediction capability to
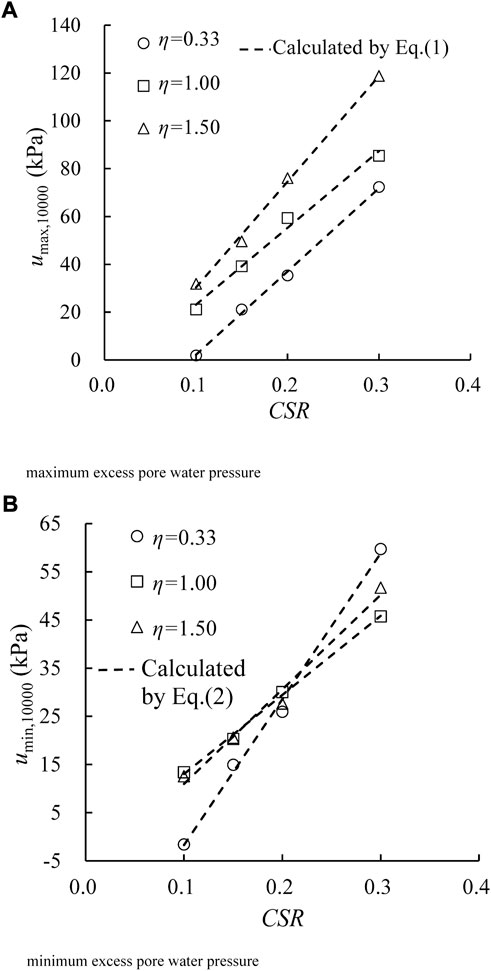
FIGURE 5. Relationships between excess pore water pressures at N = 10,000 and CSRs under different η values. (A) Maximum excess pore water pressure and (B) minimum excess pore water pressure.
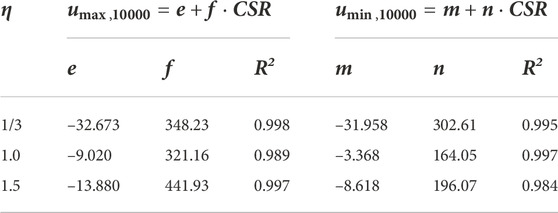
TABLE 3. Fitting parameters under different conditions.
Again, taking the test results of η = 1.0 and f = 1 Hz as an example, the relationships between
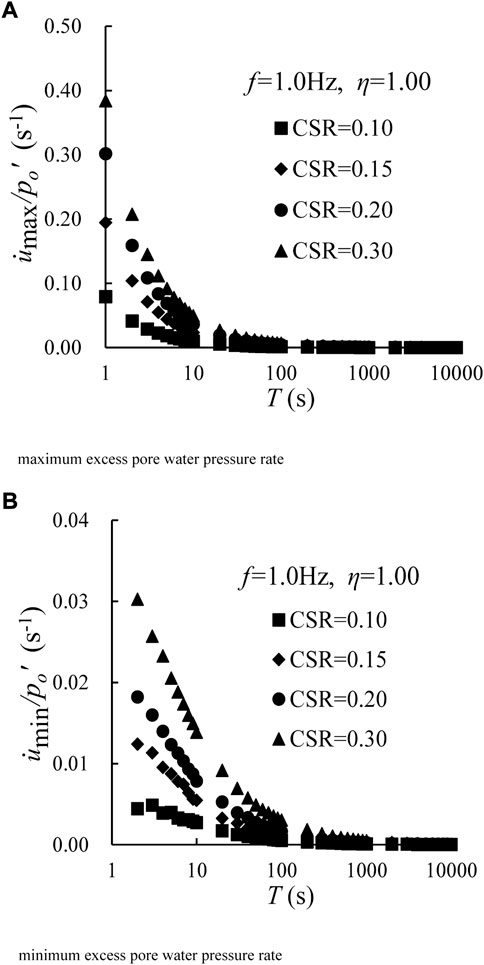
FIGURE 6. Developments of the normalized excess pore water pressure rate versus loading time under different CSRs for η = 1.00 and f = 1.0 Hz. (A) Maximum excess pore water pressure rate and (B) minimum excess pore water pressure rate.
Herein, both
3.3 Influence of loading frequency
Figure 7 presents the relationship between excess pore water pressure and the number of cycles for different loading frequencies under CSR = 0.20 and η = 1.5. Herein, both umax and umin generally accumulate rapidly at the beginning and then achieve a stable state regardless of the various frequencies. Additionally, as seen in Figure 7, at the end of tests (i.e., N=10,000), when f = 0.5, 1.0, and 2.0 Hz, the umax are 79.36, 75.98, and 69.86 kPa, while the umin are 32.20, 27.70, and 28.91 kPa, respectively, indicating that the lower loading frequency can deliver the greater excess pore water pressure. The phenomenon is related to the permeability of soft clay. When a low frequency is applied to the specimen, the excess pore water pressure induced in every single cycle has much more time to develop, while the accumulation time of excess pore water pressure is much smaller under greater loading frequency.
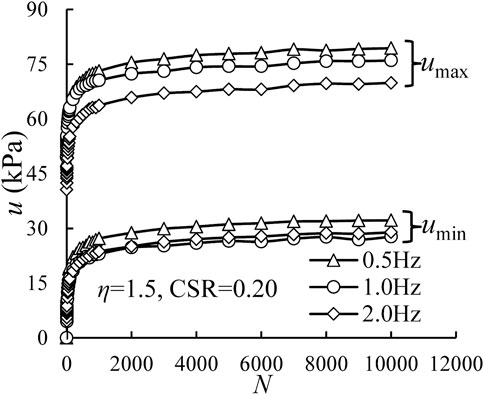
FIGURE 7. Variations of excess pore water pressure with number of cycles under different f values for CSR = 0.20 and η = 1.50.
Again, the relationships between
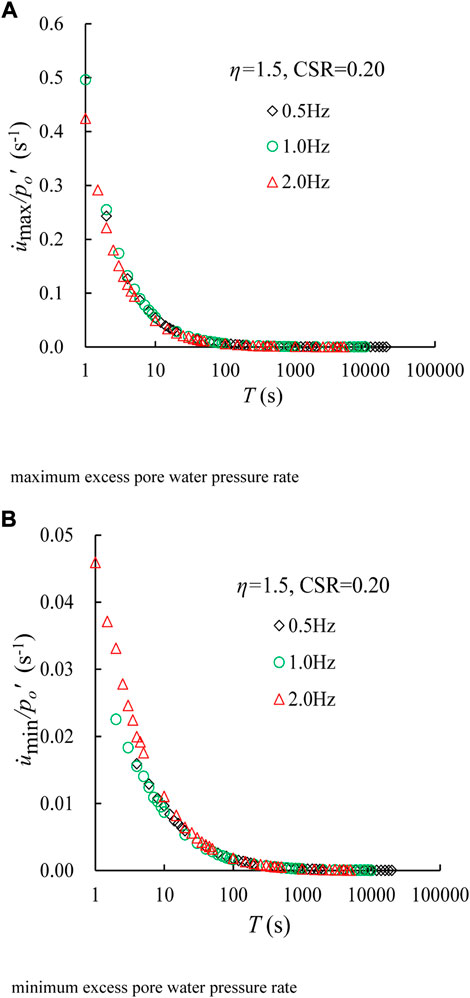
FIGURE 8. Developments of the normalized excess pore water pressure rate versus loading time under different f values for η = 1.50 and CSR = 0.20. (A) Maximum excess pore water pressure rate and (B) minimum excess pore water pressure rate.
3.4 Modified models for excess pore water pressure considering several factors
Based on many previous researches, some empirical formulas to predict excess pore water pressure were obtained. The previous formulas were established based on the test results of the relationships between several factors and excess pore water pressure, while the researches on excess pore water pressure rate under cyclic loading were few. Besides that, the effect of cyclic confining pressure was hardly incorporated into the previous formulas. Following the research by Hyde and Ward (1985), the relationship between
where
However, according to the above test results, several factors, such as CSR, cyclic confining pressure, and loading frequency have different influences on the umax and umin. Thus, based on the Eq. 3, the predicted formulas for umax and umin can be obtained as follows:
where
However, Eqs 4, 5 cannot reflect explicitly the effects of cyclic confining pressure and CSR on excess pore water pressure rate. Therefore, it is necessary to modify the parameters of the Eqs 4, 5 (i.e., A, a,
3.4.1 Influence of frequency on fitting parameters
Figure 9 shows
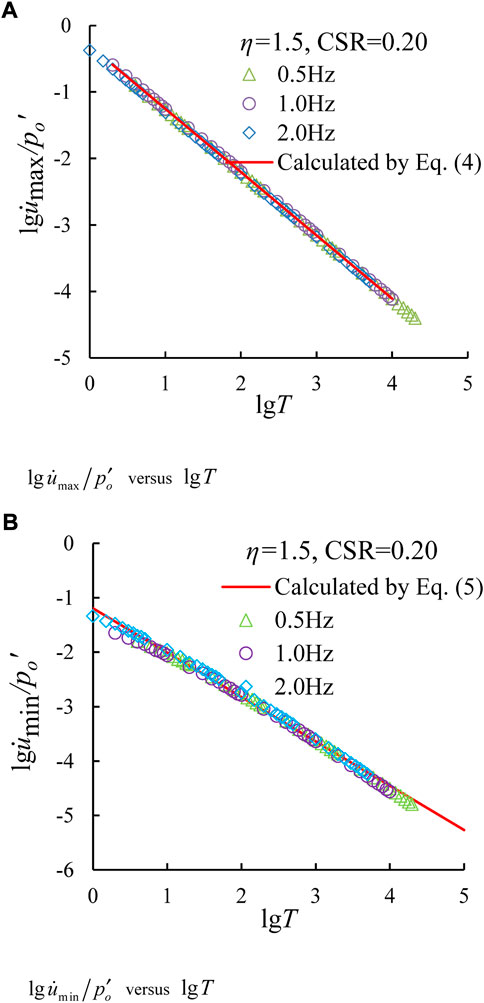
FIGURE 9. Relationships between
3.4.2 Influences of cyclic stress ratio and cyclic confining pressure on fitting parameters
Figure 10 plots the relationships between
where α and β are fitting parameters. Table 5 summarizes the values of parameters α and β under different CSR values. Likely, the standard deviation of α is 0.066, implying that the parameter α can be regarded as a constant with a mean value, i.e., α=0.498. Additionally, Figure 11B presents the variations of β with CSRs, which can be proposed with a linear function, as follows:
where λ and κ are fitting parameters. The parameters in Eq. 7 are obtained as λ = 3.89, and κ = −1.91, respectively.
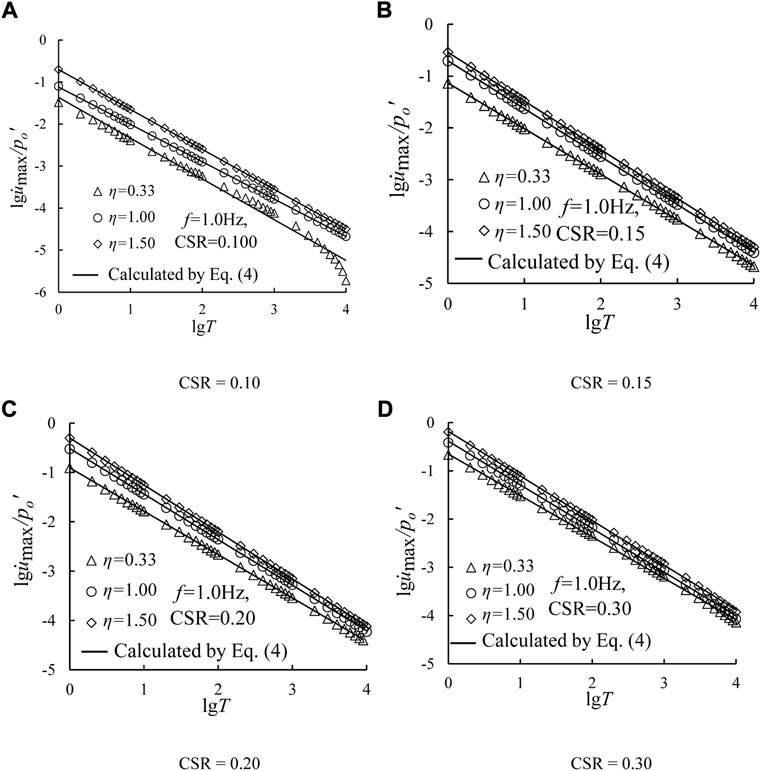
FIGURE 10. Relationships between
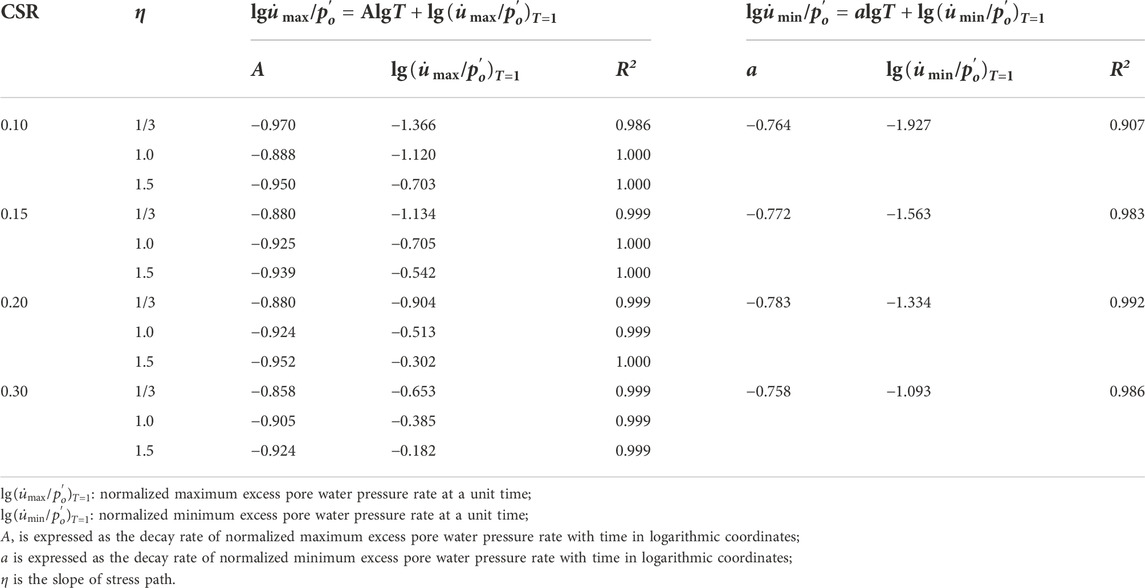
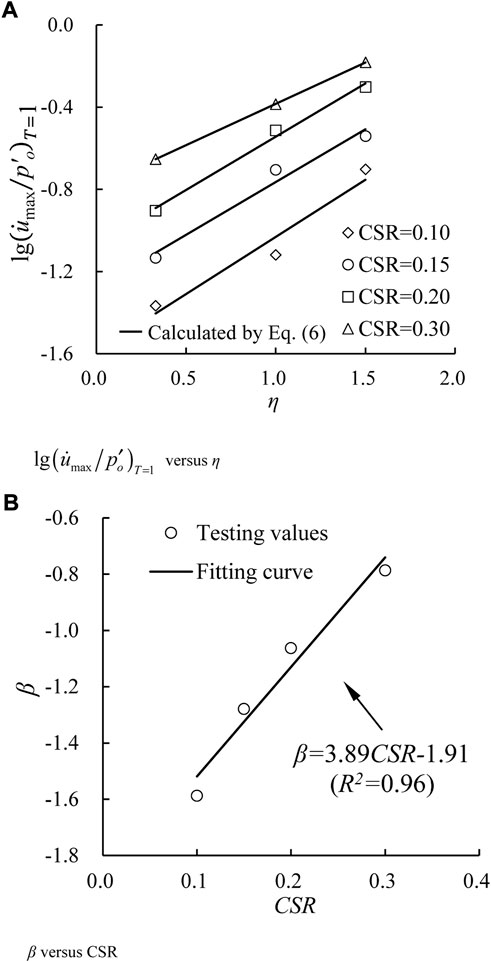
FIGURE 11. Determination of fitting parameters. (A)
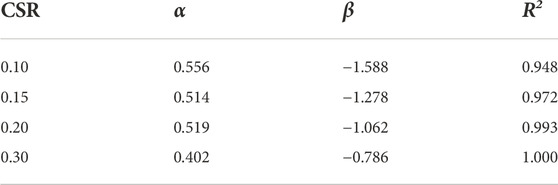
TABLE 5. Fitting parameters of Eq. 6.
By incorporating Eqs 6, 7 into Eq. 4, the expression for
Figure 12 plots the relationships between
where b and d are fitting parameters. Using the curve-fitting method, the parameter c and d are obtained as b = 4.00, and d = −2.23, respectively.
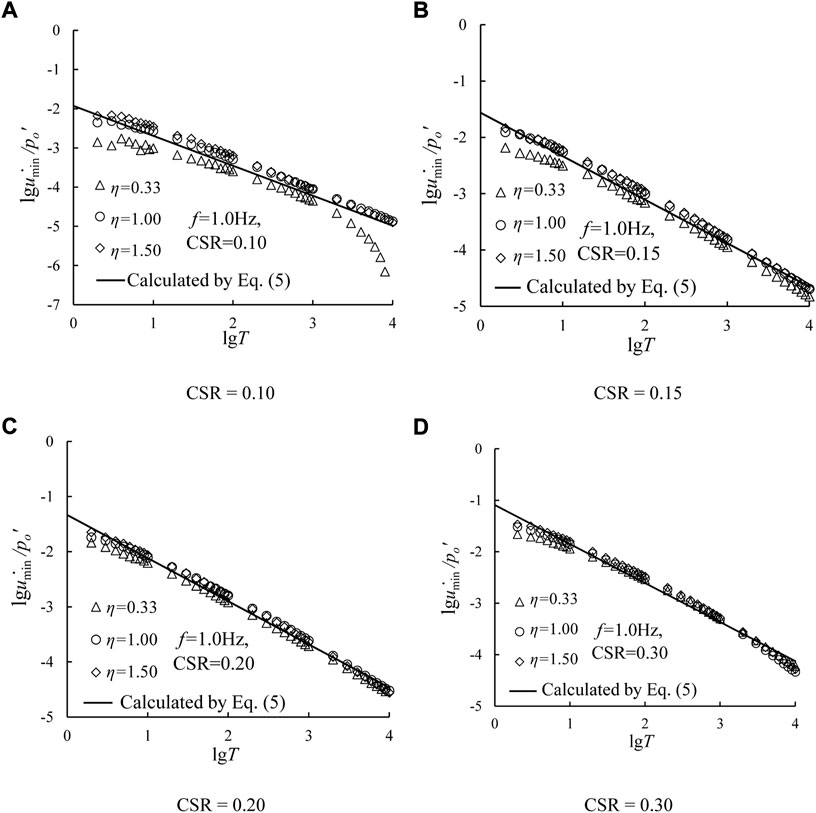
FIGURE 12. Relationships between
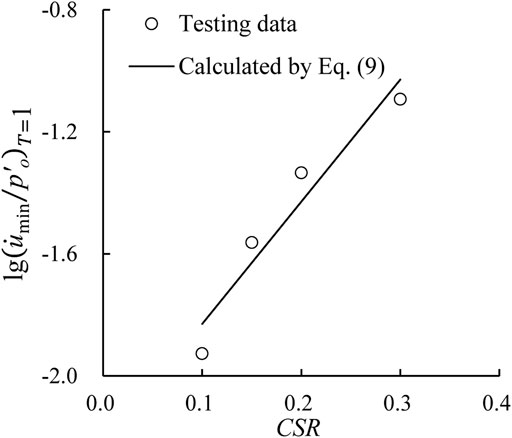
FIGURE 13. Relationship between
Then, setting the Eq. 9 into the Eq. 5 delivers:
3.4.3 Validation of modified models
To validate the accuracy of the proposed excess pore water pressure models (i.e., Eqs 4, 5, the test data for the test conditions, i.e., CSR = 0.25, η = 0.33, 1.00, and 1.50 are employed. Figure 14 plots the variations in normalized excess pore water pressure rate with loading time. Herein, Figures 14A,B depict the development characteristics of maximum and minimum excess pore water pressure rate, respectively. Herein, the predicted values are also displayed as black solid lines by using Eqs 4, 5. As seen, the proposed empirical formula can well reproduce the test data, indicating that the proposed models have a better performance to depict the development of both maximum and minimum excess pore water pressure of soft clay under cyclic loading with cyclic confining pressure.
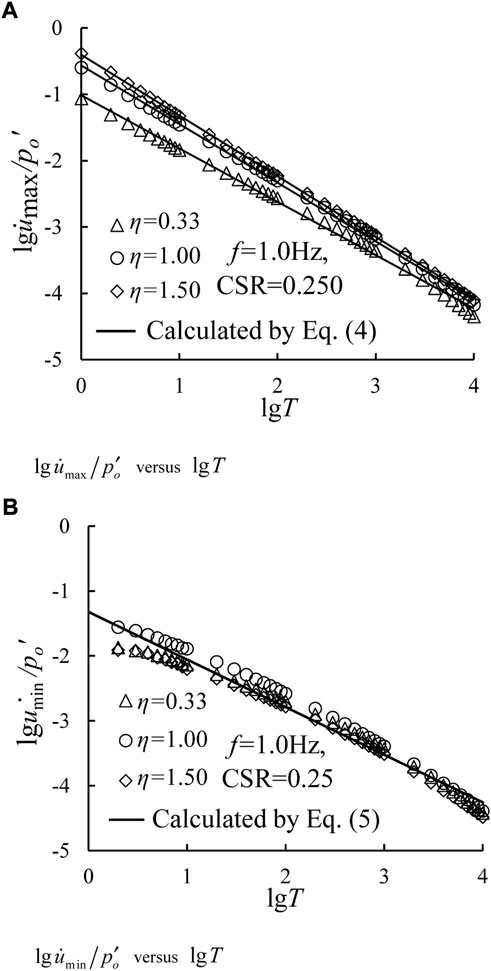
FIGURE 14. Relationships between
On the other hand, test results from Gu (2012) were taken as an example to validate the applicability of Eqs 4, 5. Among that, the employed CSRs were 0.157, 0.208, and 0.261. For a specific CSR, η values were 1/3, 1.0, and 1.5, respectively. The loading frequency was 0.1 Hz. Taking Eqs 4, 5 to fit the test data, the fitting parameters of Eqs 4, 5 were obtained in Table 6. Figure 15 plots the relationships between normalized excess pore water pressure rate with loading time under CSR = 0.261 and f = 0.1 Hz, in which Figures 15A,B depict the development characteristics of maximum and minimum excess pore water pressure rate, respectively. Herein, the predicted results agree well with the test data under different test conditions for high correlation coefficient. From Table 6, the standard deviations of parameters A and a are small, implying that the effects of CSR and cyclic confining pressure can be ignored. The mean values of parameter A and a can be employed in Eqs 4, 5. Additionally, the variations in
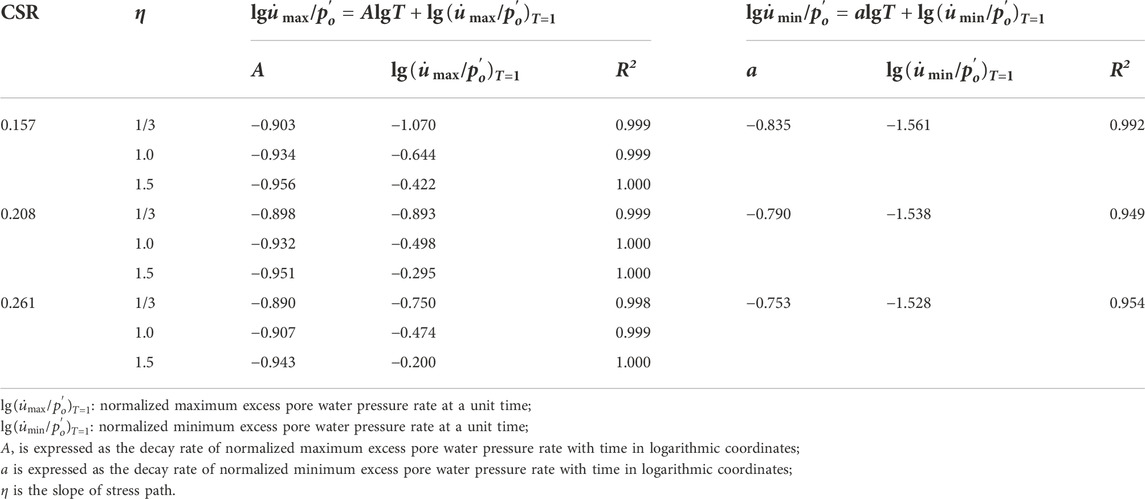
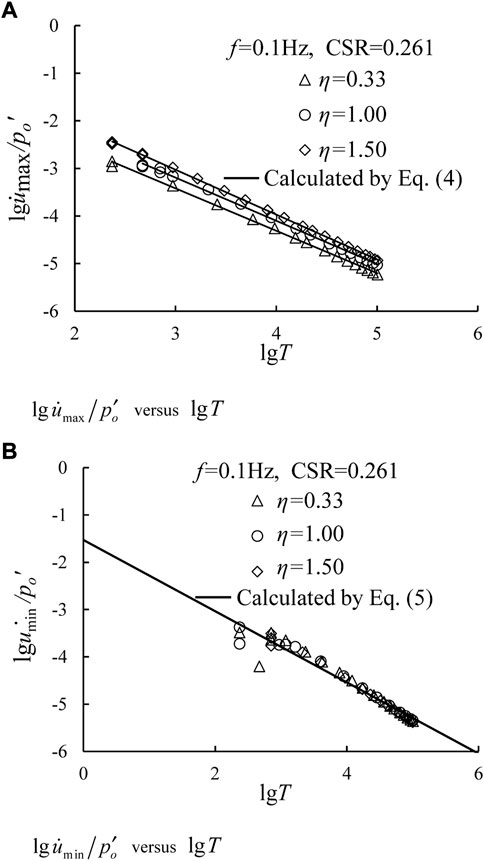
FIGURE 15. Relationships between
4 Conclusion
CCP and VCP tests were conducted on saturated soft clay to investigate the development of excess pore water pressure. The effects of CSR, cyclic confining pressure, and loading frequency were studied. The main conclusions can be drawn as follows:
(1) These factors, i.e., cyclic confining pressure, CSR, and loading frequency have different effects on the development of excess pore water pressure. With increasing η, umax increases, while umin remains unchanged. Additionally, the larger CSR can deliver greater both umax and umin. Furthermore, the increase of the umax and umin with decreasing loading frequency is more significant.
(2) Both normalized maximum and minimum excess pore water pressure rates increase with increasing CSR and η at the beginning of tests, and coincide after a certain time. However, the curves of the normalized excess pore water pressure rate - time coincide under different loading frequencies.
(3) The relationships between the normalized excess pore water pressure rate and the loading time are linear under CCP and VCP tests in logarithmic coordinates. Both maximum and minimum excess pore water pressure prediction models are proposed. Nevertheless, the effects of the above factors on fitting parameters A and a can be ignored.
Limited the performance of the test equipment (namely, the applied maximum frequency is 5.0 Hz), only the effect of lower frequency (less than 2.0 Hz) on the development of excess pore water pressure is discussed. Therefore, the applicability of the proposed models needs further study under higher loading frequency conditions and other soils.
Data availability statement
The original contributions presented in the study are included in the article/Supplementary Material, further inquiries can be directed to the corresponding author.
Author contributions
JeH and JnH were involved in the final development of the project and manuscript preparation. HW and JC wrote the manuscript draft. JC and SL analyzed the data. All authors: corrections, modifications, and final acceptation.
Funding
The work reported in this paper is financially supported by National Natural Science Foundation of China (No. 51909259, 52079135).
Conflict of interest
Author HW was employed by the China Railway Eryuan Engineering Group Co., Ltd., China.
The remaining authors declare that the research was conducted in the absence of any commercial or financial relationships that could be construed as a potential conflict of interest.
Publisher’s note
All claims expressed in this article are solely those of the authors and do not necessarily represent those of their affiliated organizations, or those of the publisher, the editors and the reviewers. Any product that may be evaluated in this article, or claim that may be made by its manufacturer, is not guaranteed or endorsed by the publisher.
References
ASTM (2017). Standard practice for classification of soils for engineering purposes (Unified Soil Classification System). West Conshohocken, PA: ASTM.
Cai, Y. Q., Gu, C., Wang, J., Juang, C. H., Xu, C. J., and Hu, X. Q. (2013). One-way cyclic triaxial behavior of saturated clay: Comparison between constant and variable confining pressure. J. Geotech. Geoenviron. Eng. 139 (5), 797–809. doi:10.1061/(asce)gt.1943-5606.0000760
Cary, C. E., and Zapata, C. E. (2016). Pore water pressure response of soil subjected to dynamic loading under saturated and unsaturated conditions. Int. J. Geomech. 16 (6), D4016004. doi:10.1061/(asce)gm.1943-5622.0000642
Du, W. J., Sheng, Q., Fu, X. D., Chen, J., and Zhou, Y. Q. (2022). A TPDP-MPM-based approach to understanding the evolution mechanism of landslide-induced disaster chain. J. Rock Mech. Geotechnical Eng. 14 (4), 1200–1209. doi:10.1016/j.jrmge.2022.03.004
Fu, X. D., Ding, H. F., Sheng, Q., Zhang, Z. P., Yin, D. W., and Chen, F. (2022). Fractal analysis of particle distribution and scale effect in a soil-rock mixture. Fractal Fract. 6 (2), 120. doi:10.3390/fractalfract6020120
GB/T 50123-2019 (2019). Standard for geotechnical testing method (GB/T 50123-2019). Beijing: China Planning Press.
Gu, C., Gu, Z. Q., Cai, Y. Q., Wang, J., and Ling, D. S. (2017). Dynamic modulus characteristics of saturated clays under variable confining pressure. Can. Geotech. J. 54 (5), 729–735. doi:10.1139/cgj-2016-0441
Gu, C. (2012). Study on the dynamic behavior of saturated clays based on the stress paths with variable confining pressure. China: College of Civil Engineering and Architecture. Ph.D. thesis.
Gu, C., Wang, J., Cai, Y. Q., Sun, L., Wang, P., and Dong, Q. Y. (2016). Deformation characteristics of overconsolidated clay sheared under constant and variable confining pressure. Soils Found. 56 (3), 427–439. doi:10.1016/j.sandf.2016.04.009
Gu, C., Wang, J., Cai, Y. Q., Yang, Z. X., and Gao, Y. F. (2012). Undrained cyclic triaxial behavior of saturated clays under variable confining pressure. Soil Dyn. Earthq. Eng. 40, 118–128. doi:10.1016/j.soildyn.2012.03.011
Guo, L., Chen, J. M., Wang, J., Cai, Y. Q., and Deng, P. (2016). Influences of stress magnitude and loading frequency on cyclic behavior of K0-consolidated marine clay involving principal stress rotation. Soil Dyn. Earthq. Eng. 84, 94–107. doi:10.1016/j.soildyn.2016.01.024
Guo, L., Wang, J., Cai, Y. Q., Liu, H. L., Gao, Y. F., and Sun, H. L. (2013). Undrained deformation behavior of saturated soft clay under long-term cyclic loading. Soil Dyn. Earthq. Eng. 50, 28–37. doi:10.1016/j.soildyn.2013.01.029
Huang, F. M., Cao, Z. S., Guo, J. F., Jiang, S. H., and Guo, Z. Z. (2020a). Comparisons of heuristic, general statistical and machine learning models for landslide susceptibility prediction and mapping. Catena 191, 104580. doi:10.1016/j.catena.2020.104580
Huang, F. M., Zhang, J., Zhou, C. B., Wang, Y. H., Huang, J. S., and Zhu, L. (2020b). A deep learning algorithm using a fully connected sparse autoencoder neural network for landslide susceptibility prediction. Landslides 17 (1), 217–229. doi:10.1007/s10346-019-01274-9
Huang, J. H., Chen, J., Lu, Y., Yi, S., Cheng, H. Z., and Cui, L. (2020). Deformation behaviors and dynamic backbone curve model of saturated soft clay under bidirectional cyclic loading. Int. J. Geomech. 20 (4), 04020016. doi:10.1061/(asce)gm.1943-5622.0001628
Hyde, A. F. L., and Ward, S. J. (1985). A pore pressure and stability model for a silty clay under repeated loading. Geotechnique 35 (2), 113–125. doi:10.1680/geot.1985.35.2.113
Hyde, A. F. L., Yasuhara, K., and Hirao, K. (1993). Stability criteria for marine clay under one-way cyclic loading. J. Geotech. Engrg. 119 (11), 1771–1789. doi:10.1061/(asce)0733-9410(1993)119:11(1771)
Hyodo, M., Yasuhara, K., and Hirao, K. (1992). Prediction of clay behaviour in undrained and partially drained cyclic triaxial tests. Soils Found. 32 (4), 117–127. doi:10.3208/sandf1972.32.4_117
Jiang, S. H., Huang, J., Huang, F. M., Yang, J. H., Yao, C., and Zhou, C. B. (2018). Modelling of spatial variability of soil undrained shear strength by conditional random fields for slope reliability analysis. Appl. Math. Model. 63, 374–389. doi:10.1016/j.apm.2018.06.030
Lekarp, F., Isacsson, U., and Dawson, A. (2000). State of the art. I: Resilient response of unbound aggregates. J. Transp. Eng. 126 (1), 66–75. doi:10.1061/(asce)0733-947x(2000)126:1(66)
Matsui, T., Bahr, M. A., and Abe, N. (1992). Estimation of shear characteristics degradation and stress-strain relationship of saturated clays after cyclic loading. Soils Found. 32 (1), 161–172. doi:10.3208/sandf1972.32.161
Nie, Q., Bai, B., Hu, J., and Shang, W. (2007). The pore pressure model and undrained shear strength of soft clay under cyclic loading. Rock Soil Mech. 28, 724–729. doi:10.16285/j.rsm.2007.s1.155
Ohara, S., and Matsuda, H. (1988). Study on the settlement of saturated clay layer induced by cyclic shear. Soils Found. 28 (3), 103–113. doi:10.3208/sandf1972.28.3_103
Paul, M., Sahu, R. B., and Banerjee, G. (2014). Undrained pore pressure prediction in clayey soil under cyclic loading. Int. J. Geomech. 15 (5), 04014082. doi:10.1061/(asce)gm.1943-5622.0000431
Ren, X. W., Xu, Q., Xu, B. C., Teng, J. D., and Lv, S. H. (2018). Undrained pore pressure behavior of soft marine clay under long-term low cyclic loads. Ocean. Eng. 150, 60–68. doi:10.1016/j.oceaneng.2017.12.045
Rondon, H. A., Wichtmann, T., Triantafyllidis, T., and Lizcano, A. (2009). Comparison of cyclic triaxial behavior of unbound granular material under constant and variable confining pressure. J. Transp. Eng. 135 (7), 467–478. doi:10.1061/(asce)te.1943-5436.0000009
Sakai, A., Samang, L., and Miura, N. (2003). Partially-drained cyclic behavior and its application to the settlement of a low embankment road on silty-clay. Soils Found. 43 (1), 33–46. doi:10.3208/sandf.43.33
Sun, L., Cai, Y. Q., Gu, C., Wang, J., and Guo, L. (2015). Cyclic deformation behaviour of natural K0 - consolidated soft clay under different stress paths. J. Cent. South Univ. 22, 4828–4836. doi:10.1007/s11771-015-3034-4
Tang, Y. Q., Cui, Z. D., Zhang, X., and Zhao, S. K. (2008). Dynamic response and pore pressure model of the saturated soft clay around the tunnel under vibration loading of Shanghai subway. Eng. Geol. 98 (3-4), 126–132. doi:10.1016/j.enggeo.2008.01.014
Wang, J., Guo, L., Cai, Y. Q., Bian, X. C., and Gu, C. (2013). Strain and pore pressure development on soft marine clay in triaxial tests with a large number of cycles. Ocean. Eng. 74, 125–132. doi:10.1016/j.oceaneng.2013.10.005
Wang, Y., Zhang, S. X., Yin, S., Liu, X. Y., and Zhang, X. W. (2020). Accumulated plastic strain behavior of granite residual soil under cycle loading. Int. J. Geomech. 20 (11), 04020205. doi:10.1061/(asce)gm.1943-5622.0001850
Wichtmann, K., Andersen, K. H., Sjursen, M. A., and Berre, T. (2013). Cyclic tests on high-quality undisturbed block samples of soft marine Norwegian clay. Can. Geotech. J. 50 (11), 400–412. doi:10.1139/cgj-2011-0390
Wichtmann, T., Niemunis, A., and Triantafyllidis, T. H. (2007). On the influence of the polarization and the shape of the strain loop on strain accumulation in sand under high-cyclic loading. Soil Dyn. Earthq. Eng. 27 (1), 14–28. doi:10.1016/j.soildyn.2006.05.002
Yang, Q., Tang, Y. Q., Yuan, B., and Zhou, J. (2018). Cyclic stress–strain behaviour of soft clay under traffic loading through hollow cylinder apparatus: Effect of loading frequency. Road Mater. Pavement Des. 20 (5), 1026–1058. doi:10.1080/14680629.2018.1428219
Keywords: saturated soft clay, cyclic triaxial test, cyclic confining pressure, frequency, excess pore water pressure
Citation: Huang J, Hu J, Wang H, Chen J and Liu S (2023) Excess pore water pressure behavior of saturated soft clay under cyclic confining pressure with different frequencies. Front. Earth Sci. 10:1035889. doi: 10.3389/feart.2022.1035889
Received: 03 September 2022; Accepted: 29 September 2022;
Published: 10 January 2023.
Edited by:
Zizheng Guo, Hebei University of Technology, ChinaReviewed by:
Chong Lin, Southwest Petroleum University, ChinaChengfeng Li, Tianjin University, China
Copyright © 2023 Huang, Hu, Wang, Chen and Liu. This is an open-access article distributed under the terms of the Creative Commons Attribution License (CC BY). The use, distribution or reproduction in other forums is permitted, provided the original author(s) and the copyright owner(s) are credited and that the original publication in this journal is cited, in accordance with accepted academic practice. No use, distribution or reproduction is permitted which does not comply with these terms.
*Correspondence: Jun Hu, anVuaHV1QGZveG1haWwuY29t