Corrigendum: The Short-Term Climate Prediction System FIO-CPS v2.0 and Its Prediction Skill in ENSO
 Yajuan Song
 Qi Shu1,2,3
 Ying Bao
 Zhenya Song
- 1Key Laboratory of Marine Science and Numerical Modeling, First Institute of Oceanography, Ministry of Natural Resources, Qingdao, China
- 2Laboratory for Regional Oceanography and Numerical Modeling, Pilot National Laboratory for Marine Science and Technology, Qingdao, China
- 3Shandong Key Laboratory of Marine Science and Numerical Modeling, Qingdao, China
The climate model is an important tool for simulating and predicting the mean state and variability of the climate system. The First Institute of Oceanography-Climate Prediction System (FIO-CPS), built on a climate model with the oceanic observation initialization, has been updated from version 1.0 to 2.0, with a finer resolution and more reasonable physical processes. Previous assessments show that the mean state was well simulated in version 2.0, and its influence on the prediction was further analyzed in this study. Hindcast experiments were conducted using FIO-CPS v1.0 and v2.0, and their prediction abilities based on 27 years (1993–2019) experiment data were analyzed. The results show that the sea surface temperature (SST) biases over the eastern Pacific and the Southern Ocean are improved in the initial condition of FIO-CPS v2.0. Moreover, this new system has a higher skill for predicting El Niño-Southern Oscillation (ENSO). The prediction skill represented by the anomaly correlation coefficient (ACC) of the Niño3.4 index is greater than 0.78 at the 6-month lead time, which increases by 11.09% compared to the value of 0.70 in FIO-CPS v1.0. The root mean square error (RMSE) decreases by 0.20, which accounts for 28.59% of the FIO-CPS v1.0 result. Furthermore, the improvement of the prediction skill changes seasonally, featured by the ACC significantly increasing in the boreal winter and early spring. The improvement in the annual mean SST prediction over the Equatorial Pacific mainly contributes to the enhanced ENSO prediction skill in FIO-CPS v2.0. These results indicate that a state-of-the-art climate model with a well-simulated mean state is critical in improving the prediction skill on the seasonal time scale.
Introduction
The climate model, also known as the coupled general circulation model, is an important tool for simulating the processes and interactions among the atmosphere, ocean, land, and other components (Dai et al., 2014; Zhou et al., 2020). Furthermore, it is one of the most important methods of future climate prediction and has been widely used in operational prediction from seasonal to decadal time scales (Ren et al., 2019; Barnston et al., 2019).
Accurate seasonal predictions based on state-of-the-art climate models can prevent and mitigate climate-related disasters in the coming season and have aroused wide concern by international climate researchers and society (Jin et al., 2008; Barnston et al., 2012; Luo et al., 2016). Over the past thirty years, seasonal prediction skills have improved due to the availability of more reasonable initial conditions, increased ensembles and the rapid development of climate models (Wyrtki, 1975; Cane et al., 1986; Drosdowsky, 2006, Zheng et al., 2006; Zheng et al., 2007). Meanwhile, the changes of climate mean state and variability raise new challenges to the seasonal prediction (Zheng and Yu, 2017). Based on the increasing amount of available observations, sophisticated data assimilation techniques can incorporate more observations into the climate models and provide optimal initial conditions for seasonal predictions (Zheng and Zhu, 2010; Zhao et al., 2019; Zhang et al., 2020). Furthermore, the development of climate models on account of the deeper understanding of air-sea interactions also contributes to improving the prediction skill (Chen et al., 2004; Hu et al., 2013; Zheng and Zhu, 2016). Previous studies show that the mean state in coupled model has significant influence on seasonal prediction capability. However, the mean state, used for calculating the anomalies, still has systematic errors in coupled prediction system, hence the simulated bias of climate variability is identified by the differences between predicted physical fields and the unreal mean state. Zheng and Yu (2017) show that the errors characterized by a warm bias in the eastern Pacific and a cold bias in the central part of the basin indicate a stronger spring prediction barrier for the central Pacific El Niño. Moreover, The climatological cold bias of SST in the upper tropical Pacific Ocean influences the predictive capability of the climate model in predicting the amplitude of El Niño-Southern Oscillation (ENSO) (Kim et al., 2017). Zhu et al. (2017) demonstrated that improving the mean state simulation by amending the physical parameterization scheme in model is helpful to enhance the seasonal prediction skill. Therefore, improving the mean state in the climate model can ameliorate the simulation of variability, it might further improve prediction capability.
The First Institute of Oceanography-Climate Prediction System (FIO-CPS) is a seasonal prediction system, based on an atmosphere-wave-ocean-sea ice-land surface coupled climate model and an oceanic assimilation module. In version 1.0, the role of the ocean surface waves in the climate system was considered by incorporating the non-breaking surface wave-induced mixing effect (Qiao et al., 2004; Qiao et al., 2010). We had assessed the seasonal prediction of the SST based on the hindcast results of FIO-CPS v1.0 in the North Pacific. The wave-induced vertical mixing plays a key role in the seasonal prediction of the SST. The results show that the prediction error is significantly reduced at high latitudes in the North Pacific when the effects of the surface waves were considered (Zhao et al., 2019; Song et al., 2020). In addition, FIO-CPS v1.0 was also employed to predict the El Niño evolution in 2015/16. The predicted strength more than 2.0°C is comparable to the observations (Song et al., 2015). The new version of FIO-CPS (v2.0) was developed based on the First Institute of Oceanography-Earth System Model version 2.0 (FIO-ESM v2.0), which participates in phase 6 of the Coupled Model Intercomparison Project (CMIP6). Each new version component has been updated by including more reasonable physical processes and improved horizontal and vertical resolutions. In addition, more physical processes related to air-sea interactions were considered in FIO-ESM v2.0 (Figure 1). FIO-ESM v2.0 can capture the major features of the observed climatology in the historical period. In particular, the results based on historical experiments show that the new model has fairly good skill in simulating the climatological state of the atmosphere and ocean (Bao et al., 2020). The influence of the improved mean state on the prediction ability requires further analysis.
FIGURE 1
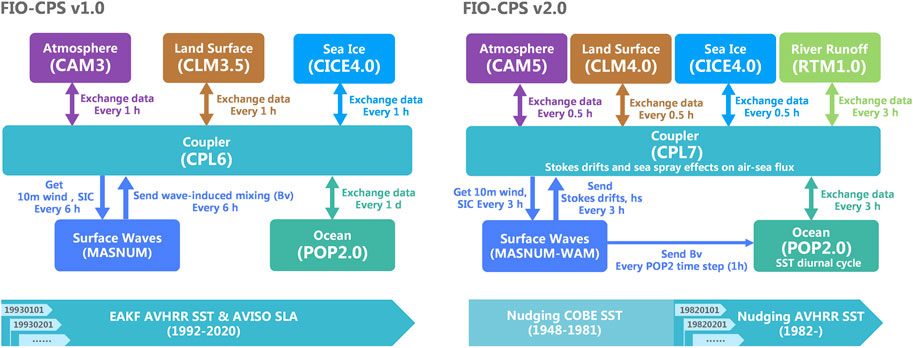
FIGURE 1. Flowcharts for FIO-CPS v1.0 and FIO-CPS v2.0.
In this study, the prediction skill of FIO-CPS v2.0 in predicting the ENSO was evaluated and compared with that of FIO-CPS v1.0 based on two hindcast experiments. The paper is organized as follows. The details of the climate model, initialization method, experiments, and datasets are described in Model and Datasets. Results presents the initiation conditions and prediction results for FIO-CPS v1.0 and v2.0. Finally, the conclusions and discussion are presented in Conclusion.
Model and Datasets
Climate Prediction System and Experiments
The seasonal prediction systems FIO-CPS, developed by the First Institute of Oceanography, Ministry of Natural Resources of China, was built on the FIO-ESM and an oceanic assimilation module. FIO-ESM includes the physical model and a biogeochemical module. The FIO-CPS was developed based on the physical model of FIO-ESM, while the biogeochemical processes were not considered. The FIO-CPS v1.0 was based on the First Institute of Oceanography-Earth System Model version 1.0 (FIO-ESM v1.0), which had participated in phase 5 of the Coupled Model Intercomparison Project (CMIP5) and conducted the required experiments. The numerical simulations show that the basic patterns and variability of the ocean and atmosphere, including the ENSO, are well simulated during the historical period (Qiao et al., 2013). An ocean surface wave model named Marine Science and Numerical Modeling (MASNUM) was incorporated into the system. So FIO-CPS v1.0 consists of five component models: the atmospheric general circulation model, the land surface model, the oceanic general circulation model, the sea ice model, and the ocean surface wave model.
Now the FIO-CPS has been updated from version 1.0 to 2.0, accompanied by higher horizontal-vertical resolution and improved physical processes. The atmospheric model component was updated from the Community Atmosphere Model Version 3.0 (CAM 3.0) to CAM 5.0. In the atmospheric component, the Eulerian dynamical core in CAM3 is replaced by a finite-volume dynamical core in CAM 5.0. The resolution was also improved. Specifically, the horizontal resolution in CAM 3.0 is T42 (about 2.875° in latitude and longitude), with 26 vertical layers. In CAM 5.0, the horizontal resolution is f09 (1.25° in longitude and 0.9° in latitude), with 30 vertical layers. In addition, the Parallel Ocean Program 2 (POP2), an oceanic general circulation model, also has a refined resolution, with the vertical layers increased from 40 to 61. The land surface model was updated from Community Land Model version 3.5 (CLM3.5) to CLM4.0, and the sea ice model component is the Los Alamos sea ice model version 4 (CICE4) with the same horizontal resolution as POP2. All the components are connected by the coupler. The coupler receives data from each component to calculate the flux, then returns the flux and related physical state to respective components. For example, in FIO-CPS v1.0, the coupler receives the hourly atmospheric data and daily oceanic data, then calculates and returns the flux to each component. More details can be found in Bao et al. (2020).
In addition to the effect of the wave-induced vertical mixing, three other distinctive physical processes related to air-sea interactions, including the effect of the Stokes drift, the sea spray, and the SST diurnal cycle, were included in FIO-ESM v2.0 (Bao et al., 2020). The horizontal residual velocity caused by the Stokes drift motion can influence relative surface speed when calculating heat and momentum fluxes. Sea spray also has significant effects on the air-sea heat transport when water droplets are emitted into the air by broken ocean surface waves. In addition, the difference between the day and night temperatures at the ocean surface, represented by the SST diurnal cycle parameterization, was considered to modulate the heat and gas fluxes. All these physical processes play important roles in the heat and mass transport at the air-sea interface.
The initial oceanic condition is also crucial in the seasonal prediction. FIO-CPS v1.0 uses the ensemble adjustment Kalman filter (EAKF) method to assimilate the daily SST and sea level anomaly for the initialization (Chen et al., 2015). The key variables in the upper ocean, such as the ocean temperature, salinity, and velocity, are harmonious during the assimilation and prediction. The assimilation experiment was conducted from 1992 to 2019, and the EAKF data assimilation included ten ensembles under the three-dimensional ocean temperature perturbation method with a magnitude of 10–3°C (Song et al., 2020). Then, the seasonal hindcast experiment for 1993–2019 was started on the first day of each month. In FIO-CPS v2.0, the assimilation experiment was started from 1948 to acquire more stable results. With one ensemble simulation, the nudging approach was utilized to consider the ocean satellite observations in the initial conditions. The upper ocean temperature in the mixed layer was assimilated to the observation. The assimilation window is 30 days. Here, a threshold method with the temperature criterion (the temperature is less than 1°C relative to SST) was chosen to determine the mixed layer depth (MLD). Meanwhile, a factor representing the nudging degree is multiplied, changing linearly from 1 at sea surface to 0 at the bottom of the mixed layer. In the polar region, there is no assimilation in the ocean where covered by sea ice. Ten ensembles were produced in the hindcasts using the three-dimensional ocean temperature perturbation method mentioned above. In FIO-CPS v1.0, each hindcast runs for 6 month, and the prediction time extends to 13 month in FIO-CPS v2.0. The information of the prediction system and experiments are shown in Figure 1. The experimental results for the common years from 1993 to 2019 with 6 months hindcast results were analyzed in this study.
Datasets and Method
In FIO-CPS v1.0, the daily Optimum Interpolation Sea Surface Temperature (OISST v2) based on the Advanced Very High Resolution Radiometer (AVHRR) satellite data from the National Oceanic and Atmospheric Administration (NOAA) National Climate Data Center (NCDC), and sea level anomaly from the Archiving, Validation, and Interpretation of Satellite Data (AVISO) were assimilated using the EAKF assimilation method (Ducet et al., 2000; Reynolds et al., 2007). The horizontal resolution of both datasets is 0.25° in a uniform grid. In FIO-CPS v2.0, the daily Sea Surface Analysis for Climate Monitoring and Prediction (COBE) with a resolution of 1° × 1° were incorporated using the nudging method from 1948 to 1981 (Hirahara et al., 2014), and then, the 1/4° daily SST from improved estimation OISST v2.1 were nudged since 1982 (Banzon et al., 2020). The initial condition was compared with COBE SST from 1993 to 2019, and the predicted result was compared with OISST v2.1. To evaluate the subsurface ocean temperature, the National Centers for Environmental Prediction (NCEP) Global Ocean Assimilation System (GODAS) datasets was analyzed (Behringer et al., 1998). All the observations and simulations were linearly interpolated to a 1° grid before the validation. The monthly anomalies for each experiment and the observations were defined by concerning their own climatology for the same period. To measure the relationship between the predicted and observed anomalies, several statistical indicators, including the anomaly correlation coefficient (ACC), the root mean square error (RMSE), the centered root mean square difference (CRMSD, calculated as the RMSE of the predication and observation after subtracting their own mean value), and the absolute average errors (AAE, calculated as the absolute mean value of differences between prediction and observation time series), were used to evaluate the performances of those prediction systems.
Results
Initial State
The monthly mean initial results based on FIO-CPS v1.0 and FIO-CPS v2.0 were analyzed for 1993–2019 by comparing the differences in the annual mean SST of the simulation and OISST v2.1. As shown in Figure 2, the bias of FIO-CPS v2.0 is generally smaller than that of FIO-CPS v1.0. There are negative biases in the equatorial Pacific, the western boundary current region in the North Pacific and Atlantic, and several areas in the Southern Ocean, indicating that the simulated SST in these areas is lower than the observations. In addition, the SST differences for FIO-CPS v1.0 exhibit a large warm bias in the eastern boundary of the Pacific and the Southern Ocean. In FIO-CPS v2.0, these biases are obviously improved. Both the spatial correlation coefficients in FIO-CPS v1.0 and v2.0 are greater than 0.99, and the bias represented by the CRMSD decreases from 0.43 to 0.33. The annual mean results reveal that the initial values simulated using FIO-CPS v2.0 are more consistent with the observations.
FIGURE 2
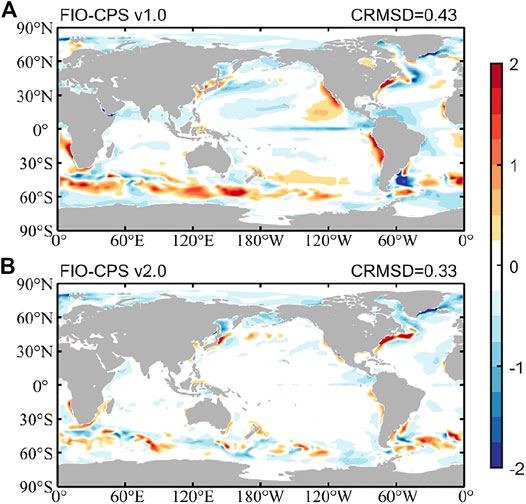
FIGURE 2. Climatological SST differences (units: °C) between the initial conditions and COBE SST: (A) FIO-CPS v1.0 and (B) FIO-CPS v2.0. The CRMSD is listed in the top right corners.
Figures 3A,B shows the ACC of the sea surface temperature anomaly (SSTA) between the OISST v2.1 and the assimilation results. It is found that the model that assimilates the observations captures the SSTA pattern reasonably well in the tropical eastern Pacific, with the highest ACC distribution in both models’ results. Generally, the ACC in the tropics is higher than it in the subtropics and at high-latitudes. In the zonal direction, the initiation conditions in the Atlantic and Pacific are more consistent with the observations than those in the Indian Ocean. The difference of ACC between FIO-CPS v2.0 and v1.0 is shown in Figure 3C. The assimilation results of FIO-CPS v2.0 are improved compared with those of FIO-CPS v1.0, especially in the Southern Ocean and the tropical region. The ACC of FIO-CPS v1.0 is less than 0.6 in most Southern Ocean, where the ACC in FIO-CPS v2.0 exhibits a increase. Generally, the improvement is more significant in the Southern Hemisphere than the Northern Hemisphere.
FIGURE 3
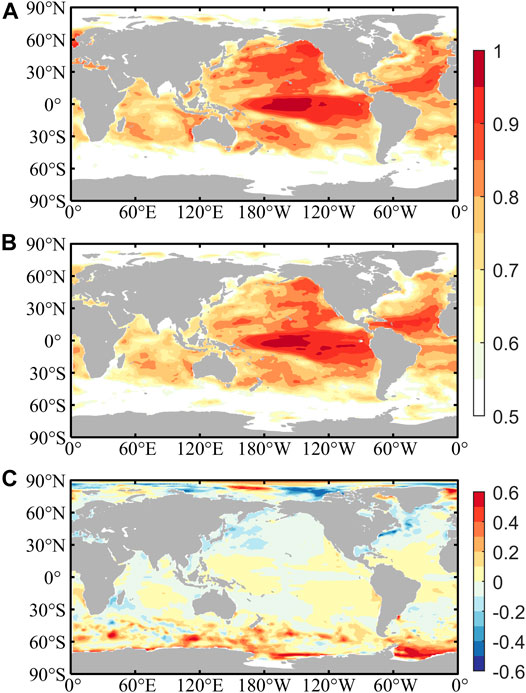
FIGURE 3. The SSTA ACC between the COBE SST and the initial conditions. (A) FIO-CPS v1.0; (B) FIO-CPS v2.0; and (C) FIO-CPS v2.0–FIO-CPS v1.0.
Seasonal Prediction
The ENSO is the dominant natural variability in the equatorial Pacific on seasonal to interannual timescales. Here, we examined the predictive skills of the two versions of the system in predicting the ENSO state indicated by the Niño3.4 index, which is calculated by the area-averaged SSTA with a 3-month running mean (Figure 4). The seasonal predictions of the ensemble mean results based on FIO-CPS v1.0 and v2.0 were evaluated by calculating the respective metrics (i.e., the ACC and RMSE). The horizontal axis represents the initial conditions and the prediction month for 1-month to 6-month lead times. As shown in Figure 4A, considering the assimilated results, the ACC between the FIO-CPS v2.0’s simulation and the observations is higher than that for the FIO-CPS v1.0. This result is consistent with the spatial distribution of the ACC (Figure 3). The ACC of FIO-CPS v2.0 is higher than that of FIO-CPS v1.0, indicating that FIO-CPS v2.0 is more skillful than FIO-CPS v1.0 in predicting the Niño3.4 index. As the predicted month increases, the difference between the two models increases. At a 6-month lead time, the ACC of FIO-CPS v2.0 is 0.78, which increases by 11.09% compared with the value of 0.70 in FIO-CPS v1.0. In addition, the RMSEs of the two models are compared in Figure 4B. The RMSE of FIO-CPS v1.0 increases rapidly from the 2-month lead time. In contrast, FIO-CPS v2.0, with its smaller RMSE in the initial conditions, exhibits a slower error growth during the prediction. From lead-4 to lead-6 month, the RMSE decreases by more than 0.20 that accounts for about 30% of the result of FIO-CPS v1.0. In addition, we also found that the ability of the model to predict strong ENSO events has a great impact on the average skill. For example, if the strong ENSO event index in 2015/16 and the next few years are removed from the time series, the ACC is 0.85 for a 6-month lead time predicted using FIO-CPS v2.0, and the value is 0.75 based on the FIO-CPS v1.0 (not shown).
FIGURE 4
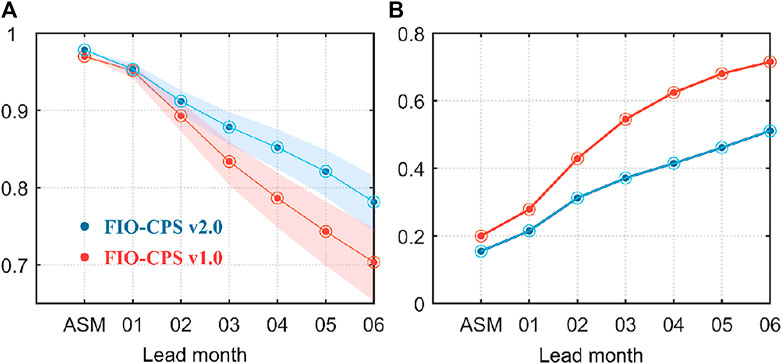
FIGURE 4. (A) ACC and (B) RMSE of the Niño 3.4 index between the OISST v2.1 and the simulation for 1993–2019. The red and blue lines represent the assimilated and predicted results of FIO-CPS v1.0 and FIO-CPS v2.0 for 1-month to 6-month lead times, and the shaded area in (A) indicates the 95% confidence interval.
Figure 5 shows the ACC and RMSE of the Niño 3.4 SSTA of FIO-CPS v1.0 and v2.0 as a function of the predicted target month and lead time. The ACC distributions of the two systems generally exhibit similar patterns. Both predictions indicate a spring predictability barrier in the ENSO, with relatively lower prediction skills in the boreal spring and extending to later seasons for longer lead times. Generally, the FIO-CPS v2.0 has a higher correlation skill in contrast to FIO-CPS v1.0, especially in boreal winter and spring. The significant positive difference in the ACC as the target month ranging from February to May demonstrates that the predictability in winter has been improved in FIO-CPS v2.0. Furthermore, we found that the most significant improvement in the skill was for 3- to 6-month lead times in spring. Both the well initial conditions and the improved climate model provide more skillful predictions for a longer lead time. In addition, the RMSE of FIO-CPS v1.0 increases significantly in the boreal summer from 2-month lead times, while the RMSE of FIO-CPS v2.0 is obvious smaller than that of v1.0. In boreal winter and early spring, the RMSE decreases by 0.5 for 5-month to 6-month lead times, and it decreases by more than 0.3 in boreal summer for 3-month to 5-month lead times. Overall, based on the ACC and RMSE indicators, the predicted ENSO is dramatically improved in the boreal winter and summer. Besides, the spring predictability barrier is still obvious in FIO-CPS v2.0, but there is a clear improvement of this problem and its persistence.
FIGURE 5
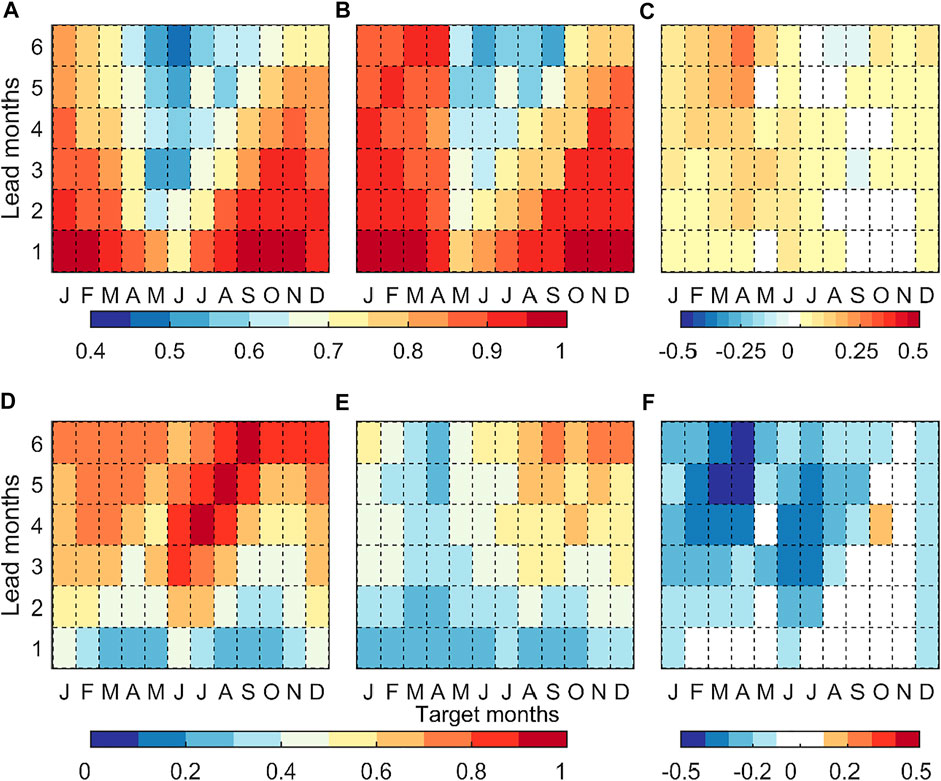
FIGURE 5. ACC and RMSE of the Niño 3.4 SSTA as a function of the target month and lead month obtained using the (A, D) FIO-CPS v1.0; (B, E) FIO-CPS v2.0; (C, F) the differences between FIO-CPS v2.0 and FIO-CPS v1.0.
To explore the improvement in the ENSO prediction in more detail, the spatial distributions of the SSTA ACC for 2-, 4-, and 6-month lead times are shown in Figure 6. The ACC is higher in the central and eastern tropical Pacific but is lower in the western tropical Pacific and subtropical Pacific. The spatial patterns for the different lead times are similar, but the magnitude differs for the different lead months. FIO-CPS v2.0 exhibits an improved skill in terms of the SSTA prediction in the tropical Pacific. As previously discussed, the skill of FIO-CPS v2.0 in predicting the Niño3.4 index is improved (Figure 4A). However, the most obvious improvement is not in the equatorial Pacific. The SSTA in the western Pacific and subtropical eastern Pacific are predicted considerably better than the SSTA in the equatorial Pacific. As shown by the differences in the ACC of SSTA, there is a positive value in the western Pacific and the extra-equatorial area.
FIGURE 6
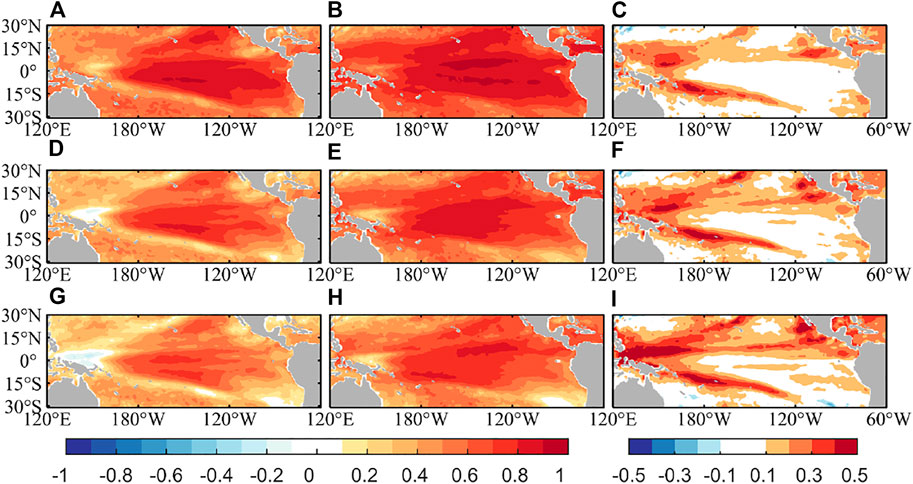
FIGURE 6. Spatial distribution of the SSTA ACC in the tropical Pacific for different lead months, (A, D, G) FIO-CPS v1.0 results, (B, E, H) FIO-CPS v2.0 results, and (C, F, I) the difference between FIO-CPS v2.0 and FIO-CPS v1.0. The result for (A–C) 2-month lead time, (D–F) 4-month lead time, and (G–I) 6-month lead time.
The annual mean AAE of SSTA calculated using the absolute value of the differences between the predictions and OISST v2.0 reflects the model’s ability to predict the mean state of the SSTA. As shown in Figure 7, a large AAE exists in the equatorial Pacific, with a maximum larger than 0.5°C for FIO-CPS v1.0. As the prediction time increases, the error persists in the equator Pacific and even increases. A clear improvement, with a reduced AAE, in the equatorial Pacific is seen for FIO-CPS v2.0 over the whole range of lead times. The difference in the AAE is negative along the equator, and the improvement is more obvious in the northern tropical Pacific. It is found that the negative difference of less than 0.3°C is distributed in the northern tropical Pacific for 2- and 4-month lead times.
FIGURE 7
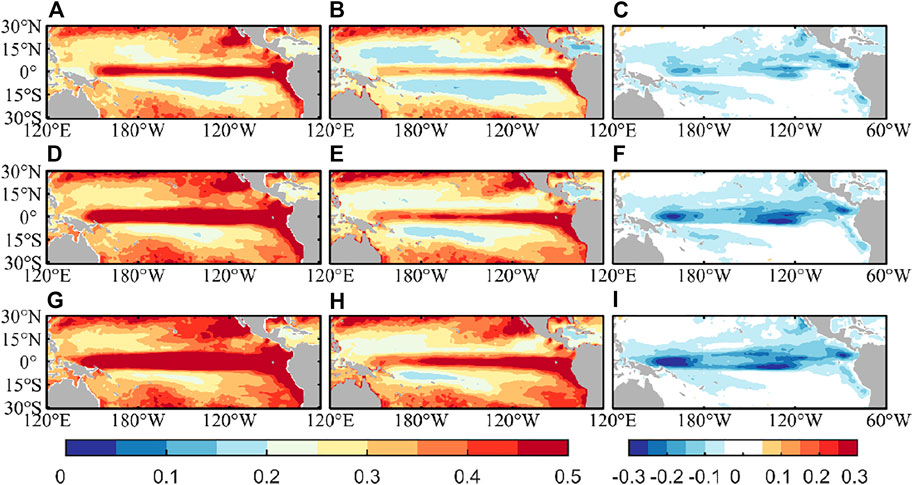
FIGURE 7. Spatial distribution of the absolute average error (AAE, units: °C) of the SSTA between the predictions and OISST v2.1, (A, D, G) FIO-CPS v1.0 results, (B, E, H) FIO-CPS v2.0 results, and (C, F, I) the difference between FIO-CPS v2.0 and FIO-CPS v1.0. (A–C) 2-month lead time, (D–F) 4-month lead time, and (G–I) 6-month lead time.
The vertical profile of upper ocean temperature differences averaged between 5°S and 5°N between the prediction and GODAS datasets is shown in Figure 8. The solid line represents the mixed layer depth (determined by the criteria: a temperature change from the ocean surface of 0.5°C) of GODAS (red line) and prediction results (black line). There are cold biases below the mixed layer in FIO-CPS v1.0, while the FIO-CPS v2.0 presents warm bias, especially in the eastern Pacific. The bias gradually magnifies with the increase of lead month. Moreover, the predicted MLD is deeper as compared with the GOADS result in FIO-CPS v2.0. The ENSO variability is closely related to the MLD variation. In the mixed layer, the FIO-CPS v1.0 has an obvious cold bias in the Niño region, which tents to produce the La Niña event more frequently, however, the temperature bias in the FIO-CPS v2.0 is dramatically improved. Generally, the FIO-CPS v2.0 tends to predict a more reasonable vertical structure of upper ocean temperature.
FIGURE 8
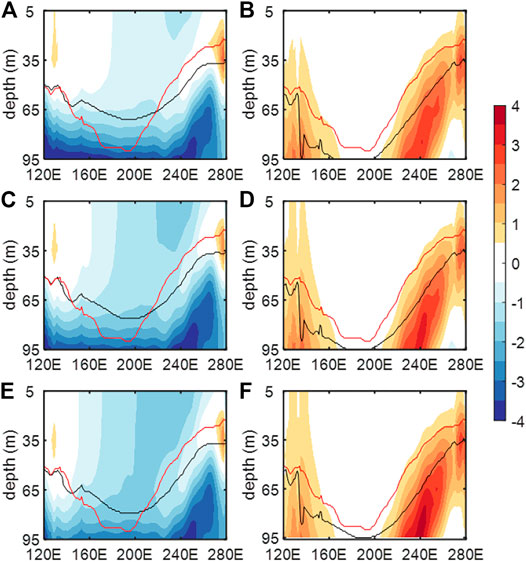
FIGURE 8. Vertical profile of subsurface ocean temperature along the equator (averaged between 5°S and 5°N) between prediction and GODAS, (A, C, E) FIO-CPS v1.0 and (B, D, F) FIO-CPS v2.0 results for the period 1993–2019, (A, B) 2-month lead time, (C, D) 4-month lead time, and (E, F) 6-month lead time. The red and black line represent the MLD based on observation and prediction.
Figure 9 shows the prediction of the Niño3.4 index starting from 1 September 2021, here the SSTA is respect to the 1982–2020 climatology. The ensemble mean of the Niño3.4 index is close to zero in September and will decrease in winter, but the Niño3.4 index doesn’t surpass a threshold of -0.5°C. It indicates that ENSO will be in a neutral state during the winter time. Then, the Niño3.4 SSTA will increase from January in 2022. Specifically, the Niño3.4 index of five ensembles will increase with anomalies of up to 0.5°C in early summer in 2022. It is found that there is significant differences between different observational data. The index derived from OISST v2.1 is higher than the ERSST result. In FIO-CPS v2.0, the daily OISST v2.1 is assimilated, thus the nudging OISST v2.1 provides a warmer initial condition for the prediction. A neutral ENSO condition with negative Niño3.4 index are favored through the winter of 2021 based on the ensemble mean prediction of FIO-CPS v2.0. However, if the prediction is revised according to the ERSST, a transition from ENSO-neutral to La Niña is favored in the winter 2021–22.
FIGURE 9
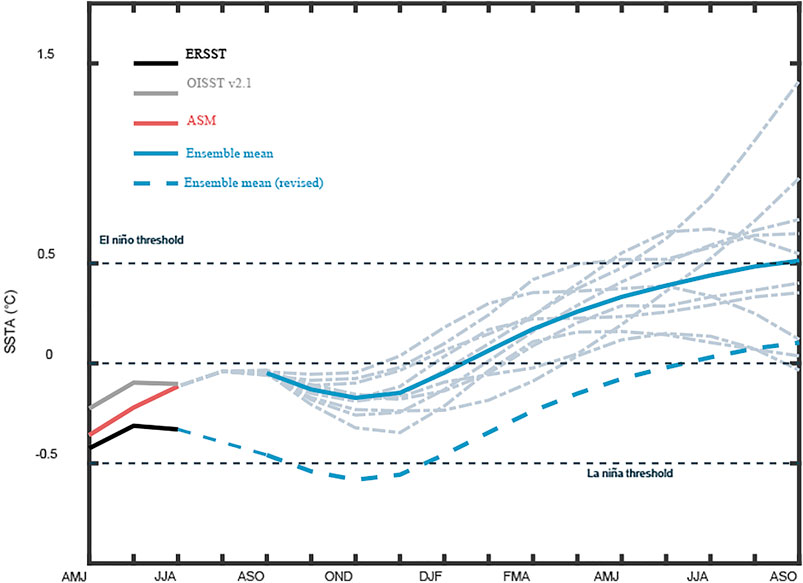
FIGURE 9. The Niño 3.4 index with respect to the 1982–2020 climatology based on the prediction starting from 1 September 2021. The black, grey and red lines are the index of ERSST, OISST v2.1 and the initial state. The blue solid and dashed lines show the prediction of ensemble mean and revised index, and the dashed light blue line represents each ensemble.
Conclusion
The seasonal prediction system FIO-CPS v2.0 was recently developed, and its prediction ability indicated by Niño index and SSTA in the tropical Pacific Ocean was evaluated based on the hindcast results from 1993 to 2019. Compared with FIO-CPS v1.0, FIO-CPS v2.0 has an improved skill in predicting ENSO based on the indicators of ACC and RMSE. The increases in the spatial and temporal correlations between the simulation and the observations reveal that the initial state of FIO-CPS v2.0 is well simulated. The improved initialization and physical model result in a more skillful seasonal prediction. Specifically, the ENSO prediction skill, represented by the ACC, is 0.78 for a 6-month lead time, which is 11.09% better than that of FIO-CPS v1.0. And the RMSE decreases by 0.20 that represents 28.59% of the FIO-CPS v1.0 result. The prediction errors of the Niño 3.4 SSTA exhibit a seasonally dependent evolution, with the lowest ACC in the boreal spring and early summer. A spring predictability barrier exists in FIO-CPS v1.0 and v2.0, but this problem is less pronounced in FIO-CPS v2.0. Moreover, the prediction skill significantly increases in boreal winter and spring for 3- to 6-month lead times, and in summer for 1- to 2-month lead times in FIO-CPS v2.0.
It seems that the well-predicted mean state of the SSTA mainly contributes to the improvement of the ENSO prediction. In FIO-CPS v2.0, all model components are improved, with a more reasonable parameterization scheme and higher horizontal and vertical resolutions. Bao et al. (2020) and Liao et al. (2021) pointed out that FIO-ESM v2.0 can simulate the strength and period of the ENSO fairly well compared with observation. The improvement in the model’s performance at simulating ENSO plays a crucial role in enhancing its prediction ability. In this study, the prediction errors of the mean state were evaluated. In the equatorial Pacific, the mean state of the SSTA is more consistent with the observations. However, the change in the ACC, representing the variability of the SSTA, did not exhibit a comparable improvement. This further illustrates the importance of the model’s ability in accurately simulating and predicting the mean states in the tropical Pacific.
As shown by Barnston et al. (2019), the correlation skill of the North American multi-model ensemble prediction plume’s results is greater than 0.6 for 11- to 12-month lead times. However, the error growth of the Niño3.4 SSTA is accelerated for a greater than 8-month lead time in FIO-CPS v2.0, and the prediction skill is reduced to 0.5 for a 12-month lead time. In FIO-CPS v2.0, only the fine resolution SST is considered in the initial field using the nudging method, which can only modulate the ocean temperature in the mixed layer. This implies that the simple assimilation technique and neglecting the observations in the subsurface ocean may lead to the growth of the SSTA error during the prediction. To continually improve the prediction skill of FIO-CPS v2.0, more observation datasets and reasonable assimilation methods are needed to reduce the growth of the prediction error.
Data Availability Statement
The original contributions presented in the study are publicly available. The prediction datasets based on FIO-CPS v1.0 and v2.0 have been uploaded to Figshare at https://doi.org/10.6084/m9.figshare.15171366 and https://doi.org/10.6084/m9.figshare.15171369, respectively.
Author Contributions
ZS initially designed and organized analysis. YS conducted the hindcast experiments, made some figures and wrote first draft. YB and QS developed the climate model and induced the assimilation scheme into the short-term climate prediction system. XY downloaded the observation dataset, and updated the prediction experiment. All authors contributed to polishing the manuscript.
Funding
This research was jointly supported by the National Natural Science Foundation of China (Grant No. 42075039, 42022042, and 41821004), the China-Korea Cooperation Project on Northwestern Pacific Climate Change and its Prediction, and the CAS Interdisciplinary Innovation Team (JCTD-2020-12).
Conflict of Interest
The authors declare that the research was conducted in the absence of any commercial or financial relationships that could be construed as a potential conflict of interest.
The reviewer (LM) declared a past co-authorship with the authors (YB, ZS) to the handling Editor.
Publisher’s Note
All claims expressed in this article are solely those of the authors and do not necessarily represent those of their affiliated organizations, or those of the publisher, the editors and the reviewers. Any product that may be evaluated in this article, or claim that may be made by its manufacturer, is not guaranteed or endorsed by the publisher.
Acknowledgments
The numerical experiments in this study were carried out at the National Supercomputer Center in Tianjin (NSCC-TJ) and the Beijing Super Cloud Computing Center (BSCC).
References
Banzon, V., Smith, T. M., Steele, M., Huang, B., and Zhang, H.-M. (2020). Improved Estimation of Proxy Sea Surface Temperature in the Arctic. J. Atmos. Ocean. Technol. 37 (2), 341–349. doi:10.1175/JTECH-D-19-0177.1
Bao, Y., Song, Z., and Qiao, F. (2020). FIO‐ESM Version 2.0: Model Description and Evaluation. J. Geophys. Res. Oceans 125. doi:10.1029/2019JC016036
Barnston, A. G., Tippett, M. K., L'Heureux, M. L., Li, S., and DeWitt, D. G. (2012). Skill of Real-Time Seasonal ENSO Model Predictions during 2002-11: Is Our Capability Increasing. Bull. Amer. Meteorol. Soc. 93 (5), 631–651. doi:10.1175/bams-d-11-00111.1
Barnston, A. G., Tippett, M. K., Ranganathan, M., and L’Heureux, M. L. (2019). Deterministic Skill of ENSO Predictions from the North American Multimodel Ensemble. Clim. Dyn. 53 (21), 7215–7234. doi:10.1007/s00382-017-3603-3
Behringer, D. W., Ji, M., and Leetmaa, A. (1998). An Improved Coupled Model for ENSO Prediction and Implications for Ocean Initialization. Part I: The Ocean Data Assimilation System. Mon. Wea. Rev. 126 (4), 1013–1021. doi:10.1175/1520-0493(1998)126<1013:aicmfe>2.0.co;2
Cane, M. A., Zebiak, S. E., and Dolan, S. C. (1986). Experimental Forecasts of El Niño. Nature 321, 827–832. doi:10.1038/321827a0
Chen, D., Cane, M. A., Kaplan, A., Zebiak, S. E., and Huang, D. (2004). Predictability of El Niño over the Past 148 Years. Nature 428, 733–736. doi:10.1038/nature02439
Chen, H., Yin, X., Bao, Y., and Qiao, F. (2015). Ocean Satellite Data Assimilation Experiments in FIO-ESM Using Ensemble Adjustment Kalman Filter. Sci. China Earth Sci. 59 (3), 484–494. doi:10.1007/s11430-015-5187-2
Dai, A. G., Wigley, T., Boville, B. A., Kiehl, J. T., and Buja, L. E. (2014). Climates of the Twentieth and Twenty-First Centuries Simulated by the NCAR Climate System Model. J. Clim. 14 (4), 485–519. doi:10.1175/1520-0442(2001)0142.0.CO;2
Drosdowsky, W. (2006). Statistical Prediction of ENSO (Nino 3) Using Sub-surface Temperature Data. Geophys. Res. Lett. 33 (3), L03710. doi:10.1029/2005GL024866
Ducet, N., Le Traon, P. Y., and Reverdin, G. (2000). Global High-Resolution Mapping of Ocean Circulation from TOPEX/Poseidon and ERS-1 and -2. J. Geophys. Res. 105, 19477–19498. doi:10.1029/2000jc900063
Hirahara, S., Ishii, M., and Fukuda, Y. (2014). Centennial-scale Sea Surface Temperature Analysis and its Uncertainty. J. Clim. 27 (1), 57–75. doi:10.1175/JCLI-D-12-00837.1
Hu, Z.-Z., Kumar, A., Huang, B., Zhu, J., and Guan, Y. (2014). Prediction Skill of north Pacific Variability in NCEP Climate Forecast System Version 2: Impact of ENSO and beyond. J. Clim. 27 (11), 4263–4272. doi:10.1175/JCLI-D-13-00633.1
Jin, E. K., Kinter, J. L., Wang, B., Park, C.-K., Kang, I.-S., Kirtman, B. P., et al. (2008). Current Status of ENSO Prediction Skill in Coupled Ocean-Atmosphere Models. Clim. Dyn. 31 (6), 647–664. doi:10.1007/s00382-008-0397-3
Kim, S. T., Jeong, H.-I., and Jin, F.-F. (2017). Mean Bias in Seasonal Forecast Model and ENSO Prediction Error. Sci. Rep. 7, 6029. doi:10.1038/s41598-017-05221-3
Liao, H., Wang, C., and Song, Z. (2021). ENSO Phase-Locking Biases from the CMIP5 to CMIP6 Models and a Possible Explanation. Deep Sea Res. Part Topical Stud. Oceanography 189-190, 104943. doi:10.1016/j.dsr2.2021.104943
Luo, J.-J., Yuan, C., Sasaki, W., Behera, S. K., Masumoto, Y., Yamagata, T., et al. (2016). “Current Status of Intraseasonal-Seasonal-To-Interannual Prediction of the Indo-pacific Climate,” in Indo-Pacific Climate Variability and Predictability. Editors S. Behera, and T. Yamagata (Singapore: The World Scientific Publisher), 63–107. doi:10.1142/9789814696623_0003
Qiao, F., Song, Z., Bao, Y., Song, Y., Shu, Q., Huang, C., et al. (2013). Development and Evaluation of an Earth System Model with Surface Gravity Waves. J. Geophys. Res. Oceans 118, 4514–4524. doi:10.1002/jgrc.20327.2013
Qiao, F., Yuan, Y., Ezer, T., Xia, C., Yang, Y., Lü, X., et al. (2010). A Three-Dimensional Surface Wave-Ocean Circulation Coupled Model and its Initial Testing. Ocean Dyn. 60 (5), 1339–1355. doi:10.1007/s10236-010-0326-y
Qiao, F., Yuan, Y., Yang, Y., Zheng, Q., Xia, C., and Ma, J. (2004). Wave-induced Mixing in the Upper Ocean: Distribution and Application to a Global Ocean Circulation Model. Geophys. Res. Lett. 31, a–n. doi:10.1029/2004GL019824
Ren, H.-L., Wu, Y., Bao, Q., Ma, J., Liu, C., Wan, J., et al. (2019). The China Multi-Model Ensemble Prediction System and its Application to Flood-Season Prediction in 2018. J. Meteorol. Res. 33 (3), 540–552. doi:10.1007/s13351-019-8154-6
Reynolds, R. W., Smith, T. M., Liu, C., Chelton, D. B., Casey, K. S., and Schlax, M. G. (2007). Daily High-Resolution-Blended Analyses for Sea Surface Temperature. J. Clim. 20 (22), 5473–5496. doi:10.1175/2007JCLI1824.1
Song, Y., Zhao, Y., Yin, X., Bao, Y., and Qiao, F. (2020). Evaluation of FIO-ESM v1.0 Seasonal Prediction Skills over the north Pacific. Front. Mar. Sci. 7. doi:10.3389/fmars.2020.00504
Song, Z., Shu, Q., Bao, Y., Yin, X., and Qiao, F. (2015). The Prediction on the 2015/16 El Niño Event from the Perspective of FIO-ESM. Acta Oceanol. Sin. 34 (12), 67–71. doi:10.1007/s13131-015-0787-4
Wyrtki, K. (1975). El Niño–The Dynamic Response of the Equatorial Pacific Ocean to Atmospheric Forcing. J. Phys. Oceanogr 5, 572–584. doi:10.1175/1520-0485(1975)005<0572:ENTDRO>2.0.CO;2
Zhang, S., Liu, Z., Zhang, X., Wu, X., Han, G., Zhao, Y., et al. (2020). Coupled Data Assimilation and Parameter Estimation in Coupled Ocean-Atmosphere Models: a Review. Clim. Dyn. 54 (9), 5127–5144. doi:10.1007/s00382-020-05275-6
Zhao, Y., Yin, X., Song, Y., and Qiao, F. (2019). Seasonal Prediction Skills of FIO-ESM for north pacific Sea Surface Temperature and Precipitation. Acta Oceanol. Sin. 38, 5–12. doi:10.1007/s13131-019-1366-x
Zheng, F., and Yu, J.-Y. (2017). Contrasting the Skills and Biases of Deterministic Predictions for the Two Types of El Niño. Adv. Atmos. Sci. 34 (12), 1395–1403. doi:10.1007/s00376-017-6324-y
Zheng, F., and Zhu, J. (2010). Coupled Assimilation for an Intermediated Coupled Enso Prediction Model. Ocean Dyn. 60 (5), 1061–1073. doi:10.1007/s10236-010-0307-1
Zheng, F., and Zhu, J. (2016). Improved Ensemble-Mean Forecasting of ENSO Events by a Zero-Mean Stochastic Error Model of an Intermediate Coupled Model. Clim. Dyn. 47 (12), 3901–3915. doi:10.1007/s00382-016-3048-0
Zheng, F., Zhu, J., and Zhang, R.-H. (2007). Impact of Altimetry Data on ENSO Ensemble Initializations and Predictions. Geophys. Res. Lett. 34, a–n. doi:10.1029/2007GL030451
Zheng, F., Zhu, J., Zhang, R.-H., and Zhou, G.-Q. (2006). Ensemble Hindcasts of SST Anomalies in the Tropical pacific Using an Intermediate Coupled Model. Geophys. Res. Lett. 33, L19604. doi:10.1029/2006GL026994
Zhou, T., Chen, Z., Zou, L., Chen, X., Yu, Y., Wang, B., et al. (2020). Development of Climate and Earth System Models in china: Past Achievements and New Cmip6 Results. J. Meteorol. Res. 34 (1), 1–19. doi:10.1007/s13351-020-9164-0
Keywords: short-term climate prediction system, seasonal prediction, ENSO, climate model, sea surface temperature, FIO-CPS
Citation: Song Y, Shu Q, Bao Y, Yang X and Song Z (2021) The Short-Term Climate Prediction System FIO-CPS v2.0 and its Prediction Skill in ENSO. Front. Earth Sci. 9:759339. doi: 10.3389/feart.2021.759339
Received: 16 August 2021; Accepted: 29 September 2021;
Published: 25 October 2021.
Edited by:
Ruihuang Xie, Ocean University of China, ChinaReviewed by:
Fei Zheng, Institute of Atmospheric Physics, Chinese Academy of Sciences (CAS), ChinaLibin Ma, Chinese Academy of Meteorological Sciences, China
Copyright © 2021 Song, Shu, Bao, Yang and Song. This is an open-access article distributed under the terms of the Creative Commons Attribution License (CC BY). The use, distribution or reproduction in other forums is permitted, provided the original author(s) and the copyright owner(s) are credited and that the original publication in this journal is cited, in accordance with accepted academic practice. No use, distribution or reproduction is permitted which does not comply with these terms.
*Correspondence: Zhenya Song, songroy@fio.org.cn