 Tom Vincent-Dospital
 Alain Steyer1
 François Renard
 Renaud Toussaint
94% of researchers rate our articles as excellent or good
Learn more about the work of our research integrity team to safeguard the quality of each article we publish.
Find out more
ORIGINAL RESEARCH article
Front. Earth Sci., 07 May 2021
Sec. Solid Earth Geophysics
Volume 9 - 2021 | https://doi.org/10.3389/feart.2021.627823
This article is part of the Research Topic3D Printing in Geology and Geophysics: A New World of Opportunities in Research, Outreach, and EducationView all 7 articles
The surface morphology of faults controls the spatial anisotropy of their frictional properties and hence their mechanical stability. Such anisotropy is only rarely studied in seismology models of fault slip, although it might be paramount to understand the seismic rupture in particular areas, notably where slip occurs in a direction different from that of the main striations of the fault. To quantify how the anisotropy of fault surfaces affects the friction coefficient during sliding, we sheared synthetic fault planes made of plaster of Paris. These fault planes were produced by 3D-printing real striated fault surfaces whose 3D roughness was measured in the field at spatial scales from millimeters to meters. Here, we show how the 3D-printing technology can help for the study of frictional slip. The results show that fault anisotropy controls the coefficient of static friction, with
Faults in the Earth’s crust are complex systems along which earthquakes nucleate and propagate [e.g., Wibberley et al. (2008)]. Faults hold structures and heterogeneities at all scales [Brown and Scholz (1985), Renard et al. (2006), Candela et al. (2012)]. While they are often simplified to their simplest two-dimensional description (i.e., the fault plane), increasing complexity is now added to faults models [e.g., Rice and Ben-Zion (1996)]. It is indeed considered that, to fully understand seismicity in various areas, it is paramount to account for some disorder in the faults frictional properties such as secondary faulting, off-fault damage or roughness of the fault plane [Pechmann and Kanamori (1982), Aochi and Ide (2009), Candela et al. (2011), Ando et al. (2012), Tesei et al. (2014), Allam et al. (2019), Bruhat et al. (2019), Sagy and Lyakhovsky (2019)]. For instance, the volume of damaged rocks, during the activation of a fault, depends on the initial contact roughness [Queener et al. (1965)] and, thus, a fault with a stronger roughness presents a different energy budget than a flat fault, as more energy is converted into surface area energy. In particular, roughness encourages the triggering of local events, but is believed to prevent the propagation of large-slip earthquakes [Bruhat et al. (2019)]. Additionally, large scale roughness tends to inhibit the propagation of any rupture faster than the shear wave velocity of surrounding rocks [Bouchon et al. (2010)].
Another degree of complexity is more rarely considered when modeling geological contacts and fault slip; the possible anisotropy in their frictional properties. Morphological anisotropy is a known feature of faults, notably impacting the seismic waves velocity in their vicinity [Evans (1984), Cochran et al. (2003); Li et al. (2015)] or the mobility of natural and injected fluids [Vadacca et al. (2018)] in the subsurface. Frictional anisotropy, interestingly, is also regularly studied in other fields than seismology, for instance the tribology of rubber tires [Carbone et al. (2009), Tiwari et al. (2016)], the strength of advanced adhesives Jin et al. (2012), or the mitigation of water condensation Pionnier et al. (2018). It is also considered to play a major role in nature Filippov and Gorb (2013), for instance in the motion of numerous animals [Zheng et al. (2007), Jin et al. (2012), Filippov et al. (2018)] and the hydration of some plants [Roth-Nebelsick et al. (2012), Wang F. et al. (2017)]. In most cases, frictional anisotropy derives from the existence of preferential topographical orientations on, at least, one of the contact surfaces [Yu and Wang (2012), Tapia et al. (2016)]. The length scale for such structural directivity can be as small as micrometer [Stupkiewicz et al. (2014)] to nanometer [Fessler et al. (2019), Gong et al. (2018)].
In seismic faults, such preferential orientations in their topography are observed at all scales [Renard et al. (2006), Candela et al. (2012), Brown and Scholz (1985)] and originate from several processes. At the molecular level, rock forming crystals may display some frictional anisotropy. It is notably the case for antigorite, a mineral abundant in the Earth’s upper mantle [Campione and Capitani (2013)]. At the mesoscopic scale, the shear strength of foliated rocks is known to be anisotropic, due to the oriented planes in their constitutive mineralogy [Shea and Kronenberg (1993), Rawling et al. (2002)]. Fault zones in sedimentary basins are initiated by early fractures that often propagate in layered sediments. It can result in an anisotropic ramp-flat morphology of these fracture surfaces [Peacock and Sanderson (1992)]. For more mature faults having accumulated enough displacement, and above a given length scale [Candela and Brodsky (2016)], the topography of the fault planes is also marked by slip induced wear, with striations and grooves of various wavelengths and amplitudes oriented along the main direction of slip [Engelder (1974); Edwards et al. (2018)]. If such morphological anisotropy of fault surfaces is well-known, its effect on the anisotropy of the frictional properties remains to be characterized. Such a characterization of frictional anisotropy could also be of interest for other types of rock contacts than strictly seismic faults, in particular for shallow rock joints and fractures, whose three-dimensional geometry is key in geotechnical engineering and for the structural stability of many man-made constructions [Barton and Choubey (1977), Seidel and Haberfield (1995), Grasselli and Egger (2003), Li et al. (2020)]. Here, we study how the morphology of faults controls the static coefficient of friction and the anisotropy of friction with regards to the main stress orientation during slip. To reach this goal, we produce 3D-prints of actual faults surfaces whose topography was measured in the field [Candela and Renard (2012)]. We perform friction experiments with plaster of Paris casts of these 3D-printed faults. Results show that the coefficient of static friction along faults is highly anisotropic, a property that should henceforward be considered in numerical models of slip on seismic faults. We also show that this anisotropy is stress-dependent and should decrease with depth [e.g., Byerlee (1978)].
The actual morphology of natural faults can be difficult to assess, even if their long wavelength structures can be inferred by surface or subsurface imaging techniques [Massonnet et al. (1993), Blakely et al. (2002), Edwards et al. (2018)]. Yet, some fault planes are accessible to direct high resolution measurements, notably as they were exhumed by erosion and tectonic processes. For this study, we have used a series of digital fault surfaces. These fault roughness data were acquired with Light Detection and Ranging (LiDAR), laboratory laser profilometry, or white light interferometry techniques [Candela et al. (2012)]. These data are available on an online public database [Candela and Renard (2012)] and in a repository with a DOI number [Renard (2020)]. Should the reader hold some similar data, these authors welcome additions to this database. We have specifically selected fault roughness measurements performed on the Corona Heights fault [Candela et al. (2011)] that outcrops near the Peixotto playground in San Francisco, California. These data cover surface areas with spatial scales in the range of millimeters to meters. Figures 1, 2 show the fault surface at two spatial scales, one surface at the meter scale, defined on a 5 mm × 5 mm grid, and one surface at the millimeter scale, defined on a 2 µm × 2 µm grid. We will further refer to these two surfaces as, respectively,
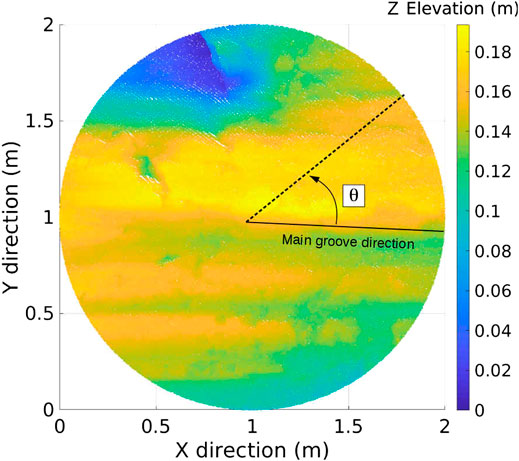
FIGURE 1. Topography (i.e., roughness) of the Corona Heights fault at the meter scale [Candela and Renard (2012), Renard (2020)]. This surface, called
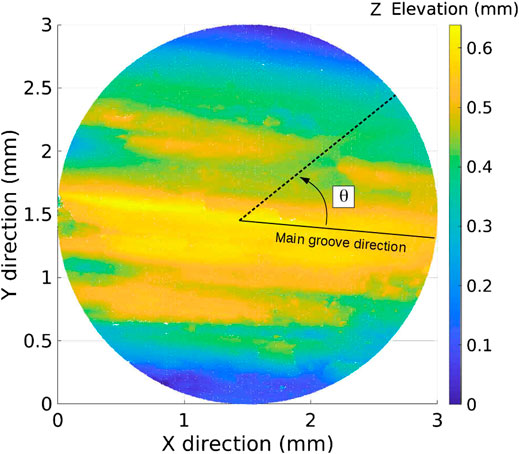
FIGURE 2. White light interferometry measurement of the topography of the Corona Heights fault plane at the millimeter scale [Candela and Renard (2012), Renard (2020)]. This surface, called
For our tests, we chose to limit these anisotropic surfaces to a circular sample geometry. We also applied a mild running-window median filter to smooth out spikes in the measured surfaces that could be associated to measurement noise. The window length of the filter was 10 space steps, accounting for 5 cm for
where
After having obtained the surfaces, we isotropically (i.e., with the same factor in all directions) down- or up-scaled
Although we could have performed the friction experiments with the plastic pieces produced with the 3D printer, we have rather produced samples of plaster of Paris (gypsum) blocks molded from the plastic faults. Plaster is known to be a reasonable model of porous brittle materials [Vekinis et al. (1993)], and the main goal of these casts was to work with a rock-like material, notably because plaster may wear and deform differently than plastic under shear. The fragile nature of plaster, and the potential friction-induced wear that the plaster was subjected to in our experiments, made us use new casts for each experimental realization. The casts were generated with the following protocol: five volumes of water and eight volumes of powder of plaster of Paris were mixed and poured over the plastic molds, then let to dry during one and half hour. The molds, an example of which is shown in Figure 3, were sprayed before each cast with a thin layer of silicon grease to avoid some of the fine plaster details to stick to the plastic during the mold release. The last step in the casts preparation was to dry them in an oven at a temperature of
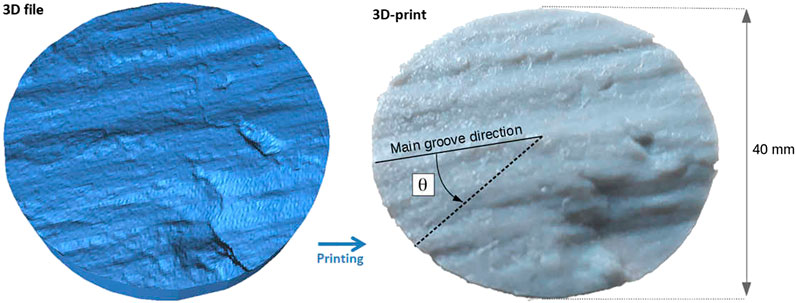
FIGURE 3. (Left) 3D file (STL file) obtained from the measured topography of the
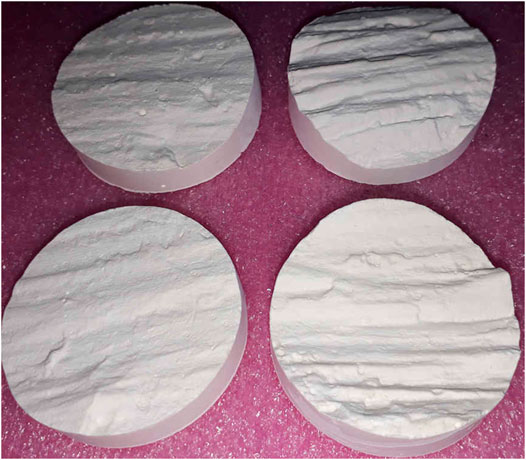
FIGURE 4. Plaster faults made using the 3D-printed molds (i.e., an example of which is shown in Figure 3). (Left)
The shear apparatus used to perform the friction tests is shown in Figure 5. The two complementary surfaces are pressed together and mounted one on top of the other between the clamps of the shear apparatus. A normal force
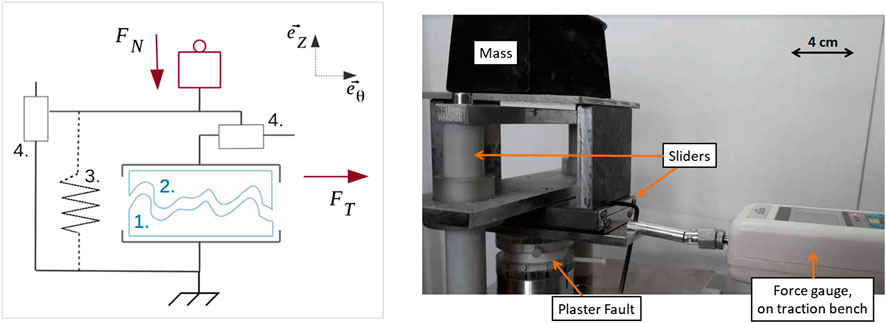
FIGURE 5. Schematic (left) and picture (right) of the shear apparatus. It contains the complementary plaster-casted fault surfaces (1 and 2) installed between two clamps; the compression spring (3) necessary to obtain a null normal loading when required (not mounted on the picture); and two horizontal and vertical sliders (4) used to force the motion in the direction of interest while allowing for vertical displacement. The shear force
The target speed of the test bench (that is, the demanded slip velocity) was fixed to a constant and equal to 1.3 mm s−1. Of course, such a velocity may be orders of magnitude above that of typical tectonic solicitations (for instance, an ultra-fast oceanic ridge may reach an opening rate of 10–20 cm yr−1 [Renard et al. (1985)]. Here, we define the static friction in the experiments as the peak shear stress reached before sliding occurs divided by the normal stress.
We characterize the anisotropy of this laboratory static friction coefficient for both the
where
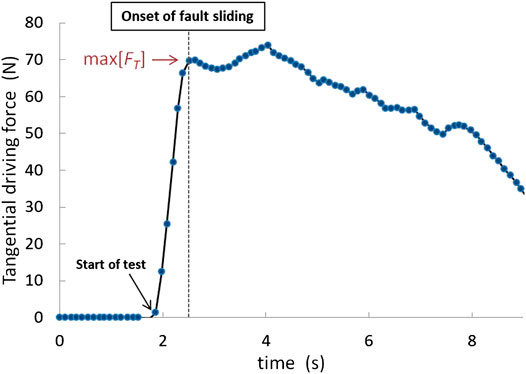
FIGURE 6. Typical tangential force vs. time for a given slide angle (
The results are presented in Figure 7. The derived coefficient of frictions are larger than 1, which does not come as a surprise due to the nonnegligible roughness of our fault samples. Indeed, a large part of the contact area is bound to be perpendicular to the demanded slip (in any direction), inducing a strong resistance to motion.
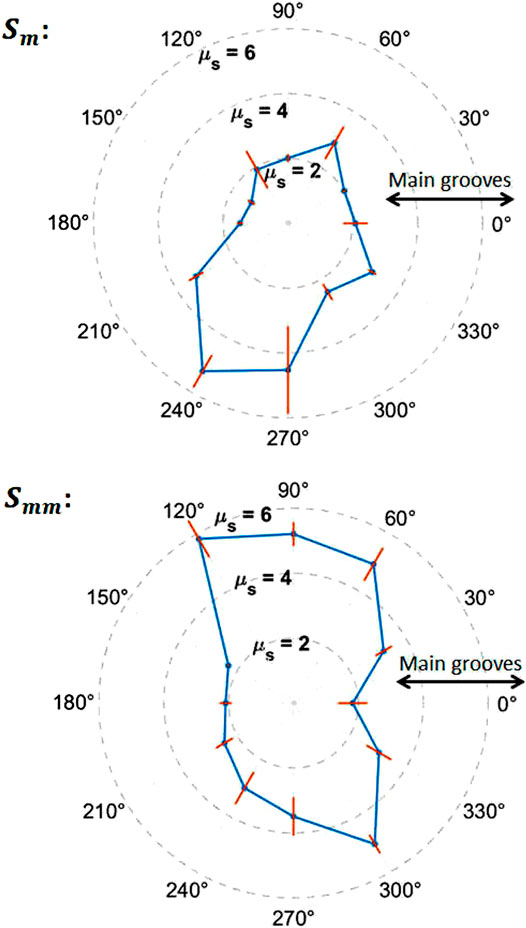
FIGURE 7. Coefficient of static friction of the
On both fault samples, one can observe the strong anisotropy of the coefficient of static friction, with the maximum value of
Most of our experiments were destructive, with visible wear on the plaster samples after the shearing tests. This wear was the main reason calling for the production of new plaster casts for each experimental realization, as we verified that repeating a same experiment with a previously used cast led to a significant (and here unwanted) drop in friction. The observed damage consists either in the formation of plaster powder (gouge) or in the rupture of topographic highs of the fault surfaces. Part of it might have initiated at the onset of the fault displacement (and hence be related to the static friction), while some of it has rather been induced by the subsequent sliding. Figure 8 shows some examples of these damage types.
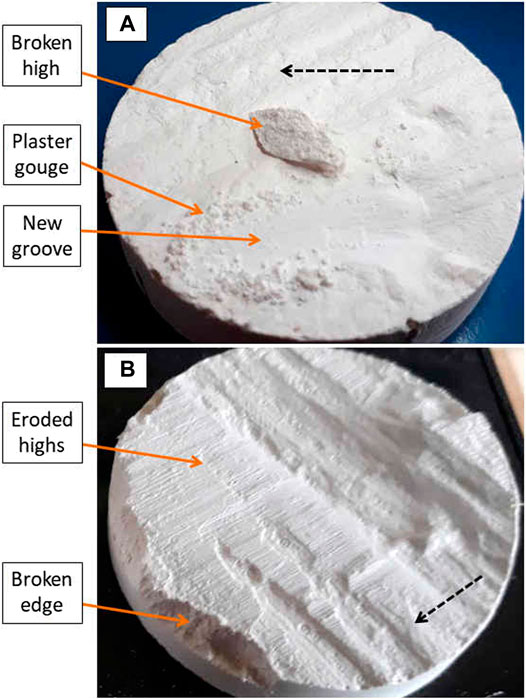
FIGURE 8. Various types of damage observed on the fault surfaces after the sliding tests. The dashed arrows show the slip directions of the complementary plaster casts during the tests. (A)
Wear of seismic faults has been studied [e.g., Wang and Scholz (1994); Kim et al. (2004)] to, in particular, better understand the energy budget of the deformation, but also because this process may lubricate faults during slip [e.g., Rempel and Rice (2006), Di Toro et al. (2011)] or modify the fault permeability to fluid flow [e.g., Blanpied et al. (1992), Mitchell and Faulkner (2008)]. The present study focuses on the measurement of the coefficient of static friction and on its anisotropy, but we suggest that our 3D-print–based set-up could also enable the quantitative characterization of damage during sliding along analog fault surfaces. We here keep to a qualitative assessment of which parts of the surfaces were mainly worn during each experiment. It seems that most of the shear resistance of the Corona Heights fault, at the millimeter scale (
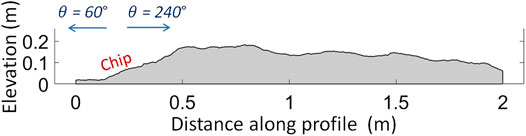
FIGURE 9. Elevation profile along the diameter of
Because the overall friction is likely to be affected by the surface wear, and because this wear is likely stress-dependent, we have performed some friction tests on
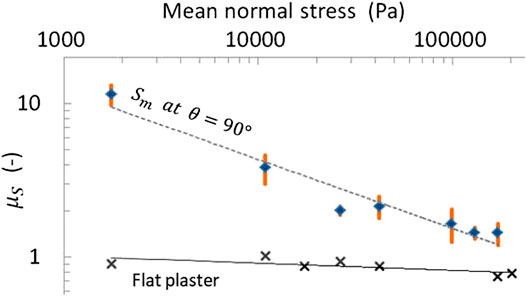
FIGURE 10. Coefficient of static friction
We have therefore assessed the effect of the normal stress
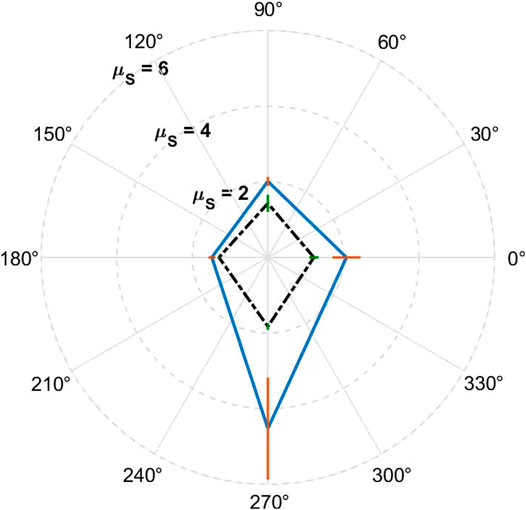
FIGURE 11. Coefficient of static friction
Here, we have shown how the multiscale anisotropy of fault plane topography leads to an anisotropy in the frictional properties. Results confirm that seismic faults are prone to slide along some preferential orientations. The orientation that is the most likely is the one that faults have previously slid along and which has shaped some guiding grooves in their morphology. Yet, displacements following other orientations are possible. Predicting the rupture direction of the next earthquake on a fault is thus not only dependent on assessing the main regional stress. The question should rather be along which orientation a rupture criterion [e.g., Bowden and Tabor (1951)] will first be exceeded. Such a subtlety might be of little importance for mature faults for which the stress principle orientations have not changed with time, because in this case, the main stress is likely to act along the lowest coefficient of friction anyway. Yet, it could be paramount for faults under a changing geological load, where this alignment is not verified, or for immature faults, where the slip could be mainly governed by the anisotropy of early surfaces (i.e., where the slip does not coincide with the stress principal orientation, but is nonassociated). Examples of slickensides (i.e., fault planes) commonly exist with several overlapping striations orientations [e.g., Cashman and Ellis (1994)], with rake and striations oblique to the actual orientation of the fault plane [e.g., Sagy and Hamiel (2017)]. These observations indicate that the original slip direction (if assumed to initiate the following Andersonian criterion) [Célérier (2008)] does not completely determine the direction of the next episode. Earthquakes occurring along abnormal directions (i.e., not in agreement with the local stress state) have been observed [e.g., Satake and Kanamori (1991), Célérier (2008), Avouac et al. (2014)], and their understanding might be eased by accounting for the possible frictional anisotropy of their surfaces [Bott (1959), Pollard et al. (1993)].
Note that frictional anisotropy should not only be considered at the full fault scale, but this property may spatially vary along the fault walls. Analytical solutions demonstrate that the stress around a fault is perturbed by its roughness, and a local slip can occur much before the entire fault is under yielding conditions in a given direction [Sagy and Lyakhovsky (2019)]. While we have here only measured the static coefficient of friction, we suggest that similar studies could be performed to characterize the anisotropy of the coefficient of dynamic friction (i.e., by analyzing the evolution of the resistance to motion, after the plaster faults start moving, as a function of the sliding orientation). Hence, not only the initial slip direction of an earthquake could be impacted by frictional anisotropy, but the complete slip trajectory [Tapia et al. (2016)]. Changes in the slip direction within single earthquake rupture events are indeed sometimes observed, notably from bent grooves on postmortem fault walls [Otsubo et al. (2013)]. We have, additionally, measured how the anisotropy in friction becomes less significant when the normal stress acting on a fault increases (i.e., with the fault depth), in general agreement with Byerlee’s law [Byerlee (1978)]. Such an effect likely derives from the stress-related changes in rupture rheology and in damage type. The transition from a highly anisotropic to a relatively isotropic regime should typically occur when local stresses on the fault reach the yield strength of the material,
Additionally to the assessment of the stability of (at least) shallow seismic faults, the characterization of the frictional anisotropy of rock surfaces may be of importance in geotechnical engineering, for instance, for the stability of tunnels and foundations. There, the intrinsic strength anisotropy of foliated rocks is well-studied [Shea and Kronenberg (1993), Rawling et al. (2002)]. Our work shows how one can also characterize the mechanical anisotropy of rough rock contacts, for instance, along joints [Barton and Choubey (1977), Seidel and Haberfield (1995), Grasselli and Egger (2003), Li et al. (2020)] and fractures [Ponson et al. (2006a), Ponson et al. (2000b)] between or inside rock formations.
A main point of this manuscript is, finally, to illustrate how the 3D-printing technology can help with new experimental designs in Earth Sciences, and this technology is getting a growing attention from the community [Wang L. et al. (2017), Squelch (2017), Wang et al. (2018), Feng et al. (2019), Braun et al. (2020)], including the study of the frictional properties of 3D-printed fault analogs [Braun et al. (2020)]. A direct continuation of the present work, for instance, could be to 3D-print and to test some faults surfaces beforehand filtered with various band-pass filters, in order to understand how the various wavelengths of the topography contribute to the global static friction coefficient, to the dynamical friction coefficient and to analyze the spatial distribution of the fault wear produced under various stresses and amounts of slip.
The original contributions presented in the study are included in the article/Supplementary Material; further inquiries can be directed to the corresponding authors.
RT proposed the guidelines of this work, AS built the test machine and, with TV-D, printed the faults and performed the friction experiments. FR advised on the mechanics of seismic faults. TV-D wrote the first version of this manuscript and all authors contributed to the writing of its final version.
We acknowledge the support of the University of Strasbourg, of the IRP France–Norway D-FFRACT, and of SFF Porelab (project number 262644 of the Research Council of Norway). Readers are welcome to comment and correspondence should be addressed to dG9tLnZpbmNlbnQtZG9zcGl0YWxAZnlzLnVpby5uby4= or cmVuYXVkLnRvdXNzYWludEB1bmlzdHJhLmZy.
The authors declare that the research was conducted in the absence of any commercial or financial relationships that could be construed as a potential conflict of interest.
We are grateful for the early experimental explorations performed by Marine-Sophie Jacob, Céline Fliedner, Aldo Mellado Aguilar, Gaëtan Leca, and Laifa Rahmi, students from the EOST/IPGS faculty at the University of Strasbourg. We also thank Amir Sagy from the Geological Survey of Israel for fruitful discussions. We thank the Strasbourg AV.Lab association for letting us use their 3D printer.
The Supplementary Material for this article can be found online at: https://www.frontiersin.org/articles/10.3389/feart.2021.627823/full#supplementary-material
Allam, A. A., Kroll, K. A., Milliner, C. W. D., and Richards‐Dinger, K. B. (2019). Effects of fault roughness on coseismic slip and earthquake locations. J. Geophys. Res. Solid Earth 124 (11), 11336–11349. doi:10.1029/2018JB016216
Ando, R., Takeda, N., and Yamashita, T. (2012). Propagation dynamics of seismic and aseismic slip governed by fault heterogeneity and Newtonian rheology. J. Geophys. Res. 117 (B11), 11308. doi:10.1029/2012JB009532
Aochi, H., and Ide, S. (2009). Complexity in earthquake sequences controlled by multiscale heterogeneity in fault fracture energy. J. Geophys. Res. 114 (B3). doi:10.1029/2008JB006034
Avouac, J.-P., Ayoub, F., Wei, S., Ampuero, J.-P., Meng, L., Leprince, S., et al. (2014). The 2013, Mw 7.7 Balochistan earthquake, energetic strike-slip reactivation of a thrust fault. Earth Planet. Sci. Lett. 391, 128–134. doi:10.1016/j.epsl.2014.01.036
Barton, N., and Choubey, V. (1977). The shear strength of rock joints in theory and practice. Rock Mech. 10, 1–54. doi:10.1007/BF01261801
Ben-David, O., and Fineberg, J. (2011). Static friction coefficient is not a material constant. Phys. Rev. Lett. 106, 254301. doi:10.1103/PhysRevLett.106.254301
Blakely, R. J., Wells, R. E., Weaver, C. S., and Johnson, S. Y. (2002). Location, structure, and seismicity of the Seattle fault zone, Washington: evidence from aeromagnetic anomalies, geologic mapping, and seismic-reflection data. GSA Bull. 114 (2), 169–177. doi:10.1130/0016-7606(2002)114¡0169:LSASOT¿2.0.CO;2
Blanpied, M. L., Lockner, D. A., and Byerlee, J. D. (1992). An earthquake mechanism based on rapid sealing of faults. Nature 358, 574–576. doi:10.1038/358574a0
Bott, M. H. P. (1959). The mechanics of oblique slip faulting. Geol. Mag. 96 (2), 109–117. doi:10.1017/S0016756800059987
Bouchon, M., Karabulut, H., Bouin, M.-P., Schmittbuhl, J., Vallée, M., Archuleta, R., et al. (2010). Faulting characteristics of supershear earthquakes. Tectonophysics 493 (3), 244–253. doi:10.1016/j.tecto.2010.06.011
Bowden, F. P., and Tabor, D. (1951). The friction and lubrication of solids. Am. J. Phys. 19 (7), 428–429. doi:10.1119/1.1933017
Brady, B. T., Duvall, W. I., and Horino, F. G. (1993). An experimental determination of the true uniaxial stress-strain behavior of brittle rock. Rock Mech. 5, 107–120. doi:10.1007/BF01240161
Braun, P., Tzortzopoulos, G., and Stefanou, I. (2020). Design of sand-based, 3d-printed analogue faults with controlled frictional properties. J. Geophys. Res. [preprint]. doi:10.1002/essoar.10503633.1
Brodsky, E. E., Kirkpatrick, J. D., and Candela, T. (2016). Constraints from fault roughness on the scale-dependent strength of rocks. Geology 44 (1), 19–22. doi:10.1130/G37206.1
Brown, S. R., and Scholz, C. H. (1985). Broad bandwidth study of the topography of natural rock surfaces. J. Geophys. Res. 90 (B14), 12575–12582. doi:10.1029/JB090iB14p12575
Bruhat, L., Klinger, Y., Vallage, A., and Dunham, E. M. (2019). Influence of fault roughness on surface displacement: from numerical simulations to coseismic slip distributions. Geophys. J. Int. 220 (3), 1857–1877. doi:10.1093/gji/ggz545
Campione, M., and Capitani, G. C. (2013). Subduction-zone earthquake complexity related to frictional anisotropy in antigorite. Nat. Geosci. 6, 847–851. doi:10.1038/ngeo1905
Candela, T., and Brodsky, E. E. (2016). The minimum scale of grooving on faults. Geology 44 (8), 603–606. doi:10.1130/G37934.1
Candela, T., and Renard, F. (2012). Fault morphology database. Available at: https://www.isterre.fr/french/recherche-observation/equipes/mecanique-des-failles/moyens-et-outils/article/donnees.html (Accessed 2020).
Candela, T., Renard, F., Schmittbuhl, J., Bouchon, M., and Brodsky, E. E. (2011). Fault slip distribution and fault roughness. Geophys. J. Int. 187 (2), 959–968. doi:10.1111/j.1365-246X.2011.05189.x
Candela, T., Renard, F., Klinger, Y., Mair, K., Schmittbuhl, J., and Brodsky, E. E. (2012). Roughness of fault surfaces over nine decades of length scales. J. Geophys. Res. 117 (B8), B08409. doi:10.1029/2011JB009041
Carbone, G., Lorenz, B., Persson, B. N. J., and Wohlers, A. (2009). Contact mechanics and rubber friction for randomly rough surfaces with anisotropic statistical properties. Eur. Phys. J. 29 (3), 275–284. doi:10.1140/epje/i2009-10484-8
Cashman, P. H., and Ellis, M. A. (1994). Fault interaction may generate multiple slip vectors on a single fault surface. Geology 22 (12), 1123–1126. doi:10.1130/0091-7613(1994)022¡1123:FIMGMS¿2.3.CO;2
Célérier, B. (2008). Seeking Anderson's faulting in seismicity: a centennial celebration. Rev. Geophys. 46 (4). doi:10.1029/2007RG000240
Cochran, E. S., Vidale, J. E., and Li, Y.-G. (2003). Near-fault anisotropy following the Hector Mine earthquake. J. Geophys. Res. 108 (B9) 2436. doi:10.1029/2002JB002352
Di Toro, G., Han, R., Hirose, T., De Paola, N., Nielsen, S., Mizoguchi, K., et al. (2011). Fault lubrication during earthquakes. Nature 471, 494–498. doi:10.1038/nature09838
Edwards, J. H., Kluesner, J. W., Silver, E. A., Brodsky, E. E., Brothers, D. S., Bangs, N. L., et al. (2018). Corrugated megathrust revealed offshore from Costa Rica. Nat. Geosci. 11, 197–202. doi:10.1038/s41561-018-0061-4
Engelder, J. T. (1974). Microscopic wear grooves on slickensides: indicators of paleoseismicity. J. Geophys. Res. 79 (29), 4387–4392. doi:10.1029/JB079i029p04387
Evans, R. (1984). Anisotropy: a pervasive feature of fault zones? Geophys. J. Int. 76 (1), 157–163. doi:10.1111/j.1365-246X.1984.tb05031.x
Feng, X.-T., Gong, Y.-H., Zhou, Y.-Y., Li, Z.-W., and Liu, X.-F. (2019). The 3D-printing technology of geological models using rock-like materials. Rock Mech. Rock Eng. 52, 2261–2277. doi:10.1007/s00603-018-1703-y
Fessler, G., Sadeghi, A., Glatzel, T., Goedecker, S., and Meyer, E. (2019). Atomic friction: anisotropy and asymmetry effects. Tribol. Lett. 67 (2), 59. doi:10.1007/s11249-019-1172-9
Filippov, A., and Gorb, S. N. (2013). Frictional-anisotropy-based systems in biology: structural diversity and numerical model. Sci. Rep. 3, 1240. doi:10.1038/srep01240
Filippov, A. E., Westhoff, G., Kovalev, A., and Gorb, S. N. (2018). Numerical model of the slithering snake locomotion based on the friction anisotropy of the ventral skin. Tribol. Lett. 66. doi:10.1007/s11249-018-1072-4
Gong, H., Zhu, P., Si, L., Zhang, X., and Xie, G. (2018). “M-shape” nanoscale friction anisotropy of phosphorene. Comput. Mater. Sci. 150, 364–368. doi:10.1016/j.commatsci.2018.04.013
Grasselli, G., and Egger, P. (2003). Constitutive law for the shear strength of rock joints based on three-dimensional surface parameters. Int. J. Rock Mech. Mining Sci. 40 (1), 25–40. doi:10.1016/S1365-1609(02)00101-6
Hanaor, D. A. H., Gan, Y., and Einav, I. (2016). Static friction at fractal interfaces. Tribol. Int. 93, 229–238. doi:10.1016/j.triboint.2015.09.016
Jin, K., Tian, Y., Erickson, J. S., Puthoff, J., Autumn, K., and Pesika, N. S. (2012). Design and fabrication of gecko-inspired adhesives. Langmuir 28, 5737–5742. doi:10.1021/la204040p
Kim, Y.-S., Peacock, D. C. P., and Sanderson, D. J. (2004). Fault damage zones. J. Struct. Geology 26 (3), 503–517. doi:10.1016/j.jsg.2003.08.002
Li, Z., Peng, Z., Ben‐Zion, Y., and Vernon, F. L. (2015). Spatial variations of shear wave anisotropy near the San Jacinto fault zone in Southern California. J. Geophys. Res. Solid Earth 120 (12), 8334–8347. doi:10.1002/2015JB012483
Li, Y., Tang, C. A., Li, D., and Wu, C. (2020). A new Shear strength criterion of three-dimensional rock joints. Rock Mech. Rock Eng. 53, 1477–1483. doi:10.1007/s00603-019-01976-5
Massonnet, D., Rossi, M., Carmona, C., Adragna, F., Peltzer, G., Feigl, K., et al. (1993). The displacement field of the Landers earthquake mapped by radar interferometry. Nature 364, 138–142. doi:10.1038/364138a0
Mitchell, T. M., and Faulkner, D. R. (2008). Experimental measurements of permeability evolution during triaxial compression of initially intact crystalline rocks and implications for fluid flow in fault zones. J. Geophys. Res. 113 (B11). doi:10.1029/2008JB005588
Otsubo, M., Shigematsu, N., Imanishi, K., Ando, R., Takahashi, M., and Azuma, T. (2013). Temporal slip change based on curved slickenlines on fault scarps along Itozawa fault caused by 2011 Iwaki earthquake, Northeast Japan. Tectonophysics 608, 970–979. doi:10.1016/j.tecto.2013.07.022
Peacock, D. C. P., and Sanderson, D. J. (1992). Effects of layering and anisotropy on fault geometry. J. Geol. Soc. 149 (5), 793–802. doi:10.1144/gsjgs.149.5.0793
Pechmann, J. C., and Kanamori, H. (1982). Waveforms and spectra of preshocks and aftershocks of the 1979 imperial valley, california, earthquake: evidence for fault heterogeneity? J. Geophys. Res. 87 (B13), 10579–10597. doi:10.1029/JB087iB13p10579
Pionnier, N., Vera, J., Contraires, E., Benayoun, S., Berger, R., and Valette, S. (2018). The effect of the orientation and the height of periodic sub-micrometric texturing on dropwise condensation. J. Colloid Interf. Sci. 526, 184–193. doi:10.1016/j.jcis.2018.04.043
Pollard, D. D., Saltzer, S. D., and Rubin, A. M. (1993). Stress inversion methods: are they based on faulty assumptions? J. Struct. Geol. 15 (8), 1045–1054. doi:10.1016/0191-8141(93)90176-B
Ponson, L., Bonamy, D., Auradou, H., Mourot, G., Morel, S., Bouchaud, E., et al. (2006a). Anisotropic self-affine properties of experimental fracture surfaces. Int. J. Fract. 140, 27–37. doi:10.1007/s10704-005-3059-z
Ponson, L., Bonamy, D., and Bouchaud, E. (2006b). Two-dimensional scaling properties of experimental fracture surfaces. Phys. Rev. Lett. 96, 035506. doi:10.1103/PhysRevLett.96.035506
Queener, C. A., Smith, T. C., and Mitchell, W. L. (1965). Transient wear of machine parts. Wear 8 (5), 391–400. doi:10.1016/0043-1648(65)90170-5
Quinsat, Y., Lartigue, C., Brown, C. A., and Hattali, L. (2018). Characterization of surface topography of 3d printed parts by multi-scale analysis. Int. J. Interact Des. Manuf. 12 (3), 1007–1014. doi:10.1007/s12008-017-0433-9
Rawling, G. C., Baud, P., and Wong, T.-F. (2002). Dilatancy, brittle strength, and anisotropy of foliated rocks: experimental deformation and micromechanical modeling. J. Geophys. Res. 107 (B10), 8–1. doi:10.1029/2001JB000472
Rempel, A. W., and Rice, J. R. (2006). Thermal pressurization and onset of melting in fault zones. J. Geophys. Res. 111 (B9). doi:10.1029/2006JB004314
Renard, V., Hekinian, R., Francheteau, J., Ballard, R. D., and Backer, H. (1985). Submersible observations at the axis of the ultra-fast-spreading East Pacific rise (17°30′ to 21°30′S). Earth Planet. Sci. Lett. 75 (4), 339–353. doi:10.1016/0012-821X(85)90178-5
Renard, F., Voisin, C., Marsan, D., and Schmittbuhl, J. (2006). High resolution 3d laser scanner measurements of a strike-slip fault quantify its morphological anisotropy at all scales. Geophys. Res. Lett. 33 (4). doi:10.1029/2005GL025038
Renard, F. (2020). Data From: Frictional anisotropy of 3D-printed fault surfaces. Fault roughness data. https://dx.doi.org/10.3389/feart.2021.627823.
Rice, J. R., and Ben-Zion, Y. (1996). Slip complexity in earthquake fault models. Proc. Natl. Acad. Sci. 93 (9), 3811–3818. doi:10.1073/pnas.93.9.3811
Roth-Nebelsick, A., Ebner, M., Miranda, T., Gottschalk, V., Voigt, D., Gorb, S., et al. (2012). Leaf surface structures enable the endemic Namib desert grass Stipagrostis sabulicola to irrigate itself with fog water. J. R. Soc. Interf. 9 (73), 1965–1974. doi:10.1098/rsif.2011.0847
Sagy, A., and Hamiel, Y. (2017). Three-dimensional structure and evolution of an asymmetric pull-apart basin. Int. J. Earth Sci. (Geol. Rundsch) 106, 1619–1630. doi:10.1007/s00531-016-1374-4
Sagy, A., and Lyakhovsky, V. (2019). Stress patterns and failure around rough interlocked fault surface. J. Geophys. Res. Solid Earth 124 (7), 7138–7154. doi:10.1029/2018JB017006
Satake, K., and Kanamori, H. (1991). Abnormal tsunamis caused by the June 13, 1984, Torishima, Japan, earthquake. J. Geophys. Res. 96 (B12), 19933–19939. doi:10.1029/91JB01903
Sauter FH-S. (2018). Technical information. Technical report, Sauter. Available at: https://dok.kern-sohn.com/manuals/files/English/FH-S-BA-e-1819.pdf (Accessed 2020).
Seidel, J. P., and Haberfield, C. M. (1995). The application of energy principles to the determination of the sliding resistance of rock joints. Rock Mech. Rock Eng. 28, 211–226. doi:10.1007/BF01020227
Shea, W. T., and Kronenberg, A. K. (1993). Strength and anisotropy of foliated rocks with varied mica contents. J. Struct. Geol. 15 (9), 1097–1121. doi:10.1016/0191-8141(93)90158-7
Squelch, A. (2017). 3D printing rocks for geo-educational, technical, and hobbyist pursuits. Geosphere 14 (1), 360–366. doi:10.1130/GES01364.1
Stupkiewicz, S., Lewandowski, M. J., and Lengiewicz, J. (2014). Micromechanical analysis of friction anisotropy in rough elastic contacts. Int. J. Sol. Struct. 51 (23), 3931–3943. doi:10.1016/j.ijsolstr.2014.07.013
Tapia, F., Tourneau, D. L., and Géminard, J.-C. (2016). Anisotropic friction: assessment of force components and resulting trajectories. EPJ Techn. Instrum. 3, 1. doi:10.1140/epjti/s40485-016-0029-y
Tesei, T., Collettini, C., Barchi, M. R., Carpenter, B. M., and Di Stefano, G. (2014). Heterogeneous strength and fault zone complexity of carbonate-bearing thrusts with possible implications for seismicity. Earth Planet. Sci. Lett. 408, 307–318. doi:10.1016/j.epsl.2014.10.021
Tiwari, A., Dorogin, L., Steenwyk, B., Warhadpande, A., Motamedi, M., Fortunato, G., et al. (2016). Rubber friction directional asymmetry. Epl 116 (6), 66002. doi:10.1209/0295-5075/116/66002
Ultimaker2 Extended+. (2015). Technical information. Technical report, Ultimaker. Available at: https://ultimaker.com/download/7386/UserManual-UM2Extended-v2.1.pdf (Accessed 2020).
Vadacca, L., Colciago, C. M., Micheletti, S., and Scotti, A. (2018). Effects of the anisotropy of the fault zone permeability on the timing of triggered earthquakes: insights from 3d-coupled fluid flow and geomechanical deformation modeling. Pure Appl. Geophys. 175 (12), 4131–4144. doi:10.1007/s00024-018-1936-4
Vekinis, G., Ashby, M. F., and Beaumont, P. W. R. (1993). Plaster of Paris as a model material for brittle porous solids. J. Mater. Sci. 28, 3221–3227. doi:10.1007/BF00354239
Wang, W., and Scholz, C. H. (1994). Wear processes during frictional sliding of rock: a theoretical and experimental study. J. Geophys. Res. 99 (B4), 6789–6799. doi:10.1029/93JB02875
Wang, F., Wang, L., Wu, H., Pang, J., Gu, D., and Li, S. (2017a). A lotus-leaf-like sio2 superhydrophobic bamboo surface based on soft lithography. Colloids Surf. A Physicochem. Eng. Asp. 520, 834–840. doi:10.1016/j.colsurfa.2017.02.043
Wang, L., Ju, Y., Xie, H., Ma, G., Mao, L., and He, K. (2017b). The mechanical and photoelastic properties of 3D printable stress-visualized materials. Sci. Rep. 7. doi:10.1038/s41598-017-11433-4
Wang, J., Stewart, R. R., and Dyaur, N. I. (2018). Seismic response analysis of a 3D-printed dual-porosity physical model: Marine case. SEG, 301–305. doi:10.1190/segam2018-2997200.1
Wibberley, C. A. J., Yielding, G., and Di Toro, G. (2008). Recent advances in the understanding of fault zone internal structure: a review. Geol. Soc. Lond. Spec. Publ. 299 (1), 5–33. doi:10.1144/SP299.2
Yu, C., and Wang, Q. J. (2012). Friction anisotropy with respect to topographic orientation. Sci. Rep. 2, 988. doi:10.1038/srep00988
Keywords: friction, anisotropy, seismic faults, 3D printing, plaster 3D model, frictional damages
Citation: Vincent-Dospital T, Steyer A, Renard F and Toussaint R (2021) Frictional Anisotropy of 3D-Printed Fault Surfaces. Front. Earth Sci. 9:627823. doi: 10.3389/feart.2021.627823
Received: 10 November 2020; Accepted: 05 January 2021;
Published: 07 May 2021.
Edited by:
Takashi Nakagawa, Kobe University, JapanReviewed by:
Shengji Wei, Nanyang Technological University, SingaporeCopyright © 2021 Vincent-Dospital, Steyer, Renard and Toussaint. This is an open-access article distributed under the terms of the Creative Commons Attribution License (CC BY). The use, distribution or reproduction in other forums is permitted, provided the original author(s) and the copyright owner(s) are credited and that the original publication in this journal is cited, in accordance with accepted academic practice. No use, distribution or reproduction is permitted which does not comply with these terms.
*Correspondence: Tom Vincent-Dospital, dG9tLnZpbmNlbnQtZG9zcGl0YWxAZnlzLnVpby5ubw==; Renaud Toussaint, cmVuYXVkLnRvdXNzYWludEB1bmlzdHJhLmZy
Disclaimer: All claims expressed in this article are solely those of the authors and do not necessarily represent those of their affiliated organizations, or those of the publisher, the editors and the reviewers. Any product that may be evaluated in this article or claim that may be made by its manufacturer is not guaranteed or endorsed by the publisher.
Research integrity at Frontiers
Learn more about the work of our research integrity team to safeguard the quality of each article we publish.