 Giuseppe Esposito
 Fabio Matano
 Germana Scepi2
95% of researchers rate our articles as excellent or good
Learn more about the work of our research integrity team to safeguard the quality of each article we publish.
Find out more
ORIGINAL RESEARCH article
Front. Earth Sci. , 08 June 2018
Sec. Quaternary Science, Geomorphology and Paleoenvironment
Volume 6 - 2018 | https://doi.org/10.3389/feart.2018.00063
This article is part of the Research Topic Landslide Hazard in a Changing Environment View all 9 articles
Climate change is affecting the frequency and severity of extreme meteorological and geo-hydrological events hitting the coastal zone of the Campi Flegrei volcanic district (southern Italy), which is prone to a wide spectrum of natural hazards, including volcanism, earthquakes, ground deformation, flash floods, landslides, and coastal erosion. This study documents the trend of flash floods affecting the town of Pozzuoli, located along the coastline of the Campi Flegrei volcanic area, during the 1970–2014 time period. An archive research together with the collection of data published on news websites and social media allowed understanding of the triggering and evolution mechanisms of flash floods in the area, as well as the most recurrent damages. Rainfall data collected by the rain gauge located within the Pozzuoli watershed were also analyzed. Results of this study show an increased frequency of flash flood events occurred in the study area. The variation in flash flood frequency is likely not related to urbanization changes, as no increase of the urban area occurred after the year 2000. The observed increase of flash flood events in recent years (2000–2014) can be reasonably ascribed to variations in the rainfall regime. Our research provides a contribution for the understanding of flash flood processes in the study area as well as relevant information for hazard and risk assessment.
Changes in extreme weather and climate events, including an increase in warm temperature extremes and an increase in the number of heavy precipitation events, have been observed since about 1950 in many regions worldwide (IPCC, 2014). Specifically, changes in precipitation regimes are modifying the magnitude, frequency, and timing of floods at both regional and local scales. Blöschl et al. (2017), for example, evaluated a shift in the timing of river floods in Europe, during the past 50 years, as well as Diakakis (2014) observed in recent decades an increase in flood frequency associated with increases in extreme daily precipitation around Athens (Greece).
Extreme floods and flash floods are the most frequent and among the costliest and deadliest natural disasters worldwide (Gaume et al., 2016). In the Mediterranean area, coastal sectors of the central-western countries (e.g., France, Italy, Spain) result the most exposed to high impact and high magnitude events because of climatic and topographic conditions (Llasat et al., 2010; Tarolli et al., 2012; Gaume et al., 2016). Here, floods result frequently in fatalities and significant economic losses due to the high concentration of urban settlements and population.
The Italian coasts were recurrently affected by flash floods in the last years, especially during the late summer-autumn period. The latest event occurred on September 10, 2017 and hit the urban area of Livorno, a port city located along the Tuscan coastline. Such event was triggered by a quasi-stationary mesoscale convective system (MCS) characterized by a V-shaped plume, which released about 230 mm of rain in 3 h (Regione Toscana, 2017). During this flood, eight people died. Previously, other deadly events affected urban areas widespread along the Italian coasts, such as the major flash floods occurred in 2000 in Calabria (13 deaths—Federico et al., 2003; Montani et al., 2003), 2009 in Siciliy (38 deaths—Aronica et al., 2012), 2011 in Tuscany and Liguria (19 deaths—Cevasco et al., 2012; Silvestro et al., 2012; Faccini et al., 2015). These and other events, also affecting inland areas of Italy, may be correlated with a general tendency toward a decrease in the number of rainy days, and an increase in the frequency of high-intensity precipitation events. According to Brunetti et al. (2004), these trends were observed since the end of the nineteenth century and resulted amplified in the last decades.
Ducrocq et al. (2014) mostly relate the occurrence of heavy precipitation events in the Mediterranean region to the MCSs development. Most of these systems occur in the autumn season (September to November), when the Mediterranean Sea is still relatively warm with high evaporation rates (Mariotti et al., 2002). The warm sea surface temperatures increase air-sea surface heat fluxes, which in turn moisten and destabilize the marine atmospheric boundary layer (Ducrocq et al., 2014). The warm and moist low-level air flows that impact with reliefs surrounding the Mediterranean Sea are then uplifted, initiating a cycle of condensation and convection processes that can be renewed at the same location for hours, as long as the flux of low-level moisture remains intact (Ducrocq et al., 2014). In addition, flash floods can be also triggered by short-lived convective cells with a limited areal extent (typically <100 km2), or by occasional heavy rainfall developing within large-scale perturbations lasting several days (Gaume et al., 2016).
Location and magnitude of flash floods are influenced by rainfall properties (i.e., spatial extent, duration, intensity), as well as by topography, land use, soil types, and the initial soil moisture content of the affected watersheds (Hapuarachchi et al., 2011). In many regions, natural watersheds underwent massive urbanization associated to strong modification of local drainage patterns. The permeable soils were replaced with impermeable surfaces such as roads, roofs, parking lots, and sidewalks, reducing infiltration of water into the ground and accelerating the runoff rates (Konrad, 2003). These modifications increased both likelihood of flash floods and risk conditions. In spite of this, people living in flood or landslide prone areas are expected to increase in the coming years because of population growth and urban development (United Nations, 2011). On the other side, the globally averaged surface temperature is also projected to rise over the twenty-first century under all assessed emission scenarios (IPCC, 2014). For these reasons, it is very likely that the climate change-related effects, such as extreme floods, flash floods, and rapid-moving landslides (e.g., soil slips, debris flows, rock falls) will occur more often, potentially leading to loss of human life and economic damages.
In this work, we have analyzed the historical frequency of flash flood events affecting the urban area of Pozzuoli, a densely populated town located near Naples in southern Italy (Figure 1). In a previous paper (Esposito et al., 2015), we described the flash flood event that hit the Pozzuoli town on November 6, 2011, by analyzing meteorological conditions, rainfall properties, ground effects and results obtained by simulating the flow propagation. The new research presented in this paper is aimed at verifying the eventual increase of flash flood events in the 1970–2014 time interval and related causes, as well as at characterizing the flash flood-triggering rainfall properties. The work wants also give a valuable contribution to the more wide research topic concerning the identification of an increasing trend in the frequency of extreme floods in the central Mediterranean region under the current climate change scenario.
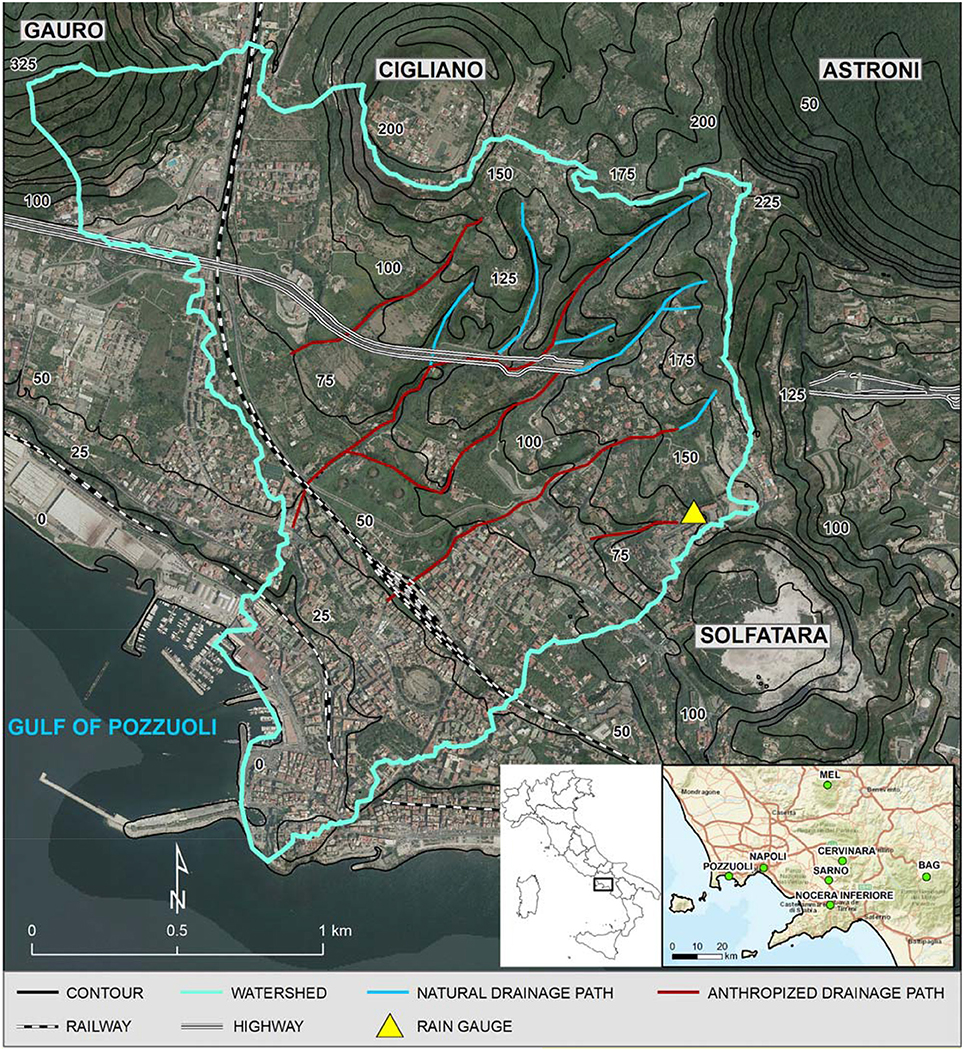
Figure 1. Aerial view and location of the Pozzuoli town within the Campania Region, southern Italy. The most important infrastructures and position of the rain gauge are also indicated. The contour interval is 25 m.
Pozzuoli is the most important town of the Campi Flegrei volcanic area, located in the western sector of the wide urban area of Naples (Italy). Very important roman monuments such as amphitheater Flavius and Temple of Serapis are present in the historical town center of Pozzuoli. More than 81,000 people inhabit this territory, with a population density of about 1,800 inhabitants per square kilometer. The town center is located along the coastline, and spreads out over the surface of four volcanic edifices formed during the past explosive activity of the still active Campi Flegrei caldera (e.g., Di Vito et al., 1999): Astroni, Cigliano, Gauro, and Solfatara (Figure 1). These cones extend from the sea level to an altitude of 325 m a.s.l. Since historical times, slope instability processes including shallow landslides and rock falls involved the volcanic slopes, as well as sediment-laden flows (hyperconcentrated flows and streamflows - Pierson and Costa, 1987), affected the drainage network near the coastline. Nevertheless, only a few studies related to geo-hydrological events in the whole Campi Flegrei area have been made in relatively recent years (e.g., Beneduce et al., 1988; Calcaterra et al., 2003; Di Martire et al., 2012), given that the scientific community dedicated more interest toward volcanic and seismic processes.
The flash flood hazard in the urban area of Pozzuoli have been analyzed in a previous work (Esposito et al., 2015). Authors evaluated in 360 ha the extent of the partially-urbanized watershed involved by flash floods, and in 18.6° its average slope angle, reaching values of about 70° within the drainage channels located in its central zone. The geological framework is characterized by welded pyroclastic rocks like tuff and ignimbrite, and locally by lava domes/flows. Such lithologies are often mantled by incoherent primary volcaniclastic deposits constituted by ashes, scoria, and pumices, and by reworked pyroclastics and colluvial soils, together with alluvial deposits derived from the water-driven surface erosion of the slopes. The climatic setting is of Mediterranean type, with hot, dry summers and moderately cool rainy winters. Mean annual temperatures are in the order of 16°C and the mean annual rainfall is of ca. 875 mm. The most intense rainy period is between October and December, when heavy rainfall occur (Figure 2).
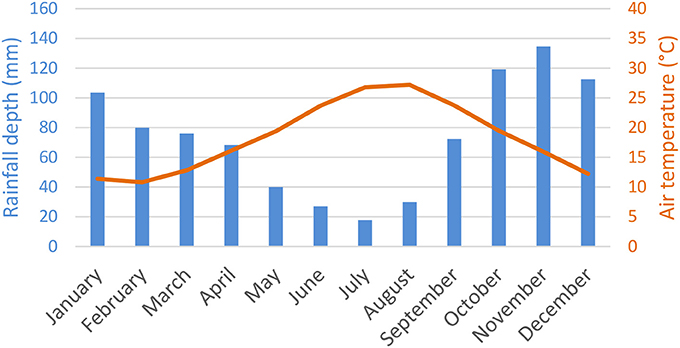
Figure 2. Average monthly rainfalls and temperatures related to the Pozzuoli area for the 1970–2014 time period.
The rain regime in this part of Italy is characterized by typical rainfall patterns, among frontal rainfalls, hurricane-like rainfalls or isolated convective storms (De Luca et al., 2010). The seasonal effects of rainfall on shallow deposits and unsaturated pyroclastic soils have been studied in Cascini et al. (2014). A typical trend of soil suction is characterized by very high values (>30 kPa) from June to August due to the intense sun radiation, high values from September to October (20–30 kPa), intermediate value (10–20 kPa) in November and December, and the lowest values of soil suction (<10 kPa) from January to May (Cascini et al., 2014). No direct measurements of soil moisture were available for the pyroclastic soils outcropping in the study area. Some relative soil moisture data for a 5 cm layer in pyroclastic soils, measured at Bagnoli and Melizzano sites (see BAG and MEL in the inset of Figure 1), show high values during winter to spring rainy periods and very low values during summer dry periods (Brocca et al., 2011; Dorigo et al., 2011). Relationships between soil suction data and soil volumetric water content have been studied in several sites characterized by unsaturated pyroclastic soils in Campania region, such as the slopes near Cervinara (Greco et al., 2013), Nocera Inferiore (De Chiara et al., 2016), and Sarno (De Vita et al., 2013; Napolitano et al., 2016) (inset in Figure 1), showing opposite trends. Generally, such soils can be affected by erosion phenomena at the end of the dry season (August to October), during intense rainstorms, with a consequent triggering of flash flood events dominated by hyperconcentrated flows (Cascini et al., 2014; Vennari et al., 2016).
In order to characterize the flash flood-triggering rainfalls and precipitation regime, in this study we have analyzed the rainfall data collected by a rain gauge located within the Pozzuoli watershed (Figure 1). Given its location, this was able to capture representative flash flood-triggering rainfall data reported in the Results section. Since 1970 and up to 1999, this rain gauge was included in the national network of the Italian Hydrographical Service, regularly reporting only daily rainfall values. In the year 2000, the rain gauge was included in the real-time hydrological monitoring network of the Campania Regional Agency of Civil Protection, and was set for collecting rain data every 10 min. For this reason, the rainfall dataset used in this study consists of two subsets. The first subset includes daily rainfalls related to the 1970–1999 time interval, that were extracted from Hydrological Annals—Part I, available on the Institute for environmental Protection and Research (ISPRA) website (http://www.acq.isprambiente.it/annalipdf/). The second dataset includes rainfall data collected in the 2000–2014 time interval with a temporal resolution of 10 min, which were supplied by the Campania Regional Agency of Civil Protection (http://centrofunzionale.regione.campania.it/). Analysis of the frequency distribution of daily rainfall values with respect to different thresholds allowed characterizing the rainfall regime of the study area, as well as addressing identification of the occurred flash flood events.
A first list of flash flood events hitting the Pozzuoli urban center, obtained from previous scientific studies and inventories, such as AVI (Aree Vulnerate in Italia) (Guzzetti et al., 1994) and SICI (Sistema Informativo Catastrofi Idrogeologiche) databases (http://sici.irpi.cnr.it/gndci.htm), as well as from local news websites, was presented in the previous work of Esposito et al. (2015). In order to obtain an updated and complete list of flash flood events occurred in the 1970–2014 time interval, it was performed an archive research at the National Library of Naples. Here, information related to flash flood events (rainfall qualitative data, description of damages, photos, etc.) were collected from the most relevant local newspaper (namely “Il Mattino”), edited in Naples since 1892.
In order to address the archive research by avoiding time wasting efforts, we selected an arbitrary daily rainfall threshold of 40 mm that allowed us to identify rainy days with high probability of flash flood occurrence. This kind of threshold corresponded to the lowest value of daily rainfall measured in a day for a flash flood event occurred in 2009, as reported in Esposito et al. (2015). Our assumption was hence that all events of the first subset should be occurred in days characterized by cumulated rainfall amounts equal or higher than 40 mm. At the same time, we verified if such amount was reached or exceeded at the turn of two consecutive days, also to include potential rainstorms occurred between midnights. In this way, we selected a series of dates that were investigated through the historical archive research. With the aim of identifying all the occurred flood events, we addressed the archive research by visually checking also the newspaper editions related to a brief period (2–3 days) after the day characterized by high probability of flash flood occurrence. After this, in order to avoid data gaps and verify effectiveness of the adopted threshold, we expanded the archive research by checking days characterized by cumulated rainfall amounts higher than 30 mm. An accuracy analysis aimed at validating the used threshold and at verifying relationships between a series of other thresholds and occurrence of flash flood events was then performed.
Supplementary data for the more recent events were collected from web sources, including news websites and social networks. It is worth noting that, in order to avoid an information bias toward the last decade when reports from web sources were widespread, identification of the flash flood events was primarily obtained by means of the archive research, and supplementary materials were only used for better characterizing the magnitude of processes, affected zones, and consequent damages from a qualitative point of view. After the identification of flash flood events, the effective daily rainfall and, when available, other properties, such as maximum 1-h rainfall and 10-min peak storm intensity, were collected. Both flash flood and rainfall data were finally elaborated and represented by means of specific plots, aimed at highlighting related behaviors.
A comparison performed in GIS environment between the 1:10,000 topographic map of the study watershed, dated 1965 and available on the Città Metropolitana di Napoli website (http://sit.cittametropolitana.na.it/), and orthophotos related to the years 2000 and 2012, available on the National Geospatial archive of the Italian Ministry for the Environment (www.pcn.minambiente.it/mattm/), allowed quantifying the urban growth occurred through the considered time spans.
The rainfall dataset analyzed in this study is related to the period between January 1970 and December 2014, and includes 13,078 daily rainfall measurements. The first subset (1970–1999, 30 years) encompasses 7,891 days of measurements, while the second subset (2000–2014, 15 years) encompasses 5,187 days. Data related to some years (i.e., years 1972–1974, 1991–1996, 2000) were not included in the analysis because daily rainfall measurements were discontinuous.
The cumulated annual rain time series shows a clear variability around an average value of 875 mm/year (Figure 3), and stronger oscillations can be observed during the 1970–1990 period.
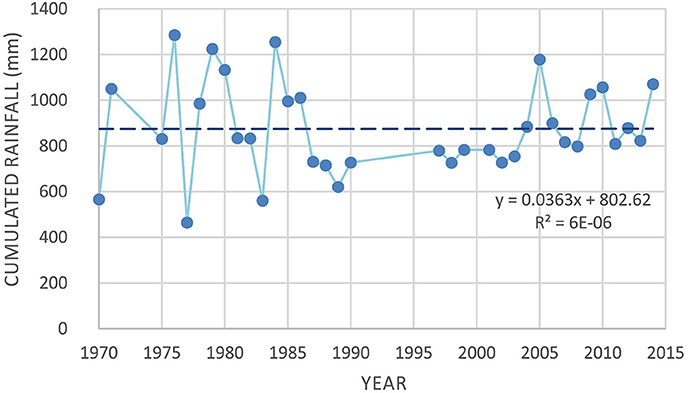
Figure 3. Cumulated annual rain at the Pozzuoli rain gauge.
The daily rain time series (Figure 4) does not show a particular statistical trend, but it is characterized by both seasonal and monthly fluctuations, as well as by several daily peaks also higher than 100 mm. Specifically, it can be noted that daily peaks are more frequent but less severe during the 1970–1999 time interval, and are less frequent but more severe during the 2000–2014 (Figure 4).
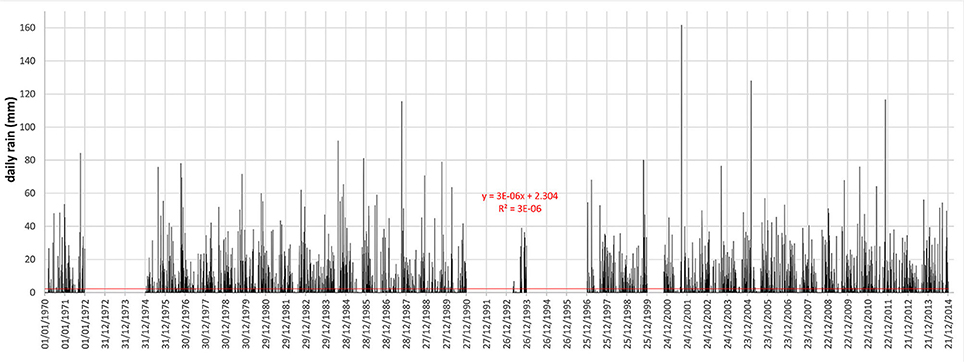
Figure 4. Daily rain time series measured by the Pozzuoli rain gauge.
Analysis of the frequency distribution of daily rainfall values is represented with respect to classes defined according to different rain thresholds (Table 1), by using a bi-logarithmic diagram (Figure 5). The two analyzed datasets do not show important differences in frequency distribution. Taking as reference daily thresholds of 40 and 75 mm, the frequency of days with relatively higher cumulated amounts is similar for the two studied periods: 51 days with rain >40 mm (0.65% of total daily measurements) and 9 days with rain >75 mm (0.11%) during the 1970–1999, 26 days with rain >40 mm (0.50%), and 5 days with rain >75 mm (0.10%) during the 2000–2014 (Table 1).
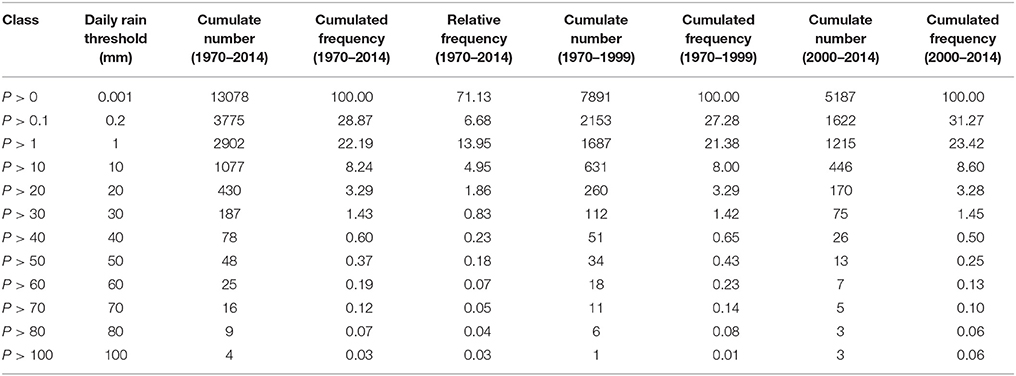
Table 1. Distribution of daily measurements for different daily rainfall classes.
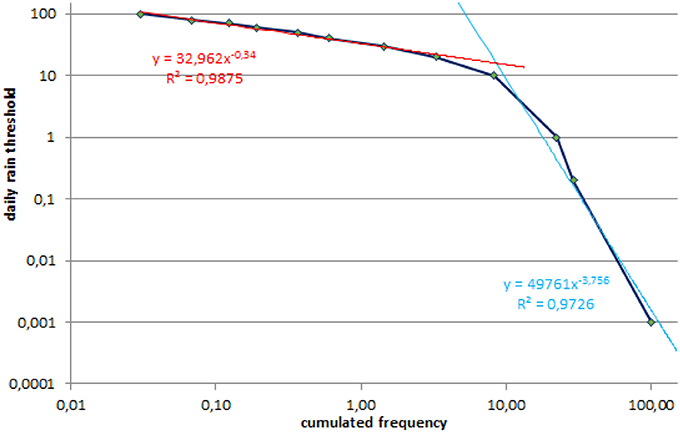
Figure 5. Bi-logarithmic diagram of threshold classes and cumulated frequency of daily rain data.
However, by considering the full series, a clear change in the threshold/frequency relationship occurs around thresholds between 10 and 20 mm, as represented by the two different power-laws in Figure 5. At the high frequencies (f = 10–100), corresponding to daily rainfalls lower than 10 mm, the curve is very steep indicating a very rapid decrease in frequency for an increase of daily rain. At the low to very low frequencies (f = 0.01–10), corresponding to daily rainfalls higher than 20 mm, the curve flattens and shows a slight linear increasing behavior since the 30 mm threshold.
Monthly distribution of the relatively most rainy days (rain >40 mm/day) occurred within the entire 1970–2014 time period shows a strong seasonality (Figure 6), concentrating mostly in the autumn season. However, some differences can be observed between the two analyzed periods, such as a strong peak recorded in October only during the 1970–1999 period.
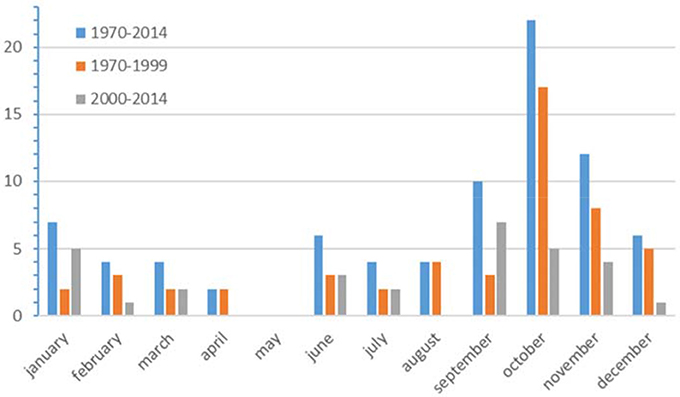
Figure 6. Monthly frequency of days characterized by rain amounts major than 40 mm for the 1970–1999 and 2000–2014 time spans, as well as for the entire period.
The most dramatic flood event of the last century occurred on October 25, 1918 (AVI database; Guzzetti et al., 1994), causing the collapse of a building and 13 fatalities in the urban center of Pozzuoli. For this event, no rain data is available and the archive research gave us only a qualitative description of the event: “an extreme rainstorm with torrential rain and strong winds caused the collapse of a two-floor building located in San Leonardo street, in the town center, at 5 a.m.” (source: “Il Mattino,” issue dated 26–27 October 1918). Beside this main event, and probably other minor events occurred in the first half of the last century, the results of the archive research revealed that in the 1970–2014 time interval nine flash flood events hit the Pozzuoli town (Table 2). Among these, four events occurred in the 1970–1999 (i.e., 30 years) and five events in the 2000–2014 (i.e., 15 years) time spans. Analysis of the record showed that events mostly occurred in the late summer-autumn period (78%), whereas in the spring (11%), and summer seasons (11%) they were less frequent. No event has been recorded in the winter season. This seasonal distribution is coherent with the average monthly distribution of the most severe rainfalls occurred in the 1970–2014 time period (Figure 6).
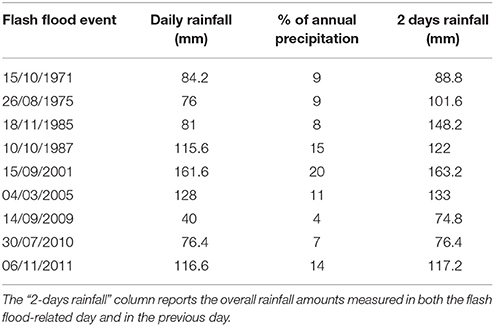
Table 2. Flash flood events occurred in the Pozzuoli area in the 1970–2014 time interval and related daily rainfalls.
Analysis of information related to the most recent events (e.g., 2011 event; Esposito et al., 2015) supplied a clear explanation of the flash flood dynamic in the study area. Specifically, enhanced runoff processes initiate during heavy rainstorms along the volcanic hillslopes, eroding pyroclastic soils and supplying sediment-laden flows downstream. In the upper part of the watershed, these flows pour down along hollows and natural channels (Figure 7), where soil slips can also affect hilly slopes and channel sides. Downstream, the sediment-laden flows have been reported along the road network connecting the neighborhoods located up in the watershed with the littoral zone (Figure 7). In many cases, flows were able to drag motorcycles and cars together with people. The documented rapid flows induced heavy damages to the railway crossing the urban center and to the buildings realized close to the coastline, or in proximity of the flooded roads (Esposito et al., 2015). Deposits of mud reported in the littoral zone reached up to one meter in thickness, whereas other amounts of sediments flowed into the sea. No fatalities have been recorded during the recognized events.
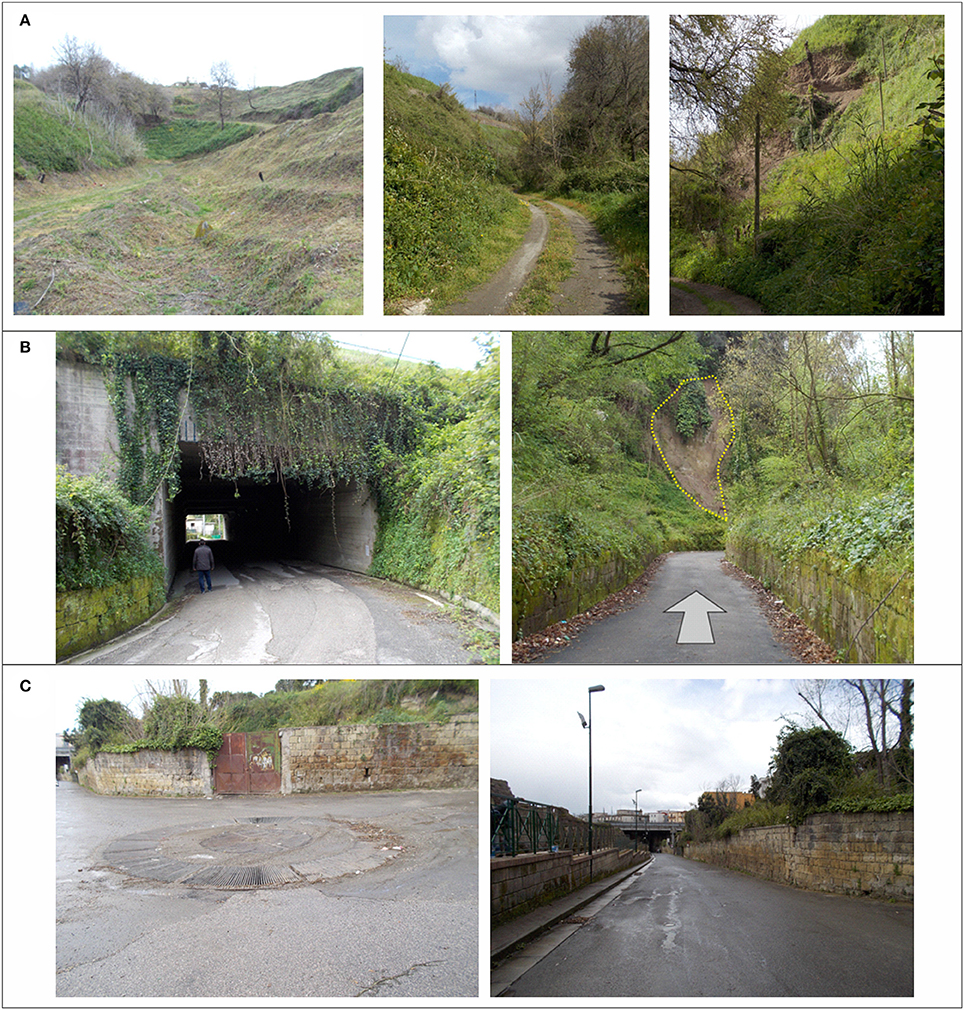
Figure 7. Photographs of the different sectors of the studied watershed: (A) hilly sector with hollows and partly-natural channels, and soil slips along the slopes; (B) intermediate sector with a tunnel passing under the highway, and a drainage channel transformed in a road for connecting the urban center; the dashed line highlights the scar of a shallow landslide triggered by intense rainfalls; (C) lower and fully urbanized sector.
The accuracy analysis revealed that the adopted threshold of 40 mm was suitable to identify flash flood events occurred in the study area by means of the performed archive analysis. This emerged after testing further thresholds by means of several accuracy statistics commonly used for assessing models of weather forecasting, landslide susceptibility and other (Frattini et al., 2010), such as the False Positive rate (FP), True Positive rate (TP), True skill statistic score (Peirce, 1884; Hanssen and Kuipers, 1965), Efficiency (Finley, 1884), and the Odd ratio skill score (Yule, 1900). Such statistics allowed assessing the model performance by comparing observed data (occurrence or absence of a flash flood response after a daily rain exceeding a given threshold) with the model (i.e., selected thresholds) by means of a contingency table (Table 3). Results of the accuracy analysis are shown in Table 4, with reference to thresholds ranging from 30 to 80 mm.
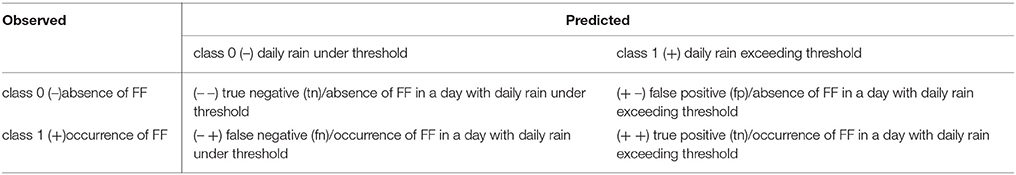
Table 3. Contingency table used for flash flood model evaluation (modified after Frattini et al., 2010).
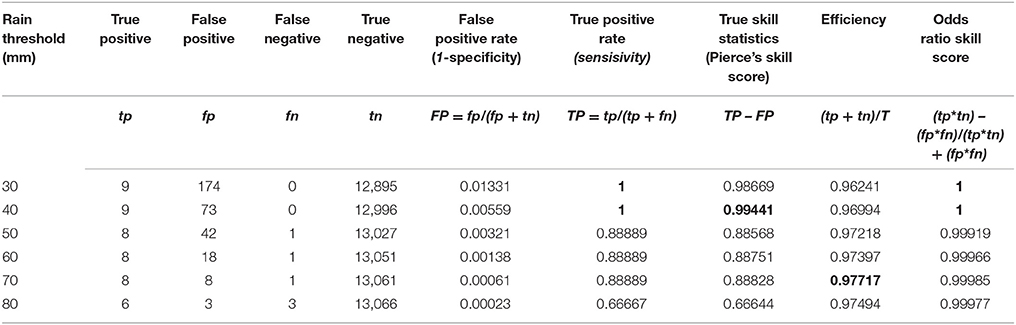
Table 4. Classification of rainy days with different thresholds combined with flash flood events and results of related accuracy statistics (the best scores are in bold letters).
Generally, FP and TP give an insufficient performance statistics, because they ignore false negatives and false positives, respectively (Frattini et al., 2010). In this study, however, the 30 and 40 mm thresholds gave a full sensitivity. The same result was given by the odd ratio skill score that conveniently ranges between −1 and 1 and takes prior probabilities into account (Frattini et al., 2010), resulting in better scores for rare events like the analyzed flash floods. The True skill statistic score, that uses all elements of contingency table and does not depend on event frequency, showed better results for the 40 mm threshold (Table 4). The Efficiency measured the percentage of events that were correctly classified by the used model (threshold), but all the scores resulted very high because were heavily influenced by the most common class (true negative). It was therefore not evenhanded.
Properties of rainfalls related to the four flash floods occurred in the first analyzed time interval are reported in Table 5 (gray rows). Daily amounts range from a minimum of 76 mm recorded on August 26, 1975 to a maximum of 115.6 mm recorded on October 10, 1987. The 1-h rainfall amount is available for the 1971 and 1987 events only, resulting in 30 and 40 mm respectively. The 10-min peak storm intensity was recorded for the 1971 event only and resulted in 60 mm h−1. These four flash floods were recognized within a selection of 51 days characterized by daily rainfall amounts equal or >40 mm (Figure 8), 47 of which did not correspond therefore to any event on checked newspapers.
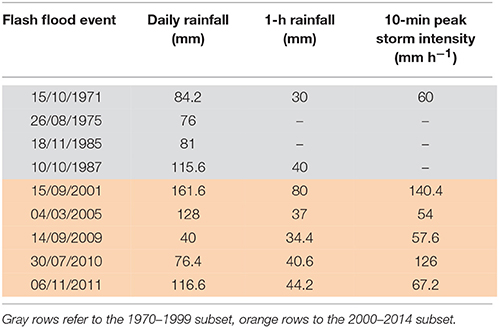
Table 5. Rainfall properties related to the flash flood events occurred in the Pozzuoli area.
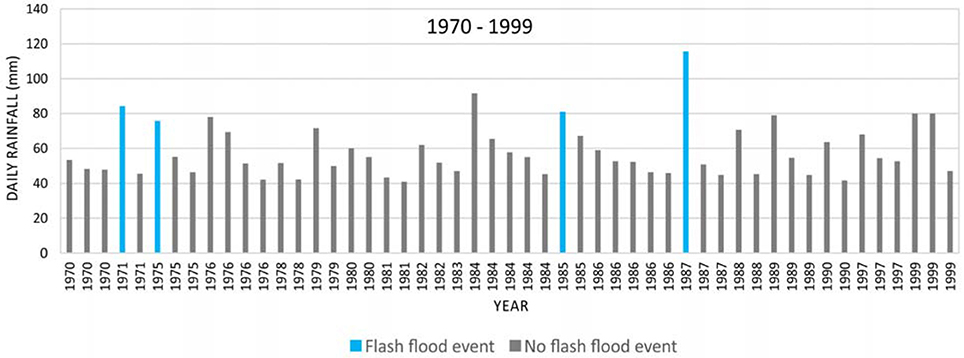
Figure 8. Daily cumulative rainfall recorded in selected dates of the 1970–1999 time interval. Rainfall data associated to flash floods are highlighted in blue.
Properties of rainfalls related to the five flash floods occurred in the second analyzed time interval (subset 2000–2014) are also reported in Table 5 (orange rows). Daily amounts range from a minimum of 40 mm recorded on September 14, 2009 to a maximum of 161.6 mm recorded on September 15, 2001. The 1-h amounts range from a minimum of 34.4 mm recorded on September 14, 2009 to a maximum of 80 mm recorded on September 15, 2001. The 10-min peak storm intensities range from a minimum of 54 mm h−1 recorded on March 4, 2005 to a maximum of 140.4 mm h−1 recorded on September 15, 2001. These five flash floods were recognized within a selection of 26 days characterized by daily rainfall amounts equal or >40 mm (Figure 9), 21 of which did not correspond therefore to any event. With reference to these 26 days, a torrential character of precipitations is generally recorded, as highlighted in Figure 9, where daily rains, 1-h maximum amounts and peak intensities recorded in 10 min are compared. These observations were obtained thanks to the availability of rain gauge measurements characterized by a high temporal resolution (i.e., 10 min), since the year 2000. For this latter time interval, we have observed that, in the study area, the flash flood triggering rainfalls consist of two types. The type 1 includes abundant rainfall persisting on the same area for several hours, with variable intensities that can reach peaks in 10 min up to 100 mm h−1; the type 2 includes short-duration, high-intensity rainstorms able to release significant amounts of rain in < 1 h. Examples of both types are shown in Figure 10.
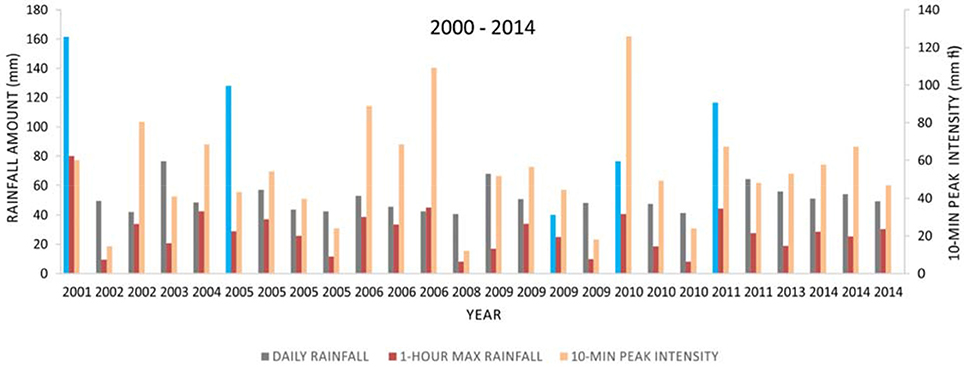
Figure 9. Daily cumulative rainfall, 1-h max rainfall amount and 10-min peak intensity related to selected dates of the 2000–2014 time interval. Daily rainfall data associated to flash floods are highlighted in blue.
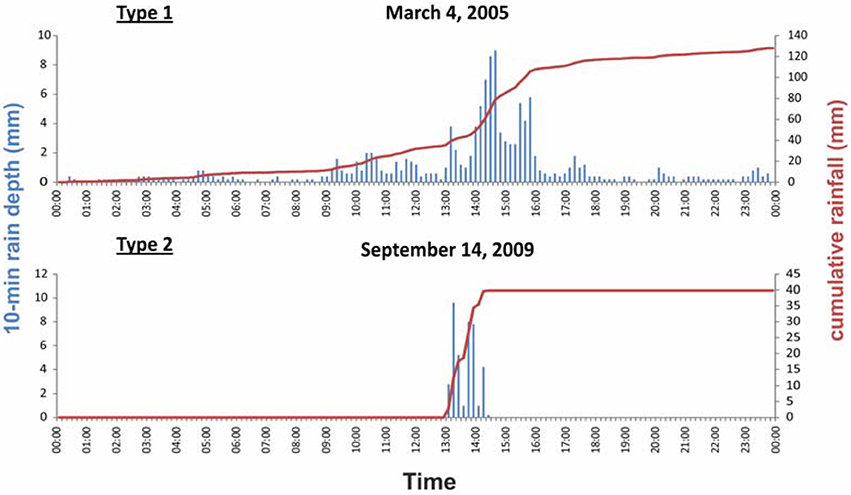
Figure 10. Examples of the two types of rainfall recorded during flash flood events.
A general analysis of rainfall data related to flash floods (Table 5) revealed that the 1-h rainfall amount and the 10-min intensity exceeded the 30 mm and 54 mm/h, respectively, as well as daily rainfall usually showed values higher than 76 mm, except for the 2009 event (40 mm).
Processes described in the previous section were favored by a severe modification of the natural drainage pattern together with an increased urbanization of the watershed that occurred through the second half of the XX century.
Drainage channels, in fact, were deeply modified and many of them were transformed in roads or were buried by means of culverts, compromising their capability of drain flood discharges. The hydrographic network is partly natural in the hilly sectors of the watershed, on the upstream side of the highway, and became completely anthropized downstream, where roads (Figures 1, 7, and 11) have replaced natural channels. For this reason, in all the recent inventoried events, we found that the channelized flows leaved their natural path to overwhelm the urban center with high energy downstream.
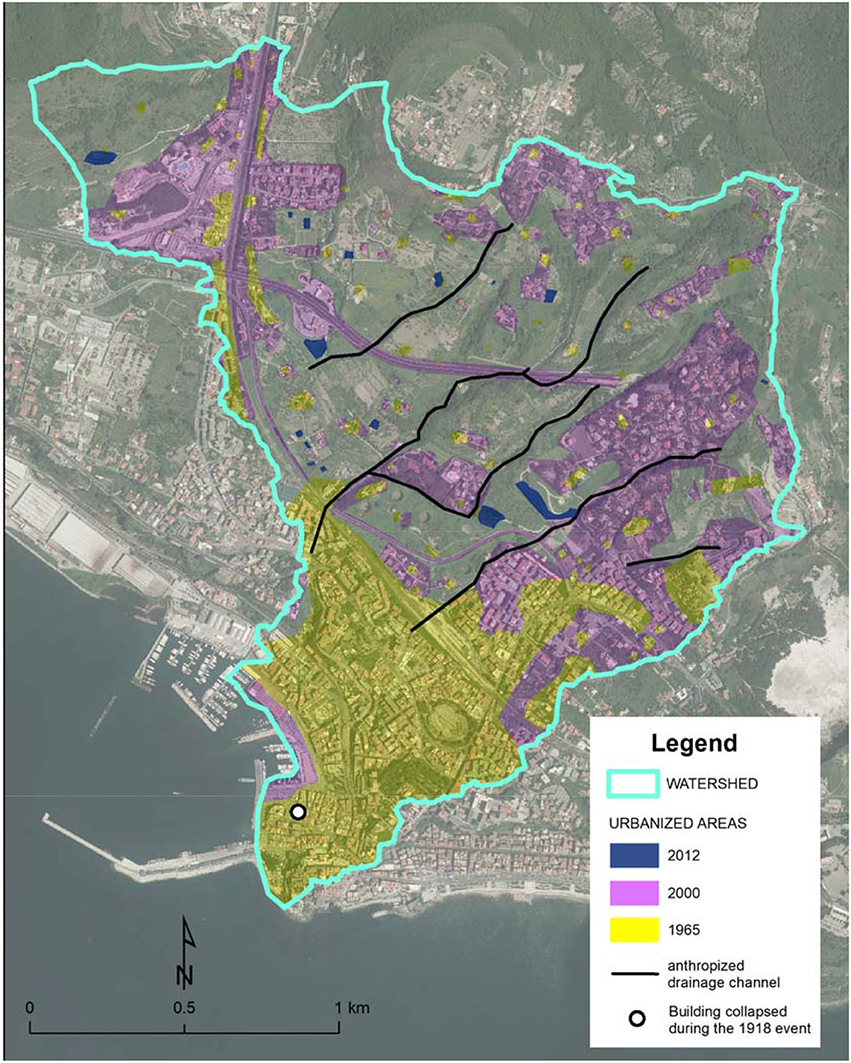
Figure 11. Map showing the urban expansion of the Pozzuoli town in the years 1965, 2000, and 2012.
According to Pesaresi and Marta (2014), the main part of an urban sprawl occurred over the last decades of the XX century (1970–2000). Later, a strong decrease in the growth of artificial surfaces took place. The quantitative GIS analysis performed in this study revealed that the urbanized surface of the Pozzuoli watershed (area 3,615,454 m2) raised of 31.2% in the 1965–2000 time interval, and of only 0.7% in the 2000–2012 time span (Table 6). Figure 11 shows the areas involved by such urban developments.
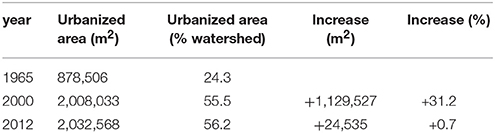
Table 6. Quantitative urbanization changes in the Pozzuoli watershed during the 1965–2012 time span.
In the Pozzuoli area, the oldest and most severe (13 fatalities) flash flood event occurred in 1918 (for location see Figure 11), but no rain data is available for that time. After this, 9 events have been recognized between 1970 and 2014; all of them caused several damages to roads, buildings and the railway in the town center with a comparable level of severity. Data presented in this research highlight as the frequency of flash flood events varied in the Pozzuoli area throughout the 1970–2014 time interval. The most relevant finding is that the frequency increased in the 2000–2014 time span (5 events in 15 years; 0.33 ev./yr) respect to the 1970–1999 time span, when 4 events occurred in 30 years (0.13 ev./yr). Cumulated frequency of days with rainfall amounts equal or higher than 40 mm (threshold selected for the archive research) shows a constant trend through the analyzed time interval (1970–2014), without significant variations (Figure 12). Conversely, cumulated frequency of flash flood events highlights an increasing trend since the year 2000, while the urbanization of the area increased only before the year 2000 (Figure 12).
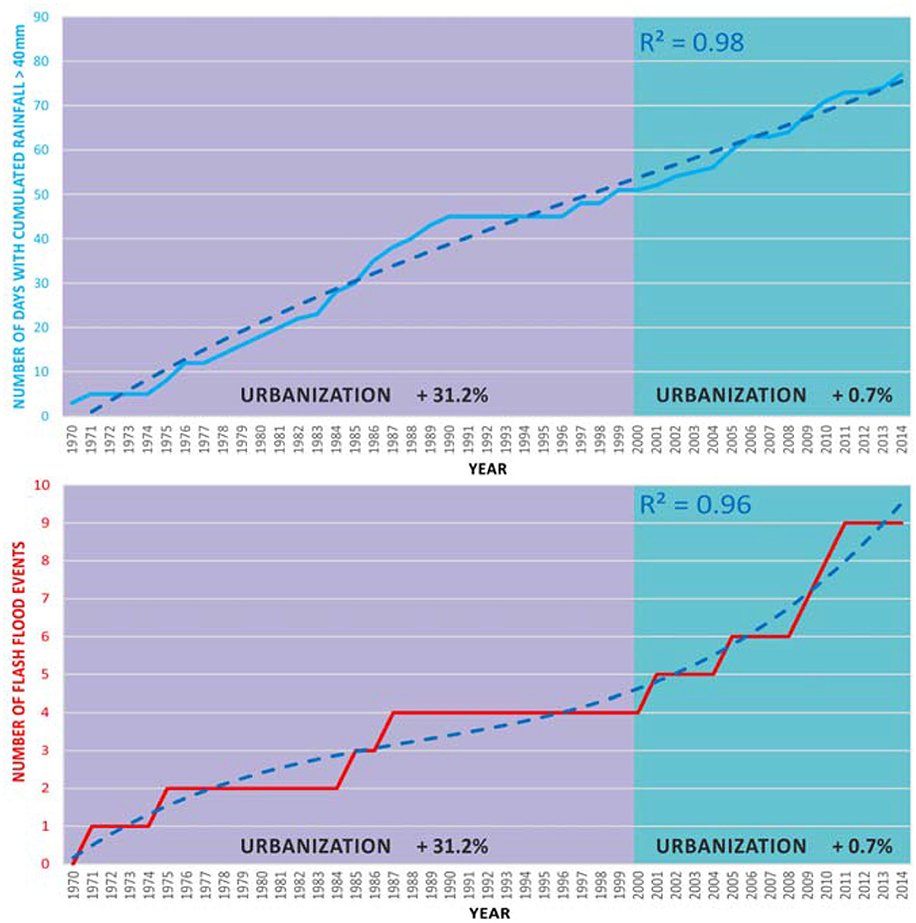
Figure 12. Trend of days characterized by a cumulative rainfall depth ≥40 mm (above) and trend of flash flood events (below) related to the 1970–2014 time interval. Urbanization rates are also reported for comparison
The lower occurrence of flash floods in the first period cannot be related to a lack of historical data. In fact, information related to the occurrence of all the inventoried flash floods were reported by the same authoritative source for both the analyzed time periods. Such newspaper had always been careful to report any local incident that had an impact on society, such as fatalities and injuries, road diversions, rail delays, flooding and other damages typical of flash floods, as testified by the example of the oldest event noticed to (i.e., the 1918 one). However, the greater amount of data supplied by web sources for events occurred in the last decade, resulted very useful for better understanding the triggering and evolution mechanisms of flows, the affected areas and types of damages. Specifically, as reported by Esposito et al. (2015) for the 2011 event, video footages captured with smartphones by people living in different areas of the Pozzuoli watershed gave us relevant information about flow types, their paths, and the variable depths reached within the urban center. Many studies emphasized the valuable use of web sources, especially social media for flood mapping (Brouwer et al., 2017 and references therein), streamflow estimation (Restrepo-Estrada et al., 2018), and damage assessment (e.g., Diakakis et al., 2016). According to Pennington et al. (2015), the use of social media enables to acquire detailed information about the impacts, remediation and triggers at the time of the event, many of which could be otherwise unknown.
The strategy of determining a daily rainfall threshold for addressing the archive research and extending inventory of flash floods occurred in the study area demonstrated to be very effective in terms of time optimization and accuracy of results. The adopted threshold of 40 mm resulted in fact very accurate from a statistical point of view, as reported in Table 4. Moreover, taking into account overall results of the accuracy analysis, as well as properties of rainfalls triggering the identified flash floods (Table 5), higher daily thresholds of 60 or 70 mm would have led to less valuable results. In referring to this consideration, however, it is worth underlining that application of such method requires a preliminary set of events, which is essential to take adequate decisions about the daily rainfall threshold that should be used. The only analysis of daily rainfall data series is not wholly sufficient.
In order to address causes of the increased flash flood trend, it was assessed the urbanization progress occurred in the studied watershed throughout the 1965–2012 time interval. The analysis of topographic maps and orthophotos of the Pozzuoli area documented the high level of urbanization, representing a complex and critical factor for risk management in the area. Our GIS analysis allowed assessing that urbanized surface of the Pozzuoli watershed raised from 24 to 55% in the 1965–2000 time interval. A strong decrease in the growth of artificial surfaces took place instead during the 2000–2012 time span, when the urbanization has increased only for 0.7% of the watershed area (Figure 11). In the light of this, the frequency of flash floods and the rate of urbanization followed opposite behaviors, since 2000 (Figure 12), indicating that the temporal distribution of events is ostensibly controlled by different factors. The initial soil moisture content may also have a marginal role, given that in this period is relatively low in the whole region and that the flood-triggering rainfalls are often characterized by high rain rates exceeding the soil's infiltration capacity. In the volcanic and peri-volcanic areas of the Campania Region, moreover, this behavior is enhanced within hillslopes that during the summer season are hit by wildfires generating soil water repellency conditions (e.g., Esposito et al., 2017). In small and highly urbanized watersheds like that of Pozzuoli, the hydrological response to high-intensity rainstorms is very rapid and almost all the rain supplies overland flows characterized by discharges that are often not able to be drained by artificial channels and culverts. Unfortunately, the studied watershed is not gauged with instruments for flow discharge measurements, so that we have not accurate data about this. Analysis of the collected multimedia data also highlighted that flow discharges were increased by a relevant concentration of fine sediments, mostly derived from surface erosion of volcanic soils and pyroclastic units outcropping in the hilly sector of the study area.
Taking into account the findings described previously, the observed increase in the flash flood trend can be reasonably ascribed to some variations in the rainfall regime.
The frequency of days with most abundant cumulated rainfall (i.e., ≥40 mm) is very similar for the two analyzed periods, and a generally constant trend can be observed since 1970 (Figure 12). The factor that has probably played the major control on the increase of flash flood events in the study area has been a change in the rainfall intensity. However, intensity data are fully available only for the 2000–2014 dataset, and are therefore not sufficient to definitively confirm this hypothesis. As consequence, the use of future 10-min registrations would help to define appropriate rain intensity trends.
In the Eastern Mediterranean, a significant rise in the flood frequency, partially related to the increased rainfall intensity (Philandras et al., 2010), has been documented by Diakakis (2014) in the metropolitan area of Athens (Greece). According to this Author, such increment mostly occurred in recent decades (i.e., from 1970 to 2010), with a concentration of events in the autumn season, as in the current case history. In Athens too, heaviest damages occurred in specific locations mostly near the city's natural drainage network, parts of which have been converted to culverts or streets and were derelict for decades (Diakakis et al., 2016).
Even though it was not possible to calculate significant intensity trends in this study, a torrential character of sub-hourly precipitations recorded since the year 2000 (e.g., Figures 9, 10) is evident. The 1-h amounts range from 30 to 80 mm, while the 10-min peak storm intensities range from 54 to 140.4 mm h−1. According to Tranfaglia et al. (2016), for example, the meteorological event that hit the cities of Naples and Pozzuoli on September 15, 2001 was undoubtedly one of the most intense events ever recorded on such territory. This event, as well as those triggering the other flash floods, were rather restricted on the most urbanized areas of the Campi Flegrei coastline. This circumstance may be explained by considering these areas as Urban Heat Islands (UHI) that release high amount of suspended particles together with sensible heat in the atmosphere, contributing to increase its mechanical turbulence and to create favorable conditions for severe convective rainstorms (Chandler, 1965). At this effect should be associated the contribution of the rugged topography of the volcanic hillslopes that, also in other parts of the Campi Flegrei (e.g., Santo et al., 2012), influenced both the development of convective cells and triggering of flash floods. According to Marchi et al. (2010), orography plays an important role in regulating atmospheric inflow to the storm and in controlling storm motion and evolution, as well as topographic relief is necessary for promoting flow concentration along drainage ways, which result in high unit discharges and relevant geomorphic effects.
The increased frequency of flash floods here described seems to do not follow the trends recognized at larger scales in the Mediterranean region, probably due to the limitations of the available datasets and some complex overlapping signals (e.g., decadal and inter-decadal variability). In fact, Madsen et al. (2014) indicate that there is some evidence of a general increase in observed extreme precipitation, whereas there are no clear indications of significant increasing trends at regional or national levels of observed extreme streamflow in Europe. Gaume et al. (2016) also detected no significant trends in the frequency and magnitude of extreme floods for the Mediterranean area. According to Llasat et al. (2016), the lack of a common or significant trend is a general result found in the majority of works dealing with flood time series analysis, as pointed out by the IPCC, both in their reports on Extremes (IPCC, 2012) and in the Fifth Report (IPCC, 2014).
In spite of this, some increments were clearly identified at local scales. For example, other than findings of Diakakis (2014) discussed previously, Llasat et al. (2013) calculated positive trends for extraordinary floods (0.13 floods yr−1) occurred between 1981 and 2010 in north-east Spain, south-east France and south-west Italy. Petrow and Merz (2009) detected increasing trends in flood frequency in some parts of Germany, and correlated them with temporal changes in atmospheric circulation patterns. Wilhelm et al. (2012) identified flash flood events that affected an alpine watershed in the NW French Alps, during the 1740–2007 time span, and discovered that most of the extreme flood events took place since the beginning of the twenty-first century, with the strongest occurring in 2005. These authors also related the occurrence of high magnitude torrential flood events in high-altitude watersheds to the climate warming. An increment of flash floods in the 1986–2015 time span was also found by Vennari et al. (2016) for other parts of the Campania region.
Taking into account this framework, it seems that local conditions in terms of atmospheric circulation, topography and vulnerability are prevailing on factors acting at larger scales. This requires more efforts to the scientific community engaged in the evaluation of climate change-related effects, also to predict future social consequences.
In summary, results presented in this contribution highlight as urbanization of the Pozzuoli watershed has become relatively stable since the year 2000, whereas frequency of flash floods has increased. This supports the hypothesis of local changes in the extreme precipitations. Information provided by archive chronicles and web sources demonstrate as the current urban setting plays a fundamental role in making the Pozzuoli area prone to future flash flood events that, probably, will be increasingly favored by the occurrence of more extreme rainstorms, as already forecasted for rainfall-induced landslides in other parts of southern Italy (Gariano et al., 2017).
GE performed the archive research. GS and FM performed the statistical analysis; GE, GS and FM processed rainfall and flash flood data; GE and FM wrote the paper.
Financial support was provided by the Research Project PON-MONICA (contract no. PON01_01525) (2012-2016) and by the Research Project ABBACO (2017-2018).
The authors declare that the research was conducted in the absence of any commercial or financial relationships that could be construed as a potential conflict of interest.
The authors are grateful to the Civil Protection Agency of Campania Region for allowing us access to rainfall data on the study area, and to editor and reviewers for the useful comments that helped us to improve the manuscript.
Aronica, G. T., Brigandí, G., and Morey, N. (2012). Flash floods and debris flow in the city area of Messina, north-east part of Sicily, Italy in October 2009: the case of the Giampilieri catchment. Nat. Hazards Earth Syst. Sci. 12, 1295–1309. doi: 10.5194/nhess-12-1295-2012
Beneduce, P., D'Elia, G., and Guida, M. (1988). Morfodinamica dei versanti dell'area flegrea (Campania): erosione in massa ed erosione lineare. Mem. Soc. Geol. It. 41, 949–961.
Blöschl, G., Hall, J., Parajka, J., Perdigão, R. A. P., Merz, B., Arheimer, B., et al. (2017). Changing climate shifts timing of European floods. Science 357, 588–590. doi: 10.1126/science.aan2506
Brocca, L., Hasenauer, S., Lacava, T., Melone, F., Moramarco, T., Wagner, W., et al. (2011). Soil moisture estimation through ASCAT and AMSR-E sensors: an intercoparison and validation study across Europe. Remote Sens. Envir. 115, 3390–3408. doi: 10.1016/j.rse.2011.08.003
Brouwer, T., Eilander, D., van Loenen, A., Booij, M. J., Wijnberg, K. M., Verkade, J. S., et al. (2017). Probabilistic flood extent estimates from social media flood observations. Nat. Hazards Earth Syst. Sci. 17, 735–747. doi: 10.5194/nhess-17-735-2017
Brunetti, M., Maugeri, M., Monti, F., and Nanni, T. (2004). Changes in daily precipitation frequency and distribution in Italy over the last 120 years. J. Geophys. Res. 109:D05102. doi: 10.1029/2003JD004296
Calcaterra, D., Del Prete, S., and Mele, R. (2003). “The influence of landslides on the coastal settlements of the Phlegrean district (Campania region, Italy),” in Proceedings of the International Conference CITTAM 2003, The Requalification of Mediterranean Coasts Among Tradition, Development and Sustainability (Naples: Arte Tipografica Editrice), 524–534.
Cascini, L., Sorbino, G., Cuomo, S., and Ferlisi, S. (2014). Seasonal effects of rainfall on the shallow pyroclastic deposits of the Campania region (southern Italy). Landslides 11, 779–792. doi: 10.1007/s10346-013-0395-3
Cevasco, A., Pepe, G., and Brandolini, P. (2012). Shallow landslides induced by heavy rainfall on terraced slopes: the case study of the October, 25, 2011 event in the Vernazza catchment (Cinque Terre, NW Italy). Rend. Online Soc. Geol. It. 21, 384–386. Available Online at: https://rendiconti.socgeol.it/297/article-874/shallow-landslides-induced-by-heavy-rainfall-on-terraced-slopes-the-case-study-of-the-october-25-2011-event-in-the-vernazza-catchment-cinque-terre-nw-italy.html
De Chiara, G., Ferlisi, S., Cascini, L., and Matano, F. (2016). “Rainfall-induced slope instabilities in pyroclastic soils: the case study of Mount Albino (Campania region, Southern Italy),” in Volcanic Rocks and Soils, eds T. Rotonda, M. Cecconi, F. Silvestri and P. Tommasi (London: Taylor & Francis Group), 327–333.
De Luca, C., Furcolo, P., Rossi, F., Villani, P., and Vitolo, C. (2010). Extreme rainfall in the Mediterranean,” in Proceedings of the International Workshop on Advances in Statistical Hydrology (Taormina: University of Catania - IAHS - STAHY), 1–11. Available Online at: http://www.risorseidriche.dica.unict.it/Sito_STAHY2010_web/proceedings.htm
De Vita, P., Napolitano, E., Godt, J. W., and Baum, R. L. (2013). Deterministic estimation of hydrological thresholds for shallow landslide initiation and slope stability models: case study from the Somma-Vesuvius area of southern Italy. Landslides 10, 713–728. doi: 10.1007/s10346-012-0348-2
Diakakis, M. (2014). An inventory of flood events in Athens, Greece, during the last 130 years. seasonality spatial distribution. J. Flood Risk Manag. 7, 332–343. doi: 10.1111/jfr3.12053
Diakakis, M., Deligiannakis, G., Katsetsiadou, K., Lekkas, E., Melaki, M., and Antoniadis, Z. (2016). Mapping and classification of direct effects of the flood of october 2014 in Athens. Bull. Geol. Soc. Gr. 50, 681–690. doi: 10.12681/bgsg.11774
Di Martire, D., De Rosa, M., Pesce, V., Santangelo, M. A., and Calcaterra, D. (2012). Landslide hazard and land management in high-density urban areas of Campania region, Italy. Nat. Hazards Earth Syst. Sci. 12, 905–926. doi: 10.5194/nhess-12-905-2012
Di Vito, M. A., Isaia, R., Orsi, G., Southon, J., de Vita, S., D'Antonio, M., et al. (1999). Volcanism and deformation since 12.000 years at the Campi Flegrei caldera (Italy). J. Volcanol. Geotherm. Res. 91, 221–246.
Dorigo, W. A., Wagner, W., Hohensinn, R., Hahn, S., Paulik, C., Drusch, M., et al. (2011). The international soil moisture network: a data hosting facility for global in situ soil moisture measurements. Hydrol. Earth Syst. Sci. 15, 1675–1698. doi: 10.5194/hess-15-1675-2011
Ducrocq, V., Braud, I., Davolio, S., Ferretti, R., Flamant, C., Jansa, A., et al. (2014). HyMeX-SOP1, the field campaign dedicated to heavy precipitation and flash flooding in the northwestern Mediterranean. Bull. Amer. Meteor. Soc. 95, 1083–1100. doi: 10.1175/BAMS-D-12-00244.1
Esposito, G., Fortelli, A., Grimaldi, G. M., Matano, F., and Sacchi, M. (2015). I fenomeni di flash flood nell'area costiera di Pozzuoli (Napoli, Italia): risultati preliminari sull'analisi dell'evento del 6 novembre 2011. Rend. Online Soc. Geol. It. 34, 74–85. doi: 10.3301/IJG.2015.41
Esposito, G., Matano, F., Molisso, F., Ruoppolo, G., Di Benedetto, A., and Sacchi, M. (2017). Post-fire erosion response in a watershed mantled by volcaniclastic deposits, Sarno Mountains, Southern Italy. Catena 152, 227–241. doi: 10.1016/j.catena.2017.01.009
Faccini, F., Luino, F., Sacchini, A., Turconi, L., and De Graff, J. V. (2015). Geohydrological hazards and urban development in the Mediterranean area: an example from Genoa (Liguria, Italy). Nat. Hazards Earth Syst. Sci. 15, 2631–2652. doi: 10.5194/nhess-15-2631-2015
Federico, S., Bellecci, C., and Colacino, M. (2003). Quantitative precipitation of the Soverato flood: the role of orography and surface fluxes. Il Nuovo Cimento 26C, 7–22. Available Online at: https://www.sif.it/riviste/sif/ncc/econtents/2003/026/01
Frattini, P., Crosta, G., and Carrara, A. (2010). Techniques for evaluating the performance of landslide susceptibility models. Eng. Geol. 111, 62–72. doi: 10.1016/j.enggeo.2009.12.004
Gariano, S. L., Rianna, G., Petrucci, O., and Guzzetti, F. (2017). Assessing future changes in the occurrence of rainfall-induced landslides at a regional scale. Sci. Tot. Envir. 596–597, 417–426. doi: 10.1016/j.scitotenv.2017.03.103
Gaume, E., Borga, M., Llasat, M. C., Maouche, S., Lang, M., and Diakakis, M. (2016). “Mediterranean extreme floods and flash floods,” in Hydro-meteorological extremes, chapter 3, The Mediterranean Region under Climate Change, A Scientific Update, ed Allenvi (Marseille: Coll. Synthèses, IRD Editions), 133–144. Available Online at: http://www.editions.ird.fr/produit/433/9782709922210/The%20Mediterranean%20Region%20under%20Climate%20Change
Greco, R., Comegna, L., Damiano, E., Guida, A., Olivares, L., and Picarelli, L. (2013). Hydrological modelling of a slope covered with shallow pyroclastic deposits from field monitoring data. Hydrol. Earth Syst. Sci. 17, 4001–4013. doi: 10.5194/hess-17-4001-2013
Guzzetti, F., Cardinali, M., and Reichenbach, P. (1994). The AVI Project: a bibliographical and archive inventory of landslides and floods in Italy. Environ. Manag. 18, 623–633. doi: 10.1007/BF02400865
Hanssen, A. W., and Kuipers, W. J. A. (1965). On the relationship between the frequency of rain and various meteorological parameters. Mededelingenen Verhandelingen 81, 2–15.
Hapuarachchi, H. A. P., Wang, Q. J., and Pagano, T. C. (2011). A review of advances in flash flood forecasting. Hydrol. Processes 25, 2771–2784. doi: 10.1002/hyp.8040
IPCC (2012). Managing the Risks of Extreme Events and Disasters to Advance Climate Change Adaption (SREX). Cambridge: Intergovernmental Panel on Climate Change; Cambridge University Press.
IPCC (2014). Climate Change 2014: Impacts, Adaptation, and Vulnerability. IPCC Working Group II Contribution to the Fifth Assessment Report of the Intergovernmental panel on climate change. Available online at: http://www.ipcc.ch/report/ar5/wg2/
Konrad, C. P. (2003). Effects of urban Development on Floods. U.S. Geological Survey Fact Sheet FS-076-03. Available online at: https://pubs.usgs.gov/fs/fs07603/
Llasat, M. C., Llasat-Botija, M., Petrucci, O., Pasqua, A. A., Rosselló, J., Vinet, F., et al. (2013). Towards a database on societal impact of Mediterranean floods in the framework of the HYMEX project. Nat. Hazards Earth Syst. Sci. 13, 1–14. doi: 10.5194/nhess-13-1337-2013
Llasat, M. C., Llasat-Botija, M., Prat, M. A., Porcù, F., Price, C., Mugnai, A., et al. (2010). High-impact floods and flash floods in Mediterranean countries: the flash preliminary database. Adv. Geosci. 23, 1–9. doi: 10.5194/adgeo-23-47-2010
Llasat, M. C., Marcos, R., Turco, M., Gilabert, J., and Llasat-Botija, M. (2016). Trends in flash flood events versus convective precipitation in the Mediterranean region: the case of Catalonia. J. Hydrol. 541, 24–37. doi: 10.1016/j.jhydrol.2016.05.040
Madsen, H., Lawrence, D., Lang, M., Martinkova, M., and Kjeldsen, T. (2014). Review of trend analysis and climate change projections of extreme precipitation and floods in Europe. J. Hydrol. 519, 3634–3650. doi: 10.1016/j.jhydrol.2014.11.003
Marchi, L., Borga, M., Preciso, E., and Gaume, E. (2010). Characterisation of selected extreme flash floods in Europe and implications for flood risk management. J. Hydrol. 394, 118–133. doi: 10.1016/j.jhydrol.2010.07.017
Mariotti, A., Struglia, M. V., Zeng, N., and Lau, K. M. (2002). The hydrological cycle in the Mediterranean region and implications for the water budget of the Mediterranean Sea. J. Climate 15, 1674–1690. doi: 10.1175/1520-0442(2002)015<1674:THCITM>2.0.CO;2
Montani, A., Marsigli, C., Nerozzi, F., Paccagnella, T., Tibaldi, S., and Buizza, R. (2003). The soverato flood in Southern Italy: performance of global and limited-area ensemble forecasts. Nonlin. Proc. Geophys. 10, 261–274. doi: 10.5194/npg-10-261-2003
Napolitano, E., Fusco, F., Baum, R. L., Godt, J. W., and De Vita, P. (2016). Effect of antecedent-hydrological conditions on rainfall triggering of debris flows in ash-fall pyroclastic mantled slopes of Campania (southern Italy). Landslides 13, 967–983. doi: 10.1007/s10346-015-0647-5
Peirce, C. S. (1884). The numerical measure of the success of predictions. Science 4, 453–454. doi: 10.1126/science.ns-4.93.453-a
Pennington, C., Freeborough, K., Dashwood, C., Dijkstra, T., and Lawrie, K. (2015). The national landslide database of great britain: acquisition, communication and the role of social media. Geomorphology 249, 44–51. doi: 10.1016/j.geomorph.2015.03.013
Pesaresi, C., and Marta, M. (2014). Applicazioni GIS per l'analisi dell'urbanizzazione nella provincia di Napoli. Un'analisi multitemporale in aree esposte a elevato rischio vulcanico. Boll Assoc Ital. Cartogr. 150, 34–53. Available Online at: https://www.openstarts.units.it/handle/10077/11318
Petrow, T., and Merz, B. (2009). Trends in flood magnitude, frequency and seasonality in Germany in the period 1951 - 2002. J. Hydrol. 371, 129–141. doi: 10.1016/j.jhydrol.2009.03.024
Philandras, C. M., Nastos, P. T., Paliatsos, A. G., and Repapis, C. C. (2010). Study of the rain intensity in Athens and Thessaloniki Greece. Adv. Geosci. 23, 37–45. doi: 10.5194/adgeo-23-37-2010
Pierson, T. C., and Costa, J. E. (1987). “A rheologic classification of subaerial sediment-water flows,” in Debris Flows/Avalanches: Process, Recognition, and Mitigation, eds J. E. Costa, G. F. Wieczorek (Boulder, CO: Geological Society of America, Reviews in Engineering Geology) 7, 1–12.
Regione Toscana (2017). Report Evento Meteo-Idrologico dei Giorni 9 e 10 Settembre 2017. Centro Funzionale Della Regione Toscana. Available online at: http://www.cfr.toscana.it/supports/download/eventi/report_evento_9-10_settembre_2017.pdf
Restrepo-Estrada, C., de Andrade, S. C., Abe, N., Fava, M. C., Mendiondo, E. M., and de Albuquerque, J. P. (2018). Geo-social media as a proxy for hydrometeorological data for streamflow estimation and to improve flood monitoring. Comput. Geosci. 111, 148–158. doi: 10.1016/j.cageo.2017.10.010
Santo, A., Di Crescenzo, G., Del Prete, S., and Di Iorio, L. (2012). The Ischia island flash flood of November 2009 (Italy): phenomenon analysis and flood hazard. Phys. Chem. Earth 49, 3–17. doi: 10.1016/j.pce.2011.12.004
Silvestro, F., Gabellani, S., Giannoni, F., Parodi, A., Rebora, N., Rudari, R., et al. (2012). A hydrological analysis of the 4th November 2011 event in Genoa. Nat. Hazards Earth Syst. Sci. 12, 2743–2752. doi: 10.5194/nhess-12-2743-2012
Tarolli, P., Borga, M., Morin, E., and Delrieu, G. (2012). Analysis of flash flood regimes in the North-Western and South-Eastern Mediterranean regions. Nat. Hazards Earth Syst. Sci. 12, 1255–1265. doi: 10.5194/nhess-12-1255-2012
Tranfaglia, G., Braca, G., Monacelli, G., Biafore, M., Porfido, S., and Mazzarella, A. (2016). Real time monitoring for diagnosis and prevention of extreme rainfall events: an application to intense rainfalls on the coastal city of naples, italy. J. Geogr. Nat. Disast. 6:180. doi: 10.4172/2167-0587.1000180
United Nations (2011). World Urbanization Prospects: The 2011 Revision. United Nations, Department of Economic and Social Affairs (DESA), Population Division, Population Estimates and Projections Section, New York, NY.
Vennari, C., Parise, M., Santangelo, N., and Santo, A. (2016). A database on flash flood events in Campania, southern Italy, with an evaluation of their spatial and temporal distribution. Nat. Hazards Earth Syst. Sci. 16, 2485–2500. doi: 10.5194/nhess-16-2485-2016
Wilhelm, B., Arnaud, F., Enters, D., Allignol, F., Legaz, A., Magand, O., et al. (2012). 35 Does global warming favour the occurrence of extreme floods in European Alps? First evidences from a NW Alps proglacial lake sediment record. Climatic Change 113, 563–581. doi: 10.1007/s10584-011-0376-2
Keywords: climate change, flash flood, extreme precipitations, Pozzuoli, Italy
Citation: Esposito G, Matano F and Scepi G (2018) Analysis of Increasing Flash Flood Frequency in the Densely Urbanized Coastline of the Campi Flegrei Volcanic Area, Italy. Front. Earth Sci. 6:63. doi: 10.3389/feart.2018.00063
Received: 29 January 2018; Accepted: 11 May 2018;
Published: 08 June 2018.
Edited by:
Davide Tiranti, Agenzia Regionale per la Protezione Ambientale (ARPA), ItalyReviewed by:
Nadia Solovieva, University College London, United KingdomCopyright © 2018 Esposito, Matano and Scepi. This is an open-access article distributed under the terms of the Creative Commons Attribution License (CC BY). The use, distribution or reproduction in other forums is permitted, provided the original author(s) and the copyright owner are credited and that the original publication in this journal is cited, in accordance with accepted academic practice. No use, distribution or reproduction is permitted which does not comply with these terms.
*Correspondence: Fabio Matano, ZmFiaW8ubWF0YW5vQGNuci5pdA==
Disclaimer: All claims expressed in this article are solely those of the authors and do not necessarily represent those of their affiliated organizations, or those of the publisher, the editors and the reviewers. Any product that may be evaluated in this article or claim that may be made by its manufacturer is not guaranteed or endorsed by the publisher.
Research integrity at Frontiers
Learn more about the work of our research integrity team to safeguard the quality of each article we publish.