- 1Department of Computer Science and Engineering, NITTE Mahalinga Adyantaya Memorial Institute of Technology, NITTE Deemed to Be University, Karkala, Karnataka, India
- 2Department of Computer Science and Engineering, Government Engineering College, Chamarajanagar, Karnataka, India
- 3Department of Computer Science and Engineering, Vidhya Vardhaka College of Engineering, Mysore, Karnataka, India
- 4Department of Electronic and Computer Engineering (The Graduate School of Science and Engineering), Ritsumeikan University, Kusatsu, Shiga, Japan
1 Introduction
The evolution of Deep Learning (DL) methodologies has significantly enhanced the field of medical Imaging, particularly in the interpretation of chest radiographs (CXRs). Among these advancements, Convolutional Neural Networks (CNNs) have emerged as a paramount technology for processing and Classifying CXR images and demonstrating exceptional proficiency in detecting COVID-19-related signs (Perumal et al., 2020). Although Reverse Transcription Polymerase Chain Reaction (RT-PCR) tests surpass CXRs in accuracy and reliability for virus detection, the latter remains an ubiquitous tool in clinical practice (Giri and Rana, 2020). RT-PCR excels in early detection capabilities, enabling prompt treatment initiation, and uniquely identifies the virus in asymptomatic individuals through the analysis of: Saliva samples, throat samples, and nasal passage samples, demonstrating superior performance over CXR evaluations in these aspects.
A recent investigation employed a Convolutional Neural Network (CNN) model to distinguish between:
• Normal chest radiographs.
• Pneumonia-infected.
• COVID-19 affected individuals.
The CNN model, trained on an extensive dataset comprising images from:
• Patients diagnosed with pneumonia.
• Those testing positive for COVID-19.
Healthy subjects achieved a remarkable precision rate of 97.6% in identifying COVID-19 cases on chest radiographs (CXR). This exceptional level of precision surpasses that of traditional CXR diagnostic techniques, demonstrating the potential of deep learning algorithms to improve diagnostic accuracy (Wang and Lin, 2020). In the current healthcare landscape, the surge in demand for intensive care units (ICUs) has exposed the capacity constraints of healthcare systems in several developed countries. The influx of patients suffering from COVID-19-induced pneumonia into the ICU underscores this pressing challenge, highlighting the need for effective diagnostic tools and strategies to manage the burden on healthcare resources (Kermany et al., 2018).
The system employs relational feature intelligence to analyze and interpret the interactions among various elements within an image, enabling the assessment of:
• Spatial relationships.
• Dynamics between different components.
This capability facilitates the evaluation of:
• Tumor-tissue interactions.
• Inter-organ relationships (e.g., heart-lung interactions) which is crucial for diagnosing conditions like:
∘ Heart failure.
∘ Pulmonary embolism.
The relational feature intelligence of the system enables the analysis of complex interactions within medical images, providing valuable information on spatial relationships and dynamics between different elements (Ai et al., 2020; Ng et al., 2020; Kong and Agarwal, 2020). This capability is particularly beneficial in:
• Oncology (accurate diagnosis and treatment planning).
• Cardiovascular and pulmonary diseases (diagnosing conditions like heart failure and pulmonary embolism).
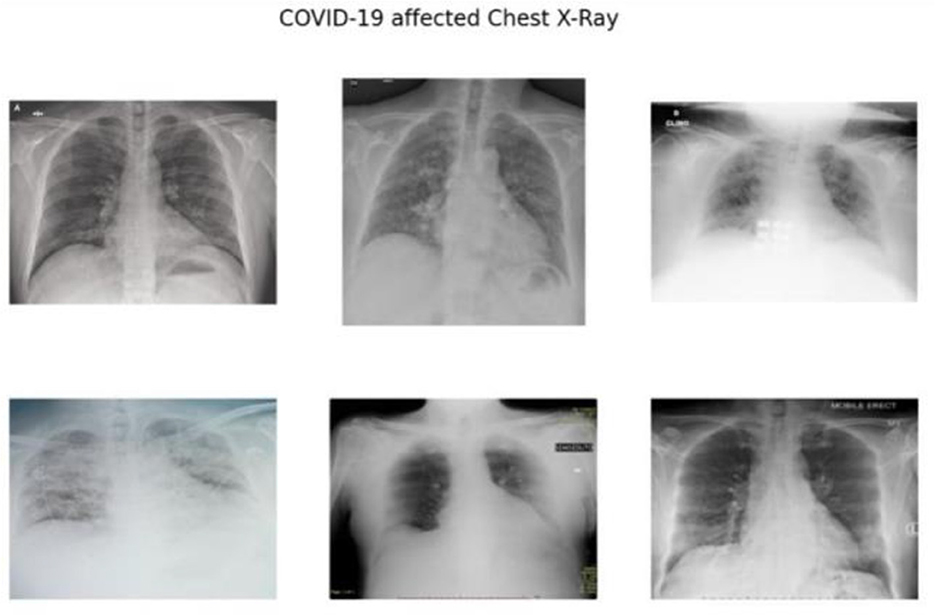
As depicted in Figure 1, the radiographic features characteristics of COVID-19 typically encompass:
• Bilateral and lower-zone dominant ground-glass opacities (GGOs).
• Consolidations, predominantly peripheral in distribution.
• Interlobular septal thickening.
• Pleural effusions.
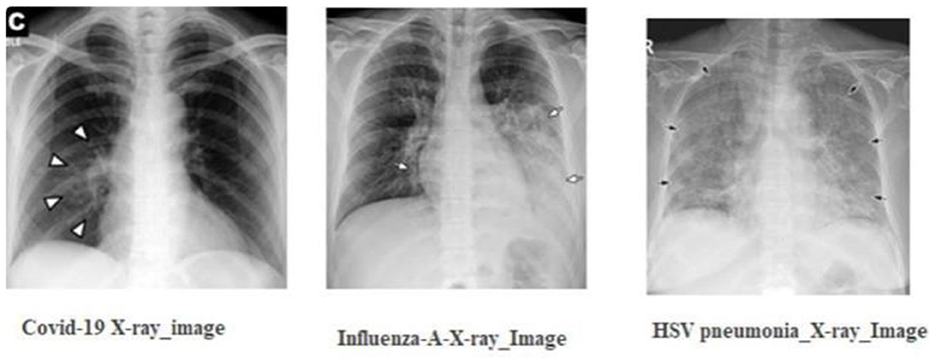
Figure 1. The radiographic characteristics indicative of COVID-19, showing bilateral and lower-zone dominant ground-glass opacities (GGOs) along with consolidations.
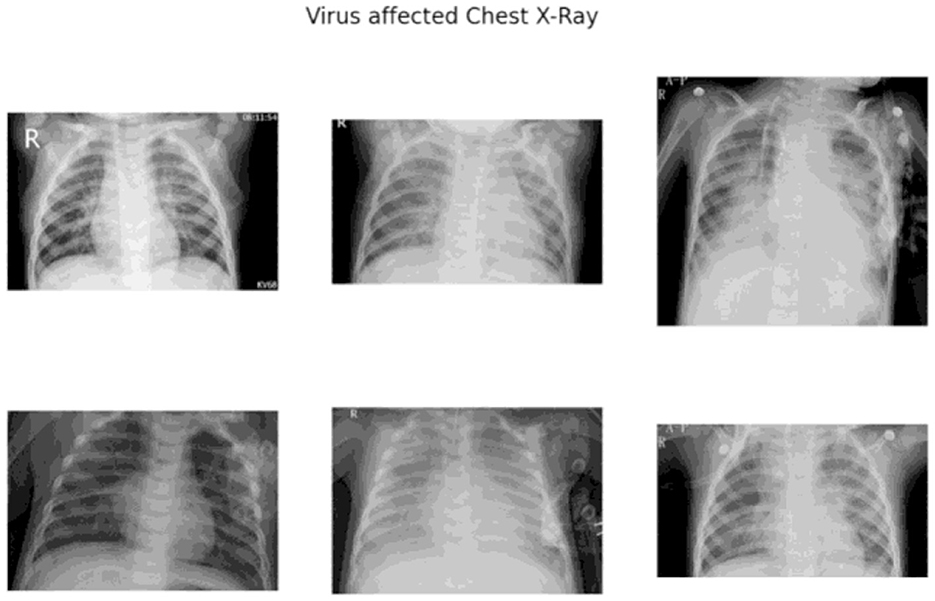
In contrast, viral pneumonia caused by non-SARS-CoV-2 viruses, such as influenza-A, tends to exhibit:
• Unilateral, central, and upper-zone dominant GGOs and consolidations Using these distinctions, medical experts advocate the concurrent use of:
∘ Chest radiography.
∘ Nucleic acid amplification tests
as a primary diagnostic strategy for early identification of this novel pneumonia strain.
The primary objective of this examination is to detect the presence of the virus within a patient, which is achieved through the analysis of specific biomarkers (Choe et al., 2019). To augment this assessment, medical practitioners often employ a multimodal diagnostic approach, incorporating additional methodologies such as:
• Antibody tests,
• Antigen tests, and
• Radiographic analysis via chest X-rays
to verify infection and facilitate accurate diagnosis. However, it is crucial to acknowledge that these supplementary tests may not always yield precise outcomes, highlighting the necessity for their combined application with other diagnostic techniques to ensure a definitive diagnosis.
A significant limitation of this specific examination is the considerable:
• Processing time
• Expenses
associated with its execution, which may hinder its applicability in resource-constrained settings.
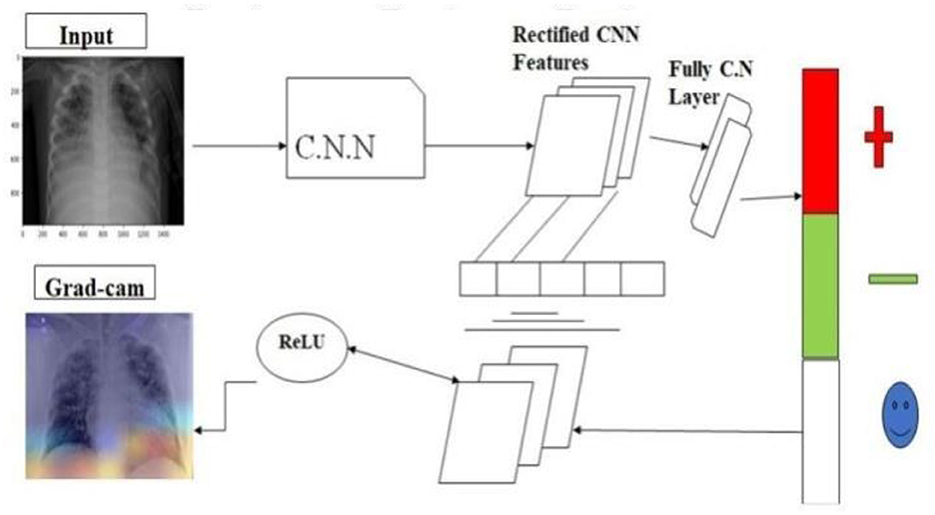
To minimize diagnostic errors, healthcare professionals are advised to utilize automated imaging analysis software, powered by artificial intelligence (AI), when interpreting X-ray photographs. These advanced tools excel at identifying complex patterns within images, thereby improving diagnostic accuracy. Additionally, to maintain a high level of diagnostic precision, medical staff should take periodic breaks to avoid fatigue and seek second opinions from colleagues to ensure reliability and accuracy. Innovations in diagnostic methodologies, such as the integration of AI and machine learning (ML) technologies, can significantly reduce both the time and financial costs associated with diagnostic processes, enhancing efficiency and reliability. Specifically, AI and ML can accelerate and refine disease diagnosis by analyzing medical data. In addition, digital biomarkers, such as data from wearable technologies, offer real-time information, enabling the early detection and monitoring of various health conditions. The synergy of ML and AI has facilitated the development of sophisticated algorithms capable of detecting and diagnosing diseases with remarkable precision. These advancements have transformed the diagnostic landscape, enabling healthcare professionals to make more accurate and timely diagnoses (Simonyan and Zisserman, 2015). Artificial intelligence (AI)-empowered systems can efficiently process vast datasets, enhancing the capacity for early disease detection and the formulation of customized treatment plans. The advent of telemedicine and remote monitoring tools enables healthcare practitioners to oversee patient health remotely, providing timely interventions when necessary. This approach has been particularly advantageous during the pandemic. Pre-trained models can address complex issues with speed and accuracy, offering a significant advantage in medical diagnostics. Leveraging pre-trained models reduces the time and resources required for training a model from scratch, while enhancing precision. These models facilitate knowledge transfer across different domains, enabling more efficient and accurate solutions. The Grad-CAM algorithm serves as a visualization tool, elucidating the decision-making process of convolutional neural networks (CNNs). By utilizing gradients pertaining to a selected target class, Grad-CAM generates a localization map highlighting pivotal areas within an image critical for identifying a specific concept. This study introduces a comprehensive transfer model for synchronous COVID-19 detection and visualization of affected areas using X-ray imaging (He et al., 2016).
Unlike prior research, our work focuses on COVID-19 detection via X-ray images. Given the pressure on healthcare systems, it is crucial to leverage every available resource efficiently. Integrating the Grad-Cam localization feature aids in identifying COVID-19 and assessing severity, assisting in determining whether immediate healthcare intervention is needed (Selvaraju et al., 2016). In our investigation, we leveraged a diverse range of pre-trained models for the classification task, including:
• ResNet34.
• ResNet50.
• EfficientNet-B4.
• EfficientNet-B5 architectures.
The incorporation of Grad-CAM into our methodology enabled the precise identification of affected regions, with the EfficientNet architecture being utilized for its exceptional:
• Efficiency.
• Effectiveness.
The utilization of pre-trained models offers significant advantages, primarily due to their pre-learned weights, which make them exceptionally valuable even when working with limited datasets. This constitutes the primary benefit of integrating pre-trained models into our investigative approach. Additionally, the employment of pre-trained models reduces the:
• Computational power
• Resources required for training
making them a computationally efficient option.
To address the variability in light intensity of the captured images, we applied the Contrast Limited Adaptive Histogram Equalization (CLAHE) technique to enhance image quality, ensuring a more accurate analysis. This preprocessing step enabled the:
• Improvement of image contrast
• Reduction of noise
ultimately leading to more reliable results.
2 Contribution of the work
In this study, we leveraged publicly accessible datasets of X-ray images as the primary experimental medium. The architecture of our experiment is designed as an end-to-end system, eliminating the need for manual feature extraction or selection, thereby streamlining the process for enhanced efficiency and effectiveness. We employed the Grad-CAM technique in conjunction with a Convolutional Neural Network (CNN) model to improve the diagnostic accuracy of our system. The integration of Grad-CAM enables the visualization of feature importance, allowing us to identify the most relevant regions in the X-ray images for diagnostic decision-making. By utilizing this approach, we aimed to develop a robust and accurate diagnostic system, capable of automatically detecting, and localizing abnormalities in X-ray images, thereby assisting clinicians in making informed decisions.
2.1 Methodological framework
The core of our methodological approach integrates the Gradient-weighted Class Activation Mapping (Grad-CAM) technique with Convolutional Neural Network (CNN) architectures, aiming to refine diagnostic precision through the following formulation:
where LGrad − CAM represents the localization map highlighting regions of interest, denotes the weights for the k-th feature map Ak contributing to a target class c, and ReLU ensures the activation map focuses on features positively influencing the class prediction.
For classification purposes, we employed a selection of pre-trained models:
• ResNet34 and ResNet50 and
• EfficientNet-B4 and EfficientNet-B5,
fine-tuned to adapt their learned representations to our specific task. This process exploits the models' preexisting knowledge, significantly economizing on computational resources and training time.
The Grad-CAM heatmap is computed using the equation: L Grad-CAM = ReLU (∑ k Ak). This equation is crucial in visualizing the regions of the input image that significantly influence the model's decision-making process. In our study, we utilize the feature maps A k from the last convolutional layer of the CNN and importance weights a k e derived from the gradients of the predicted class score with respect to Ak. These weights represent the contribution of each feature map to the prediction. The ReLU function ensures that only positive contributions are considered, highlighting the most relevant regions for class prediction. This equation enables the generation of Grad-CAM heatmaps, which are overlaid on original chest X-rays to help clinicians identify critical regions that influence the model's classification.
2.2 Analytical approach
Our investigation scrutinizes the influence of the characteristics of the data set and image processing techniques on the precision of disease detection. This entails a dual analysis approach:
2.2.1 Dataset analysis
where Δ accuracy measures the change in diagnostic accuracy as a function of dataset balance and image enhancement techniques.
2.2.2 Image enhancement
The employment of image enhancement, particularly for X-ray and CT-Scan images, was operationalized through the application of Contrast Limited Adaptive Histogram Equalization (CLAHE), aiming to ameliorate image quality for more accurate diagnostic interpretation.
2.2.3 Justification of using these models
When selecting models for this research, several factors were considered to ensure the best choices for the task at hand. First, computational feasibility was evaluated. While models like DenseNet and Inception are powerful, they require significant computational resources without offering substantial accuracy improvements over other options. So, more efficient architectures that strike a balance between performance and computational demands were selected. The selected models are known for their ability to adapt well to different datasets, which is crucial given the variations in chest X-ray imaging conditions. By considering these factors, the research offers the best combination of accuracy, efficiency, and generalizability.
2.3 Hyperparameter tuning and sensitivity analysis
2.3.1 Sensitivity analysis
To evaluate the model's robustness, sensitivity analyses were performed on key hyperparameters.
2.3.2 Learning rate sensitivity
A significant performance drop was observed when the learning rate deviated from the optimal value of 10−3, highlighting its crucial role in convergence. To address this, a learning rate scheduler was employed to dynamically adjust the learning rate upon validation loss plateauing.
2.3.3 Batch size sensitivity
Increasing the batch size to 64 negatively impacted performance due to poorer gradient estimates on limited GPU memory. Conversely, smaller batch sizes increased training time.
2.3.4 Dropout rate sensitivity
Dropout rates below 0.2 led to overfitting, characterized by high training accuracy but low validation accuracy. In contrast, dropout rates above 0.5 hindered the learning process.
2.3.5 Optimizer sensitivity
The Adam optimizer demonstrated robustness for the dataset used in this study, showing less sensitivity to small learning rate changes compared to SGD.
3 Literature survey
The collaborative efforts of Eduardo A. Soares, Plamen P. Angelov, and Sarah Biaso have culminated in a significant contribution to the field of medical imaging for infectious diseases. They have developed and made publicly available a comprehensive dataset of CT scans specific to SARS-CoV-2, enabling the advancement of diagnostic capabilities.
The team crafted an innovative algorithm, meticulously training it on CT scans from both:
• Confirmed SARS-CoV-2 positive patients.
• Patients without the infection.
This training phase was followed by a rigorous testing phase, where the algorithm's efficacy was validated on a distinct dataset encompassing CT scans from individuals with and without SARS-CoV-2 infection.
The outcomes of this testing phase demonstrated the algorithm's precision in accurately detecting SARS-CoV-2 infection, highlighting its potential utility in enhancing diagnostic processes within clinical settings. This contribution has the potential to significantly impact the field of medical imaging for infectious diseases, improving patient outcomes and streamlining diagnostic procedures (Soares et al., 2020). In a groundbreaking study, Sara Haseli and Nastaran Khalili have significantly advanced our understanding of COVID-19 pneumonia through comprehensive radiological analysis of chest CT imaging. Their research elucidated distinct hallmark features characteristic of the condition, including:
• Bilateral ground-glass opacities.
• Consolidation.
• Interlobular septal thickening.
These findings align with established diagnostic criteria for COVID-19 pneumonia, providing critical insights into the disease's pulmonary manifestations.
Furthermore, their investigation revealed additional complications in a subset of patients, including:
• Pleural effusions.
• Lymphadenopathy.
• Pulmonary embolism.
These findings broaden our understanding of the disease's impact on pulmonary structures, underscoring the importance of vigilant radiological monitoring and timely diagnosis (Haseli et al., 2020). In terms of pulmonary involvement, the posterior segment of the left lower lobe (LLL) was identified as the most frequently affected segment, exhibiting a high propensity for involvement. Additionally, significant instances of involvement were observed in the right middle lobe (RML) and the right lower lobe (RLL), suggesting a bilateral distribution of pulmonary affliction. Upon analyzing the data based on lobar distribution, the LLL exhibited the highest frequency of affliction, with the RLL and RML closely following in prevalence, indicating a relatively even distribution of pulmonary involvement across the lobes (Li et al., 2020a).
Upon examining the demographics of age and gender in relation to chest CT imaging outcomes, a notable pattern emerged, suggesting a gender-specific predilection for lobar involvement. Male patients exhibited a significant propensity for left lower lobe (LLL) involvement, whereas female patients demonstrated a tendency toward more frequent involvement of the right lower lobe (RLL). Further analysis revealed a distinct age-related pattern, with the left lower lobe (LLL) being predominantly affected in the older population (65 years). In contrast, the right lower lobe (RLL) showed a higher incidence of involvement among younger individuals (<65 years). These findings suggest that age and gender may play a role in determining the lobar distribution of pulmonary involvement (Narin et al., 2021).
Wang et al. developed a cutting-edge algorithm for the detection of COVID-19 pneumonia via chest CT image analysis, leveraging an adapted Inception transfer-learning framework. The algorithm's performance was rigorously validated through both internal and external validation processes, demonstrating its efficacy in identifying COVID-19 pneumonia with a high degree of accuracy (Islam et al., 2020).
In their investigative study, Ali Narin and Ceren Kaya put forward three models grounded in convolutional neural network technologyaˆ C”ResNet50, InceptionV3, and InceptionResNetV2aˆ C”for the purpose of identifying coronavirus pneumonia from chest X-ray images. These models underwent rigorous evaluation on a dataset that included both confirmed COVID-19 cases and cases of conventional viral pneumonia, demonstrating the application of advanced deep learning techniques in the differentiation and diagnosis of respiratory illnesses (Saha et al., 2020; Wang et al., 2020; Song et al., 2021). In a pioneering approach, the developed system leveraged a hybrid architecture, synergistically integrating a Long Short-Term Memory (LSTM) classifier with a Convolutional Neural Network (CNN) dedicated to feature extraction and selection. The system's performance was rigorously evaluated using a dataset comprising 421 cases, including 141 instances with features indicative of COVID-19. Following the completion of its training phase, the model demonstrated exceptional performance capabilities, adeptly categorizing images as either COVID-19 positive or negative. The evaluation of the model's efficacy involved the application of 10-fold cross-validation, yielding an impressive accuracy rate of 97.3%. This remarkable achievement underscores the system's potential in medical imaging analysis, showcasing its ability to accurately classify images and support diagnostic decision-making (Mohammad and Abolfazl, 2020; Islam et al., 2020; Alharbi et al., 2022). Extensive validation was conducted on an independent dataset of chest X-ray images, where the proposed model achieved an exceptional accuracy of 97.7%. This remarkable performance demonstrates the model's precision in distinguishing COVID-19 cases, showcasing its potential in medical imaging analysis. The utilized dataset comprised 88 confirmed instances of COVID-19, 101 cases of bacterial pneumonia, and 86 instances classified as normal based on CT scan analyses. Comparative assessments were conducted to evaluate the model's performance relative to traditional frameworks, including Res-Net, Dense-Net, and VGG16. The results underscore the proposed model's enhanced performance, demonstrating its effectiveness through rigorous analysis (Singh et al., 2022; Alharbi et al., 2022a,b).
3.1 Multi-modal bone suppression, lung segmentation, and classification approach
This study combines bone suppression and lung segmentation with multi-modal classification to improve COVID-19 detection accuracy. By isolating lung regions, the model reduces noise from surrounding structures, enhancing diagnostic performance. This approach refines lung images, contributing to more accurate identification of COVID-19 in chest X-rays (Li et al., 2020b; Shi et al., 2021).
3.2 Comparative study of linear type multiple instance learning techniques
This comparative study investigates various linear multiple instance learning (MIL) models applied to COVID-19 detection in chest X-rays. Analyzing how linear MIL models handle weakly labeled data, the study identifies effective techniques for classifying X-ray images without extensive manual annotations. The findings reveal that certain MIL techniques can efficiently pinpoint COVID-19 indicators, making them suitable for large-scale screenings (Ching et al., 2018; Wang et al., 2017).
3.3 Convolutional neural network techniques
CNN-based methods have shown significant promise in detecting COVID-19 from X-ray images. This research explores CNN architectures designed for medical image analysis, fine-tuned to identify COVID-19′s unique patterns in X-rays. Using convolutional layers that capture spatial features, CNNs offer high sensitivity in recognizing infection signs, allowing for robust classification (Wang and Lin, 2020; Apostolopoulos and Mpesiana, 2020).
3.4 Machine learning techniques
Beyond deep learning, various machine learning algorithms have been applied to COVID-19 classification in chest X-rays. These techniques include support vector machines (SVMs), decision trees, and ensemble methods. The study highlights the effectiveness of these algorithms in scenarios with limited data, where traditional machine learning methods can outperform deep learning models by leveraging feature extraction and selection methods. These studies demonstrate the potential of AI techniques in enhancing COVID-19 detection accuracy using chest X-rays. Each approach offers unique strengths, and their combination could lead to more effective diagnosis and treatment (Ozturk et al., 2020; Hemdan et al., 2020).
4 Materials and methods
4.1 Dataset description
While our dataset provides a substantial amount of data for training and evaluating our model, it's important to acknowledge its limitations. The dataset may not fully capture the diversity of COVID-19 cases seen across different populations and imaging conditions, which could impact the generalizability of our model's predictions in real-world clinical settings. For instance, variations in demographics, geographic regions, and imaging equipment could affect the robustness of our model, particularly when applied to data from populations or conditions not represented in the training dataset. To address this limitation, future work should consider incorporating datasets from a broader range of demographics and imaging environments. This would enhance our model's adaptability and effectiveness in diverse healthcare contexts, ensuring that it can provide accurate predictions for a wide range of patients and scenarios. By expanding our dataset in this way, we can increase the confidence in our model's performance and its potential to improve patient outcomes in real-world clinical settings.
The diagnosis of COVID-19 in this study is conducted through the analysis of pulmonary (chest) X-ray images. The dataset is categorized into three primary classes:
• COVID-19.
• Normal.
• Pneumonia.
Sourced from the COVID-19 Radiography Database available on platforms such as Kaggle and Mendeley data, the dataset encompasses a total of 9,300 images, distributed across the classes as follows:
COVID-19: 800 images.
Normal: 2500 images.
Pneumonia: 5,000 images.
5 Dataset allocation
The allocation of the dataset for various purposes is segmented as follows:
• Evaluation: 30% of the total dataset.
• Training and Validation: 70% of the total dataset.
Furthermore, within the Training + Validation subset, the images are divided into:
Training: 70%
Validation: 30%
6 Visualization
The distribution and representation of all three subsets (COVID-19, Normal, and Pneumonia) are illustrated in Figures 2, 3.
6.1 Convolutional layers
Convolutional layers are a fundamental component of Convolutional Neural Networks (CNNs), primarily due to their ability to utilize learnable kernels that perform convolutions across the spatial dimensions of the input data. The convolution operation can be mathematically expressed as:
where f[m] denotes the input function, s[m − q] represents the shifting function, and (f*s)[q] corresponds to the output of the convolution operation, resulting in the generation of feature maps that capture spatial hierarchies in the data.
6.2 Fully connected and classification layers
While convolutional layers are responsible for extracting hierarchical features, fully connected layers serve as classifiers, mapping the learned features to output classes through matrix multiplication. These layers interpret the high-level features extracted by the convolutional layers, with the aim of accurately classifying the input data.
6.3 Pooling layers
Pooling layers are designed to reduce the spatial dimensions of the input data, thereby condensing the information and retaining the most salient features. A common pooling operation is max pooling, mathematically represented as:
where O is the output of the pooling operation over a region R, and xi,j are the input features within the pooling window. This operation effectively down samples the input while preserving the most significant activations.
6.4 Relationship between input and output feature map sizes
The dimensions of the output feature map are determined by the stride and filter size used during the convolutional operation, as described by the following equation:
The equation Output_size = 1 + (Input_size – Filter_size)/Stride is a fundamental concept in convolutional operations, determining the dimensions of the output feature map after applying a convolution operation to an input image. In our study, this equation plays a crucial role in designing and understanding the architecture of CNN models. The input size, filter size, and stride are critical parameters that affect the dimensionality reduction and feature extraction capabilities of the network. By using this equation, we can ensure that the network architecture is compatible with the input image dimensions and optimize computational efficiency. This equation is essential for understanding how CNN models process visual data and make predictions, as illustrated in Figure 4.
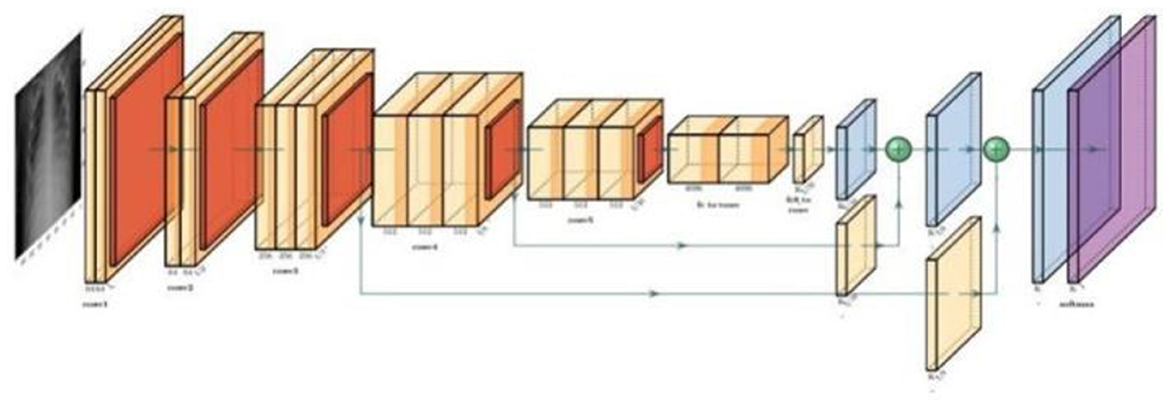
Figure 4. Illustration of the dimensionality ratio calculated by dividing the output feature map size by the input feature map size.
6.5 ResNet architecture
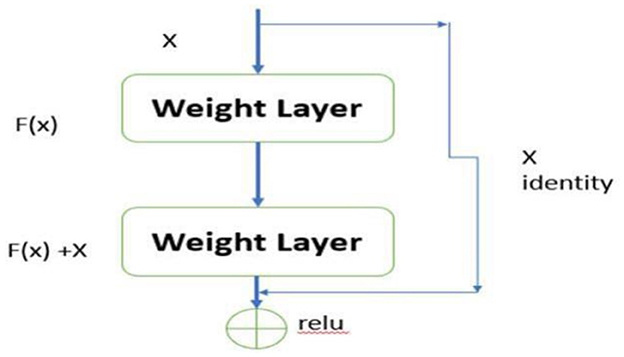
Residual Networks (ResNets) introduce an innovative architecture in deep learning designed to effectively mitigate the vanishing gradient problem, a significant challenge in training deep neural networks. As the network depth increases, the gradients often become exceedingly small, rendering weight updates ineffective and hindering the network's ability to learn and converge. ResNets address this issue through the use of skip connections, a key architectural feature that facilitates better gradient flow.
6.6 Residual learning framework
The skip connections, also known as residual connections, provide an alternative pathway for gradients to propagate, thereby bypassing one or more layers. The fundamental concept of ResNets can be mathematically expressed as:
In this equation, x represents the input to a layer, F(x, {Wi}) denotes the residual function to be learned by the network, and y is the output of the layer. The inclusion of the term x allows the network to skip certain layers, ensuring that the gradient can be propagated directly back through the network without significant reduction in magnitude. This mechanism is crucial for maintaining the effectiveness of gradient-based learning in deep networks, as depicted in Figure 5.
6.7 Impact on deep learning
The introduction of ResNets has significantly impacted various domains within deep learning, including but not limited to image recognition, object detection, and natural language processing. Furthermore, their application extends to medical imaging, where they facilitate tasks such as tumor detection and segmentation.
6.8 EfficientNet architecture
The EfficientNet architecture introduces a holistic optimization strategy that synergistically combines advanced convolutional techniques with squeeze-and-excitation modules. Its primary objective is to enhance model efficiency and accuracy without incurring a proportional increase in computational demands, thereby achieving a optimal tradeoff between performance and computational resources.
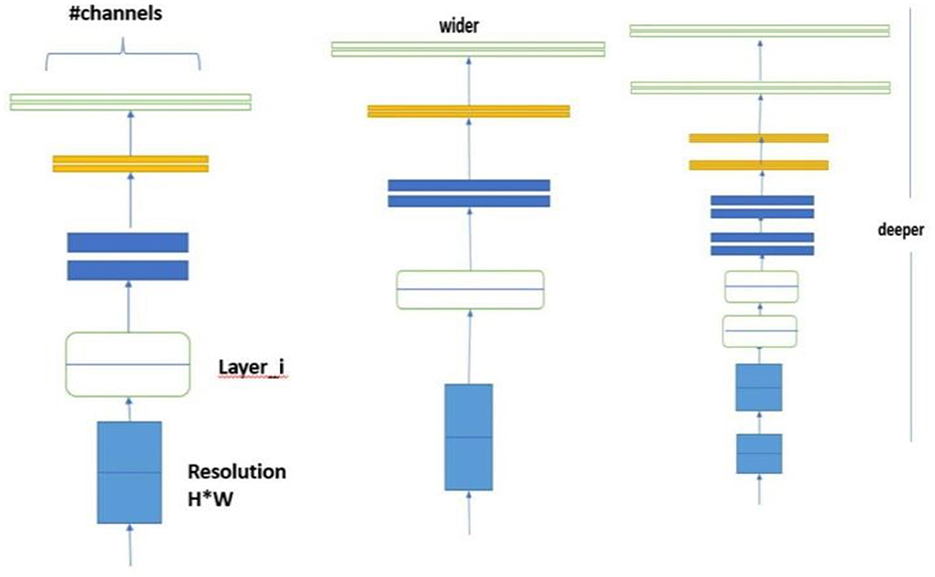
6.9 Compound scaling method
The core of Efficient Net's design philosophy lies in the compound scaling method which achieves a balanced scaling of the network's dimensions depth, width, and resolution. This approach is mathematically formalized as:
where φ is a user-defined coefficient that determines the scaling of the model based on the available computational resources. The constants α, β, and γ defines the specific scaling factors for each dimensions depth, width, and resolution, respectively. The constraints ensure a balanced scaling across these dimensions, optimizing the model's performance while maintaining computational efficiency.
The compound scaling formula is a crucial component of EfficientNet, balancing image resolution, network depth, and width scaling factors to optimize model accuracy and efficiency. Unlike traditional scaling methods, compound scaling ensures a proportional and systematic scaling across all three dimensions, resulting in a better-performing model without unnecessary computational costs.
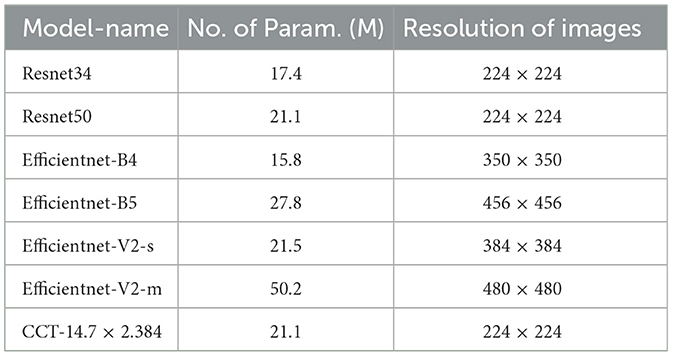
EfficientNet's compound scaling method optimizes the balance between model accuracy and efficiency. The input image resolution is scaled to 224 × 224 pixels to capture finer details without overwhelming computational resources.
6.10 Efficient convolutional block and MBConv block
To further optimize performance, EfficientNet incorporates an efficient convolutional block alongside the mobile inverted bottleneck (MBConv) block. The MBConv block, a pivotal component, enhances model efficiency through an inverted residual structure shown in Figure 6.
6.11 Transformers
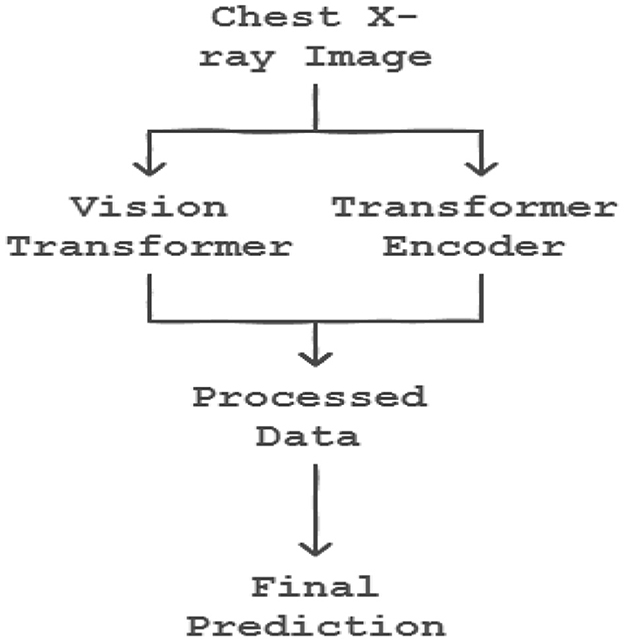
The integration of transformer encoders into CNN-based classification algorithms marks a significant advancement in machine learning, enhancing model capabilities by effectively leveraging transfer learning principles as shown in the Figure 7. In the initial training phase, a CNN model is trained on a specific dataset, resulting in a set of learned weights. These weights enable the model to classify features similar to those encountered during training. The process of transfer learning can be mathematically represented as:
where W' represents the adapted weights post-transfer learning, W denotes the original pre-trained weights, and Dnew is the new dataset. By incorporating transformer encoders, the model's ability to generalize and apply learned patterns to novel datasets is significantly enhanced. This process can be formalized as:
where Einput denotes the input embeddings fed into the transformer encoder, and Etransformed represents the output embeddings, now enriched with contextual information through the encoder's processing.
7 Proposed model of prediction system
The synergistic integration of Convolutional Vision Transformers (CVT) and Convolutional Channel Transformers (CCT) represents a groundbreaking approach in object recognition, harnessing the complementary strengths of Convolutional Neural Networks (CNNs) and transformers to process images with enhanced efficacy. This innovative methodology enables a comprehensive and holistic analysis of images, significantly improving the model's efficiency and deployment capability. The remarkable performance of this approach is particularly evident in the classification of COVID-19 images, as illustrated in Figure 8 respectively. By combining the spatial hierarchies of CNNs with the self-attention mechanisms of transformers, CVT and CCT facilitate a more detailed and nuanced understanding of image features, leading to improved recognition accuracy and robustness. This integrated approach demonstrates a significant advancement in computer vision, enabling more effective and efficient image analysis in various applications, including medical imaging and disease.
7.1 Categorical cross-entropy loss function
The categorical cross-entropy loss function is used for multi-class classification problems. It measures the divergence between predicted and true class probabilities, penalizing predictions based on their confidence in the correct class. Regularization techniques, such as L2 regularization and dropout regularization, are applied to prevent overfitting and improve generalization. The loss function is directly tied to the SoftMax activation function in the output layer, ensuring predicted probabilities sum to 1 across all classes as shown in Equation 10.
8 Performance metrics
The metrics are defined as follows, where TP represents true positives, TN denotes true negatives, FP stands for false positives, and FN signifies false negatives:
8.1 Accuracy
Accuracy measures the proportion of true results (both true positives and true negatives) in the total number of cases examined.
8.2 Recall
Recall or Sensitivity, quantifies the proportion of actual positives correctly identified.
8.3 Specificity
Specificity measures the proportion of actual negatives correctly identified.
8.4 Precision
Precision assesses the proportion of positive identifications that were actually correct.
8.5 F1-score
The F1-Score is the harmonic mean of Precision and Recall, providing a balance between the two.
9 Experimental procedure
The primary objective of this experiment was to evaluate the performance of classification models on a dataset of X-ray images, encompassing categories such as standard, lung opacity, pneumonia, and COVID-19 cases. To ensure optimal model training and evaluation, data enhancement and balancing techniques were applied, as illustrated in Tables 1, 2.
To ensure fair and reliable model predictions, techniques were applied to address class imbalance in the dataset, which could otherwise bias the model toward overrepresented classes. Methods such as class weighting and oversampling were employed to balance the distribution among the COVID-19, pneumonia, and normal classes. Class weighting adjusted the loss function to give higher importance to minority classes, while oversampling involved duplicating samples from underrepresented classes to create a more balanced dataset. These approaches aimed to reduce bias and improve the model's ability to accurately classify images across all categories, enhancing its reliability and robustness in clinical applications.
9.1 Data preprocessing
The first step in the experimental process involved the enhancement of X-ray images using the Contrast Limited Adaptive Histogram Equalization (CLAHE) technique, mathematically represented as:
where Ioriginal is the original X-ray image, and Ienhanced is the result after applying CLAHE.
9.1.1 Image resizing
The images were resized to a uniform resolution of 224 × 224 pixels. This standardization is critical for compatibility with the input size requirements of the employed neural network architectures (e.g., EfficientNet and ResNet).
9.1.2 Data augmentation
To increase the variability of the dataset and reduce overfitting, the following augmentation techniques were applied during training:
9.1.3 Random rotations
Introduced angular variations to simulate different orientations.
9.1.4 Horizontal and vertical flipping
Created mirror-like reflections to enhance diversity.
9.1.5 Random cropping and zooming
Enabled the model to focus on varying regions of the image.
9.1.6 Brightness adjustments
Improved robustness by simulating different lighting conditions.
9.1.7 Noise reduction
Basic noise reduction filters were applied to remove potential artifacts in the X-ray images, which could otherwise interfere with the feature extraction process.
9.1.8 Histogram equalization (complementary to CLAHE)
While CLAHE specifically focuses on improving local contrast, global histogram equalization was also used as an optional step during exploratory stages to further analyze its impact on image clarity.
9.2 Dataset partitioning
The dataset was systematically divided into three distinct subsets to facilitate the classification task: training, testing, and validation. The data distribution was as follows:
Training Set: 70%.
Testing Set: 20%.
Validation Set: 10%.
9.3 Balanced dataset condition
To ensure fairness in model evaluation, the dataset was balanced, equalizing the number of images across classes. This was quantitatively managed as:
where Nclass denotes the number of images in each class.
9.4 Model training
Four models were trained using distinct versions of the dataset:
• Original dataset.
• Balanced dataset.
• Original dataset with CLAHE.
• Balanced dataset with CLAHE.
9.4.1 Original dataset
Category subcategory training testing validation
• X-ray COVID-19 700 300 100.
• Normal 4000 1000 750.
• Viral 2500 800 400.
9.4.2 Balanced dataset
Category subcategory training testing validation
• X-ray COVID-19 700 300 150.
• Normal 1500 300 125.
• Viral 1700 300 135.
10 Pre-processing
The initial phase of our image data pre-processing involved two critical steps: image enhancement using CLAHE and subsequent data augmentation. This comprehensive approach was designed to improve the quality and variability of the dataset, thereby aiding in the robustness of the subsequent classification models. To boost the quality of input images and enhance model accuracy, a technique called Contrast Limited Adaptive Histogram Equalization (CLAHE) was used to refine each image. This step improves contrast and highlights important features within X-ray images, leading to more accurate predictions. Additionally, image resolution standardization was performed to ensure consistent image sizes, making the model adaptable to various image sources and minimizing potential variability from different imaging devices. These preprocessing steps lead to a more robust model that can generalize across diverse imaging conditions, ensuring reliable performance in real-world applications.
10.1 Contrast enhancement with CLAHE
Contrast Limited Adaptive Histogram Equalization (CLAHE) was employed to enhance the visual clarity of the images. This technique is mathematically represented as:
where Ioriginal denotes the original image, and Ienhanced represents the image after contrast enhancement.
Figure 9 illustrates the effect of CLAHE on an example image from the dataset. Following the enhancement, data augmentation techniques were applied to increase the diversity of the dataset, crucial for training more generalized models. The augmentation process involved transformations such as rotations, translations, and flipping.
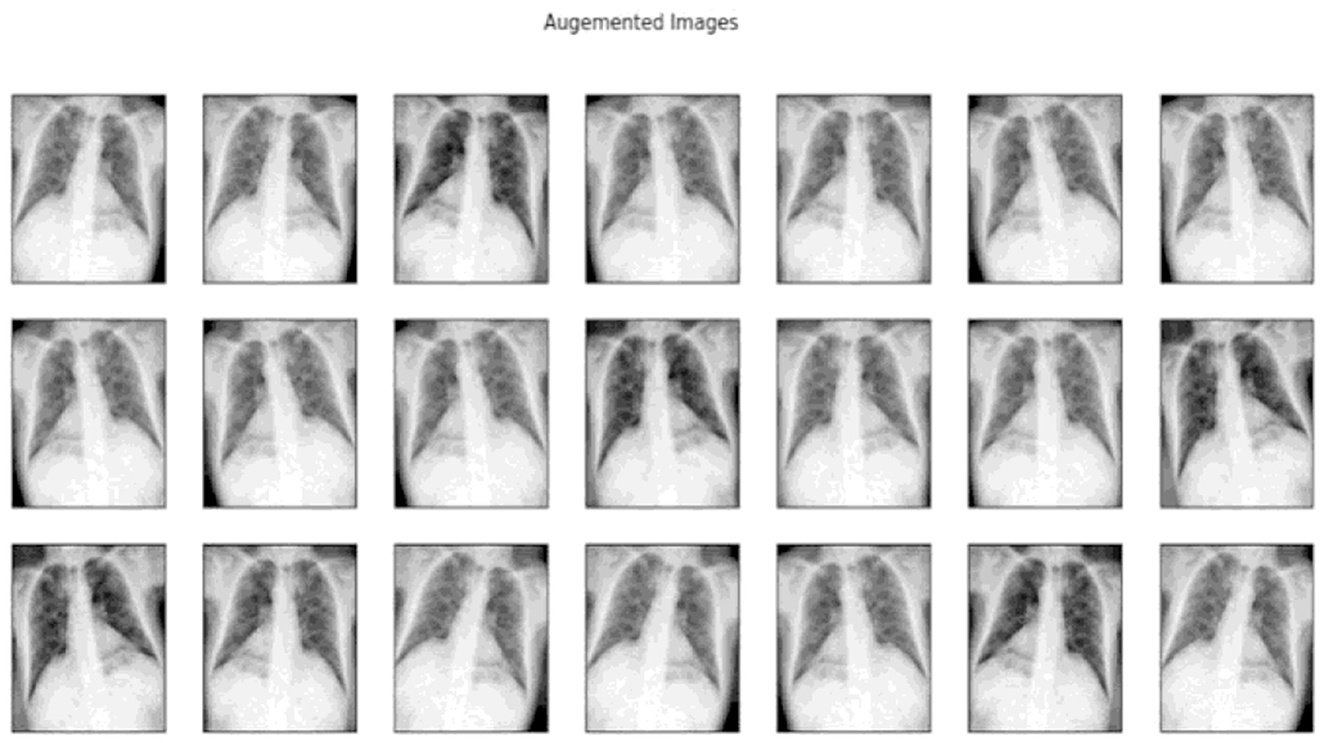
10.2 Data augmentation
Subsequent to the enhancement, data augmentation techniques were employed to increase the diversity of the dataset, a crucial step in training more generalized models. The augmentation process included a range of transformations, such as:
• Rotations: Random angular transformations to simulate varying orientations.
• Translations: Random spatial transformations to simulate different positions.
• Flipping: Horizontal and vertical flipping to simulate mirror-like reflections.
These transformations enabled the generation of a more comprehensive and diverse dataset, thereby enhancing the model's ability to generalize across various scenarios and improving its robustness in Figure 10.
11 Classification process
The datasets were subjected to preprocessing using Contrast Limited Adaptive Histogram Equalization (CLAHE), followed by division into two distinct sets: the original set and the balanced set, with and without additional enhancement. A comprehensive evaluation of various models was conducted on these datasets, assessing their performance based on accuracy and loss metrics across three phases:
• Training phase: Model training and optimization.
• Testing phase: Model evaluation on unseen data.
• Validation phase: Model validation and hyper parameter tuning.
This rigorous evaluation framework enabled a thorough analysis of model performance, facilitating the identification of optimal models and hyper parameters for the task at hand.
11.1 Experimental setup
Each model was trained over 10 epochs using a batch size of 8. The following equation represents the general form of the loss function minimized during training:
where N is the number of samples, M is the number of classes, yij is the binary indicator of class j for sample i, and pij(θ) is the predicted probability of sample i being in class j, with model parameters θ.
12 Results
To prevent overfitting and enhance the model's generalizability, several techniques were employed during training. First, cross-validation was used to ensure robust model evaluation across different data splits, which helped identify any potential overfitting to specific subsets. Additionally, data augmentation techniques such as random rotations, translations, and flips were applied to increase dataset variability and reduce the model's reliance on specific image features. Dropout layers were also incorporated within the model architecture to prevent neurons from co-adapting too strongly, which often leads to overfitting. Despite these measures, validating the model on external datasets is crucial to further assess its adaptability and effectiveness across varied real-world settings and populations. This will be a key focus of future work, as it is essential to ensure that the model can generalize well to new, unseen data, and provide accurate predictions for a diverse range of patients and scenarios.
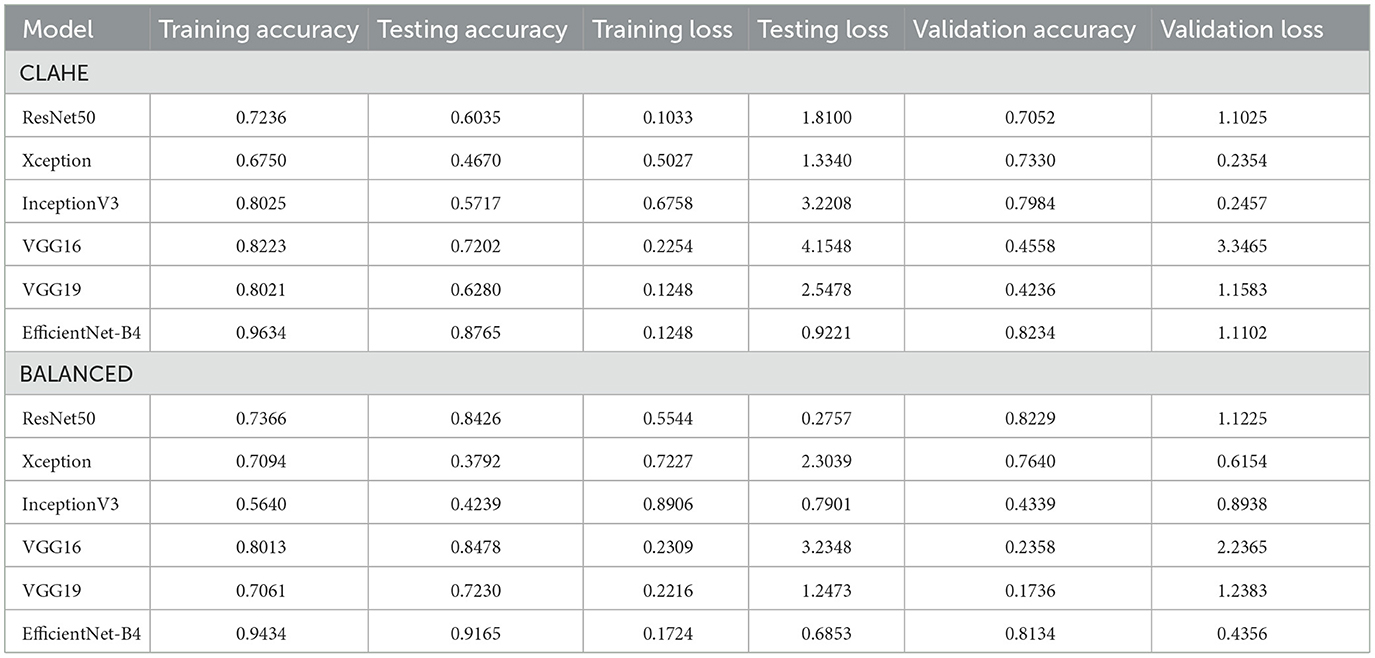
The models evaluated included Xception, InceptionV3, and InceptionResNetV2. The performance metrics revealed variations in accuracy and loss across the datasets (Table 3).
12.1 Training and testing phases
The DataLoader class, integral to our process, dynamically assigns classifications for each dataset, preparing them for submission to the network with appropriately set dimensions and normalization. Utilizing pre-trained weights from the ImageNet dataset, the neural network configuration is defined, including the number of classes and layers requiring enhancements. Each model integrates a classifier head, concluding with a ReLU function, to process the logits for each class output by the final linear layer.
12.2 Training process
Training involves selecting Cross-Entropy Loss as the loss function, Adam for optimization, and a step function for learning rate scheduling. The protocol entails training for N epochs, initially modifying only the final layer weights for the first K epochs, then adjusting the entire network's weights for the remaining N-K epochs. For CCT models, all weights are trainable from the outset. Model performance on the validation set dictates the saving of the best model at each epoch.
12.3 Testing process
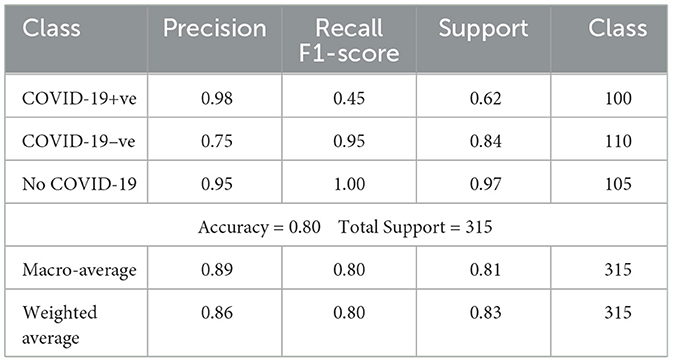
Post-training, the best model undergoes evaluation against the training, validation, and test sets. This phase includes generating a confusion matrix and calculating class-specific recall, global accuracy, and precision shown in Table 4.
12.4 Results
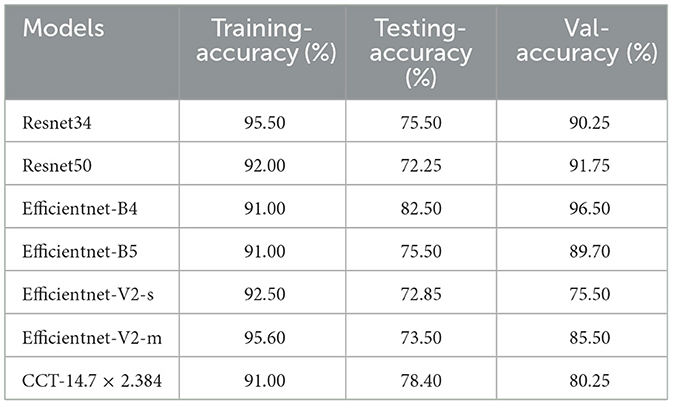
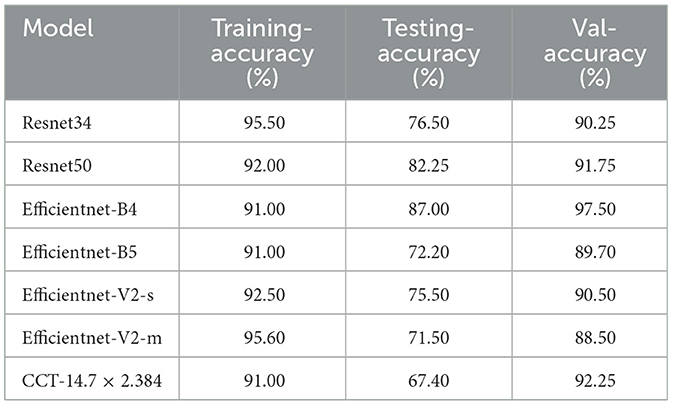
Table 5 summarizes each model's accuracy metrics across the training, testing, and validation phases. We list the results for each model accuracy on the test augmented train, and validation datasets which are shown in Table 6. Model Performance Metrics under CLAHE and BALANCED Datasets shown in Table 7.
The performance of various models was analyzed using both original, unbalanced datasets and additional, varied datasets to understand each model's generalizability and tendency toward overfitting. The mathematical representation of model accuracy, α, is defined as the ratio of correctly predicted observations, Cp, to the total observations, To.
Overfitting is quantitatively assessed by comparing training accuracy, αtrain, and validation accuracy, αval, where a significant discrepancy indicates potential overfitting:
12.4.1 Comparison with state-of-the-art models
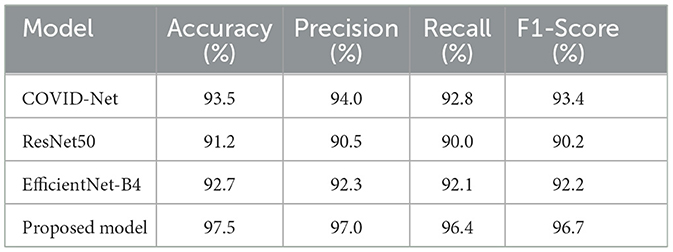
To put our model's performance into perspective, we compared it to other state-of-the-art models in COVID-19 detection using chest X-ray images. The results are summarized in Table 8, which shows key performance metrics like accuracy, precision, recall, and F1-score for each model. This comparison highlights the strengths of our approach and demonstrates its effectiveness in detecting COVID-19 from chest X-rays. By benchmarking our model against others in the field, we can see how it stacks up against the current state of the art. This comparison is essential for understanding the advancements in COVID-19 detection and how our model contributes to the ongoing efforts. Our goal is to provide a comprehensive view of the current landscape in COVID-19 detection using chest X-ray images and demonstrate the value of our approach in this critical area of research.
12.4.2 Results
Analysis revealed that MobileNet yielded the highest accuracy for the original, unbalanced dataset. Conversely, VGG16 demonstrated superior performance across all other datasets but exhibited clear signs of overfitting on the original, unbalanced dataset, as highlighted by its performance metrics.
12.4.3 Discussion
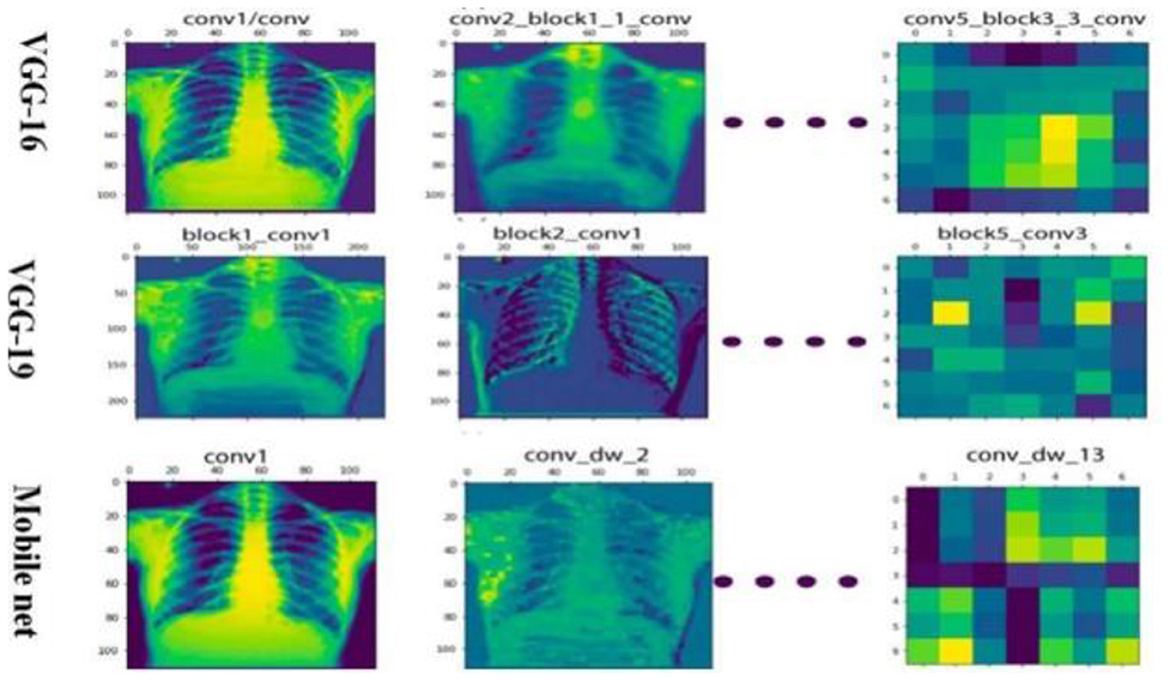
The differential performance of MobileNet and VGG16 underscores the importance of selecting appropriate models based on dataset characteristics. The observed overfitting of VGG16 on the unbalanced dataset emphasizes the need for careful model evaluation and dataset preprocessing and the heatmap generation is shown in Figure 11.
13 Localization
Disease localization in medical images is a critical step in diagnostic processes. The application of Grad-CAM to models trained on various datasets elucidates the relationship between training data quality, model accuracy, image resolution, and localization precision. Grad-CAM uses the gradients of any target concept, flowing into the final convolutional layer to produce a coarse localization map highlighting the important regions for predicting the concept. Mathematically, it can be represented as
Where is is the localization map for class c, are the weights for feature map k, Ak is the activation of k-th feature map, ReLU is applied to focus on features that have positive influence on the class of interest. Results the application of Grad-CAM on models trained with initial and enhanced 478 datasets revealed that models trained on initial data more accurately highlighted disease-affected areas. This accuracy in localization is directly proportional to the model's overall accuracy and the image resolution, described as:
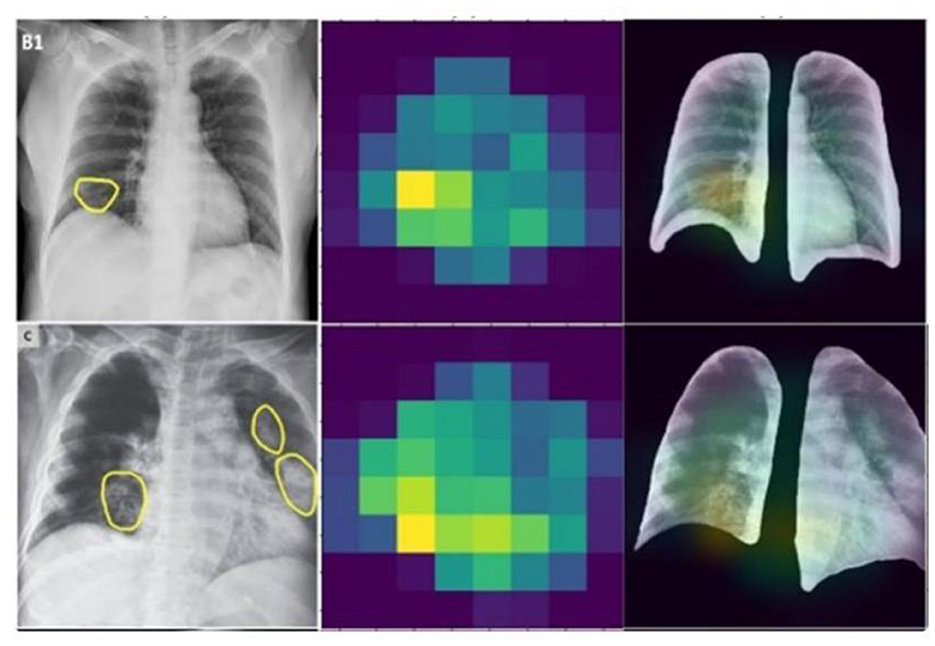
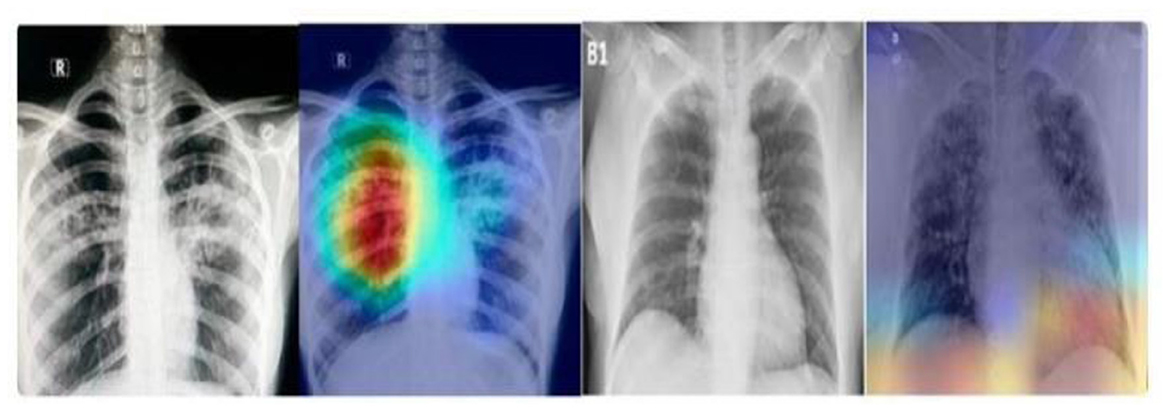
emphasizing the compounded effect of higher accuracy and better resolution on precise disease localization. Our findings underscore the importance of image quality and model accuracy for effective disease localization using Grad-CAM. The study advocates for the optimization of these factors to improve diagnostic efficiency in medical imaging as shown in Figures 12, 13.
While Grad-CAM provides valuable insights into the decision-making process behind COVID-19 predictions, deep learning models are often criticized for their lack of transparency. This “black box” nature can be a significant barrier for clinical adoption, as clinicians may struggle to understand the reasoning behind model predictions. To address this, future work could explore combining Grad-CAM with other explainability techniques, such as LIME or SHAP. These methods offer unique perspectives on model behavior, providing clinicians with a more comprehensive understanding of prediction rationales. By shedding light on the decision-making process, we can increase trust and usability in medical settings.
14 Results and discussions of the work carried out
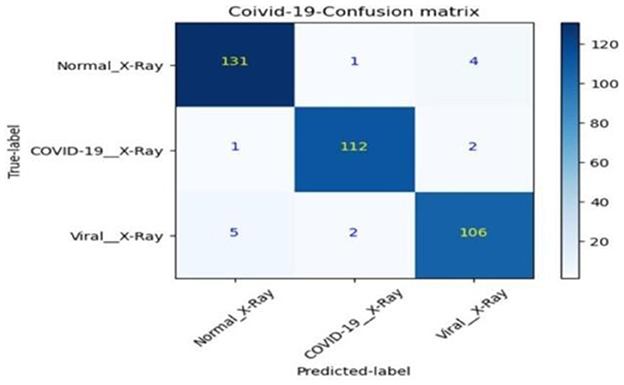
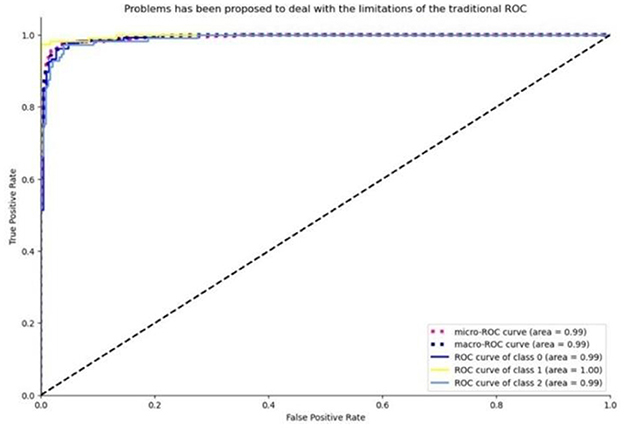
The advent of deep learning in medical imaging has facilitated the development of automated diagnostic tools. This paper presents an evaluation of transfer learning models, specifically EfficientNet and MobileNet, in the classification of chest X-ray images. Transfer learning models were trained on a comprehensive dataset comprising images categorized as COVID-19, normal, and viral pneumonia. The performance was assessed based on the accuracy of classifications, with further analysis conducted through confusion matrices and ROC curves.
14.1 Model performance
The models' diagnostic capabilities were visualized as follows:
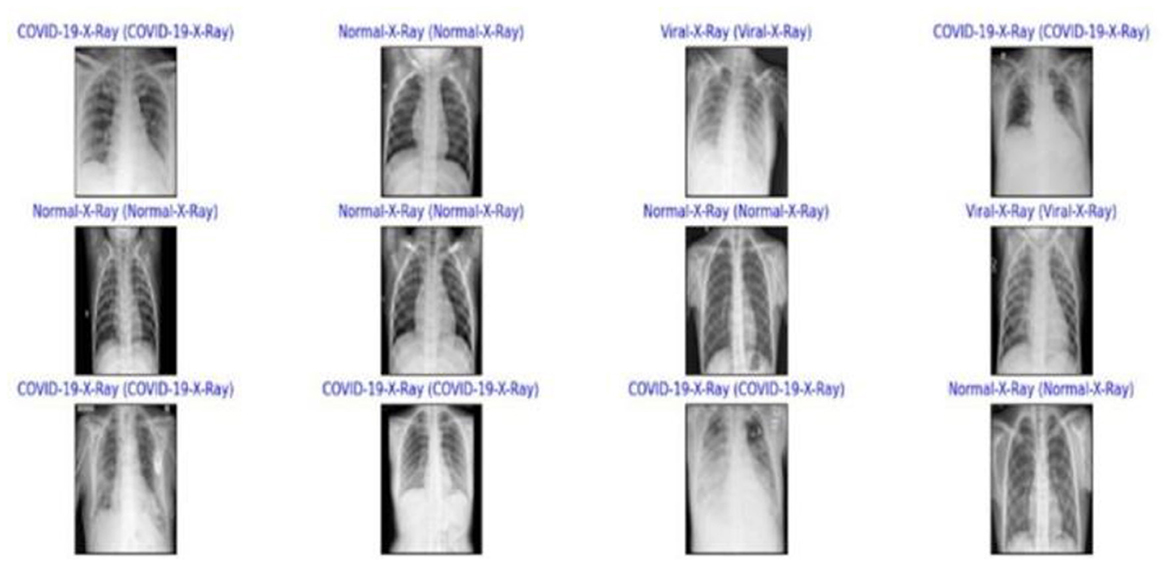
• Classification results are depicted in Figure 14.
• The confusion matrix for validation dataset diagnoses is shown in Figure 15.
• ROC curve analysis for the EfficientNet model is presented in Figure 16.
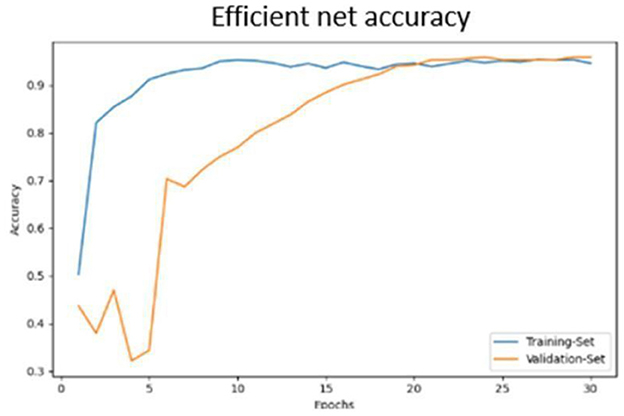
• Accuracy progression of the MobileNet model over epochs is illustrated in Figures 17, 18.
15 Conclusion
In response to the COVID-19 pandemic, our study demonstrates promising results for COVID-19 detection using chest X-rays. However, we must note that our model has not yet been tested in real-world clinical settings, which limits our ability to fully assess its performance in a practical healthcare environment. To address this, we plan to validate our model in clinical settings to evaluate its effectiveness, robustness, and potential impact on patient diagnosis and care. This will provide valuable insights into our model's applicability in different medical scenarios and move us closer to broader adoption in clinical practice. Our proposed solution leverages the power of pre-trained models and demonstrates commendable efficacy, achieving an accuracy rate of 88.48% in training and 88.1% in validation on the initial dataset. By harnessing Efficient Net-based transfer learning on a balanced and enhanced dataset, our developed models have attained exemplary performance, registering training and validation accuracies of 95.64% and 97.31%, respectively. These results not only parallel but, in some instances, surpass the accuracy levels of existing models, demonstrating the robustness of our approach. Notably, our models' enhanced capability to precisely localize affected areas significantly bolsters their diagnostic utility, providing a valuable tool for physicians in the fight against COVID-19. Our study contributes to the growing body of research in AI-assisted medical imaging, showcasing the potential of deep learning architectures to revolutionize healthcare diagnostics.
16 Future work
The future directions section would benefit from a more comprehensive roadmap. Specifically, the paper should address several promising avenues: (1) the integration of advanced explainability techniques like SHAP or LIME to enhance model interpretability; (2) validation across diverse datasets from different domains to establish broader generalizability; and (3) exploration of hybrid approaches combining the current method with emerging techniques in the field. These extensions could address current limitations while advancing the broader research agenda.
17 Limitations
First, while our dataset includes chest X-ray images, it may not fully represent the diversity of COVID-19 cases across different populations and imaging equipment. The model, though showing high accuracy in experimental settings, requires validation in real-world clinical environments to establish practical utility. While we employed Grad-CAM for visualization, we recognize that our model's interpretability could be enhanced through additional techniques like SHAP or LIME to increase clinician trust. Despite implementing class weighting and oversampling, inherent dataset imbalances persist, potentially affecting prediction reliability for minority classes. The model's computational requirements may pose challenges in resource-constrained settings, suggesting a need for architectural optimization. Although we implemented dropout and data augmentation, the high-test accuracy warrants external validation to conclusively demonstrate generalizability. Finally, our focus on X-ray imaging alone may not capture all relevant COVID-19 clinical features, indicating potential value in incorporating additional imaging modalities like CT scans or clinical data in future work.
Author contributions
AV: Writing – original draft, Conceptualization, Formal analysis, Investigation, Methodology, Project administration, Resources, Supervision, Visualization, Writing – review & editing. SB: Formal analysis, Methodology, Writing – original draft, Writing – review & editing, Validation. SP: Investigation, Project administration, Resources, Writing – review & editing. PS: Data curation, Formal analysis, Writing – review & editing. ML: Validation, Investigation, Writing – original draft, Writing – review & editing.
Funding
The author(s) declare that no financial support was received for the research, authorship, and/or publication of this article.
Acknowledgments
We want to express our sincere gratitude for the financial support provided by the Nitte, Deemed to be a University, NMAM Institute of Technology, Nitte, Karkala, Karnataka. Their funding enabled us to pursue this research and achieve our goals. We appreciate their commitment to advancing scientific knowledge and innovation.
Conflict of interest
The authors declare that the research was conducted in the absence of any commercial or financial relationships that could be construed as a potential conflict of interest.
Publisher's note
All claims expressed in this article are solely those of the authors and do not necessarily represent those of their affiliated organizations, or those of the publisher, the editors and the reviewers. Any product that may be evaluated in this article, or claim that may be made by its manufacturer, is not guaranteed or endorsed by the publisher.
References
Ai, T., Yang, Z., Hou, H., Zhan, C., Chen, C., Lv, W., et al. (2020). Correlation of chest CT and RT-pcr testing in coronavirus disease 2019 (COVID-19) in China: a report of 1014 cases. Radiology 296, E32–E40. doi: 10.1148/radiol.2020200642
Alharbi, A. H., Aravinda, C. V., Lin, M., Venugopala, P. S., Reddicherla, P. R., Shah, M. A., et al. (2022). Segmentation and classification of white blood cells using the unet. Contrast Media Mol. Imag. 571:5913905. doi: 10.1155/2022/5913905
Alharbi, A. H., Aravinda, C. V., Shetty, J., Jabarulla, M. Y., Sudeepa, K. B., Singh, S. K., et al. (2022a). Computational models-based detection of peripheral malarial parasites in blood smears. Contrast Media Mol. Imag. 2022:9171343. doi: 10.1155/2022/9171343
Alharbi, A. H., Aravinda, V. C., Lin, M., Ashwini, B., Jabarulla, M. Y., Shah, M. A., et al. (2022b). Detection of peripheral malarial parasites in blood smears using deep learning models. Comput. Intell. Neurosci. 2022:3922763. doi: 10.1155/2022/3922763
Apostolopoulos, I. D., and Mpesiana, T. A. (2020). Covid-19: automatic detection from X-ray images utilizing transfer learning with convolutional neural networks. Phys. Eng. Sci. Med. 43, 635–640. doi: 10.1007/s13246-020-00865-4
Ching, T., Himmelstein, D. S., Beaulieu-Jones, B. K., Kalinin, A. A., Do, B. T., Way, G. P., et al. (2018). Opportunities and obstacles for deep learning in biology and medicine. J. R. Soc. Interface 15:20170387. doi: 10.1098/rsif.2017.0387
Choe, J., Lee, S. M., Do, K. H., Lee, G., Lee, J. G., Lee, S. M., et al. (2019). Deep learning-based image conversion of CT reconstruction kernels improves radiomics reproducibility for pulmonary nodules or masses. Radiology 292, 365–373. doi: 10.1148/radiol.2019181960
Giri, A., and Rana, D. (2020). Charting the challenges behind the testing of COVID-19 in developing countries: Nepal as a case study. Biosaf Health. 2, 53–56. doi: 10.1016/j.bsheal.2020.05.002
Haseli, S., Khalili, N., Bakhshayeshkaram, M., Sanei-Taheri, M., and Moharramzad, Y. (2020). Lobar distribution of COVID-19 pneumonia based on chest computed tomography findings: a retrospective study. Arch. Acad. Emerg. Med. 8:e55.
He, K., Zhang, X., Ren, S., and Sun, J. (2016). “Deep residual learning for image recognition,” in Proceedings of the IEEE Conference on Computer Vision and Pattern Recognition, 770–778. doi: 10.1109/CVPR.2016.90
Hemdan, E. E. D., Shouman, M. A., and Karar, M. E. (2020). Covidx-net: a framework of deep learning classifiers to diagnose covid-19 in x-ray images. arXiv preprint arXiv:2003.11055.
Islam, M. Z., Islam, M. M., and Asraf, A. (2020). A combined deep CNN-LSTM network for the detection of novel coronavirus (COVID-19) using X-ray images. Inform. Med. Unlocked. 20:100412. doi: 10.1016/j.imu.2020.100412
Kermany, D. S., Goldbaum, M., Cai, W., Valentim, C. C. S., Liang, H., Baxter, S. L., et al. (2018). Identifying medical diagnoses and treatable diseases by image-based deep learning. Cell 172, 1122–1131. doi: 10.1016/j.cell.2018.02.010
Kong, W., and Agarwal, P. P. (2020). Chest imaging appearance of COVID-19 infection. Radiol. Cardiothorac. Imag. 2:e200028. doi: 10.1148/ryct.2020200028
Li, L., Qin, L., Xu, Z., Yin, Y., Wang, X., Kong, B., et al. (2020b). Artificial intelligence distinguishes COVID-19 from community-acquired pneumonia on chest CT. Radiology 296, E65–E71. doi: 10.1148/radiol.2020200905
Li, X. J., Shuai, B. X., Zhang, Z. W., and Kang, Y. (2020a). COVID-19 versus non-COVID-19 pneumonia: a retrospective cohort study in Chengdu, China. medRxiv 2020–04. doi: 10.1101/2020.04.28.20082784
Mohammad, R., and Abolfazl, A. (2020). A new modified deep convolutional neural network for detecting COVID-19 from X-ray images. arXiv preprint arXiv:2004.08052.
Narin, A., Kaya, C., and Pamuk, Z. (2021). Automatic detection of coronavirus disease (COVID-19) using X-ray images and deep convolutional neural networks. Pattern Anal. Applic. 24, 1207–1220. doi: 10.1007/s10044-021-00984-y
Ng, M. Y., Lee, E. Y., Yang, J., Yang, F., Li, X., Wang, H., et al. (2020). Imaging profile of the COVID-19 infection: radiologic findings and literature review. Radiol Cardiothorac. Imag. 2:e200034. doi: 10.1148/ryct.2020200034
Ozturk, T., Talo, M., Yildirim, E. A., Baloglu, U. B., Yildirim, O., and Acharya, U. R. (2020). Automated detection of COVID-19 cases using deep neural networks with X-ray images. Comput. Biol. Med. 121:103792. doi: 10.1016/j.compbiomed.2020.103792
Perumal, V., Narayanan, V., and Rajasekar, S. (2020). Detection of COVID-19 using CXR and CT images using Transfer Learning and Haralick features. Appl. Intell. 51, 341–358. doi: 10.1007/s10489-020-01831-z
Saha, G. C., Ganie, I. A., Rajendran, G., and Nathalia, D. (2020). CNN analysis for the detection of SARS-CoV-2 in human body. Int. J. Adv. Sci. Technol. 29, 2369–2374.
Selvaraju, R. R., Das, A., Vedantam, R., Cogswell, M., Parikh, D., and Batra, D. (2016). Grad-CAM: why did you say that? arXiv preprint arXiv:1611.07450.
Shi, F., Wang, J., Shi, J., Wu, Z., Wang, Q., Tang, Z., et al. (2021). Review of artificial intelligence techniques in imaging data acquisition, segmentation, and diagnosis for COVID-19. IEEE Rev. Biomed. Eng. 14, 4–15. doi: 10.1109/RBME.2020.2987975
Simonyan, K., and Zisserman, A. (2015). “Very deep convolutional networks for large-scale image recognition,” in 3rd International Conference on Learning Representations, ICLR 2015 - Conference Track Proceedings, 1–14.
Singh, D., Aravinda, C. V., Kaur, M., Lin, M., Shetty, J., Reddicherla, V. R., et al. (2022). Dknet: deep kuzushiji characters recognition network. IEEE Access 10, 75872–75883. doi: 10.1109/ACCESS.2022.3191429
Soares, E., Angelov, P., Biaso, S., Froes, M. H., and Abe, D. K. (2020). SARS-CoV-2 CT-scan dataset: a large dataset of real patients CT scans for SARS-CoV-2 identification. MedRxiv 2020–04.
Song, Y., Zheng, S., Li, L., Zhang, X., Zhang, X., Huang, Z., et al. (2021). Deep learning enables accurate diagnosis of novel coronavirus (COVID-19) with CT images. IEEE/ACM Trans. Comput. Biol. Bioinform. 18, 2775–2780. doi: 10.1109/TCBB.2021.3065361
Wang, L., and Lin, Z. Q. (2020). Covid-net: a tailored deep convolutional neural network design for detection of COVID-19 cases from chest X-ray images. Sci. Rep. 10:19549. doi: 10.1038/s41598-020-76550-z
Wang, S., Zha, Y., Li, W., Wu, Q., Li, X., Niu, M., et al. (2020). A fully automatic deep learning system for COVID-19 diagnostic and prognostic analysis. Eur. Respir. J. 56, 1–44. doi: 10.1183/13993003.00775-2020
Wang, X., Peng, Y., Lu, L., Lu, Z., Bagheri, M., and Summers, R. M. (2017). “ChestX-ray8: hospital-scale chest X-ray database and benchmarks on weakly-supervised classification and localization of common thorax diseases,” in Proceedings of the IEEE Conference on Computer Vision and Pattern Recognition, 2097–2106. doi: 10.1109/CVPR.2017.369
Keywords: deep learning, COVID-19 detection, chest X-ray analysis, convolutional neural networks, grad-CAM visualization, data augmentation, machine learning algorithms, public health informatics
Citation: V AC, B SK, Pradeep S, Suraksha P and Lin M (2024) Leveraging compact convolutional transformers for enhanced COVID-19 detection in chest X-rays: a grad-CAM visualization approach. Front. Big Data 7:1489020. doi: 10.3389/fdata.2024.1489020
Received: 03 September 2024; Accepted: 29 November 2024;
Published: 16 December 2024.
Edited by:
L. J. Muhammad, Bayero University Kano, NigeriaReviewed by:
Eugenio Vocaturo, National Research Council (CNR), ItalyCopyright © 2024 V, B, Pradeep, Suraksha and Lin. This is an open-access article distributed under the terms of the Creative Commons Attribution License (CC BY). The use, distribution or reproduction in other forums is permitted, provided the original author(s) and the copyright owner(s) are credited and that the original publication in this journal is cited, in accordance with accepted academic practice. No use, distribution or reproduction is permitted which does not comply with these terms.
*Correspondence: Sudeepa K. B, c3VkZWVwYUBuaXR0ZS5lZHUuaW4=; Aravinda C. V, YXJhdmluZGFAbml0dGUuZWR1Lmlu
 Aravinda C. V
 Sudeepa K. B
 S. Pradeep2
 Meng Lin