- Faculty of Information Science and Technology, Multimedia University, Melaka, Malaysia
Introduction: With the advancement in digital signage technology, it is now possible to carry out a roadshow operation with digital signage as the main medium of the roadshow, leading to the development of the Digital Signage Augmented Roadshow (DiSAR) framework. To foster confidence in advertisers in considering DiSAR, understanding user acceptance through a theoretical model is crucial. Therefore, this study proposes an extended Technology Acceptance Model incorporating System Quality, Perceived Interactivity and Perceived Enjoyment as antecedents and empirically analyzes its performance in modelling the user acceptance of the participants in a DiSAR.
Methods: The Technology Acceptance Model was added with constructs that best reflect the unique characteristics of the DiSAR. The additional constructs are System Quality, Perceived Interactivity and Perceived Enjoyment. To investigate the relationship between the additional constructs and the original constructs, Partial Least Squares Structural Equation Modelling was used on a sample of 203 DiSAR participants. The aim is to understand the relationship of the additional constructs towards the user acceptance of DiSAR. The explanatory and predictive power of the model was also examined to provide a more holistic view of the model’s capability to accurately predict user acceptance and identify key factors influencing the user acceptance of DiSAR.
Results: The statistical analysis revealed that System Quality and Perceived Interactivity have a significant relationship with the Perceived Ease of Use of DiSAR, while Perceived Enjoyment has a significant relationship with the Perceived Usefulness of DiSAR. Structural model analysis also showed that the Technology Acceptance Model has good explanatory power but attenuated predictive power.
Discussion: These findings contributes to understanding the overall performance of the Technology Acceptance Model in modelling the user acceptance of DiSAR participants. The findings also contribute to understanding how the unique characteristics of DiSAR influences user acceptance, which can further drive development to improve the roadshow framework itself.
1 Introduction
According to the Merriam-Webster online dictionary, a roadshow is “a promotional presentation or meeting conducted in a series of locations” (Merriam-Webster, n.d.). Roadshows are held to increase awareness, whether it is on a company’s products or on certain topics of interest. Roadshow is more effective than conventional advertising because it allows the customers to experience the content of the roadshow or anything that is being advertised in the roadshow in person in a more interactive manner. However, physical roadshows are costly for advertisers and lack reusability. To resolve these concerns, there is a need for a more sustainable way to run a roadshow. Such a roadshow framework needs to be cost-effective, flexible and scalable, while providing a fun and engaging experience for the masses.
The digital signage market has been growing for the past few years and it is forecasted to grow between 2022 and 2027 as much as USD 8113.34 million (Technavio, 2023). The evolution of digital signage technology has enabled more possibilities for their usage and setup in a roadshow operation. Such functionalities can be fully leveraged to create a more effective roadshow framework that can be added to advertisers’ lists of marketing tools. Digital Signage Augmented Roadshow (DiSAR) (Leow et al., 2023) is a newly proposed roadshow framework that fully utilizes interconnected digital signages to carry out roadshow activities. Equipped with various input devices such as touchscreen displays, camera and microphones, the digital signages can be loaded up with highly interactive roadshow contents that fully uses the additional input devices for the participants to enjoy. As the setup of a DiSAR calls for an array of digital signages, advertisers alike will have to make an initial investment in acquiring the digital signages in the first place. However, it can also be a financial disaster if the return on investment (ROI) of DiSAR does not meet the expectations of the advertisers due to low user acceptance. With the aim to instill greater confidence in advertisers considering the adoption of DiSAR, a user acceptance study is a significant and necessary step to take in this direction.
In order to thoroughly probe into the user acceptance of DiSAR, it is necessary to employ an empirical methodology applying theoretical models that study the user acceptance of information systems similar to DiSAR. To achieve this, a theoretical model known as the Technology Acceptance Model (TAM) (Davis, 1985) is used. The TAM was developed based on the Theory of Reasonable Action (Fishbein and Ajzen, 1975) to evaluate user acceptance of computer-based information systems. Over the years, there are an increasing number of researchers attempting to add extensions or additional variables to the TAM to better understand the effect of external factors or context of use that may influence the user acceptance of various information systems. This prompts for a similar study on the user acceptance of DiSAR. The DiSAR roadshow framework puts a heavy emphasis on the interaction between the participants and the digital signages, as well as the enjoyment factor experienced by the participants. The overall system quality of the DiSAR setup also has to be kept at a high level to ensure a smooth roadshow experience. To gain crucial insights into user acceptance of DiSAR, it is essential to explore the relationship between these external factors and the TAM. Therefore, an extended version of TAM that incorporates the unique characteristics of DiSAR is necessary to study user acceptance within the specific context of DiSAR participation.
This study aims to reduce the gap in the literature by evaluating the proposed extended TAM that will be used to determine the user acceptance of DiSAR. To do this, Partial Least Squares Equation Modelling (PLS-SEM) will be used. Based on this, the research question that serves as a guide for this research is: How is the performance of the proposed extended TAM in modeling the user acceptance of DiSAR? In order to achieve this, the proposed extended TAM will be deployed as a questionnaire in a prototype DiSAR campaign. The data collected from the campaign will be analyzed statistically to determine the performance of the extended TAM.
1.1 Digital signage augmented roadshow (DiSAR)
A digital signage is a “networked audiovisual information system that allows remote controlling of the content from a centralized system” (Ijaz et al., 2016). The physical structure of a digital signage is a screen, which may be the traditional plasma screen, Thin Film Transistor (TFT) screen or Light Emitting Diode (LED) screen, Liquid Crystal Display (LCD) screen and various projection systems, connected to a computer or playback device. It is often used to display a variety of media content, from static images to videos, audio and live video news feeds (Chen et al., 2009). The primary aim of the digital signage is to deliver a targeted message to a specific audience at a specific location by a specific device at a specific time (ABI Research, 2011). In an article by Burke (2009) summarizing the empirical studies on the behavioral effects of digital signages, it was found that using digital signage to display content related to advertising subjects in a retail shopping environment led to increases in both sales and store traffic. According to an article on Digital Signage Today, 80% of brands experienced a sizable growth up to 33% in additional sales through the use of Digital Out of Home (DOOH) campaigns, which are largely based on digital signage (Digital Signage Today, 2010). With digital signage technology experiencing a rapid evolution (Damask, 2021), there are more possibilities and situations one could use digital signage for.
As digital signage possesses the ability to display a variety of media content, it has more use cases than the conventional static signage. A setup of multiple digital signage can act as the primary medium of a roadshow operation. A Digital Signage Augmented Roadshow (DiSAR) (Leow et al., 2023) is a roadshow framework that uses multiple digital signage as its primary medium. The roadshow framework takes inspiration from station game concept, which is a popular activity in tele matches that typically involves groups of participants. The usage of solely digital signages in DiSAR without human operators allows for high scalability and reusability when deployed in different roadshows. Digital signages equipped with input devices such as touch-sensitive screens or cameras can offer advertising content with significantly higher interactivity for participants compared to conventional signages. Sun and Hsu (2013) have established that high interactivity content in a highly interactive computer systems assists the perceived learning of participants, which aligns with the primary aim of a DiSAR. On top of that, the ad-embedded contents are incorporated using the Visual, Auditory, Read/Write and Kinesthetic (VARK) Learning Model (Fleming and Mills, 1992). Studies have shown that the addition of such learning model can enhance the effectiveness of learning (Roswinanto, 2015; Zhu et al., 2018; Mohamad et al., 2019; Halif et al., 2020) and subsequently improve the effectiveness of advertising. The primary purpose of a DiSAR is to utilize digital signage to educate or advertise the main content of the roadshow to participants. Therefore, the usage of highly interactive content designed around the interactivity level of the digital signage is key to achieving its goal.
2 Literature review
2.1 Technology acceptance model (TAM)
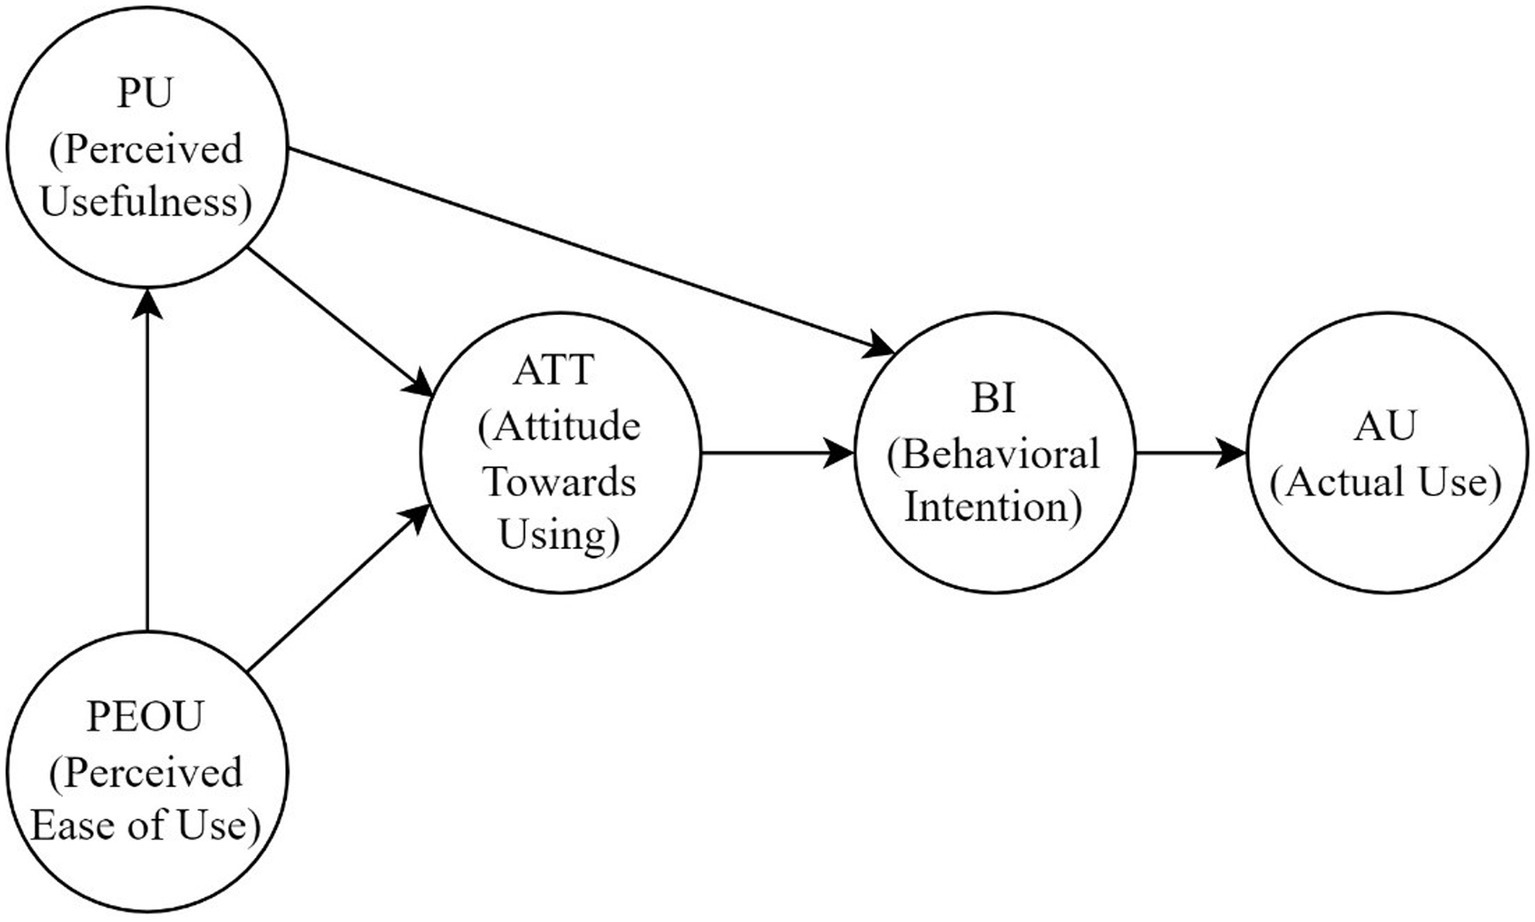
Technology Acceptance Model is a theoretical model developed by Davis (1985). It is an adaptation of the Theory of Reasoned Action (TRA) (Ajzen and Fishbein, 1980) to the context of technological implementation. TAM sets out to “provide an explanation of the determinants of computer acceptance that is general, capable of explaining user behavior across a broad range of end-user computing technologies and user populations, while at the same time being both parsimonious and theoretically justified” (Davis et al., 1989). The TAM model has five major constructs, which are Perceived Usefulness (PU), Perceived Ease of Use (PEOU), Attitude Towards Using (ATT), Behavioral Intention to Use the Technology (BI) and Actual Use of the Technology (AU).
The causal relationship between the constructs is illustrated in Figure 1. The two constructs, PU and PEOU are treated as the fundamental determinants of users’ acceptance of technology (Davis, 1989). Unlike in TRA, the “subjective norm” component is excluded in TAM, as its concept was not well understood, as acknowledged by Fishbein and Ajzen (1975). TAM implies that both PU and PEOU influence the AU of a technology through users’ ATT and BI when using the technology in question.
2.2 TAM extensions
Although TAM is widely used by many researchers, a meta-analysis of the TAM framework by Legris et al. (2003) suggests that TAM should be altered to include external variables to guide actions needed to influence greater use. Venkatesh and Davis (1996) had also stated that while TAM is useful in predicting acceptance, “one of the limitations of TAM is that it does not help understand and explain acceptance in ways that guide development beyond suggesting that system characteristics impact ease of use and usefulness perceptions.” The author also stated that “it is important to understand the antecedents of the key TAM constructs, perceived ease of use and usefulness” to explain user acceptance and use. Chandio et al. (2017) also claimed that TAM is inadequate for clarifying how users accept and utilize new technology in the context of e-government. Some researchers had criticized that TAM does not consider “external variables which could influence acceptance of and willingness to use technology” (Ajibade, 2018). Therefore, modifications to the original TAM are necessary through incorporating additional variables that can better explain how certain factors contribute to user acceptance intricately.
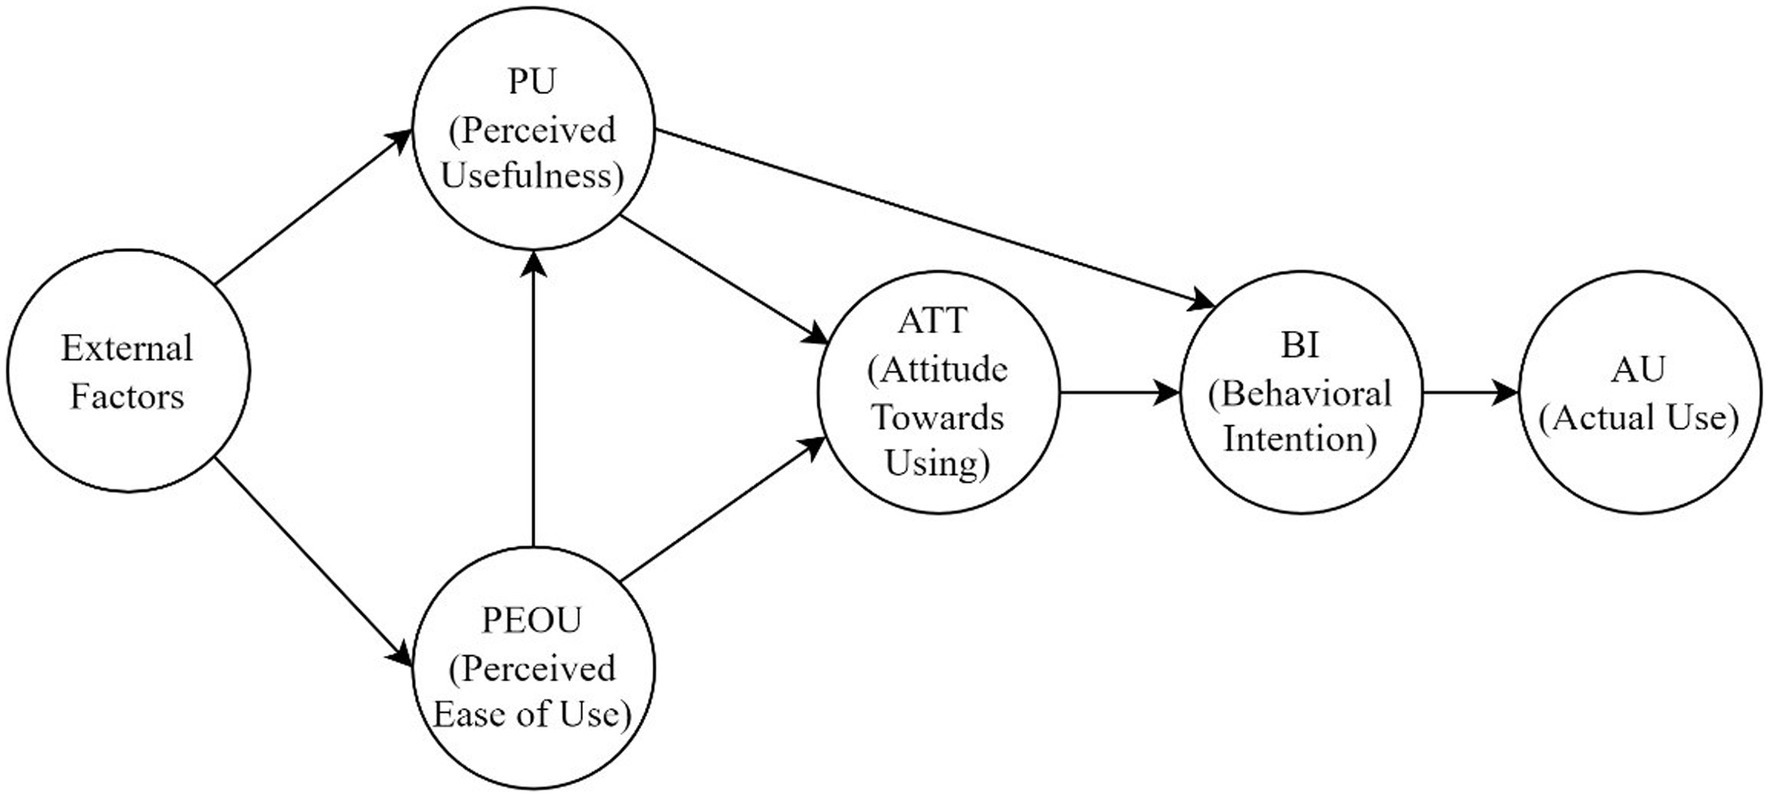
Figure 2 shows the updated TAM with external factors, as proposed by Davis et al. (1989). The authors stated that by “representing beliefs separately allows the researcher to better trace the influence of external variables” on both PU and PEOU. This method improves the understanding of the information system, enabling researchers to link the unique characteristics and context of use of various systems to better explain how it affects both PU and PEOU. Using the extended TAM, researchers can also make targeted improvements based on the additional factors incorporated.
2.3 Previous studies utilizing extended TAM
An empirical study was conducted by Papakostas et al. (2021) on the user acceptance of a personalized mobile augmented reality firefighter training system. A modified TAM was used in which the Perceived Interactivity and Perceived Personalization were added as the antecedents of both PEOU and PU. According to the authors, incorporating these extra variables can help AR developers in improving firefighters’ experience in their training operations. The results showed that both of the additional constructs contribute to both PU and PEOU, which allowed the authors to establish the correlation between the two variables.
Mailizar et al. (2021) conducted a study on examining university students’ intention to use e-learning during the COVID-19 pandemic. For this study, System Quality and E-Learning Experience were used as external construct in the modified TAM. The authors stated that this study helps in understanding the factors which affect the students’ intention to use e-learning pandemic and beyond. The result shows that System Quality has a significant impact on both PU and ATT.
Jung et al. (2021) studied the user acceptance of a sharing accommodation platform through the use of a modified TAM. In this study, 3 additional variables were added to the original TAM, which are Network Externalities, Trust and Interactivity. The Network Externalities construct acts as the antecedent for Trust, Interactivity, and PEOU. The Interactivity construct acts as the antecedent for PEOU and PU, while the Trust construct acts as the antecedent for only PU. The result shows that Network Externalities contributes to both Trust and Interactivity, while Interactivity is found to be influencing both PU and PEOU. It is also found that Trust also contributes significantly towards PU.
Zhong et al. (2021) conducted a study on the user acceptance of a facial recognition payment system. The motivation of this study stems from studying the factors that drive the customers’ willingness to use the mentioned system. For this study, there were 4 external variables added to the original TAM, which are Perceived Enjoyment, Facilitating Conditions, Personal Innovativeness and Coupon Availability. These 4 additional variables serve as antecedents for all the original variables in TAM. The result shows that PEOU is influenced by Perceived Enjoyment and Facilitating Conditions, while PU is influenced by Facilitating Conditions, Personal Innovativeness and Coupon Availability. BI is also found to be influenced by Perceived Enjoyment, Facilitating Conditions and Coupon Availability.
Park and Park (2020) conducted a study on the factors of acceptance for new information technologies in the construction field. For this study, 6 external variables were added to the original TAM, which are Acceptance Form of IT, Usage Frequency of IT, Educational Satisfaction, Usage Knowledge, Usage Enjoyment and Usage Experience of IT. These variables are the antecedents for both PU and PEOU. The results show PU is influenced by Acceptance Form of IT, Educational Satisfaction, Usage Enjoyment, and Usage Experience of IT. Meanwhile, PEOU is influenced by both Educational Satisfaction and Usage Enjoyment.
Won et al. (2023) proposed an extended TAM to study the factors that influence the adoption and continued use of sport-branded apps. For this study, 3 additional variables were added to the original TAM, which are Information Quality, System Quality and Perceived Enjoyment. The Information Quality construct and System Quality construct act as the antecedents for PEOU, PU, and Perceived Enjoyment. The Perceived Enjoyment construct is then connected to PEOU, PU, and BI as antecedent. The findings show that all the added constructs significantly impacted the original TAM constructs.
3 Theory development and research model
3.1 Extending TAM to study user acceptance for DiSAR
It is important to understand how the characteristics of DiSAR may influence user acceptance of it. This study provides an opportunity to shed light on utilizing TAM to explore DiSAR adoption, as studies on said topic are also limited. Therefore, this study enriches the literature by providing evidence on both the user acceptance of DiSAR and the applicability of TAM in assessing the roadshow framework adoption. This study selects TAM as the base model for studying the user acceptance of DISAR because it is said to be “one of the most robust frameworks with which to adopt the new technology and it offers a platform for a better comprehension of users’ acceptance of new technology devices” (Acikgoz and Vega, 2022). There are various theoretical models that were developed to study user acceptance such as UTAUT2 (Venkatesh et al., 2003), and even the subsequent development of TAM2 (Venkatesh and Davis, 2000) and TAM3 (Venkatesh and Bala, 2008). However, the original TAM “has been shown to be theoretically resilient and to have a strong predictive power to assess individuals’ intention to use for almost three decades” (Marikyan and Papagiannidis, 2023), making it a reliable framework for understanding user acceptance of technology across various contexts and applications. However, the original TAM has to undergo modifications to better suit the unique operating conditions of DiSAR.
Although PU and PEOU have been strong determinants of usage intentions and actual usage through many empirical tests (Venkatesh and Davis, 1996), limited research has been done to understand the antecedent of both constructs. As this study sets out to understand the user acceptance of DiSAR, there is also a need to identify the unique characteristics of DiSAR that may encourage or hinder its acceptance among the participants. The result from extending TAM for assessing DiSAR can not only assist in better understanding on how user acceptance is formed among the participants, it can also encourage improvements on the current DiSAR roadshow framework through insights that can help in “designing organizational interventions that would increase user acceptance and usage” (Venkatesh and Davis, 2000).
There are multiple characteristics of a DiSAR that can be included into extending TAM to prove its user acceptance. First, as DiSAR is a recent creation, there is a need to understand the quality of DiSAR. Quality in this context includes the usability, availability, reliability and response time of the digital signages. The lack of these dimensions could lead to user frustration. A study done by Hertzum and Hornbæk (2023) has shown that user frustration can cause users to approach a technology with hesitation or avoid it altogether. In the context of DiSAR, such frustration can become a barrier to achieving user acceptance during widespread rollout. The quality aspect of a DiSAR has yet been studied by other literature, as quality is important to not only instill adoption confidence among the users (Fathema, 2013), but also to ensure the effectiveness in advertising the subject of the roadshow to the participants (Chopra et al., 2019). Therefore, it is essential to study how DiSAR’s system quality affects user acceptance to prevent potential barriers and ensure widespread user acceptance.
With the inclusion of multiple input methods for the users to interact with the digital signages, the interaction capability of the digital signages are fundamental to DiSAR, as these factors directly impact user engagement and satisfaction. A study by Oh and Sundar (2015) suggests that “interaction itself can foster better attitudes toward the messages, without necessarily going through systematic processing of the messages” when discussing the potential of interacting with modality interactivity feature on antismoking websites. As DiSAR fully leverages the addition of multiple input devices for the users to interact with the digital signages, it is crucial to understand if the perceived interactivity of the digital signages in DiSAR assists the user in understanding the advertised subject more easily and effectively. A lack of interactivity in DiSAR may cause a disconnection between the system and its users, which leads to lower participation rates and a failure to meet DiSAR’s objective in interactive advertising. Therefore, it is essential to consider these factors in this study, as they must align with the expectations of the users to more effectively understand an advertising campaign when participating in a DiSAR.
The current implementation of DiSAR puts heavy emphasis on the gamification contents. As the presence of entertainment elements contributes to having a positive learning experience (Choi, 2018; Rasul and Raney, 2021), the entertainment aspect of a DiSAR has to be taken into consideration. By incorporating enjoyable elements, advertisers can more effectively capture attention and promote their message, while participants benefit from a more immersive and enjoyable experience in taking part in a DiSAR. Therefore, it is important to understand the hedonic aspect or the “fun” factor of participating in DiSAR and its effect on the eventual adoption of DiSAR among the users.
3.2 Proposed extended TAM
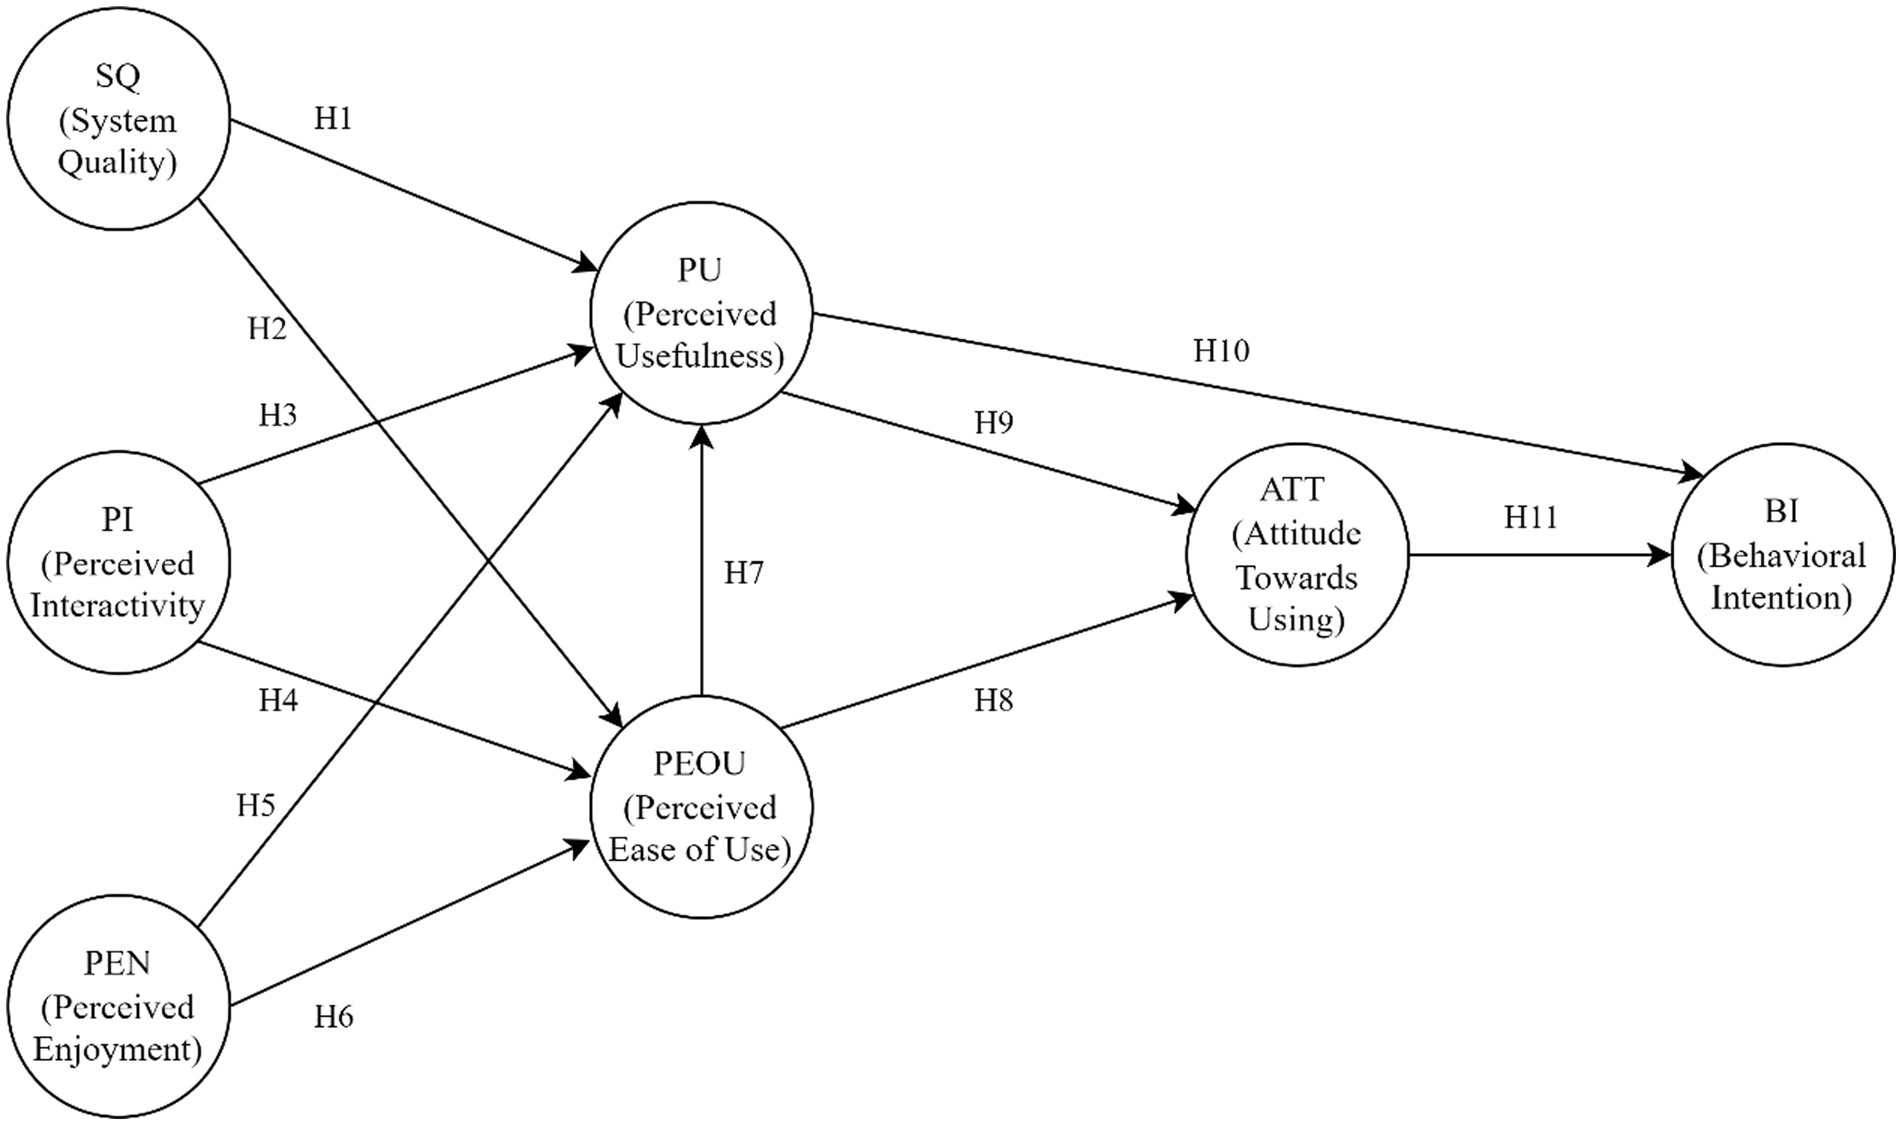
Figure 3 shows the proposed extended TAM framework adapted from the updated TAM by Davis et al. (1989). The two exogenous constructs from the original TAM, PU and PEOU, are converted to endogenous constructs with the addition of 3 external constructs: System Quality (SQ), Perceived Interactivity (PI) and Perceived Enjoyment (PEN). These 3 constructs represent the key elements of a DiSAR, which act as the antecedents for the original TAM model.
SQ is adapted from an extended TAM that was developed by Fathema (2013) based on the updated Model of Information System Success (Delone and McLean, 2003) to study the web technology adoption behavior in higher education institutions. The author stated SQ was adapted to measure quality related functions, speed, features, contents and interaction capability of Learning Management System (LMS). After conducting the study, the author found SQ has a significant influence on both PU and PEOU in the original TAM model. The reason that SQ was chosen as one of the constructs to be added to the original TAM model to measure the user acceptance of DiSAR is to understand the influence of the quality of the medium of DiSAR towards the acceptance among the participants. As DiSAR is still relatively new, it is important to understand if the quality of the digital signages displaying the roadshow content affects the user acceptance of DiSAR or not. The relationship between this extended construct with PU and PEOU can also be better understood in terms of the extent of how the quality of the information system affecting the perceived usefulness or perceived ease of use of it. Therefore, the first two hypotheses for this study are:
H1: SQ will have a significant positive effect on PU of DiSAR.
H2: SQ will have a significant positive effect on PEOU of DiSAR.
PI is adapted from an extended TAM that was developed by Papakostas et al. (2021) to study the acceptance of a personalized mobile augmented reality training system for firefighters. In their study, it was found that PI positively affects the system’s PEOU. Currently, there is no single definition that is clear cut in defining PI. However, Yoo et al. (2010) summarized the key elements of interactivity that were defined by different authors in their study, which are controllability, synchronicity, and bi-directionality. As DiSAR mostly contains digital signage displaying interactive contents, it is important to understand how the interactivity aspect of it affects the adoption of DiSAR among the participants. DiSAR puts a heavy emphasis on the interaction between the user and the digital signage. This prompts for a study into the impact of the information system’s interactive capabilities on user acceptance of DiSAR. In order to better understand the relationship between both constructs and PI, the following hypotheses were proposed:
H3: PI will have a significant positive effect on PU of DiSAR.
H4: PI will have a significant positive effect on PEOU of DiSAR.
PEN is defined as the degree to which the activity of using technology is perceived to be enjoyable in its own right, apart from any performance consequences that may be expected (Davis et al., 1992).This construct is adapted from an extended TAM developed by Teo and Noyes (2011) in their study on the influence of perceived enjoyment and attitude on the intention to use technology among pre-service teachers. The findings of their study suggested that PEN had a significant influence on PU, PEOU and BI. DiSAR is equipped with highly interactive and entertainment-focused content. Because of this, DiSAR can be equipped with gamified content that provides hedonic experience while providing advertising information. Therefore, the hedonic aspect of interacting with the digital signage within DiSAR may influence the adoption of DiSAR. On this basis, 2 hypotheses are proposed based on the relationship between PEN and both PU and PEOU.
H5: PEN will have a significant positive effect on PU of DiSAR.
H6: PEN will have a significant positive effect on PEOU of DiSAR.
PEOU is one of the two fundamental constructs of TAM. According to, it is defined as “the degree to which an individual believes that using particular system would be free of physical and mental effort.” TAM assumes PEOU has a direct effect on the PU of the technology. When the users find the technology to be “easy to use,” they are more likely to view it as a “useful” technology. TAM also assumes that PEOU influences the users’ ATT. If the users find the technology to be “easy to use,” it will be more likely for them to develop a positive attitude towards the technology. In order to better understand how the perceived ease of use of DiSAR affects its perceived usefulness and users’ attitude towards using it, hypothesis 7 and 8 are proposed:
H7: PEOU will have a significant positive effect on PU of DiSAR.
H8: PEOU will have a significant positive effect on ATT of DiSAR.
PU is the second fundamental construct of TAM apart from PEOU. According to, PU is defined as “the degree to which an individual believes that using a particular system would enhance his or her job performance.” TAM suggests that PU influences the users’ ATT towards the technology. If the technology is perceived as “easy to use,” it is more likely for the users to develop a positive attitude towards the technology. Additionally, TAM also suggests that there is a connection between the users’ PU and the BI of the user towards the technology. If the technology is perceived as “useful,” the users will develop an intention to use the technology. Therefore, there are two hypotheses proposed based on the relationship between PU and the other constructs:
H9: PU will have a significant positive effect on participants’ ATT of DiSAR.
H10: PU will have a significant positive effect on participants’ BI of DiSAR.
Attitude Towards Using (ATT) is defined as “the degree of a person’s positive or negative feelings about performing the target behavior” (Davis et al., 1989). TAM assumes ATT is influenced by both PEOU and PU, which will affect the BI of the user towards the technology. If the technology is both “easy to use” and “useful,” the users will develop a positive attitude towards it. According to Davis, the relationship between ATT and its precedents is inspired by TRA’s view that the attitudes towards a behavior are determined through relevant beliefs. If the users have a positive attitude towards the technology, it is more likely that they will develop an intention to use it. With that in mind, a hypothesis can be proposed to investigate the relationship between ATT and the constructs connected to it:
H11: ATT will have a significant positive effect on participants’ BI of DiSAR.
Behavioral Intention (BI) is defined as “the degree to which a person has formulated conscious plans to perform or not perform some specified future behavior” (Warshaw and Davis, 1985). This construct is influenced by both PU and ATT. TAM assumes that the users’ intention to use technology influences their actual usage of it. For this study, BI is used as a dependent variable and AU is omitted from the extended TAM model. BI is said to be the “primary predictor of actual behavior” (Rasull et al., 2019). In Da Chen et al. (2002) study on consumer behavior in the context of a virtual store, BI is defined as “the user’s likelihood to use a virtual store.” According to Alharbi and Drew (2014), BI is also defined as a behavioral tendency to use the technology in the future. As currently a working example of a DiSAR has yet to be deployed, the user acceptance of DiSAR should be gauged on whether the participants will use DiSAR when it undergoes mass deployment in the future by advertisers. Therefore, BI will be more suitable for measuring user acceptance for DiSAR compared to AU.
4 Methodology
4.1 Sampling and data collection
For this study, a full-fledged DiSAR was carried out from 12 July 2022 to 21 July 2022. This DiSAR was held in an often-crowded area in Multimedia University (Melaka Campus), Malaysia. Purposive sampling was used to invite participants to join the roadshow based on their availability in the sampling venue. The participants were students from Multimedia University (2022). The participants went through a series of activities that were offered in DiSAR and filled up a questionnaire formulated through the extended TAM in the final stage.
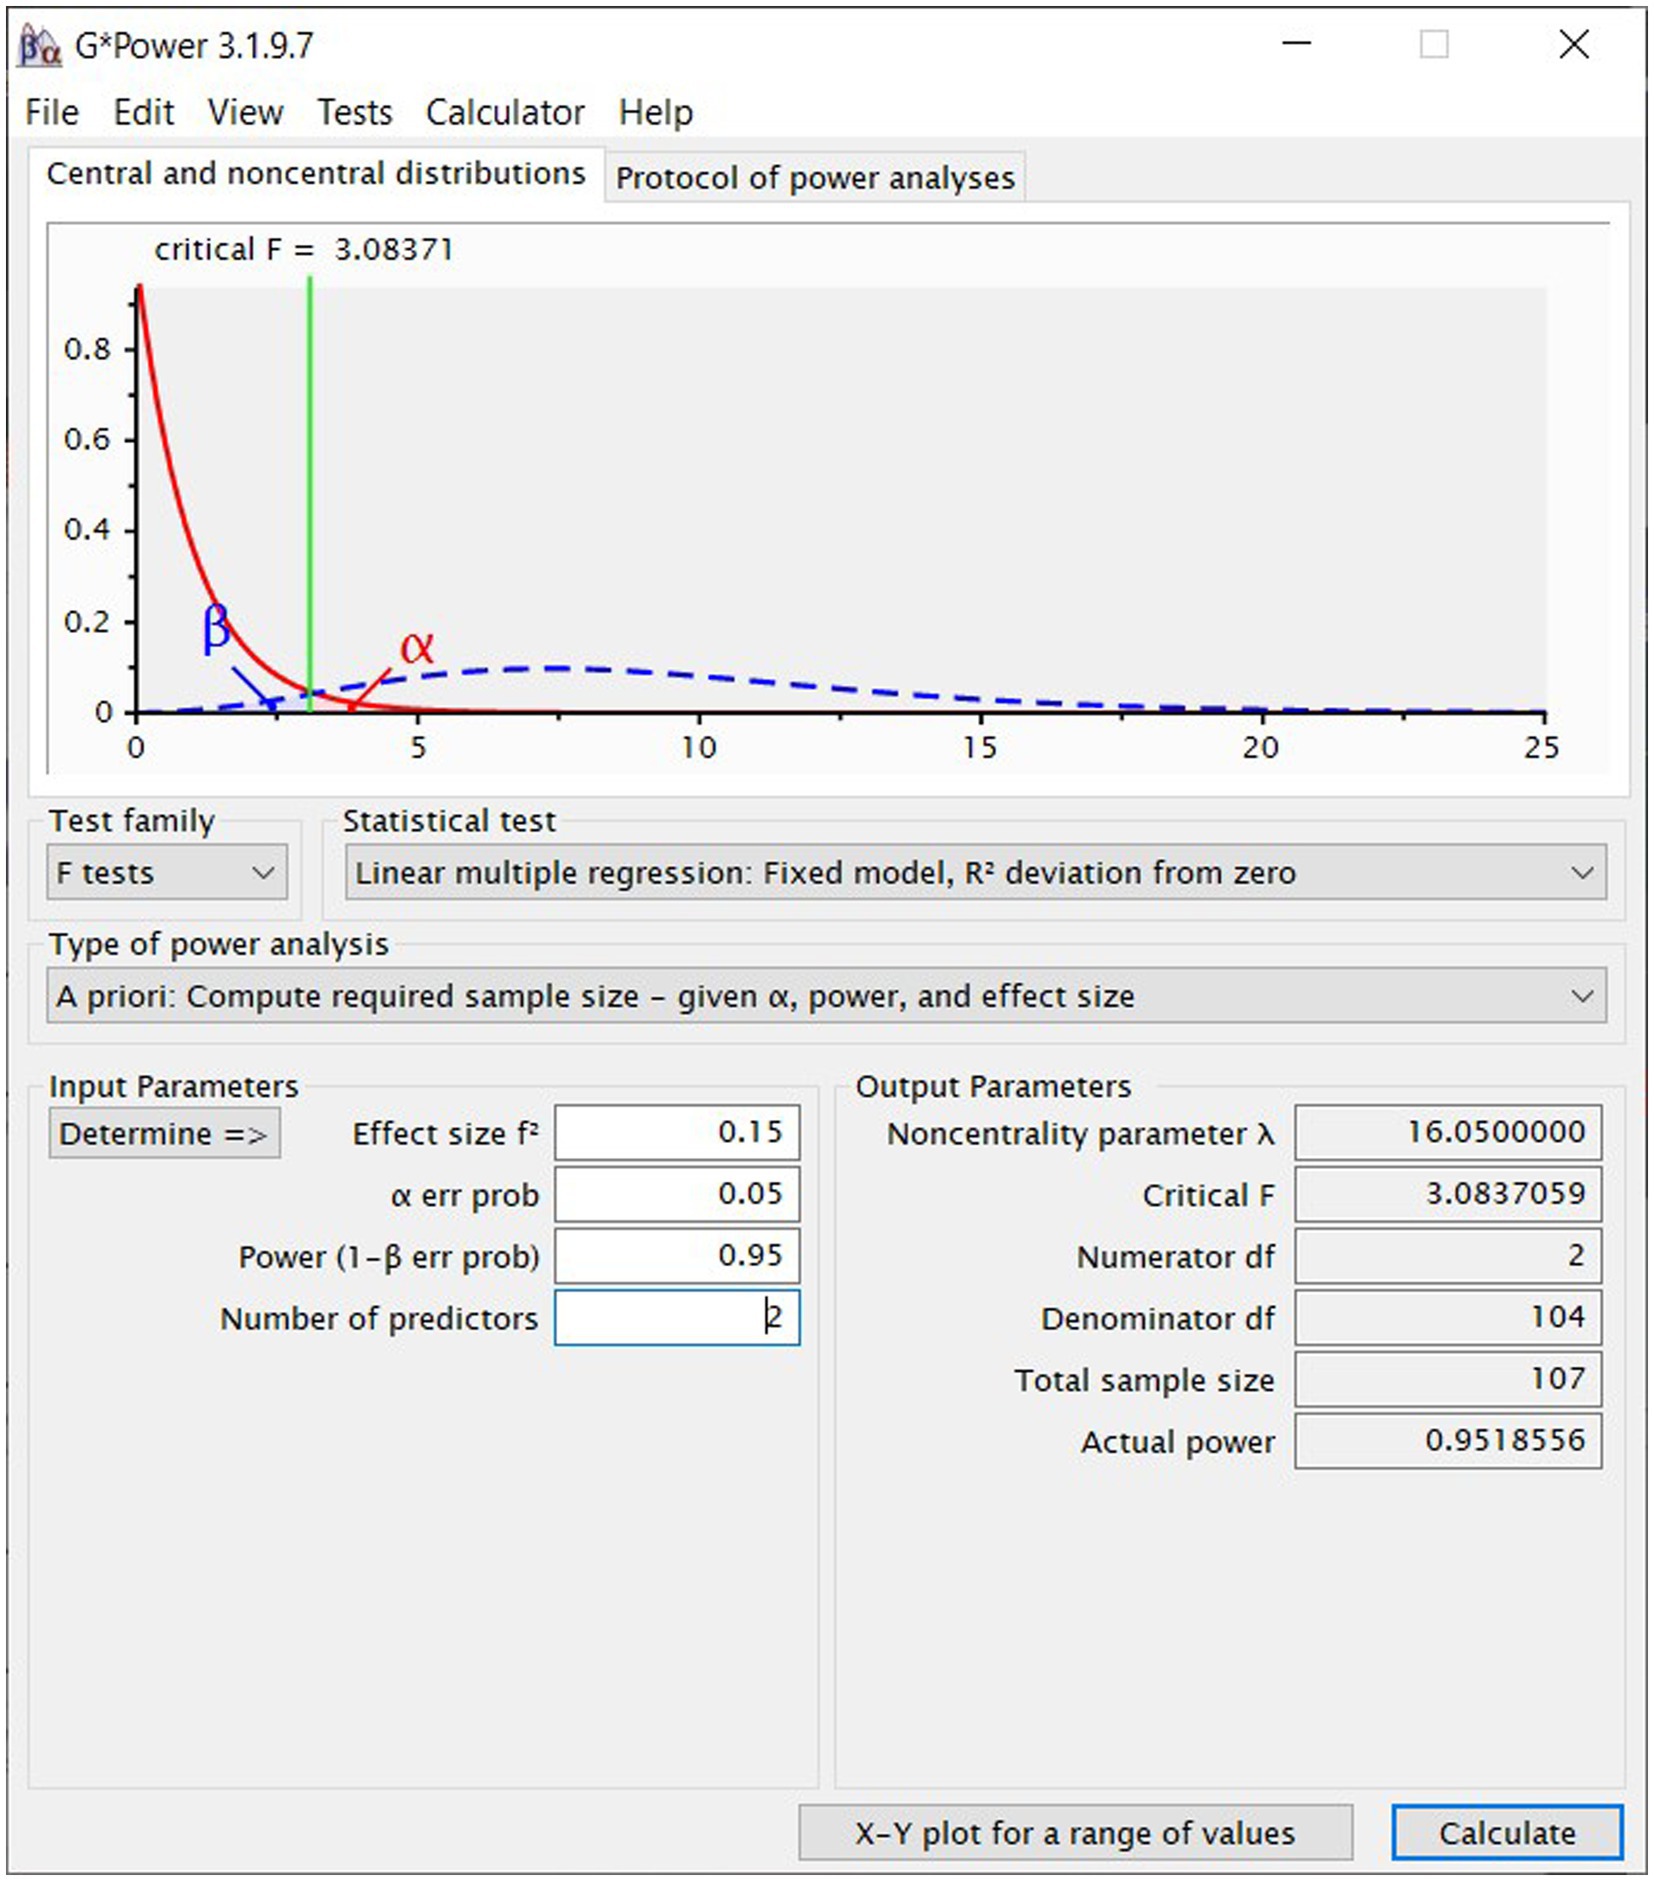
For the sample size of this study, there were 2 approaches that were considered: the recommendation provided by G*Power and the inverse square root method. Figure 4 shows the sample size recommended by G*Power based on the several parameters configured. For this study, the target effect size is 0.15, which is considered to be having medium effect. The significance level is chosen to be 5%, while the power level is set at 95%. The number of predictors is set to 2, since there are 2 arrows in the extended TAM model that are pointed towards the key endogenous construct BI (ATT-BI and PU-BI). The total sample size that is recommended by G*Power with these parameters is 107.
Despite the aforementioned minimum sample size recommended by G*Power, it may still be insufficient for a full scale study (Kock and Hadaya, 2018). In order to address these concerns, Kock and Hadaya (2018) proposed the inverse square root method. Equation 1 shows the equation for the 5% significance level variant of the inverse square root method, where nmin represents the minimum sample size and pmin is the minimum value for path coefficient to be statistically significant in a path model (Hair et al., 2022). Assuming the power level to be at 80% and a minimum path coefficient of 0.2, the minimum sample size recommended through this method for this study is 155. According to Hair et al. (2022), this method is “rather conservative in that it slightly overestimates the sample size required to render an effect significant at a given power level.” However, specific to this study, the number of minimum sample size was increased to 200 entries. This is to ensure a sufficient buffer beyond the recommended minimum sample size to account for the removal of any potentially problematic or unreliable data. At the end of the data collection process for this study, 203 responses were collected after data cleaning to remove entries that had signs of straightlining.
4.2 Measuring instrument
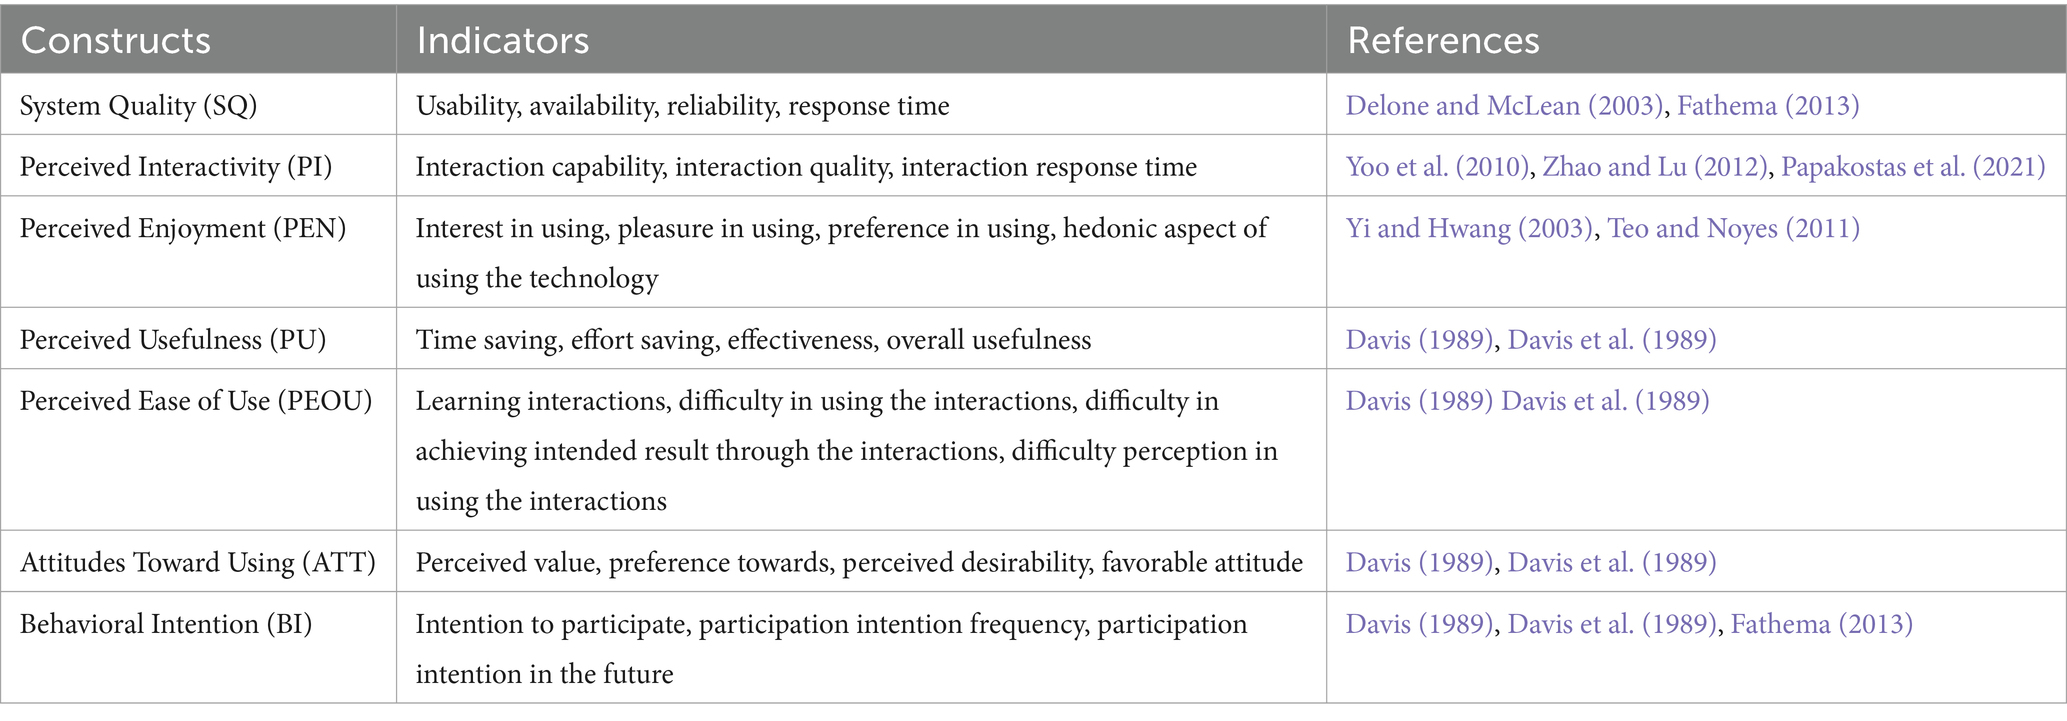
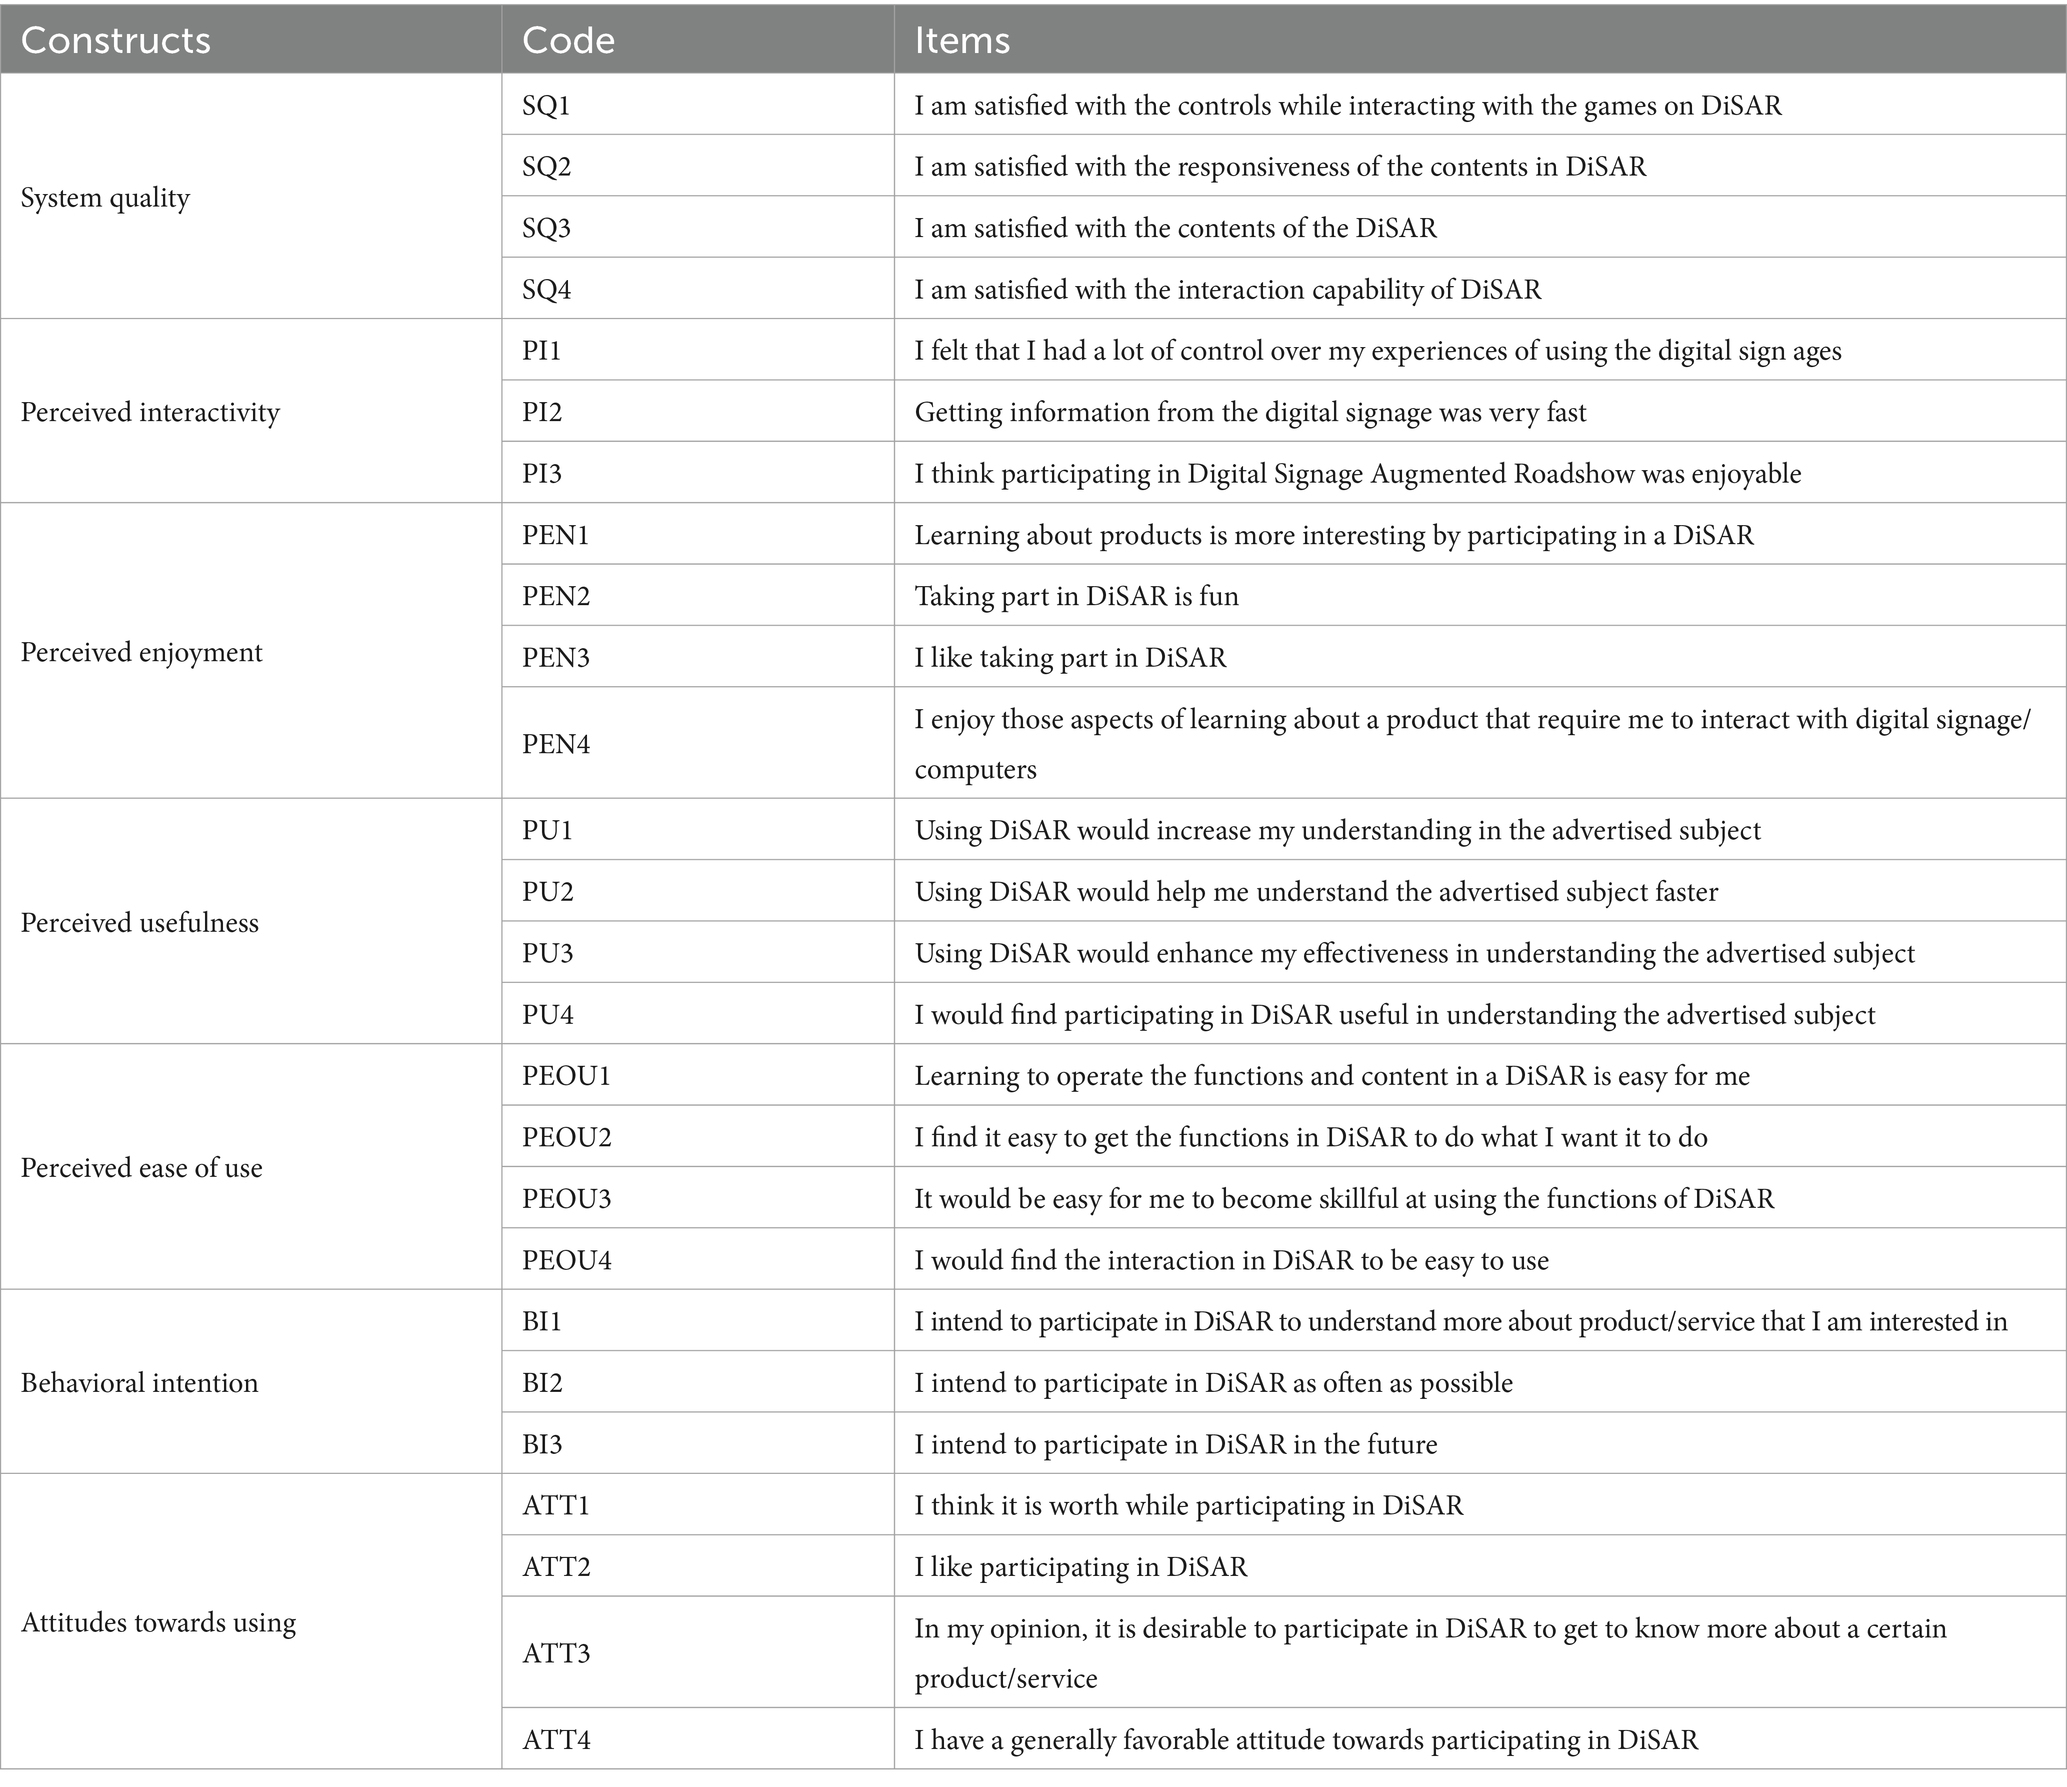
The measuring instrument used in this study was an online questionnaire survey hosted on Google Form. The questionnaire contained a series of questions, which inquired the participants based on the 7 constructs in the extended TAM. These items were assessed through the use of a 5-point Likert-scale. 26 question items based on the 7 constructs of the proposed model were used to collect the responses for testing the hypotheses. The items were adopted from existing literature after careful deliberation. A pilot study was performed with 60 responses, confirming that the items have adequate validity and reliability (Tan et al., 2023). Table 1 summarizes the constructs used in this study and the full set of the questionnaire is presented in Table 2.
The SQ construct was adapted from Fathema’s version of the construct used in their study (2013), which was adapted from the updated Model of Information System Success (Delone and McLean, 2003). This construct measures the usability, availability, reliability and response time of the digital signages used in the DiSAR prototype roadshow.
The PI construct was adapted from Papakostas et al. (2021) version of the construct used in their study, which is based on Zhao and Lu (2012) version of the construct. This construct measures the interaction capability and quality of the digital signages, as well as the response time for the interaction between the participants and the digital signages in DiSAR.
The PEN construct was derived from Teo and Noyes (2011) version of the construct, as well as Yi and Hwang (2003) version of the construct. This construct measures the interest, pleasure, and preference in using DiSAR, as well as the hedonic aspect while participating in DiSAR.
The original TAM constructs such as PU, PEOU and ATT were derived from the original work by Davis (1989) and Davis et al. (1989). BI was derived from both Davis et al.’s work and Fathema’s (2013) version of the construct. For this research, PU measures the perceived degree to which DiSAR provides utility to the participants, which includes time saving, effort saving, effectiveness, and overall usefulness of DiSAR. PEOU measures the difficulty in learning and using the interaction, the difficulty in achieving the intend result through said interaction, as well as the participants’ perception of using the interaction. ATT measures the perceived value and desirability, as well as the degree of preference and favorable attitude towards DiSAR. BI measures the participants’ intention to participate in DiSAR, their frequency of participation intention, as well as their intention to participate in DiSAR in the future.
4.3 Statistical analyses
Partial Least Squares Structural Equation Modelling (PLS-SEM) will be used to evaluate the extended TAM proposed in this study. It is a structural equation modelling technique “based on an iterative approach that maximizes the explained variance of endogenous constructs” (Fornell and Bookstein, 1982; Hair et al., 2014). Hair et al. (2022) recommended the use of PLS-SEM for studies specifically when “the research objective is to better understand increasing complexity by exploring theoretical extensions of established theories.” In line with the recommendation, this study uses PLS-SEM to evaluate TAM with the added external constructs. PLS-SEM was applied to this study through the use of SmartPLS 3.0 (Ringle et al., 2015). The evaluation of the model will follow a two-step process: evaluation of the measurement model and evaluation of the structural model.
The model that are typically studied using PLS-SEM are either a reflective measurement model or a formative measurement model. Both measurement models require different PLS-SEM analysis procedures. The extended TAM used in this study consists solely of reflective constructs, which call for an evaluation specific to the reflective measurement model. The evaluation of the reflective measurement model includes assessments for indicator reliability, internal consistency reliability, convergent validity, and discriminant validity (Afthanorhan and Afthanorhan, 2013; Hair et al., 2011; Urbach and Ahlemann, 2010; Venkatesh et al., 2013; Wong, 2013). The evaluation of the measurement model concludes when the model establishes the requirements for each assessment. After that, the evaluation process shifts focus towards the whole structural model. The structural model assessment includes checking for potential collinearity among constructs, significance testing of path coefficients between constructs, assessing explanatory power, assessing effect sizes, and assessing the predictive power of the model.
4.4 Experiment setup
4.4.1 DiSAR theme
At the time of planning the experiment, the Malaysian government allowed students of the higher learning institution to return to the campus (Bernama, 2022) during the COVID-19 pandemic. Following the announcement by the government, Malaysian universities made announcements on detailed plans and updates on the standard operating procedure for students to return to campus. For example, Multimedia University (2022) provided an e-book named CampusReboot Plan as a guideline on the procedure for students to return to the campus. Such a plan might be perceived as a drastic and sudden shift for the students who have adjusted to the remote learning setting, considering that distance learning was the only available learning option for all the students in the past year. Among those students, a large subset of them enrolled into the university during the pandemic and have yet to been to the physical campus before let alone socializing with their classmates. As such, students may once again face a significant change in their daily routines since the first nationwide COVID-19 lockdown. Such a change in lifestyle may also introduce more mental impact towards the students, as a study has shown that there are “higher levels of anxiety and perceived stress among Malaysian university students towards class re-entry which causes moderate depression” (Al-Rawi et al., 2022).
Considering these factors, a roadshow related to the awareness of the possible mental health issues faced by the students after the pandemic might be relevant during that specific timeframe. Therefore, a theme of Post Pandemic Anxiety Amongst Students was proposed for this prototype DiSAR campaign. As DiSAR places heavy emphasis on advertising through gamified contents, the participants can have an enjoyable session playing the games in a DiSAR roadshow while gaining awareness on mental health issues among students post-pandemic.
4.4.2 DiSAR setup
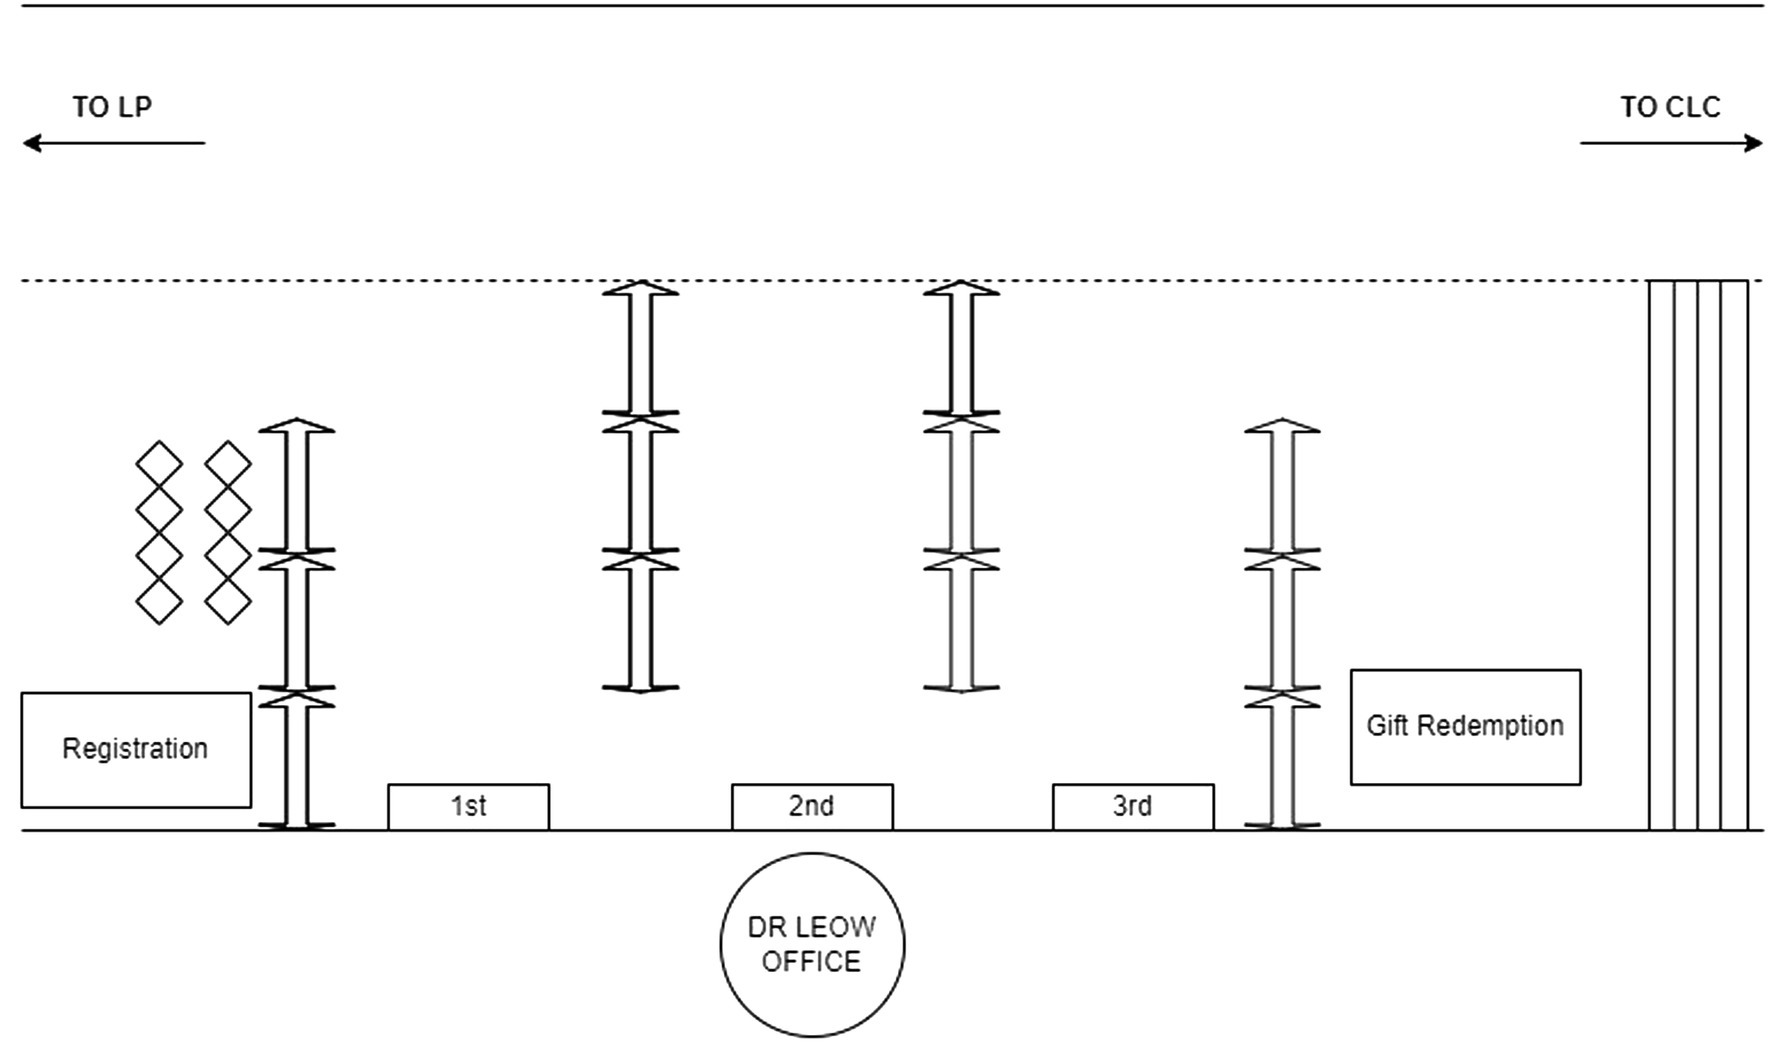
Figure 5 shows the floor plan for the DiSAR setup for this study. There were 3 main sections for this campaign, which were the registration section, campaign section and gift redemption section. The campaign section consists of 3 different game stations for the participants to take part in.
These sections were isolated from each other through the use of dividers. The reason for using this setup was to emulate the experience of the participants searching for the digital signages in a maze-like setting in a small space. The participants had to first register an account using their email address on the DiSAR website in the registration section before moving on to experience the content that this DiSAR was offering. At the end of this DiSAR campaign, the participants had to fill in a questionnaire based on the proposed extended TAM before claiming a gift based on their scores achieved in the campaign section.
4.4.3 DiSAR content
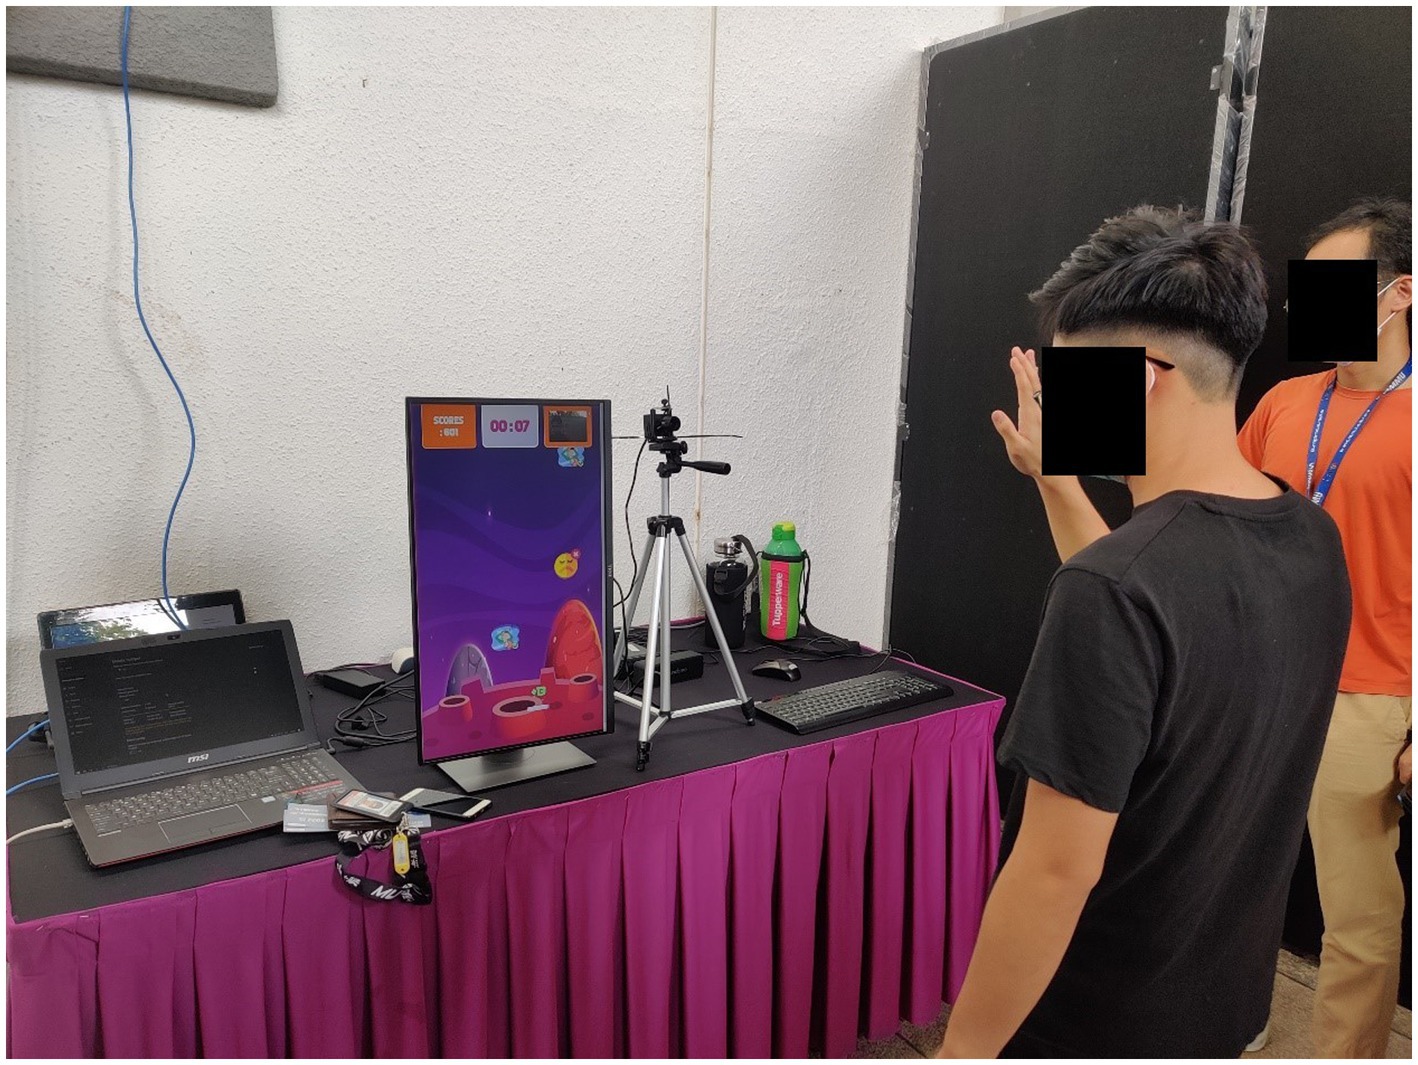
Figure 6 shows a participant taking part in the first game station with the assistance of a helper. The participant is shown doing a hand-waving gesture in front of a USB camera. This station used a game based on the concept of a catcher game. This game incorporated the use of computer vision, in which the participants had to interact with the USB camera attached on the tripod beside the display as shown on the figure to catch the falling objects. The falling icons were customized so that it would display thumbnails that were more in line with the theme of the roadshow, surrounding the theme of a healthy lifestyle.
Figure 7 shows the customized falling icons used in the first game station. These icons represented a healthy lifestyle that the participants were encouraged to embrace. They included elements like having adequate sleep, healthy social interaction, positivity, consistent exercise, and a balanced diet. Each of these icons contributed to the final score that will be calculated at the end of this game session. Conversely, participants should refrain from capturing the particular icon displayed in the lower right corner of Figure 7, which depicted a negative emotion. Accidentally capturing it would cause a deduction of points for the participants. The design for this advertising mechanics drawn its inspiration from the theory of incidental learning, in which the participants acquire new knowledge on the advertised subject without any conscious effort (Rieber, 1991; Gaved et al., 2013; Xie et al., 2016; Huang et al., 2021). Given the inherent attributes of the falling icons, the participants were expected to distinguish which icons require more of their attention.
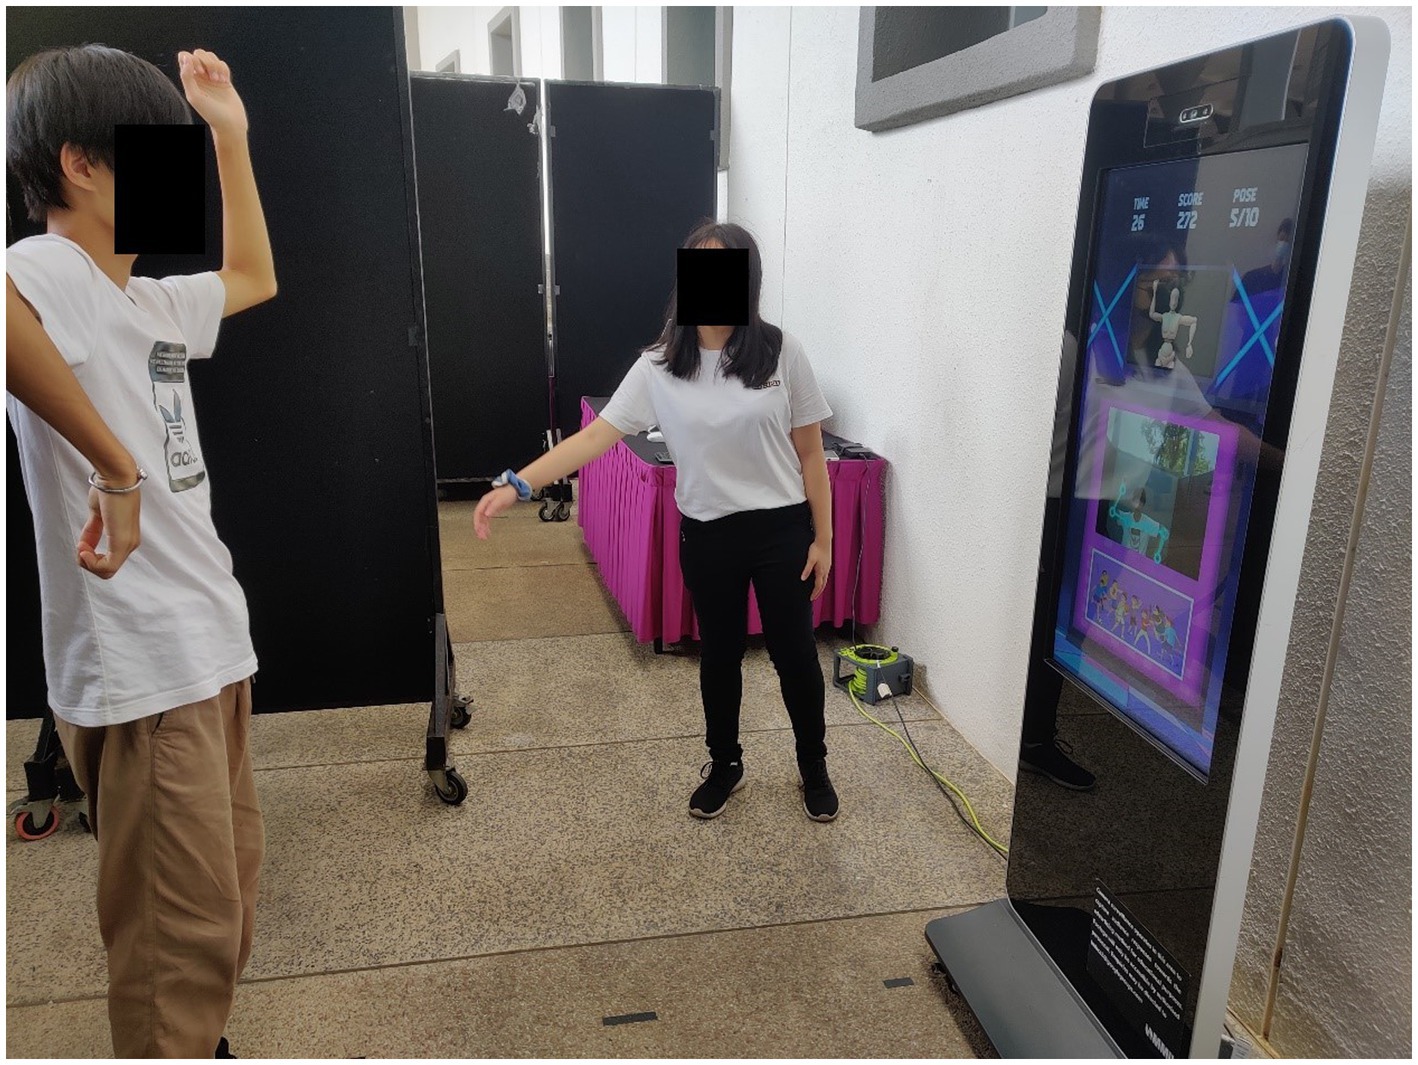
Figure 8 shows a participant taking part in the second game station with the assistance of a helper. This station utilized a game that integrated the Human Pose Estimation in its core gameplay. The participants had to perform the poses shown on the digital signage, while the camera attached on top of the digital signage would capture the performed poses. The game also included a digital banner displayed below the gameplay footage, showcasing various physical sports as the representation of an active lifestyle that suited the theme of this roadshow.
Figure 9 shows the customizable digital banner displayed below the gameplay footage for the second game station as the advertised elements. The game used in this game station emphasizes on the hedonic experience and the physical engagement that the DiSAR is offering. As the advertised elements are not directly in the gameplay experience itself, the advertising content is used to promote the advertised subject. In this case, a digital banner that showed various physical sports was placed below the gameplay footage to promote exercising for the betterment of one’s health.
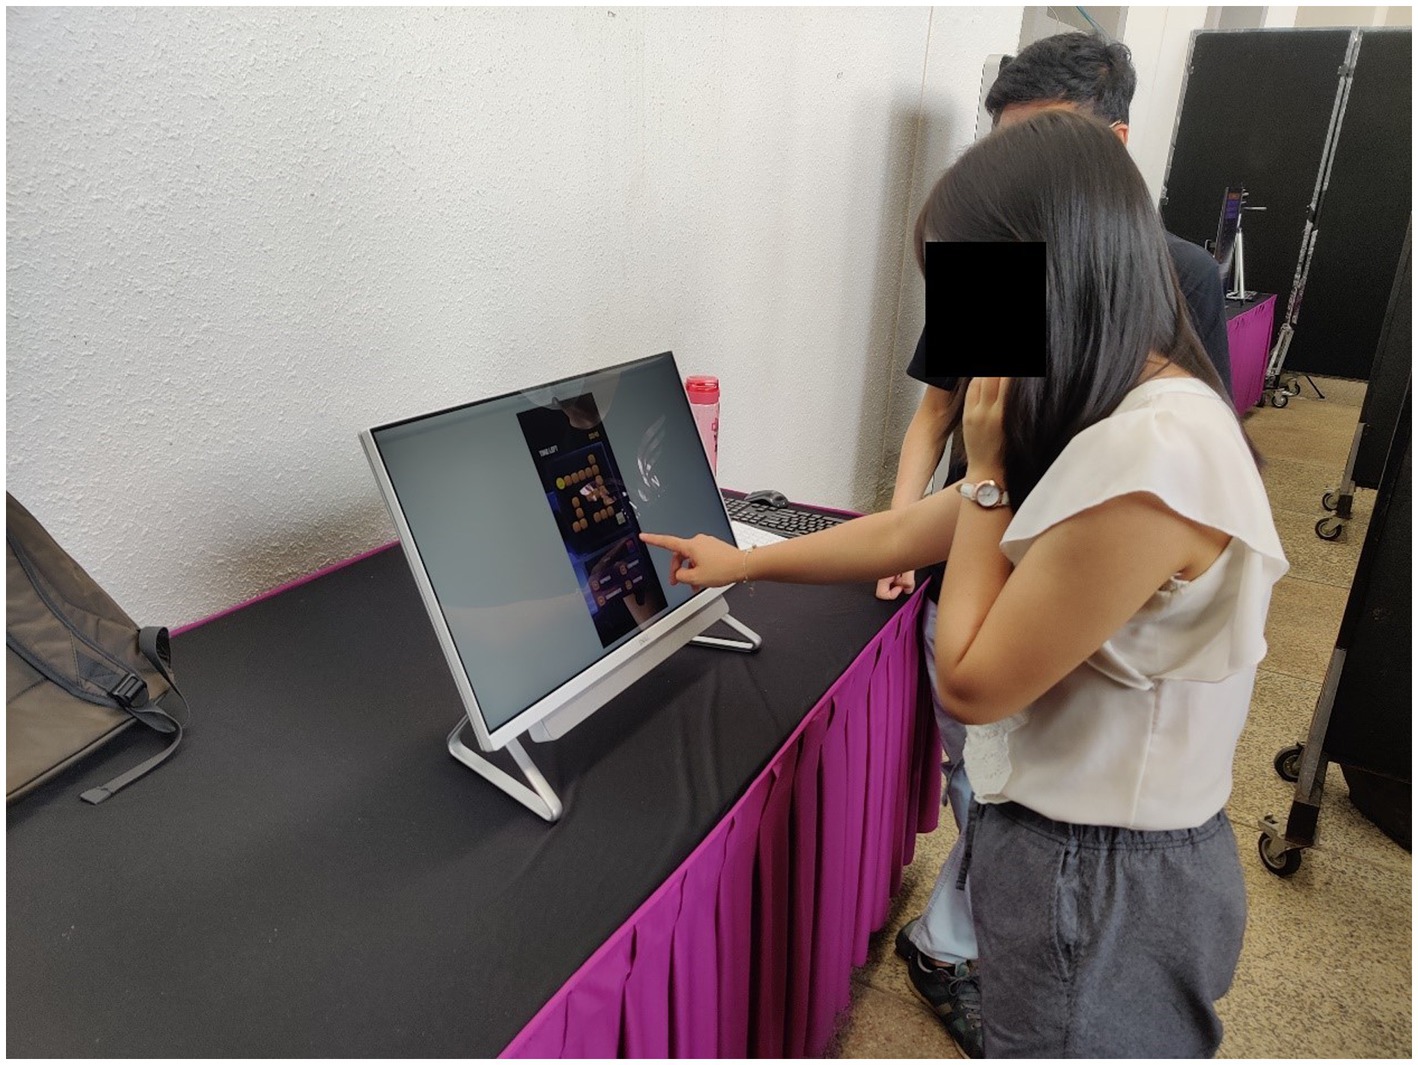
Figure 10 shows a participant taking part in the third game station with the assistance of a helper. The game that is being used for this station integrates the functionality of voice recognition. The participants have to navigate through a maze by speaking out the words that correspond to the directional movements of the character that they are controlling. The verbal directional words are customized so that they are more aligned with the theme of the roadshow.
Figure 11 shows the gameplay for the third game station, which includes the words that participants will have to articulate to navigate through the maze. The game’s customizability encompasses three aspects: character icon, destination icon and the directional words. For the purpose of this DiSAR campaign, the character was designed to be an unhappy emoji, while the destination was a collection of happy emojis. In order to guide the unhappy emoji to the destination, the participants had to control its movement with words that evoked positive emotions. Similar to the game in the first game station, this feature also leverages the theory of incidental learning to better advertise the theme of the roadshow. Subconsciously, the game was promoting the journey of managing negative thoughts through steps suggested by the directional words of the game as shown in Figure 11, empowering the participants to navigate through challenges faced in their life.
5 Results
This chapter presents the results of analyses conducted using the statistical technique discussed in the previous section. This chapter follows the widely accepted reporting style of PLS analysis, as suggested by Chin (2010).
5.1 Reflective model evaluation
5.1.1 Indicator reliability
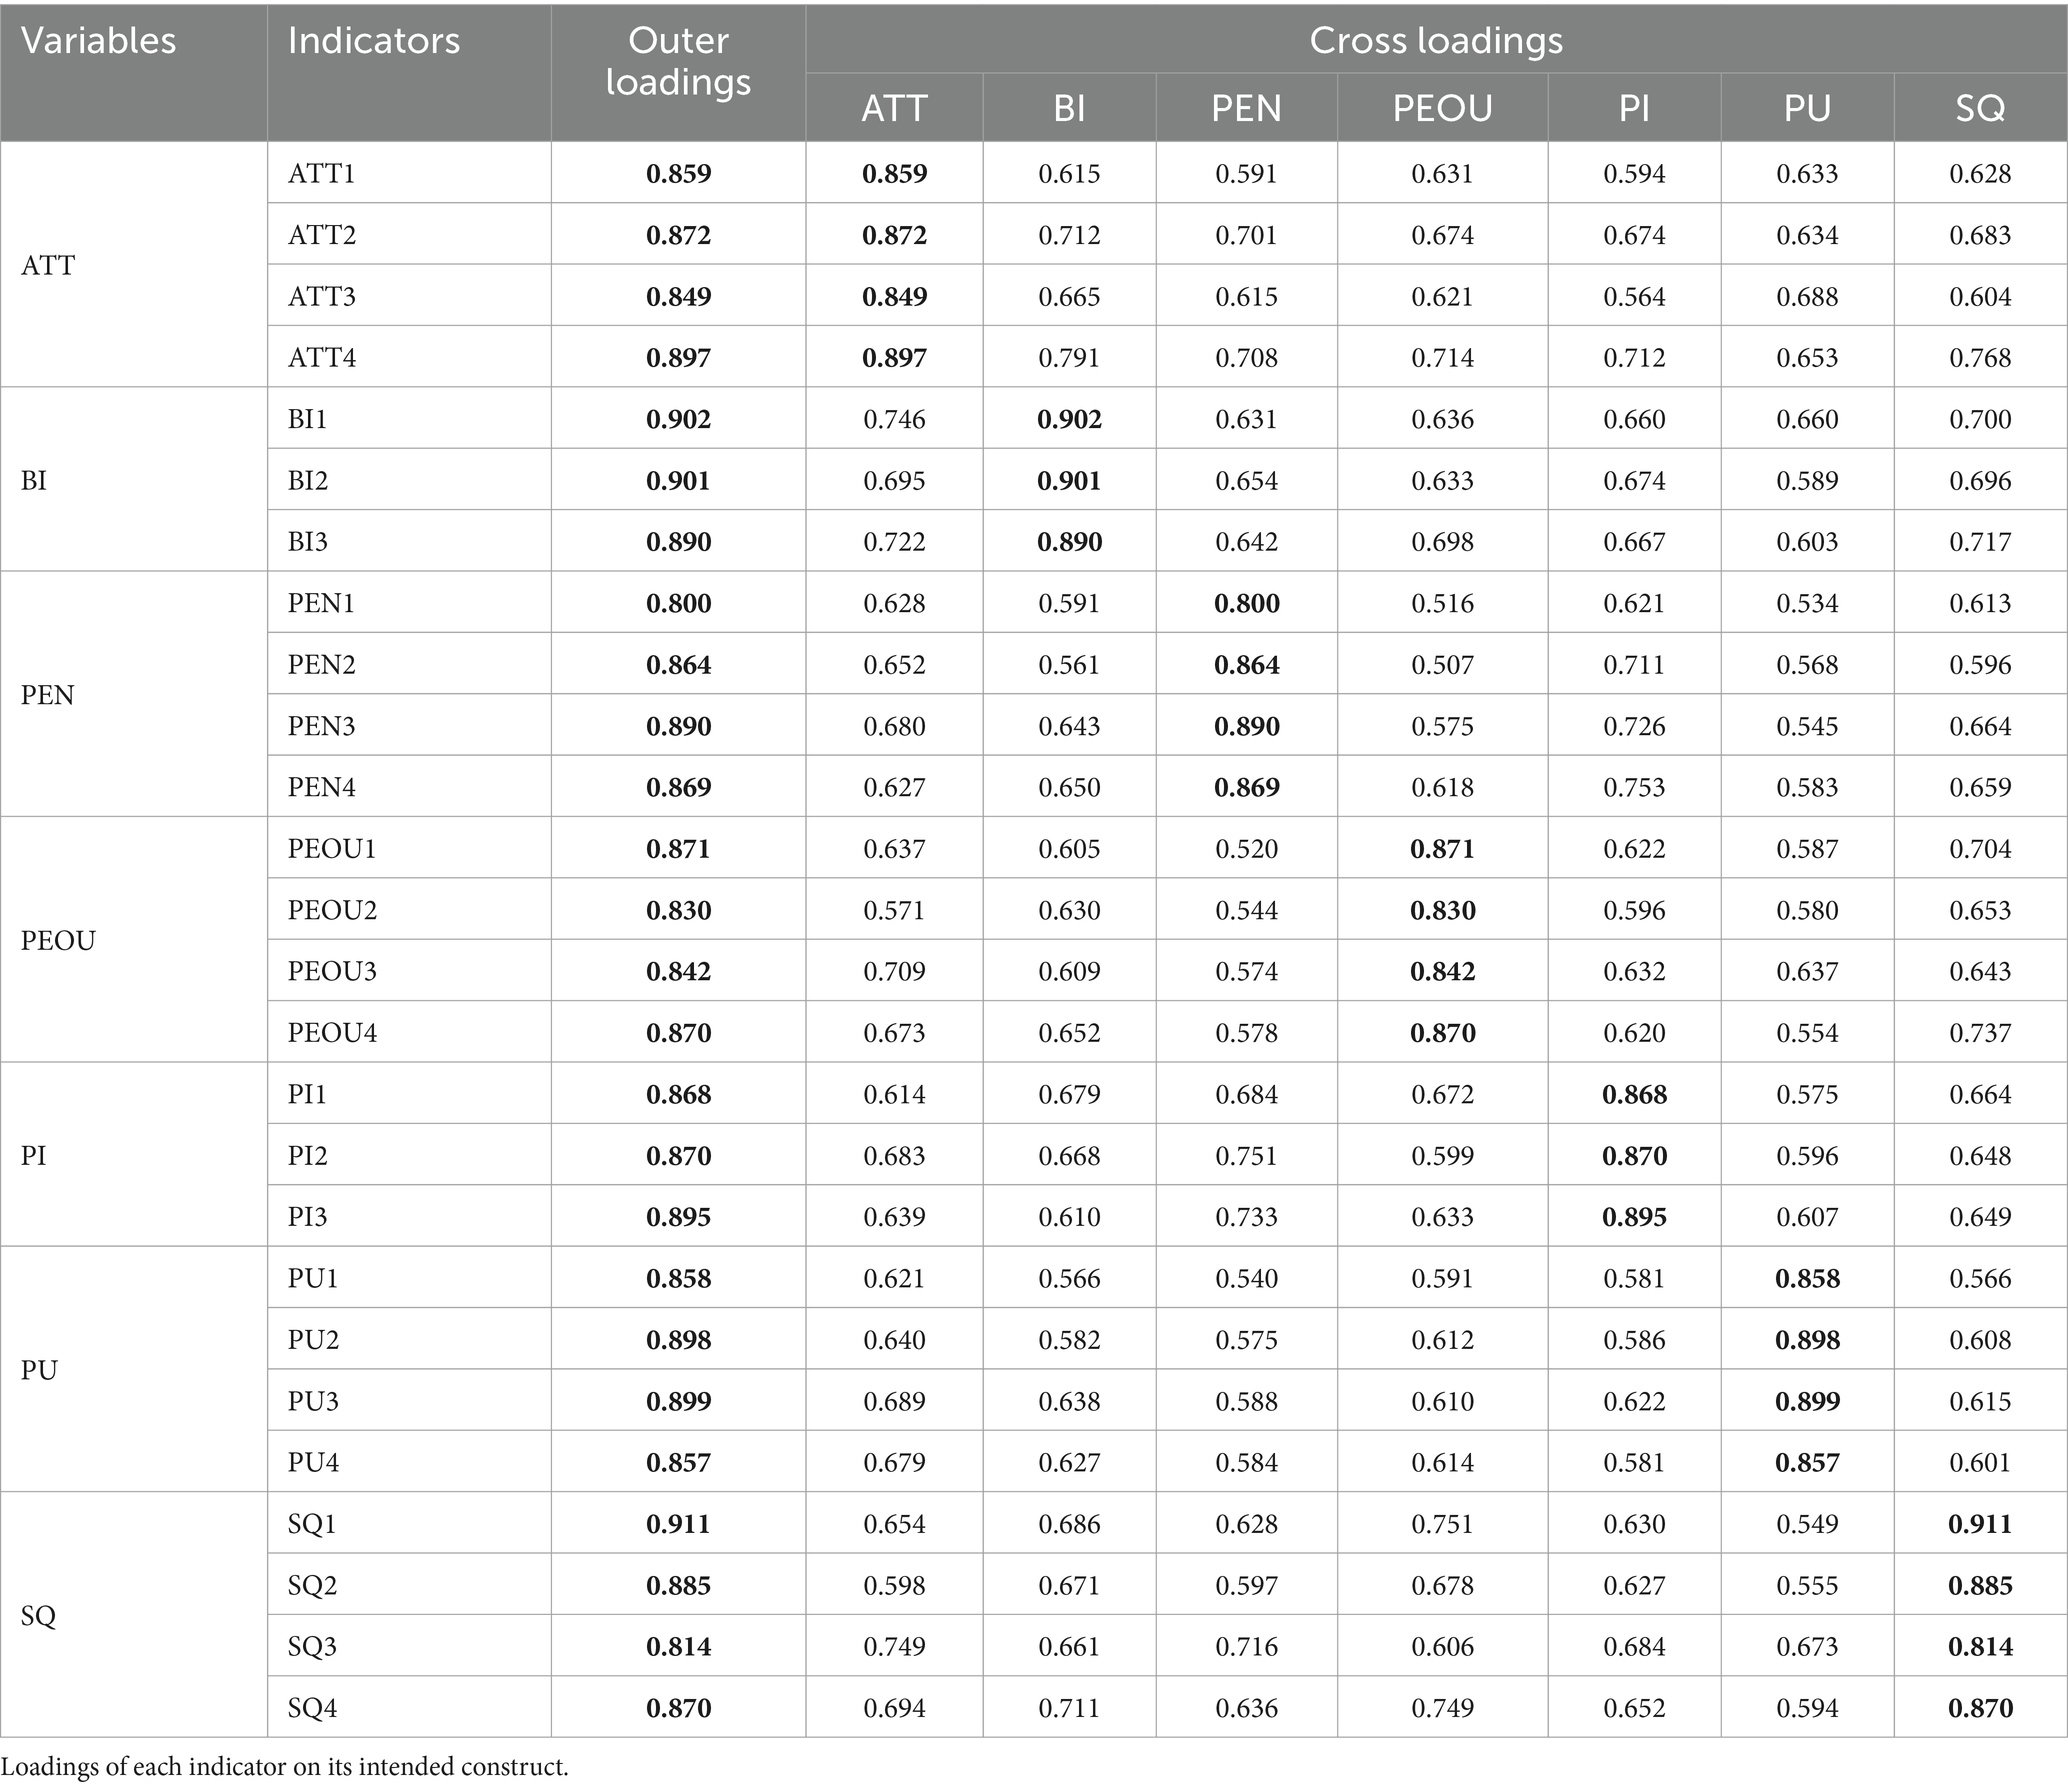
The result of the reliability testing of indicators using outer loading and cross loading is shown in Table 3. To achieve sufficient indicator reliability, each indicator’s correlation with its respective construct should have outer loading values of 0.708 or above. It is observed that the outer loadings of all the indicators have values of over 0.708. The result also shows that the indicators for each construct do not cross load significantly with the other constructs. This suggests that all the reflective indicators in the proposed model achieved a sufficient level of indicator reliability (Hair et al., 2019).
5.1.2 Internal consistency reliability
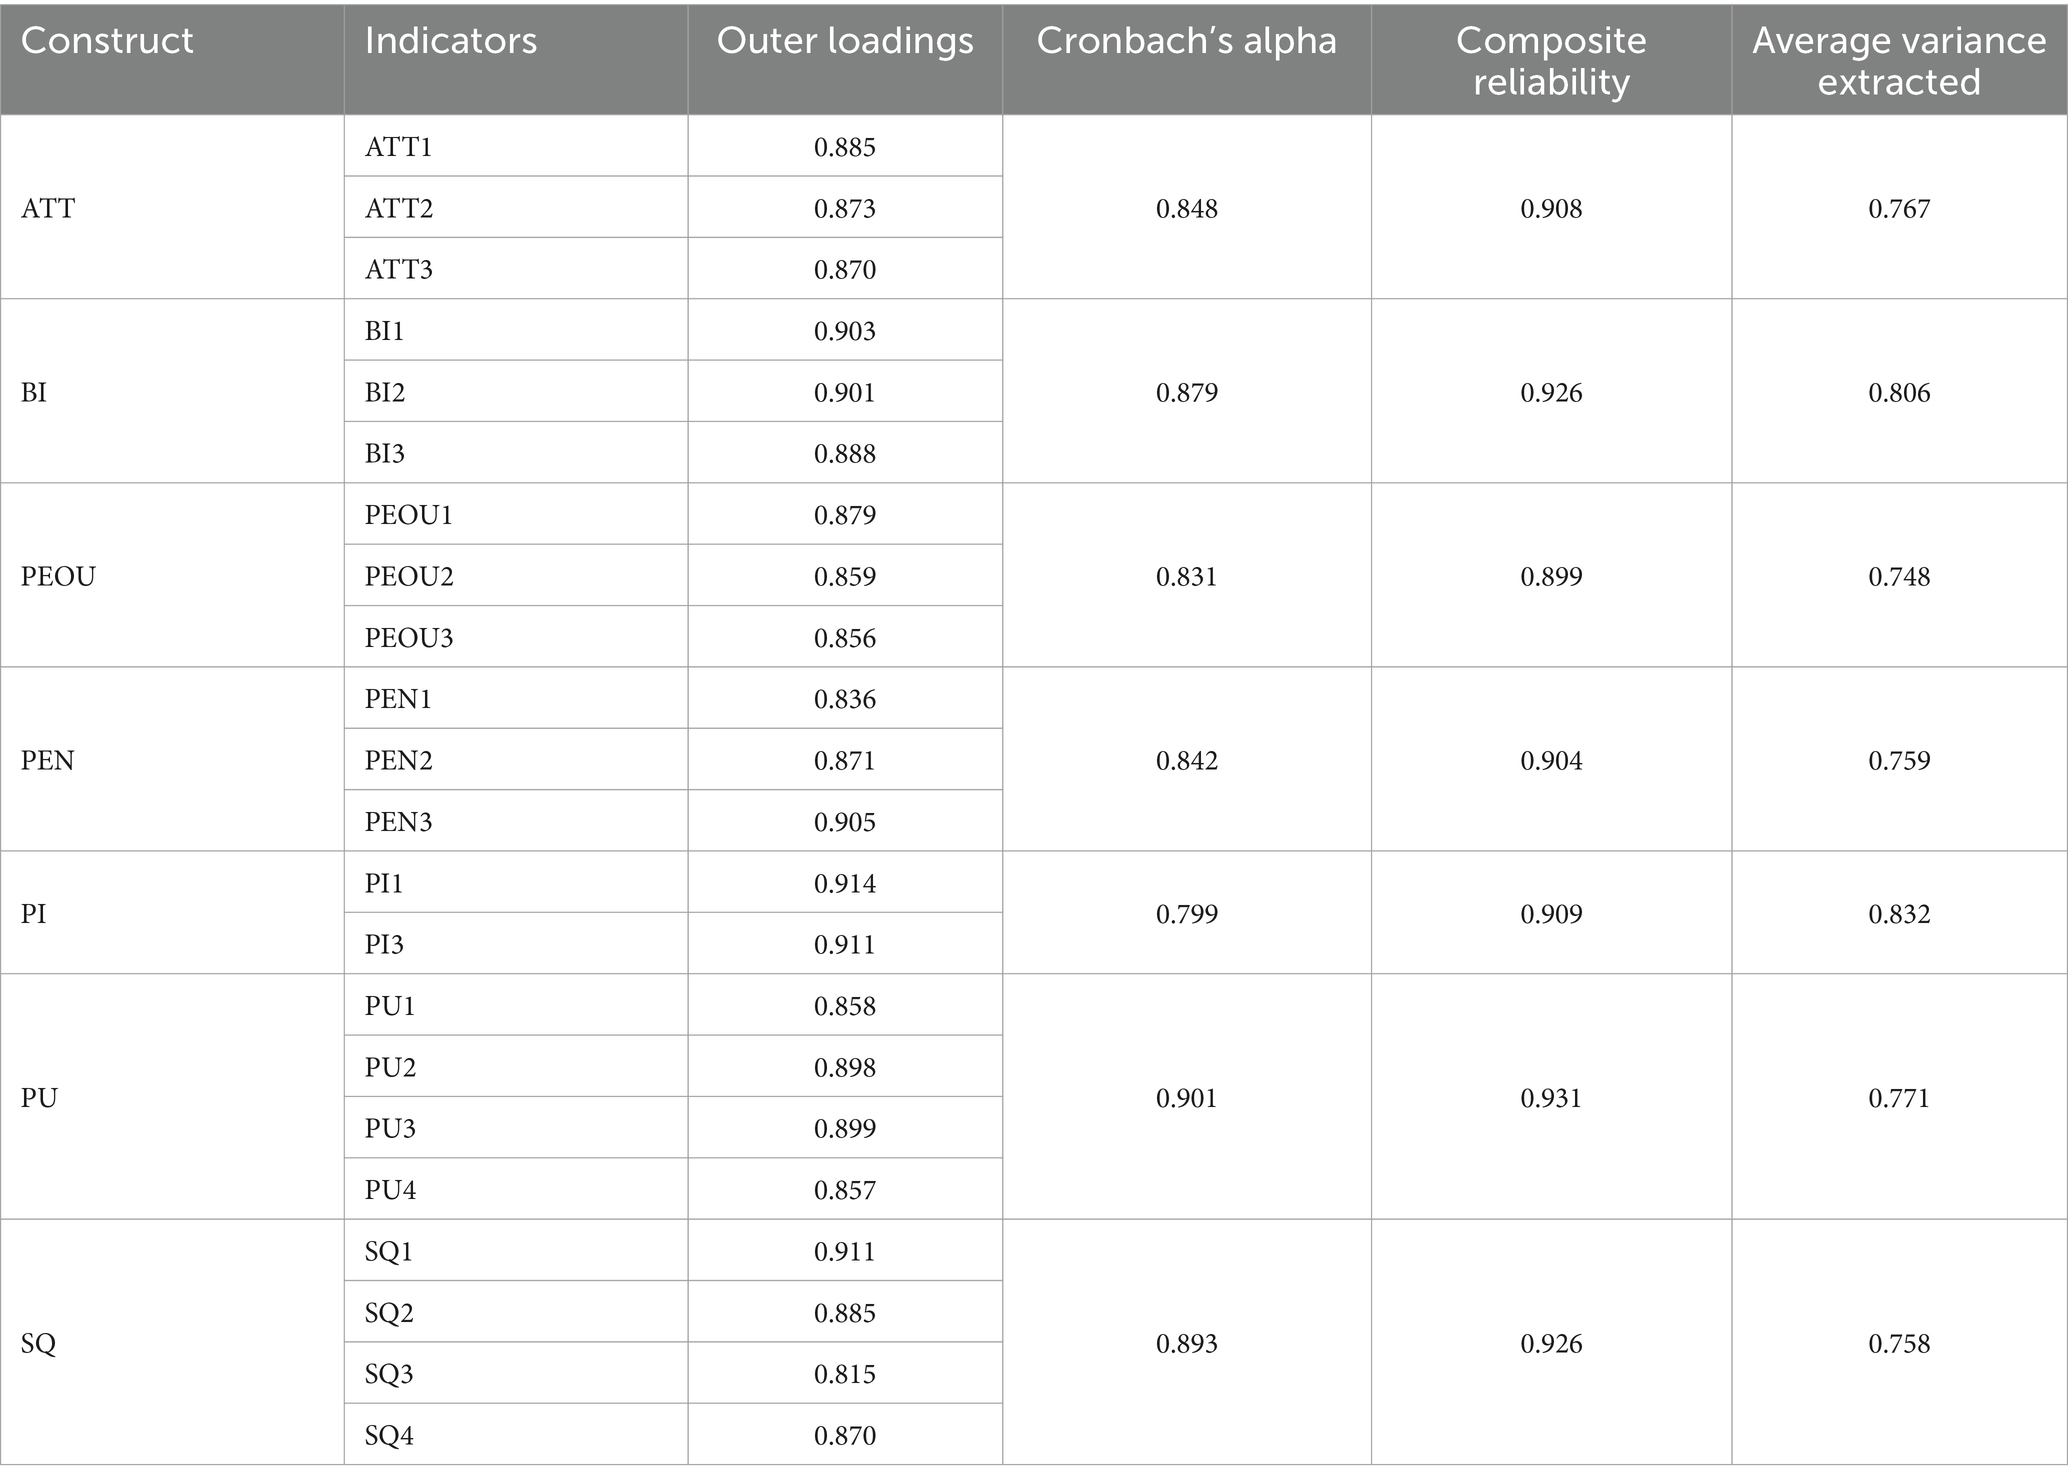
Table 4 shows the metrics for assessing construct reliability, which comprise two most commonly used methods for establishing reliability: the Composite Reliability and the Cronbach’s Alpha. Internal consistency reliability of the constructs requires values to exceed 0.70 to confirm adequate reliability of the constructs. For this study, the Cronbach’s Alpha values range from 0.799 to 0.901, whereas the Composite Reliability statistics range from 0.910 to 0.931. Both indicators of reliability have a reliability statistic over the required threshold of 0.70. This suggests that all the constructs in the proposed model were identified as having a good level of reliability (Hair et al., 2011).
5.1.3 Convergent validity
“Convergent validity is the degree to which multiple attempts to measure the same concept are in agreement. The idea is that two or more measures of the same thing should covary highly if they are valid measures of the concept” (Bagozzi et al., 1991). The results of the convergent validity based on the AVE statistics as shown in Table 5 display that all the constructs are greater than the minimum threshold value of 0.5, confirming that indicators consistently represent the same construct.
5.1.4 Discriminant validity
Table 6 shows the HTMT criterion between the constructs in the structural model for this study. Discriminant validity was assessed using the HTMT criterion, with a threshold of 0.9 to ensure that the constructs are sufficiently distinct from each other. The predefined threshold of 0.9 used in this study is recommended by Henseler et al. (2015) as TAM and its variations may present challenges in differentiation due to the similarity in empirical distinguishability. The HTMT values are obtained through bootstrapping procedure with 10,000 subsamples, as recommended by Streukens and Leroi-Werelds (2016). It is observed that the HTMT scores for all the constructs except ATT-BI, PEOU-SQ, and PEN-PI do not exceed 0.9. For the 3 values that exceeded the 0.9 threshold, a few indicators that are strongly correlated items in the opposing construct have to be removed (Hair et al., 2022).
Table 7 shows the HTMT criterion between the constructs in the structural model after removing the problematic indicators. The removal of the indicators was based on the value of its loadings when it crossed loads with the other constructs. The choice of indicators being removed were also chosen on the basis of not compromising the internal consistency reliability and convergent validity of the constructs, while improving the HTMT criterion of the affected constructs. Here, the indicators that were removed are PI2, PEN4, PEOU4, and ATT4. After the removal of the problematic indicators, the HTMT values of all the constructs are now below the 0.9 threshold.
Table 8 shows a summary of reflective model measurement metrics after the removal of the problematic indicators. All of the items in the model shows good reliability and validity. Therefore, the study continues with the model that has problematic indicators removed.
5.2 Structural model evaluation
5.2.1 Collinearity
Table 9 shows the variance inflation factor (VIF) for inner model assessment for the extended TAM, which measures the multicollinearity. According to Table 5, PU-SQ has the highest VIF value (3.363). Therefore, the VIF values for this structural model are uniformly above 0.2 and below 5, which suggests that collinearity does not reach critical levels for any of the constructs in the structural model (Hair et al., 2022).
5.2.2 Significance test results of the structural model path coefficients
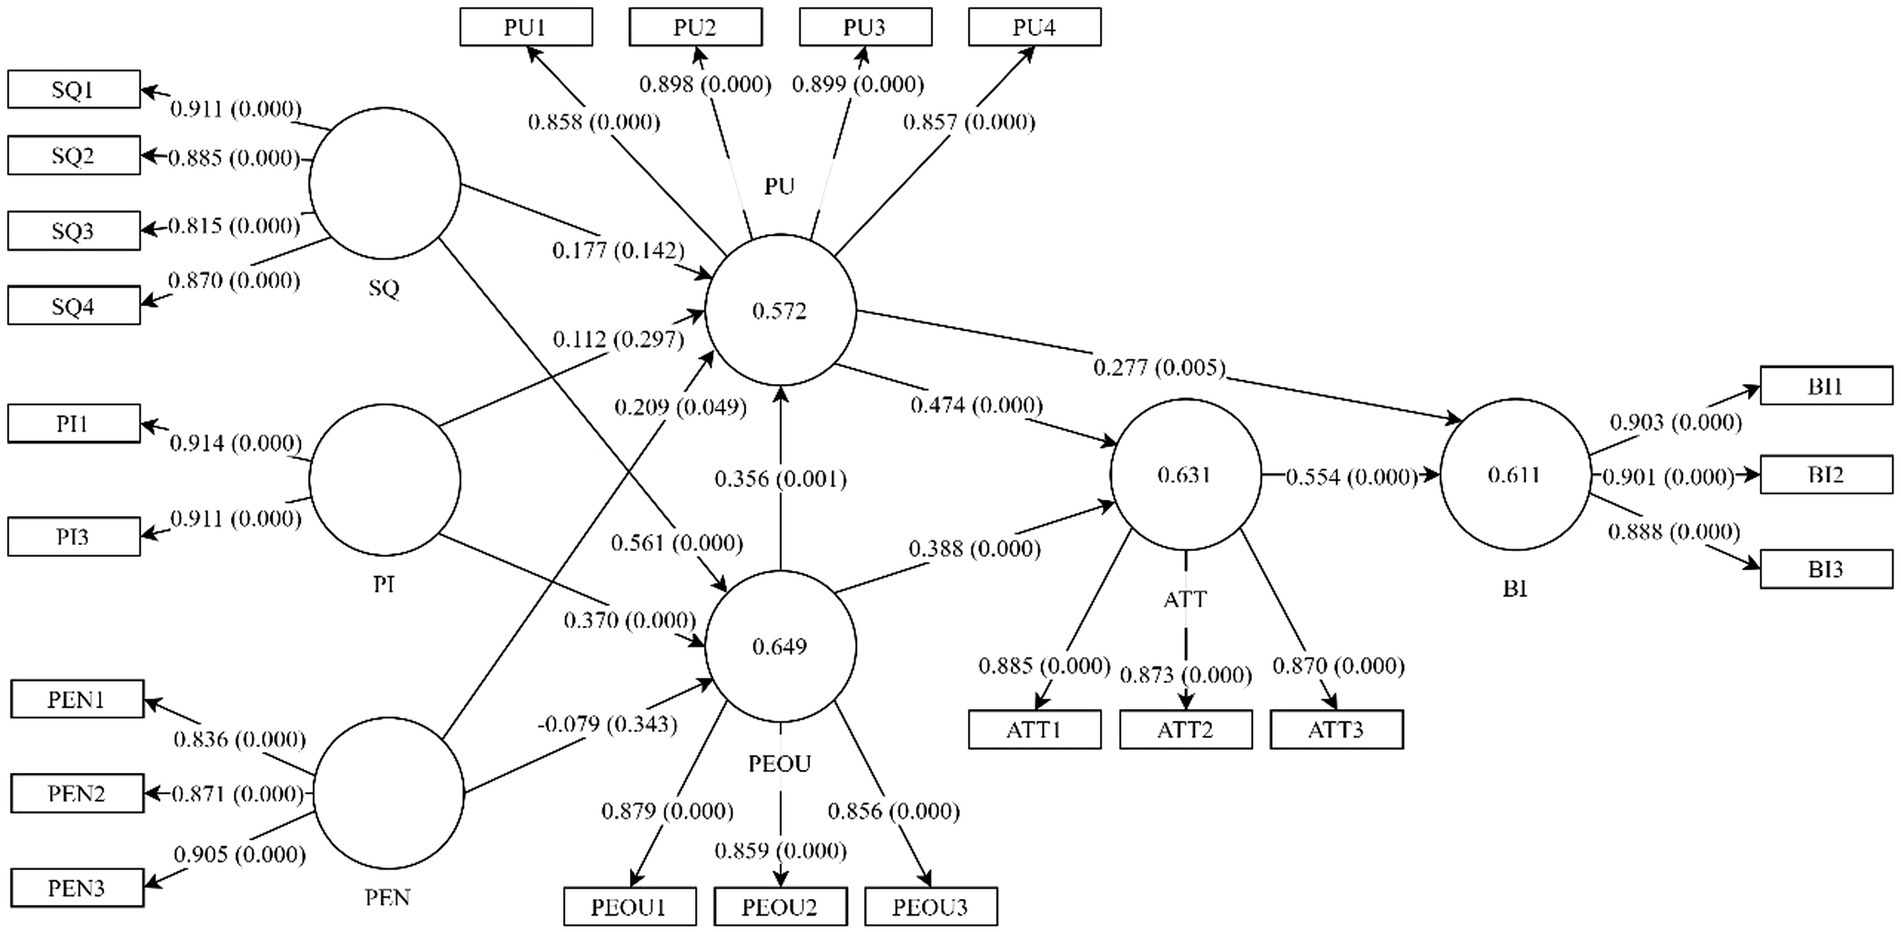
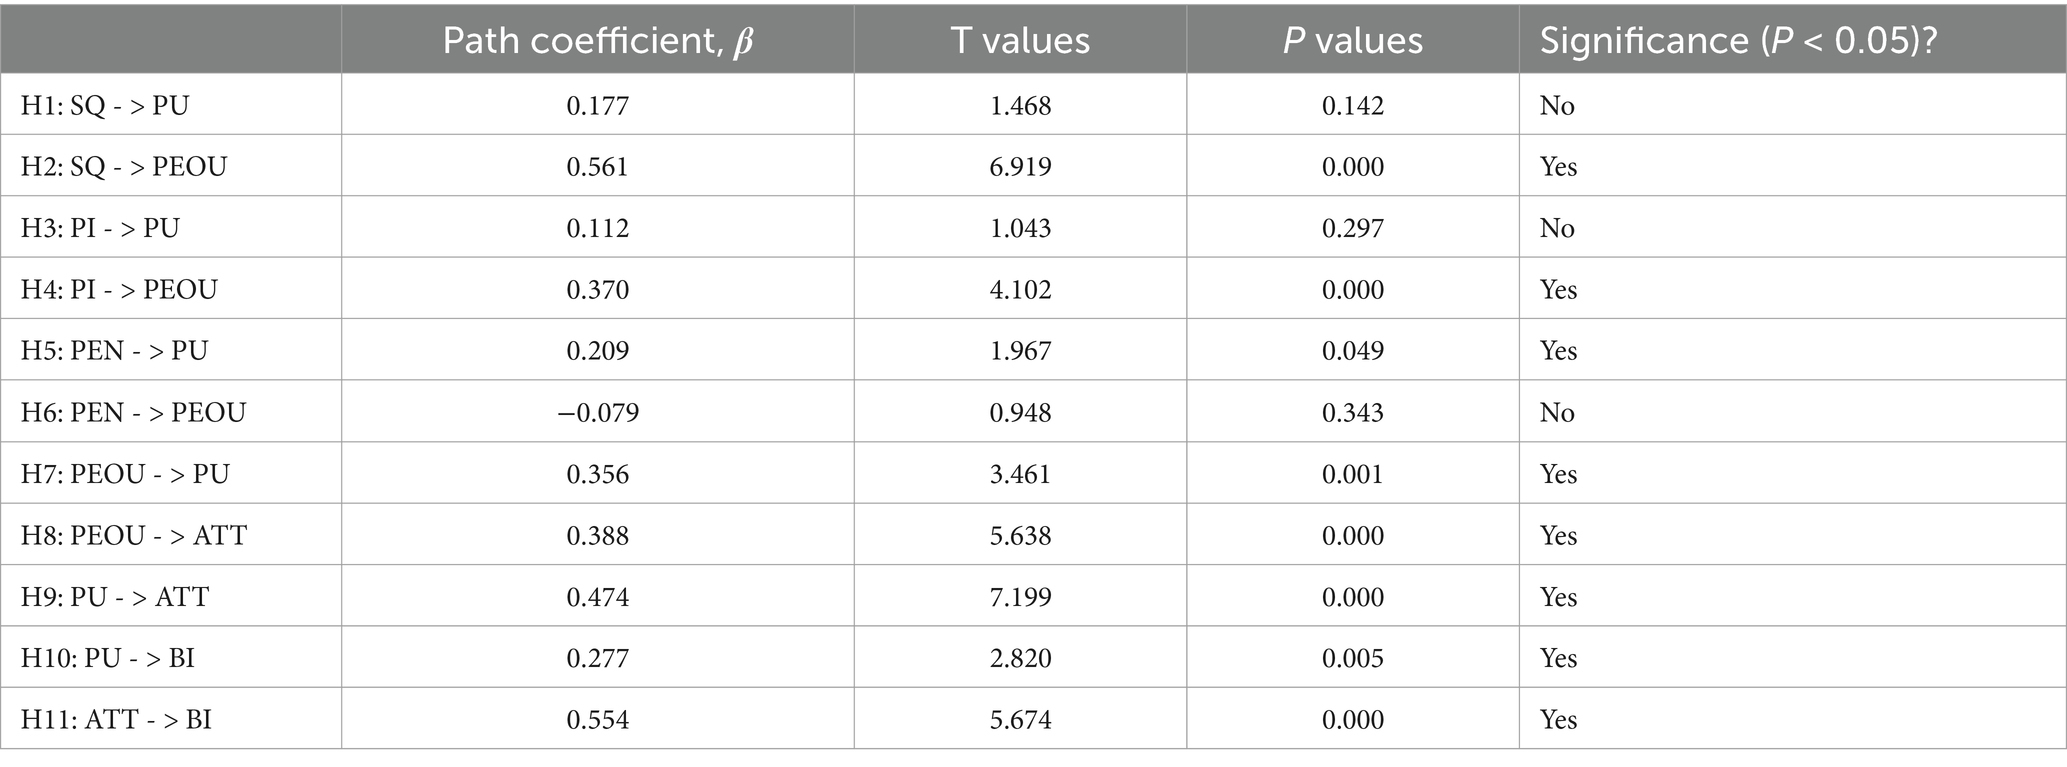
Figure 12 and Table 10 show the path coefficients and their respective significance level of the structural model. For the first external construct, there was a lack of evidence supporting the significance of the relationship between SQ and PU (p > 0.05). Therefore, H1 was not supported. However, it was found that there was a significant relationship between SQ and PEOU (β = 0.561, p < 0.05), in which H2 was supported. For PI, its relationship with PU was inconclusive as there was a lack of evidence supporting its significance (p > 0.05), which signified that H3 is not supported. However, similar to SQ, PI was found to have a significant relationship with PEOU (β = 0.370, p < 0.05), showing that H4 was supported. For PEN, it was found to have a significant relationship with PU (β = 0.209, p < 0.05), which was in line with H5. However, H6 was found to be inconclusive as the relationship between PEN and PEOU was not significant. For the path relationships between all the original TAM constructs, the relationships among all these constructs were found to be significant, supporting H7, H8, H9, H10 and H11. Out of all 11 paths that exist in the extended TAM, there were 3 paths in which their significant differences cannot be concluded. The 3 paths are PEN- > PEOU, PI- > PU, and SQ- > PU.
5.2.3 Goodness of fit (predictive and explanatory capabilities of the model)
In order to assess the goodness of fit, the coefficient of determination (R2), the effect size (f2), and the predictive relevance measure (Q2) were assessed in the present study.
The explanatory power of a model refers to its capability to accurately fit the data by measuring the strength of association in the PLS path model (Hair et al., 2022; Shmueli, 2010; Shmueli et al., 2016; Shmueli and Koppius, 2011). The coefficient of determination (R2) is the most frequently used metric to assess the explanatory power. The R2 value represents the variance explained in each of the endogenous constructs and is a measure of the model’s explanatory power (Shmueli and Koppius, 2011), which is also referred to as in-sample predictive power (Rigdon, 2012). R2 value ranges from 0 to 1, with higher levels showing higher levels of explanatory power. The results of the analysis revealed R2 value of 0.649 for PEOU. This shows that the extended constructs, which were SQ, PEN and PI, could explain 64.9% of the variance for PEOU. The R2 value for PU is at 0.572, which showed that 57.2% variance in PU could be attributed to PEOU, PEN, PI and SQ. This suggests that the additional constructs with PEOU were able to explain 57.2% of the variance for PU. For ATT, the R2 value is 0.631, which means that 63.1% variance in ATT could be attributed to PU and PEOU. Lastly, the R2 value for BI is 0.611, which means that 61.1% variance in BI could be attributed to both ATT and PU. Results indicated that the model obtained acceptable R2 statistics for the endogenous constructs as all of them exceeds 0.2, which was considered as relatively high and acceptable by behavioral research standards (Hair et al., 2017). This means that the model has sufficient explanatory power.
According to Hair et al. (2022), it is recommended that f2 effect size to be presented. f2 effect size statistics specifies if the omission of a specific predecessor construct can have a substantial impact on the dependent variable (Hair et al., 2022). In other words, f2 effect size shows how much an exogenous latent variable contributes to an endogenous latent variable’s R2 value. Guidelines for assessing f2 states that values of 0.02, 0.15, and 0.35 represent small, medium, and large effects, respectively, (Cohen, 1988). Table 11 shows the f2 values for all combinations of endogenous constructs and the corresponding exogenous constructs. For the extensions of the proposed model, it was found that SQ has a large effect on PEOU (0.364) and a small effect on PU (0.022). For PI, it was found to have a medium effect on PEOU while having no effect on PU. PEN has a small effect on PU (0.039) while having no effect on PEOU. For the other original TAM constructs, PEOU was found to have a medium effect on ATT (0.211) and a small effect on PU (0.104). PU was found to have a large effect on ATT (0.313) while having a small effect on BI (0.088). Finally, ATT was found to have a large effect on BI (0.351).
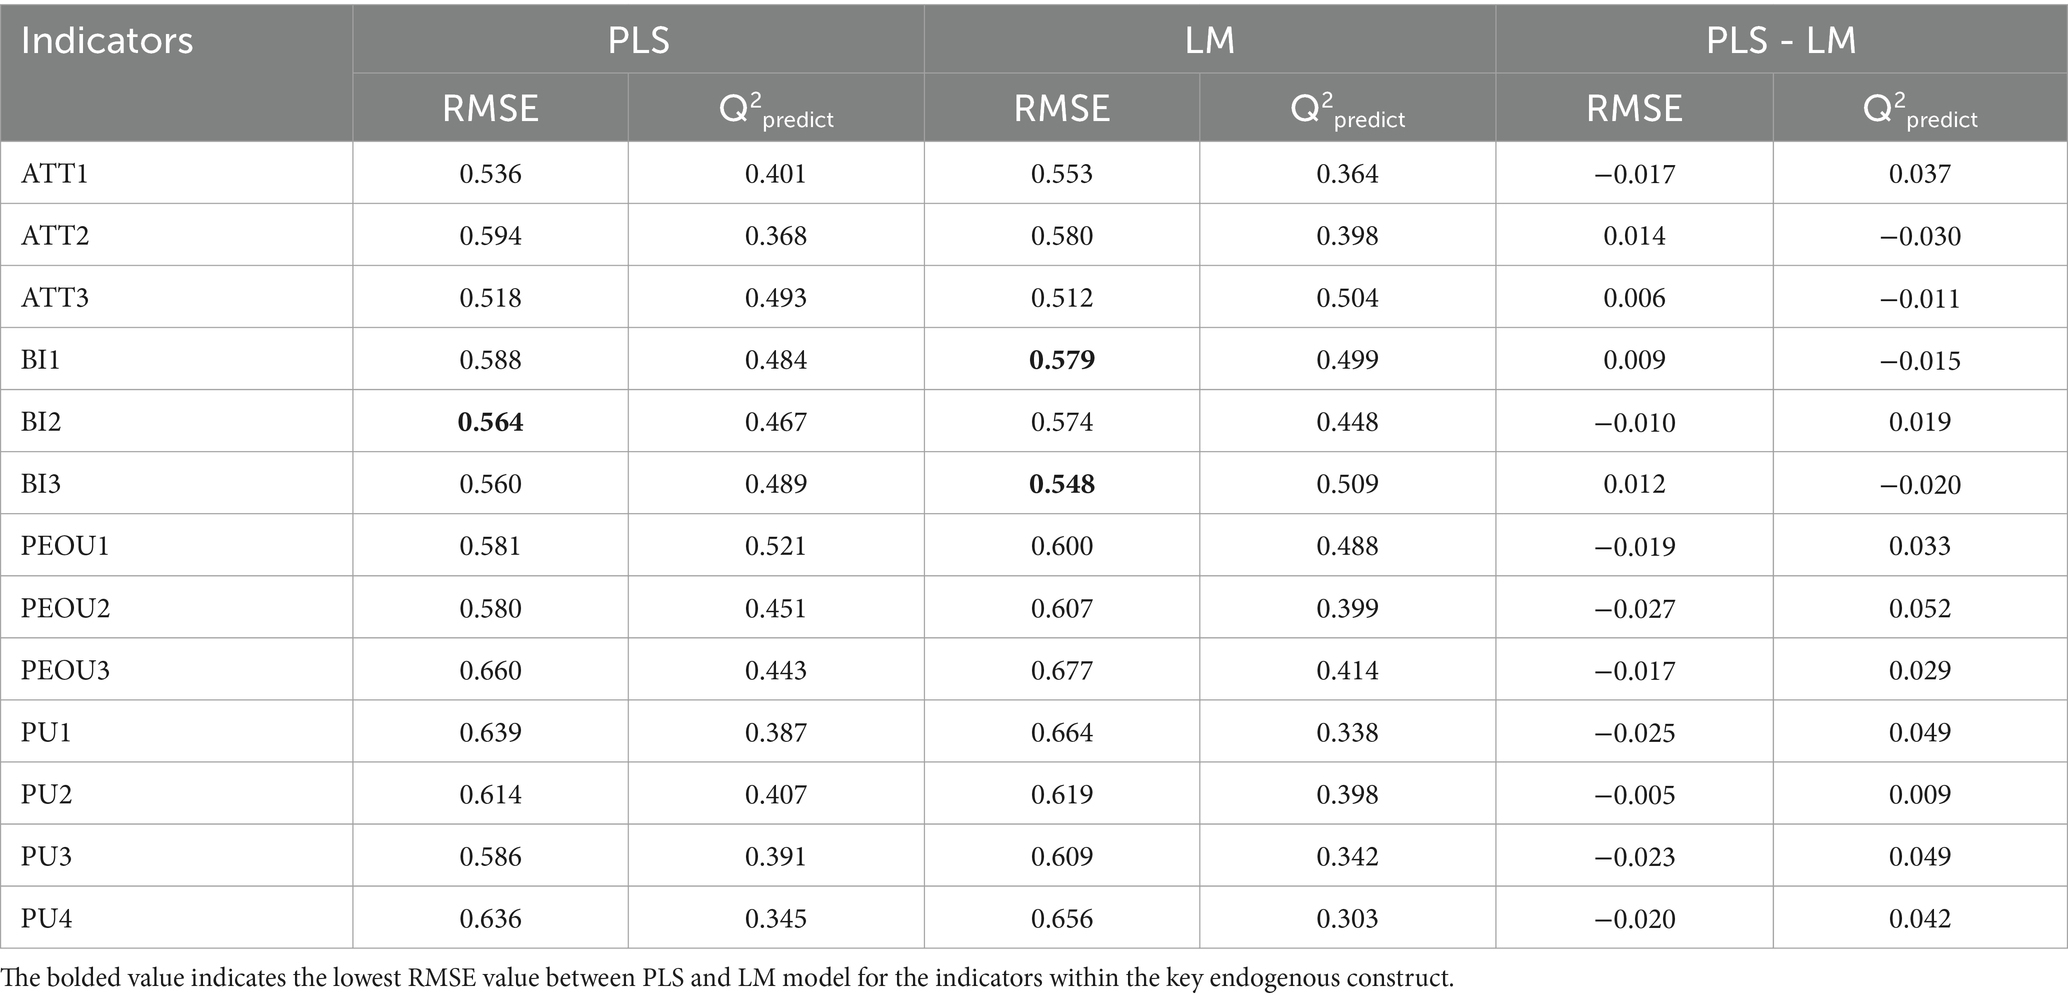
For assessing the model’s predictive power, PLSpredict procedure is used (Shmueli et al., 2019). The analysis shows that all 13 indicators have Q2predict larger than zero, which suggests that the PLS path model outperforms the most naïve benchmark (Hair et al., 2022).
The following analysis compares the RMSE values produced by the PLS-SEM analysis with those produced by the naïve LM (Linear Model) benchmark model. The construct BI will be chosen as the key target construct for the extended TAM. RMSE value is chosen as the default metric for interpreting the prediction error of the construct’s indicators. Comparing the RMSE values for the BI construct, it was found that the PLS-SEM analysis produced smaller prediction errors than the LM for 1 out of the 2 indicators. The RMSE values of the key target construct that were lower in the comparison between PLS and LM are displayed in the shaded cells in Table 12. The results suggest that the model has low predictive power, as the PLS-SEM analysis outperformed the naïve LM benchmark model for a minority of the indicators for the key target construct in the extended TAM.
6 Discussion
The findings of this study provide several theoretical and practical implications. The details and implications of these findings are discussed in the following.
6.1 Theoretical implications
For the extended variables, the findings of this study suggested that PEN influences the PU of DiSAR significantly. This is consistent with the findings from previous studies (Teo and Noyes, 2011; Abdullah et al., 2016; Zhong et al., 2021; Zhou et al., 2022; Won et al., 2023), where PEN is found to have a significant effect on PU. Therefore, enjoyment could act as a facilitator in perceiving how useful said information system is, especially when providing entertainment or hedonic elements is an integral part of the information system. The fulfilment in enjoyment for the users affects their perception towards the usefulness of the information system in several ways. When an information system is designed in a way that entertainment and hedonic elements are at the forefront of the user experience, the user may view the information system as a source of pleasure. When the goal of receiving entertainment is fulfilled in the users’ perspective, it also fulfils the perceived usefulness of the information system at the same time. Therefore, providing entertainment through interacting with DiSAR can be perceived to be one of the “uses” of DiSAR at the same time. In addition, the entertainment aspect of DiSAR helps the users to better understand and remember the advertising elements during their interaction with the digital signages. Implementing heavily gamified contents in DiSAR presents a novelty effect that captures the users’ attention, where the users are attracted to its unique approach in advertising through interacting with the advertising elements. After participating in DiSAR, the interaction may create a lasting effect among the users. This is evidenced through a study done by Vashisht (2021), where it is found that novelty results in higher brand recall. This lasting impact demonstrates that perceived enjoyment plays a crucial role in shaping perceptions of the perceived usefulness of the system. The emotional satisfaction derived from the entertaining experience further reinforce the belief that DiSAR is valuable for both its entertainment and engaging qualities.
The findings of this study also suggested that PI contributes significantly towards the PEOU of the DiSAR. This result is consistent with findings by other studies (Lee and Lee, 2019; Lee et al., 2018; Song and Zinkhan, 2008) where a similar effect is observed between PI and PEOU. This suggests that the interaction capability of the information system can contribute to the user perceiving the information system as easy to use. During the design phase of the information system, the controllability, synchronicity and bi-directionality (Yoo et al., 2010) have to be considered for the interaction capability of the information system. The controllability of DiSAR can be defined as the communicants’ level of manipulating the content of DiSAR. The synchronicity of DiSAR can be defined as the speed of communication and response of the digital signages in DiSAR which facilitates communication between the participants and DiSAR. The bi-directionality can be seen as the two-way exchange of information between the participants and the digital signage in DiSAR. Thus, when the digital signages in DiSAR have an interface layout that intuitively guides users and promptly responds to their actions, the interaction between them helps the users to grasp the required interaction methods for specific functionalities such as performing a specific action in front of the attached camera or utter specific words in a concise manner. This leads to smoother interactions between the users and the digital signages, which can further instill confidence among the users. Consequently, users view DiSAR as easy to use, increasing their overall satisfaction and likelihood of continued engagement with DiSAR.
In terms of SQ, the findings of this study suggested that it contributes significantly towards the PEOU of DiSAR. This is consistent with findings by other researchers (Yang et al., 2017; Gupta et al., 2021; Won et al., 2023), where SQ is also found to have a significant contribution to PEOU. When an information system performs reliably and produces an outcome that the user expects them to, it gives a perception of ease of use and satisfaction to the user when interacting with the information system. It also allows for more predictable interaction between the user and the information system that further increases the confidence of the users in engaging in DiSAR. On the contrary, slow and unresponsive digital signages in DiSAR may trigger frustration, leading to negative emotions and a reluctance to use the system. This further causes discrepancy between the expected and actual outcomes, which undermines the perceived ease of use of DiSAR. Therefore, this suggests that the quality related aspect of the DiSAR contributes to the users’ perception of its ease of use in a significant manner.
For the original TAM constructs, the results were consistent with previous studies applying TAM and provided empirical evidence confirming the relationships between PEOU, PU, ATT and BI in the context of the DiSAR. PEOU acts as predictor for both PU and ATT, while ATT are influenced by both PEOU and PU, and both ATT and PU contributes to predicting BI (Davis, 1985; Davis et al., 1989; Fathema, 2013; Teo and Noyes, 2011). In relation with the extended constructs, when the users perceive DiSAR to have satisfactory perceived interactivity and system quality, the users will then perceive DiSAR to be easy to use. The presence of perceived enjoyment and ease of use also contribute to DiSAR being perceived as useful by the users. Consequently, the participants will have a more positive attitude towards it. When DiSAR is both easy and enjoyable to partake, the participants require less time to calibrate themselves to interact with the digital signages. This then permits them to have more allowance to process the advertised information they want in relatively less effort, which contributes to the users perceiving DiSAR as useful. As the initial aim for the participants in interacting with DiSAR is to get more information on the advertised topics, fulfilling these aims while making the user experience as easy as possible can contribute to the participants having a more pleasant experience towards DiSAR. When DiSAR is perceived as useful for the participants to achieve their goal, while having a positive attitude towards it at the same time, it will be likely that the participants will choose to use it more often in the future for the same purpose.
In this study, it is found that the proposed extended TAM possesses a good amount of explanatory power. The empirical findings on the explanatory power of this model suggest that the proposed extended TAM can explain user acceptance through the model itself. The results are aligned with TAM’s role as an explanatory model (Mojtahed et al., 2011). However, concerning the predictive power of the model, the PLSpredict procedure suggests that the model has lower predictive power compared to the naïve LM benchmark (Hair et al., 2022; Shmueli et al., 2019). This suggests that, while the model can explain user acceptance based on the data on hand, it may produce subpar predictive results if predictive work is performed using the proposed model. However, as this research is more on understanding the formation of user acceptance of the participants towards DiSAR, the process is focused on the ability of the model to explain the user acceptance of DiSAR. Reporting the predictive power statistics is to provide a more holistic perspective in the performance of this model.
6.2 Practical implications
The findings of this study provide several practical implications for roadshow designers for DiSAR, particularly the content designers. As PEN was found to be contributing to PU significantly, it is important for roadshow designers to carefully consider the hedonic experience of participants by incorporating fun, enjoyable and more engaging functionalities into the roadshow. Heavily gamified content can be included in DiSAR to fully leverage its interaction capability. The contents can be based on the ways the participants interact with the digital signages either through touch-sensitive screens, cameras, or microphones. Content that uses advanced features such as voice recognition and computer vision can also be used if the digital signages are equipped with more powerful peripherals. The addition of these input methods increases the physical interaction space between the user and a digital signage from a flat display to an entire space surrounding the digital signage itself. Such scenario opens up the possibility for further research and development in developing gamified contents utilizing these additional features.
Since PI has a significant influence on the PEOU of DiSAR, it is crucial to understand how to maximize the interactive capability of digital signage to lessen the difficulty and learning curve of interacting with it, while providing a more tactile and fun interactive experience. The content designers for DiSAR should take into consideration the vision, audio and touch aspect of every content, so that the multimedia aspects of the digital signage can be fully exploited to better achieve multi-sensory interactive experience for the users. For instance, enhancing the interactivity of a button on a touch-sensitive screen can involve integrating animations and sounds that replicate the tactile feel of pressing a physical button. The interaction latency between the user and the digital signage has to be carefully considered by the content designers, as “tactile communication needs to be kept low latency in order to achieve an immersive effect” (Zhu, 2022). As this research has demonstrated the integration and usage of different input devices into digital signages, it also serves as a reference for digital signage manufacturers on the interactive potential of digital signages. Consequently, there is an opportunity for research and development aimed at enhancing the existing layout and design with the integration of multiple input devices. Such initiative can further promote the digital signage as a multimodal advertising platform, consequently contributing to the increased popularity and adoption of the digital signage-based advertising solutions, such as the DiSAR.
As it is found that SQ is having a significant influence on the PEOU of the DiSAR, this demands extra attention for the content designers towards the quality-related aspect of the information system. During the setup of a DiSAR, there needs to be deliberate consideration on the quality and stability of the entire system. For instance, it is crucial to test the advertised content in advance to ensure it is free of errors. This prevents any incidents that may interrupt the flow of interacting with the digital signages, which could negatively affect the participant’s overall DiSAR experience. Such consideration also applies to the underlying hardware for the digital signages as well. The computer hardware in a DiSAR should be of high quality to minimize the likelihood of technical issues to the greatest extent possible. For example, as all of the digital signages in a DiSAR are interconnected to each other, a stable and reliable internet connection becomes critical to ensure that the whole roadshow flow is uninterrupted. The consideration of the physical setup location for each digital signages in a DiSAR is also important to ensure optimal functionality to preserve its quality. This is of utmost important when the digital signages in a DiSAR is spread out in multiple locations that may have high foot traffic. The surrounding environment may directly impact the quality of interaction between the users and digital signage. Interruptions such as strong sunlight and loud noises should be carefully avoided through manipulating the orientation and location of the digital signages. This ensures a consistent interaction between the users and digital signage that remains unaffected by the surrounding, thereby maintaining the perceived quality of the system.
6.3 Limitations and future research
Based on the insights obtained through this study, both the researchers and the DiSAR developers can make informed decisions regarding the optimization of the DiSAR roadshow framework in the future. The findings provide insights on not just the performance of the extended TAM itself but also shed light on the underlying mechanism of the formation of user acceptance among the participants while taking part in DiSAR. The findings serve as a foundation for the researchers and DiSAR developers to further optimize and improve the current DiSAR roadshow framework to better leverage its characteristics in engaging audiences and achieving its intended objectives in the advertising activities.
Although the population used is suitable for the context of DiSAR deployment in this study, future research could build on this by testing the DiSAR framework with different types of advertising and a wider range of audiences, such as professionals, retail consumers, or people from different age groups. This would help to better understand how the model works in different situations and make it more widely applicable. Conducting a more comprehensive investigation that includes a more diverse population and advertising subject would enrich the pool of knowledge on this subject.
Although the extended TAM used in this study was proposed to model the user acceptance of DiSAR, it can also be used in other settings with some adjustments to the wordings of the questionnaire. The additional constructs that were added to this extended TAM can be effectively applied to understand user acceptance in various domains. One of the examples that this extended TAM can be utilized is to model the user acceptance of healthcare applications that focuses on rehabilitation with gamification. In this context, the extended TAM can be customized to assess the system quality, perceived interactivity and perceived enjoyment of the application to better understand its user acceptance. This demonstrates the adaptability of the extended TAM beyond its original scope across different technological landscapes.
Future studies could look into mediation and moderation analysis between the extended constructs and the existing TAM constructs. Such study may reveal more in-depth details on how the extended constructs may intervene in the cause-effect relationships. The insights obtained from such a study can assist in determining decisions on possible interventions required in the future to further improve the DiSAR operation.
7 Conclusion
This study focuses on the evaluation of an extended TAM to model the user acceptance of participants in a DiSAR. Considering the unique characteristics and context of use of DiSAR, the TAM was extended with additional constructs. These constructs reflect the unique characteristics of DiSAR, which can better explain how these characteristics influence user acceptance among participants.
To gather data for a quantitative study, a survey was administered during a prototype DiSAR campaign, which the participants were asked to complete at the end of the campaign. PLS-SEM was used to assess the overall performance of the extended TAM, aiming to understand the relationship between the extended constructs and the original TAM constructs.
The proposed extended TAM includes constructs that can assist in better understand the influence on user acceptance of DiSAR, which includes Perceived Interactivity (PI), Perceived Enjoyment (PEN), and System Quality (SQ). These constructs were added as antecedents to both Perceived Usefulness (PU) and Perceived Ease of Use (PEOU) to understand the influence of the characteristics of DiSAR on the key determinants of user acceptance.
Through a comprehensive statistical analysis process using PLS-SEM, it was found that the model showed good validity and reliability after the removal of certain indicators that cross-loaded with other constructs. Significance testing on the path coefficients also suggested that SQ and PI have a significant relationship with PEOU, while PEN has a significant relationship with PU. Structural model analysis also showed that the model has good explanatory power. Specifically, the extended TAM accounted for 61% of the intention to use DiSAR among the participants.
This study highlights the applicability of the extended TAM in the context of DiSAR participation. The inclusion of additional variables in the original TAM provides more valuable insights into how the characteristics of DiSAR influence user acceptance among participants. The obtained insights are important in driving development required to further enhance the overall DiSAR framework towards higher user acceptance in the future.
Data availability statement
The raw data supporting the conclusions of this article will be made available by the authors, without undue reservation.
Ethics statement
The studies involving humans were approved by Dr. Olivia Tan Swee Leng Technology Transfer Office TTO Secretariat of Research Ethics Committee. The studies were conducted in accordance with the local legislation and institutional requirements. The participants provided their written informed consent to participate in this study. Written informed consent was obtained from the individual(s) for the publication of any potentially identifiable images or data included in this article.
Author contributions
Y-FT: Conceptualization, Data curation, Formal analysis, Investigation, Methodology, Software, Visualization, Writing – original draft, Writing – review & editing. M-CL: Conceptualization, Funding acquisition, Methodology, Project administration, Resources, Supervision, Validation, Writing – review & editing. L-YO: Conceptualization, Funding acquisition, Project administration, Resources, Supervision, Validation, Writing – review & editing.
Funding
The author(s) declare that financial support was received for the research, authorship, and/or publication of this article. This research was funded by Telekom Malaysia Research and Development, RDTC/221073 (MMUE/230002) and the Multimedia University.
Conflict of interest
The authors declare that the research was conducted in the absence of any commercial or financial relationships that could be construed as a potential conflict of interest.
Publisher’s note
All claims expressed in this article are solely those of the authors and do not necessarily represent those of their affiliated organizations, or those of the publisher, the editors and the reviewers. Any product that may be evaluated in this article, or claim that may be made by its manufacturer, is not guaranteed or endorsed by the publisher.
References
Abdullah, F., Ward, R., and Ahmed, E. (2016). Investigating the influence of the most commonly used external variables of TAM on students’ perceived ease of use (PEOU) and perceived usefulness (PU) of e-portfolios. Comput. Hum. Behav. 63, 75–90. doi: 10.1016/j.chb.2016.05.014
ABI Research (2011). Digital signage revenue to approach $4.5 billion in 2016, ABI research. Available at: https://www.abiresearch.com/press/digital-signage-revenue-to-approach-45-billion-in (Accessed February 11, 2022).
Acikgoz, F., and Vega, R. P. (2022). The role of privacy cynicism in consumer habits with voice assistants: a technology acceptance model perspective. Int. J. Hum. Comput. Interact. 38, 1138–1152. doi: 10.1080/10447318.2021.1987677
Afthanorhan, A., and Afthanorhan, B. (2013). A comparison of partial Least Square structural equation modeling (PLS-SEM) and covariance based structural equation modeling (CB-SEM) for confirmatory factor analysis.PDF. Int. J. Eng. Sci. Innov. Technol. 2, 198–205.
Ajibade, P. (2018). Technology acceptance model limitations and criticisms: exploring the practical applications and use in technology-related studies, mixed-method, and qualitative researches. Libr. Philos. Pract. 9.
Ajzen, I., and Fishbein, M. (1980). Understanding attitudes and predicting social behavior. Prentice-Hall.
Alharbi, S., and Drew, S. (2014). Using the technology acceptance model in understanding academics’ Behavioural intention to use learning management systems. Int. J. Adv. Comput. Sci. Appl. 5:120. doi: 10.14569/ijacsa.2014.050120
Al-Rawi, S. S., Jumah, H. A., Ibrahim, A. H., Hamdy, H. A., Hama, H. A., Dogara, A. M., et al. (2022). Depression, anxiety and stress level among university students of class reentry post Covid-19 pandemic. Int. J. Soc. Sci. Educ. Stud. 9:197. doi: 10.23918/ijsses.v9i2p197
Bagozzi, R. P., Yi, Y., and Phillips, L. W. (1991). Assessing construct validity in organizational research. Adm. Sci. Q. 36:421. doi: 10.2307/2393203
Bernama (2022). Public higher learning institution students to return to campus in stages beginning march 1, New Straits times. Available at: https://www.nst.com.my/news/nation/2022/02/770115/public-higher-learning-institution-students-return-campus-stages (Accessed May 29, 2023).
Burke, R. R. (2009). Behavioral effects of digital signage. J. Advert. Res. 49, 180–185. doi: 10.2501/S0021849909090254
Chandio, F. H., Burfat, F. M., Abro, A. A., and Naqvi, H. F. (2017). Citizens’ acceptance and usage of electronic-government services: a conceptual model of trust and technological factors. Sindh Univ. Res. J. 49, 665–668. doi: 10.26692/surj/2017.09.36
Chen, Q., Malric, F., Zhang, Y., Abid, M., Cordeiro, A., Petriu, E., et al. (2009). Image Analysis and Recognition: 6th International Conference, ICIAR 2009, Proceedings. 6, 347–358. Halifax, Canada: Springer Berlin Heidelberg.
Chin, W. W. (2010). “How to write up and report PLS analyses” in Handbook of partial least squares: Concepts, methods and applications. eds. V. E. Vinzi, W. W. Chin, J. Henseler, and H. Wang (Berlin: Springer Berlin Heidelberg), 655–690.
Choi, G. Y. (2018). Learning through digital storytelling: exploring entertainment techniques in lecture video. Educ. Media Int. 55, 49–63. doi: 10.1080/09523987.2018.1439710
Chopra, G., Madan, P., Jaisingh, P., and Bhaskar, P. (2019). Effectiveness of e-learning portal from students’ perspective. Interact. Technol. Smart Educ. 16, 94–116. doi: 10.1108/ITSE-05-2018-0027
Cohen, J. (1988). Statistical power analysis for the behavioural sciences. Hillside, NJ: Lawrence Earlbaum Associates.
Da Chen, L., Gillenson, M. L., and Sherrell, D. L. (2002). Enticing online consumers: an extended technology acceptance perspective. Inf. Manag. 39, 705–719. doi: 10.1016/S0378-7206(01)00127-6
Damask, K. (2021). A look at how media players are pushing the boundaries of possibilities, digital signage today. Available at: https://www.digitalsignagetoday.com/articles/a-look-at-how-media-players-are-pushing-the-boundaries-of-possibilities/ (Accessed February 11, 2022).
Davis, F. (1985). A technology acceptance model for empirically testing new end-user information systems : Massachusetts Institute of Technology.
Davis, F. (1989). Perceived usefulness, perceived ease of use, and user acceptance of information technology. MIS Q. 13, 319–340. doi: 10.2307/249008
Davis, F., Bagozzi, R., and Warshaw, P. (1989). User acceptance of computer technology: a comparison of two theoretical models. Manag. Sci. 35, 982–1003. doi: 10.1287/mnsc.35.8.982
Davis, F., Bagozzi, R. P., and Warshaw, P. R. (1992). Extrinsic and intrinsic motivation to use computers in the workplace. J. Appl. Soc. Psychol. 22, 1111–1132. doi: 10.1111/j.1559-1816.1992.tb00945.x
Delone, W., and McLean, E. (2003). The DeLone and McLean model of information systems success: a ten-year update. J. Manag. Inform. Syst. 19, 9–30. doi: 10.1080/07421222.2003.11045748
Digital Signage Today (2010). Nielsen study: DOOH increases revenue at the point of sale, digital signage today. Available at: https://www.digitalsignagetoday.com/news/nielsen-study-dooh-increases-revenue-at-the-point-of-sale-2/ (Accessed February 11, 2022).
Fathema, N. (2013). Structural equation modeling (SEM) of an extended technology acceptance model (TAM) to report web technology adoption behavior in higher education institutions. PhD Thesis, Auburn University.
Fishbein, M., and Ajzen, I. (1975). Belief, attitude, and behaviour: an introduction to theory and research. Boston: Addison-Wesley Publishing Co, Inc.
Fleming, N. D., and Mills, C. (1992). Not another inventory, rather a catalyst for reflection, to improve the academy. A Journal of Educational Development. 246.
Fornell, C., and Bookstein, F. L. (1982). Two structural equation models: LISREL and PLS applied to consumer exit-voice theory. J. Mark. Res. 19, 440–452. doi: 10.1177/002224378201900406
Gaved, M., Kukulska-Hulme, A., Jones, A., Scanlon, E., Dunwell, I., Lameras, P., et al. (2013). Creating coherent incidental learning journeys on mobile devices through feedback and progress indicators. Int. J. Mobile Blend. Learn. 65, 213–236. doi: 10.5339/qproc.2013.mlearn.13
Gupta, P., Prashar, S., Vijay, T. S., and Parsad, C. (2021). Examining the influence of antecedents of continuous intention to use an informational app: the role of perceived usefulness and perceived ease of use. Int. J. Bus. Inform. Syst. 36:270. doi: 10.1504/IJBIS.2021.112829
Hair, J. F., Hult, G. T. M., Ringle, C. M., and Sarstedt, M. (2022). A primer on partial Least Square structural equation modeling (PLS-SEM). Third Edn. California: SAGE Publications Inc.
Hair, J. F., Ringle, C. M., and Sarstedt, M. (2011). PLS-SEM: indeed a silver bullet. J. Mark. Theory Pract. 19, 139–152. doi: 10.2753/MTP1069-6679190202
Hair, J. F., Risher, J. J., Sarstedt, M., and Ringle, C. M. (2019). When to use and how to report the results of PLS-SEM. Eur. Bus. Rev. 31, 2–24. doi: 10.1108/EBR-11-2018-0203
Hair, J. F., Sarstedt, M., Hopkins, L., and Kuppelwieser, V. G. (2014). Partial least squares structural equation modeling (PLS-SEM): an emerging tool in business research. Eur. Bus. Rev. 26, 106–121. doi: 10.1108/EBR-10-2013-0128
Hair, J. F., Sarstedt, M., Ringle, C. M., and Gudergan, S. P. (2017). Advanced issues in partial least squares structural equation modeling. California: SAGE Publications Inc.
Halif, M. M., Hassan, N., Sumardi, N. A., Omar, A. S., Ali, S., Aziz, R. A., et al. (2020). Moderating effects of student motivation on the relationship between learning styles and student engagement. Asian J. Univ. Educ. 16:93. doi: 10.24191/AJUE.V16I2.10301
Henseler, J., Ringle, C. M., and Sarstedt, M. (2015). A new criterion for assessing discriminant validity in variance-based structural equation modeling. J. Acad. Mark. Sci. 43, 115–135. doi: 10.1007/s11747-014-0403-8
Hertzum, M., and Hornbæk, K. (2023). Frustration: still a common user experience. ACM Trans. Comput. Hum. Interact. 30, 1–26. doi: 10.1145/3582432
Huang, B. G., Yang, J. C., and Chen, S. Y. (2021). An investigation of the approaches for integrating learning materials and digital games: a prior ability perspective. Univ. Access Inf. Soc. 20, 57–68. doi: 10.1007/s10209-020-00710-1
Ijaz, M. F., Tao, W., Rhee, J., Kang, Y.-S., and Alfian, G. (2016). Efficient digital signage-based online store layout: an experimental study. Sustainability 8:511. doi: 10.3390/su8060511
Jung, J., Park, E., Moon, J., and Lee, W. S. (2021). Exploration of sharing accommodation platform Airbnb using an extended technology acceptance model. Sustain. For. 13:185. doi: 10.3390/su13031185
Kock, N., and Hadaya, P. (2018). Minimum sample size estimation in PLS-SEM: the inverse square root and gamma-exponential methods. Inf. Syst. J. 28, 227–261. doi: 10.1111/isj.12131
Lee, J. H., and Lee, C. F. (2019). Extension of TAM by perceived interactivity to understand usage behaviors on ACG social media sites. Sustainability 11:723. doi: 10.3390/su11205723
Lee, W. H., Lin, C. W., and Shih, K. H. (2018). A technology acceptance model for the perception of restaurant service robots for trust, interactivity, and output quality. Int. J. Mob. Commun. 16:361. doi: 10.1504/IJMC.2018.092666
Legris, P., Ingham, J., and Collerette, P. (2003). Why do people use information technology?A critical review of the technology acceptance model. Inform. Manag. 40, 191–204. doi: 10.1016/S0378-7206(01)00143-4
Leow, M.-C., Ong, L.-Y., and Ng, J.-W. (2023). Digital signage-augmented roadshow (DiSAR), in 2023 10th International Conference on ICT for Smart Society (ICISS), pp. 1–8.
Mailizar, M., Burg, D., and Maulina, S. (2021). Examining university students’ behavioural intention to use e-learning during the COVID-19 pandemic: an extended TAM model. Educ. Inf. Technol. 26, 7057–7077. doi: 10.1007/s10639-021-10557-5
Merriam-Webster (n.d.). Road show, Merriam-Webster dictionary. Available at: https://www.merriam-webster.com/dictionary/road.show (Accessed January 20, 2022).
Mohamad, A. M., Salleh, A. S., and Abu Hassan, R. (2019). WE HEAR YOU We understand you’ - using VARK survey to understand FIRST year law learners. Int. J. Modern Educ. 1, 75–85. doi: 10.35631/ijmoe.11007
Mojtahed, R., Nunes, M. B., and Peng, G. C. (2011). The role of the technology acceptance model in information systems research: a case study, in Proceedings of the IADIS International Workshop Information Systems Research Trends, Approaches and Methodologies, ISRTAM 2011, Part of the IADIS, MCCSIS.
Multimedia University (2022). Campus reboot plan, multimedia university. Available at: http://e-publication.mmu.edu.my/books/rlvv/ (Accessed May 30, 2023).
Oh, J., and Sundar, S. S. (2015). How does interactivity persuade? An experimental test of interactivity on cognitive absorption, elaboration, and attitudes. J. Commun. 65:147. doi: 10.1111/jcom.12147
Papakostas, C., Troussas, C., Krouska, A., and Sgouropoulou, C. (2021). Measuring user experience, usability and interactivity of a personalized Mobile augmented reality training system. Sensors 21:888. doi: 10.3390/s21113888
Park, E. S., and Park, M. S. (2020). Factors of the technology acceptance model for construction IT. Appl. Sci. 10:299. doi: 10.3390/app10228299
Rasul, A., and Raney, A. A. (2021). Learning politics through entertainment: exploring the effects of biographical films on political learning and attitude toward female politicians. J. Broadcast. Electron. Media 65, 248–269. doi: 10.1080/08838151.2021.1928671
Rasull, A., Jantan, A. H., Ali, M. H., Jaharudin, N. S., and Mansor, Z. D. (2019). Benefit and sacrifice factors determining internet banking adoption in Iraqi Kurdistan region. J. Int. Bus. Manag. 3, 1–20. doi: 10.37227/jibm.2020.65
Rieber, L. P. (1991). Animation, incidental learning, and continuing motivation. J. Educ. Psychol. 83, 318–328. doi: 10.1037/0022-0663.83.3.318
Rigdon, E. E. (2012). Rethinking partial least squares path modeling: In praise of simple methods, long range planning, 45, 341–358.
Roswinanto, W. (2015). “Learning styles and marketing communication media: relationships and the effects on brand responses” in Marketing Dynamism and Sustainability: Things change, things stay the same…. ed. L. Robinson (Cham: Springer International Publishing), 86–89.
Shmueli, G., and Koppius, O. R. (2011). Predictive analytics in information systems research. MIS Q. 35, 553–572. doi: 10.2307/23042796
Shmueli, G., Ray, S., Velasquez Estrada, J. M., and Chatla, S. B. (2016). The elephant in the room: predictive performance of PLS models. J. Bus. Res. 69, 4552–4564. doi: 10.1016/j.jbusres.2016.03.049
Shmueli, G., Sarstedt, M., Hair, J. F., Cheah, J. H., Ting, H., Vaithilingam, S., et al. (2019). Predictive model assessment in PLS-SEM: guidelines for using PLSpredict. Eur. J. Mark. 53, 2322–2347. doi: 10.1108/EJM-02-2019-0189
Song, J. H., and Zinkhan, G. M. (2008). Determinants of perceived web site interactivity. J. Mark. 72, 99–113. doi: 10.1509/jmkg.72.2.99
Streukens, S., and Leroi-Werelds, S. (2016). Bootstrapping and PLS-SEM: a step-by-step guide to get more out of your bootstrap results. Eur. Manag. J. 34, 618–632. doi: 10.1016/j.emj.2016.06.003
Sun, J., and Hsu, Y. (2013). Effect of interactivity on learner perceptions in web-based instruction. Comput. Hum. Behav. 29, 171–184. doi: 10.1016/j.chb.2012.08.002
Tan, Y.-F., Leow, M.-C., and Ong, L.-Y. (2023). Validity and reliability of extended technology acceptance model for digital signage augmented roadshow (DiSAR), in 2023 IEEE 13th symposium on computer applications & industrial electronics (ISCAIE), pp. 1–6.
Technavio (2023). Digital signage market by application, component, and geography - forecast and analysis 2023-2027, Technavio. Available at: https://www.technavio.com/report/digital-signage-market-industry-analysis (Accessed April 14, 2023).
Teo, T., and Noyes, J. (2011). An assessment of the influence of perceived enjoyment and attitude on the intention to use technology among pre-service teachers: a structural equation modeling approach. Comput. Educ. 57, 1645–1653. doi: 10.1016/j.compedu.2011.03.002
Urbach, N., and Ahlemann, F. (2010). Structural equation modeling in information systems research using partial least squares. J. Inform. Technol. Theory Appl. 11, 6–40.
Vashisht, D. (2021). The effect of novelty in in-game advertising: examining the moderating role of interactivity and congruency. J. Res. Interact. Mark. 15, 769–786. doi: 10.1108/JRIM-07-2019-0101
Venkatesh, V., and Bala, H. (2008). Technology acceptance model 3 and a research agenda on interventions. Decis. Sci. 39, 273–315. doi: 10.1111/j.1540-5915.2008.00192.x
Venkatesh, V., Brown, S. A., and Bala, H. (2013). Bridging the qualitative-quantitative divide: guidelines for conducting mixed methods research in information systems. MIS Q. 37, 21–54. doi: 10.25300/MISQ/2013/37.1.02
Venkatesh, V., and Davis, F. D. (1996). A model of the antecedents of perceived ease of use: development and test. Decis. Sci. 27, 451–481. doi: 10.1111/j.1540-5915.1996.tb01822.x
Venkatesh, V., and Davis, F. (2000). A theoretical extension of the technology acceptance model: four longitudinal field studies. Manag. Sci. 46, 186–204. doi: 10.1287/mnsc.46.2.186.11926
Venkatesh, V., Morris, M. G., Davis, G. B., and Davis, F. D. (2003). User acceptance of information technology: toward a unified view. MIS Q. 27, 425–478. doi: 10.2307/30036540
Warshaw, P. R., and Davis, F. D. (1985). Disentangling behavioral intention and behavioral expectation. J. Exp. Soc. Psychol. 21, 213–228. doi: 10.1016/0022-1031(85)90017-4
Won, D., Chiu, W., and Byun, H. (2023). Factors influencing consumer use of a sport-branded app: the technology acceptance model integrating app quality and perceived enjoyment. Asia Pac. J. Mark. Logist. 35, 1112–1133. doi: 10.1108/APJML-09-2021-0709
Wong, K. K.-K. (2013). Partial least squares structural equation modeling (PLS-SEM) techniques using SmartPLS. Mark. Bull. 24, 1–32.
Xie, H., Zou, D., Lau, R. Y. K., Wang, F. L., and Wong, T. L. (2016). Generating incidental word-learning tasks via topic-based and load-based profiles. IEEE Multimedia 23, 60–70. doi: 10.1109/MMUL.2015.91
Yang, M., Shao, Z., Liu, Q., and Liu, C. (2017). Understanding the quality factors that influence the continuance intention of students toward participation in MOOCs. Educ. Technol. Res. Dev. 65, 1195–1214. doi: 10.1007/s11423-017-9513-6
Yi, M., and Hwang, Y. (2003). Predicting the use of web-based information systems: self-efficacy, enjoyment, learning goal orientation, and the technology acceptance model. Int. J. Hum. Comput. Stud. 59, 431–449. doi: 10.1016/S0171-5819(03)00114-9
Yoo, W.-S., Lee, Y., and Park, J. (2010). The role of interactivity in e-tailing: creating value and increasing satisfaction. J. Retail. Consum. Serv. 17, 89–96. doi: 10.1016/j.jretconser.2009.10.003
Zhao, L., and Lu, Y. (2012). Enhancing perceived interactivity through network externalities: an empirical study on micro-blogging service satisfaction and continuance intention. Decis. Support. Syst. 53, 825–834. doi: 10.1016/j.dss.2012.05.019
Zhong, Y., Oh, S., and Moon, H. C. (2021). Service transformation under industry 4.0: investigating acceptance of facial recognition payment through an extended technology acceptance model. Technol. Soc. 64:101515. doi: 10.1016/j.techsoc.2020.101515
Zhou, L., Xue, S., and Li, R. (2022). Extending the technology acceptance model to explore students’ intention to use an online education platform at a University in China. SAGE Open 12:259. doi: 10.1177/21582440221085259
Zhu, Y. (2022). Tactile communication: making communication technology warmer and more emotional, in Proceedings of the 5th International Conference on Information Science and Systems. New York, NY, USA: Association for Computing Machinery (ICISS ‘22), pp. 43–48.
Keywords: digital signage augmented roadshow (DiSAR), digital signage, PLS-SEM, technology acceptance model (TAM), extended TAM
Citation: Tan Y-F, Leow M-C and Ong L-Y (2024) Evaluation of the extended TAM for digital signage augmented roadshow (DiSAR) using PLS-SEM. Front. Comput. Sci. 6:1449908. doi: 10.3389/fcomp.2024.1449908
Edited by:
Michael J. Proulx, University of Bath, United KingdomReviewed by:
Xun Zhang, Beijing Technology and Business University, ChinaDeny Willy Junaidy, Bandung Institute of Technology, Indonesia
Copyright © 2024 Tan, Leow and Ong. This is an open-access article distributed under the terms of the Creative Commons Attribution License (CC BY). The use, distribution or reproduction in other forums is permitted, provided the original author(s) and the copyright owner(s) are credited and that the original publication in this journal is cited, in accordance with accepted academic practice. No use, distribution or reproduction is permitted which does not comply with these terms.
*Correspondence: Meng-Chew Leow, bWNsZW93QG1tdS5lZHUubXk=
 Yi-Fan Tan
 Meng-Chew Leow
 Lee-Yeng Ong