- 1Department of Computer Science, BITs Pilani Hyderabad Campus, Hyderabad, India
- 2Msrit (MS Ramaiah Institute of Technology), Bangalore, India
- 3Department of Computer Science and Engineering, IIT (ISM) Dhanbad, Dhanbad, India
Introduction: Hard disk drive (HDD) failure is a significant cause of downtime in enterprise storage systems. Research suggests that data access rates strongly influence the survival probability of HDDs.
Methods: This paper proposes a model to estimate the probability of HDD failure, using factors such as the total data (TD) read or written and the average access rate (AAR) for a specific drive model. The study utilizes a dataset of HDD failures to analyze the effects of these variables.
Results: The model was validated using case studies, demonstrating a strong correlation between access rate management and reduced HDD failure risk. The results indicate that managing data access rates through improved throttle commands can significantly enhance drive reliability.
Discussion: Our approach suggests that optimizing throttle commands at the storage controller level can help mitigate the risk of HDD failure by controlling data access rates, thereby improving system longevity and reducing downtime in enterprise storage systems.
1 Introduction
The fundamental role of any storage system is to efficiently cater to the diverse needs of various applications while accommodating their specific workloads. In modern storage systems, data reading and writing operations are primarily handled by hard disk drives (HDDs). Any interruption of these basic tasks can have significant repercussions, affecting all facets of storage management. Such disruptions can lead to performance degradation, an increased need for human intervention, a higher risk of service outages, and ultimately, potential data unavailability or loss.
Despite the critical importance of seamless data operations, many storage systems face challenges in maintaining uninterrupted performance. Existing solutions often fall short in addressing the complexity and variability of workloads, reducing the efficiency of data management. Existing research has focused on optimizing the individual components of storage systems, but comprehensive strategies that encompass the entire storage infrastructure are still lacking.
This research aims to bridge these gaps by exploring innovative approaches to enhancing the reliability and efficiency of storage systems. By investigating the underlying causes of data operation interruptions and their impact on overall system performance, this study seeks to develop robust solutions that minimize disruptions, reduce human intervention, and ensure continuous data availability. Through this work, we aim to contribute to the advancement of storage technologies, paving the way for more resilient and efficient data management systems.
1.1 Motivation
The motivation for this paper stems from the critical issue of HDD failure causing significant downtime in enterprise storage systems. Despite advancements in storage technology, HDD failures remain a persistent challenge, leading to substantial disruptions and operational inefficiencies. The existing literature provides valuable insights into individual factors that contribute to HDD failures, but there is a lack of comprehensive models that combine these factors to predict and mitigate such failures effectively.
In this work, empirical analyses are conducted to explore the relationship between data access rates and HDD survivability. By proposing a predictive model based on the total data (TD) read or written and the average access rate (AAR), this work aims to preemptively address HDD failures. The predictive model leverages real-world data from storage controllers to identify HDDs with high failure probabilities.
To validate the findings, the proposed model is tested using data from actual storage systems. A novel strategy is introduced: reallocating HDDs with high failure probabilities to different redundancy groups. This approach aims to optimize resource allocation, enhance system resilience, and mitigate the risks associated with HDD failures.
By addressing these challenges, this research provides a practical solution for storage system administrators and engineers and a proactive method to improve the reliability and efficiency of enterprise storage systems.
1.2 Previous research
HDDs consist of many complex subcomponents that must work in coordination with each other. Depending on the characteristics of the subcomponents, failures can occur at different stages in the lifetime of a product. The mean time to failure (MTTF) and annualized failure rate (AFR) are two of the current metrics of choice for quantifying the survivability of HDDs (George, 2013).
Prior research has shown that HDD failure prediction modeling can provide reasonable failure predictions for different kinds of hard disks with various interfaces, including integrated drive electronics (IDE), fiber channels (FC), small computer system interfaces (SCSI), and serial advanced technology attachments (SATA). Statistical modeling techniques such as logistic regression have been applied using the most relevant self-monitoring, analysis, and reporting technology (SMART) parameters to predict HDD failures with reasonable false alarm rates and accuracy (Shen et al., 2018; Zhang et al., 2023; Rincón et al., 2017; Liu and Xing, 2020; Smith and Smith, 2004; Smith and Smith, 2001; Smith and Smith, 2005; Mohanta and Ananthamurthy, 2006).
There have been attempts to increase the survival probability of solid-state driFDriveves (SSDs) in storage systems by controlling the write amplification factor (WAF) depending on the workload (Mohanta et al., 2015). Different machine-learning solutions have also been proposed as alternatives, including support vector machines, nonparametric rank-sum tests, and unsupervised clustering algorithms. These solutions provide improvements over existing threshold-based algorithms for predicting HDD failures (Murray et al., 2003; Hamerly and Elkan, 2001; Royston and Sauerbrei, 2008).
Improvements and new trends in HDD packaging methods have led to the high-density packing of physical materials in the drive cage. This has led to less spacing between the head and the media during read and write operations, which is one of the probable causes of HDD failure with media errors. The MTTF parameter alone is inadequate to describe HDD survivability, and according to one study (George, 2013), the total amount of data transferred is a more appropriate parameter of choice.
Many large enterprise storage companies require that drive manufacturers to provide detailed information to be queried from HDDs for further failure analysis. Along with the standard parameters, such as SMART attributes, recoverable errors, and unrecoverable errors parameter values are also made available to query from HDDs. This research employs these data for predictive modelling and analyses.
1.3 Unique contributions
Different kinds of hard disks form components of the storage systems deployed in data centers and cloud environments, including private, public, and hybrid clouds, to provide platform-as-a-service (PaaS) technology. In storage systems, these hard disks are building blocks for offering proper performance and survivability to the hosted application. Disk failure is inevitable, and catastrophic errors threaten both mission-critical data and the performance and survivability of applications.
The novel application of the model proposed in this work is that multiple HDDs in the same storage pool with a high failure probability threshold are reallocated to different storage pools after ensuring proper migration of their data to enhance overall system survivability.
The following are unique contributions of this work that advance the understanding of hard drive failures and their prediction:
• Predictive Modeling: By leveraging the statistical programming language R, the proposed predictive model has the capability to analyze workload patterns and their correlation with hard drive failures. By training models on extensive datasets that incorporate workload parameters, these algorithms can forecast potential failures more accurately.
• Dynamic Adjustments: The same model can be pragmatically implemented for developing real-time monitoring tools that continuously assess workload parameters and dynamically adjust hard drive operations. This proactive approach allows systems to mitigate potential stressors or redistribute the workload to ensure optimal drive health.
• End-to-End Assessment: This model has the potential to perform a comprehensive lifecycle analysis that considers the cumulative impact of workload variations over the entire lifespan of a hard drive. The appropriately chosen statistical model, namely, the Cox Proportional Hazards Model (CPHM) utilizes censored data to provide with valid estimates of the survival probabilities for potential HHD failures throughout the entire life cycle. This holistic approach helps in identifying critical periods or thresholds beyond which workload intensities significantly affect survivability.
• Smart Resource Allocation: This model unveils avenues for ushering in adaptive throttling mechanisms that optimize resource allocation based on workload analysis. By dynamically adjusting read/write operations, applying caching strategies, and making use of data placement, systems can reduce wear and tear, thereby enhancing hard drive longevity.
• Unified Metrics: This model facilitates the use of proposing standardized metrics that incorporate workload considerations based on the AAR and TD. By establishing a common framework for evaluating hard drive survivability across diverse workloads, researchers and industry practitioners can compare results more effectively and drive advancements collaboratively.
1.4 Mathematical formulations and equations
Storage Array Downtime (SD) is defined as the percentage of time that the storage arrays in the installed base are down and not available to service requests. Measuring the storage array downtime is useful for clearly visualizing different contributions to the total array downtime (such as firmware-related downtime and downtime with other causes). However, the proposed research has adopted another approach is adopted in this work to investigate the impact of workload on HDD failures. As part of this analysis, primary data was collected from real production systems. The total amount of data read from or written to HDDs is a major parameter of this analysis. It is called the total data (TD) and is defined as follows:
where TDR is the total data read and TDW is the total data written in bytes.
Attempts have been made to determine how different kinds of workloads affect the survivability of HDDs. However, information pertaining to the amount of random data or sequential data transferred to the disks is not available in this dataset.
Therefore, another parameter, the AAR, is exploited in this investigation. The values of this parameter May vary over time. There could be significant activity at certain times and a lack of activity at other times, depending on application requirements. Keeping in mind the lack of information on the timelines of these cycles in view, a parameter called the average access rate (AAR) is introduced, which is defined as follows:
where, PT is the power-on time in minutes. This parameter intuitively gives a sense of the data transfer rate of a customer application to the HDD. In this analysis, the TD in bytes and the AAR in bytes per minute are used as parameters to measure the survivability of the HDDs.
2 Brief overview of survival analysis
Survival analytic models, which form a branch of statistics, share certain similarities with logistic and linear models. In this analysis, survival analytic models are chosen over logistic or linear models because they consider parameters such as the event time and event probability that are not considered by the alternatives (Kalbfleisch and Prentice, 2011; Lambert and Royston, 2009). The key parameters and associated functions are outlined in this section.
Usually, failed HDDs are returned by different customers at different times. This research takes into account HDDs received over the past 5 years. A detailed analysis was carried out based on the power-on time of the HDDs as well as their workloads. The power-on time is the amount of time for which the HDDs are used in any system. The start time for the analysis on all HDDs is the same, i.e., 0. The end time is the highest value of the power-on time available in the data set. A test suite determines whether one or more events have occurred on an HDD that belongs to a set of failure events. If such an event occurs, the amount of power-on time on that HDD is considered its failure event time.
In survival analysis, the event time distribution is quantified using the following four functions.
2.1 The cumulative distribution function (CDF)
The CDF of hard disk random failure is expressed using a random variable 𝑋 as
where, is the CDF and the right-hand side represents the probability that 𝑋 has a value less than or equal to 𝑥.
2.2 The probability density function (PDF)
The PDF of a random variable 𝑋, denoted 𝑓 (𝑥), is defined by:
The PDF is the derivative or slope of the cumulative distribution function (Zhang et al., 2023).
2.3 The survival function
The survival function captures the probability that a component or system is alive and functional beyond a defined point on the time axis (Rincón et al., 2017). Let 𝑋 be a continuous random variable with cumulative distribution function 𝐹(𝑥) in the interval [0, ∞]. Its survival function is defined as follows:
The above function helps to define the probability of 𝑋 being alive just before exceeding duration 𝑥, or the probability that the failure event has not occurred at all in the considered 𝑥 interval. The survival curve describes the relationship between the probability of survival and time.
2.4 Hazard function
The hazard function ℎ(𝑥) is given by the following equation:
The hazard function is more intuitive in survival analysis than the probability distribution function because it quantifies the instantaneous risk that an event will take place at time 𝑥 given that the subject survived to time 𝑥 [6].
In survival or failure test cases, it is essential to determine whether variables are correlated with survival or failure times. However, this correlation analysis is not simple (Royston and Sauerbrei, 2008; Kalbfleisch and Prentice, 2011; Lambert and Royston, 2009). This is because, most likely, the dependent variable of interest does not follow an exponential distribution but instead a normal distribution. Another contributing factor is incomplete datasets generated from research or analytical studies, where the complete output is not as expected or the dataset is censored.
2.5 The cox proportional hazards model (CPHM)
The CPHM relies on variables that are correlated to survival and does not make presumptions about base line hazard rate of each variable. Therefore, the Cox regression method is much more useful than the Kaplan–Meier estimator (KME) approach, which involves a lot of explanatory variables (Kleinbaum and Klein, 1996; Hosmer et al., 2008; David, 1972). A brief exposition on KME is given below to validate the choice of the CPHM for the proposed research.
In its generic form, the KME can be expressed as below using an example.
Consider a sample size of population 𝑁, with 𝑡 being the time axis. Assume 𝑡1, 𝑡2, … 𝑡i, … 𝑡𝑁 are the observed lifetimes of the sample size 𝑁, such that 𝑡1 ≤ 𝑡2 ≤ 𝑡3 ≤ … ≤ 𝑡𝑁, with Ŝ(𝑡) the probability that a member has a lifetime exceeding 𝑡. In this scenario, the Kaplan–Meier estimator tries to establish a survival function at 𝑡i between members who have experienced the event versus members who have not. Let 𝑑𝑖 be the set of members who have experienced the event and 𝑛𝑖 be the members who are yet to experience the event. Then, the KME can be expressed as:
Assuming, Ŝ(𝑡) is the probability that a given member from the sample size has a lifetime exceeding time 𝑡.
As no assumptions are made about the nature of the survival distribution, the CPHM model is considered the most generic regression model. Hence, Cox’s regression model May be considered to be a “semi-parametric” model (Kalbfleisch and Prentice, 2011). The CPHM is represented as follows:
where, 𝑋 = (𝑋1, 𝑋2, …, 𝑋𝑝) are the explanatory/predictor variables, ℎ0(𝑡) is the baseline hazard function, and 𝛽i are the regression coefficients.
To linearize this model, both sides of the equation are divided by ℎ0(𝑡) and then the natural logarithm is then taken on both sides. As a result, a fairly “simple” linear model can be readily estimated. The final result is:
The CPHM has been endorsed by many researchers as it is quite robust for computing the associated survival probabilities through balancing potential predominant variables (Royston and Sauerbrei, 2008; Kalbfleisch and Prentice, 2011; Lambert and Royston, 2009; Kleinbaum and Klein, 1996; Hosmer et al., 2008). In essence, the CPHM is most suitable for representing and interpreting impact of AAR and TD groups on survival probability of HDD. Also statistically R programming language R is also commensurate tool implementing CPHM for the proposed research (Kleinbaum and Klein, 1996; Hosmer et al., 2008; David, 1972; Kaplan and Meier, 1958; Lane et al., 1986).
3 Modeling and discussions
As the HDDs considered here form part of a storage system, software drives the operation of these hard disks from insertion into the storage system until the drives declare themselves to have failed or software identifies them as faulty (Equations 1–9).
3.1 HDD failure
HDD failure occurs when an HDD is no longer capable of performing IO operations. However, the word HDD failure is somewhat vague, and the threshold for failure is different for each subsystem.
SMART data in its intrinsic form seems to be insufficient because many HDDs undergo unexpected hardware failures, such as head crashes or excessive media errors, without any warning from SMART subsystems. Storage controllers May have different thresholds for declaring an HDD as having failed, such as if a drive gives a certain number of unrecovered errors within a certain period, shows too many timeouts during data access, or cannot reassign a logical block address (LBA).
Therefore, the basis of the present analysis is the event of HDD failure in a storage system. Whenever there is an HDD failure event in a customer data center, the failed HDD is sent to a lab for investigation. The test suites used by storage system vendors mostly rely on the log data available on the HDD, which can be queried through Small Computer System Interface (SCSI) commands. These test suites have defined thresholds, and if a drive exceeds the thresholds in any certain area, it is declared a failure. There is a never-ending battle between storage controller providers and HDD manufacturers concerning the definition of failure because the manufacturer has to bear the cost if the HDD is still within a warranty period.
Typically, storage systems support multiple HDD models from different manufacturers. Therefore, the gross or initial drive sample considered for this analysis includes different drive models. Out of the various HDD models present in the gross sample, twenty drive models are chosen for this investigation. Historical data collected for these twenty drive models is analyzed and plotted to determine the failure pattern and its dependence on certain parameters. In-depth results are provided for only two drive models, as the other drive models are similar.
3.2 Data description
Data from two hard disk drive models (the M1-A1 model and the M2-A1 model) were analyzed using R. Table 1 represents a sample raw data for model M1-A1(HDD Manufacture’s Model Name - NB1000D4450), as given below.
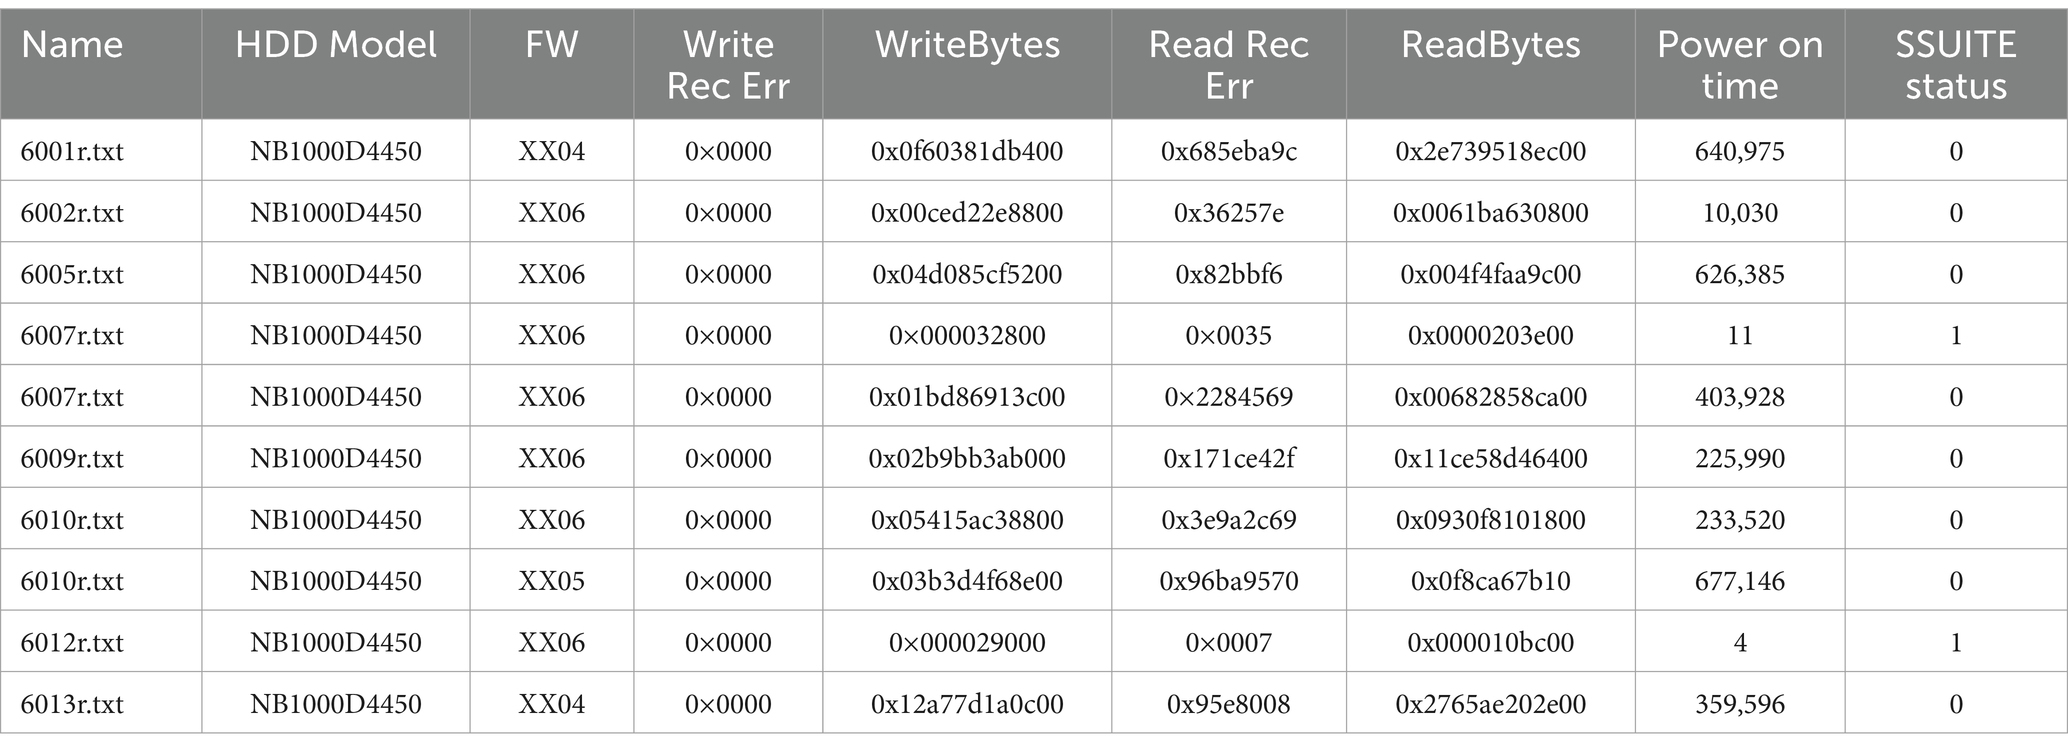
Table 1. Sample raw data (The highlighted yellow columns represent the data used in the current analysis) of HDD model.
The graphical representation of the output using the power-on time (in minutes) on the x-axis and the failure count on the y-axis were useful for assessing efficacy of the proposed prediction model. To analyze how the workload affects the survivability of an HDD, two attributes are considered: the TD and the AAR. HDDs of the same model were grouped by both TD as well as AAR.
These g number of groups were labeled as TDi where i = 1, 2, …,g. The HDDs were also grouped by their average access rates (AAR) into m number of groups called AARj where j = 1, 2,….,m.
The ranges for these groups were determined automatically in R such that each group had an approximately equal number of drives. A particular drive could belong to any one of the TD groups and any one of the AAR groups, so a drive with low total data could have a high access rate and a drive with high total data could have a low access rate.
To create the total data (TD) accessed till the drive was in operational state and average access rate (AAR) groups for the same period is as in Figure 1.
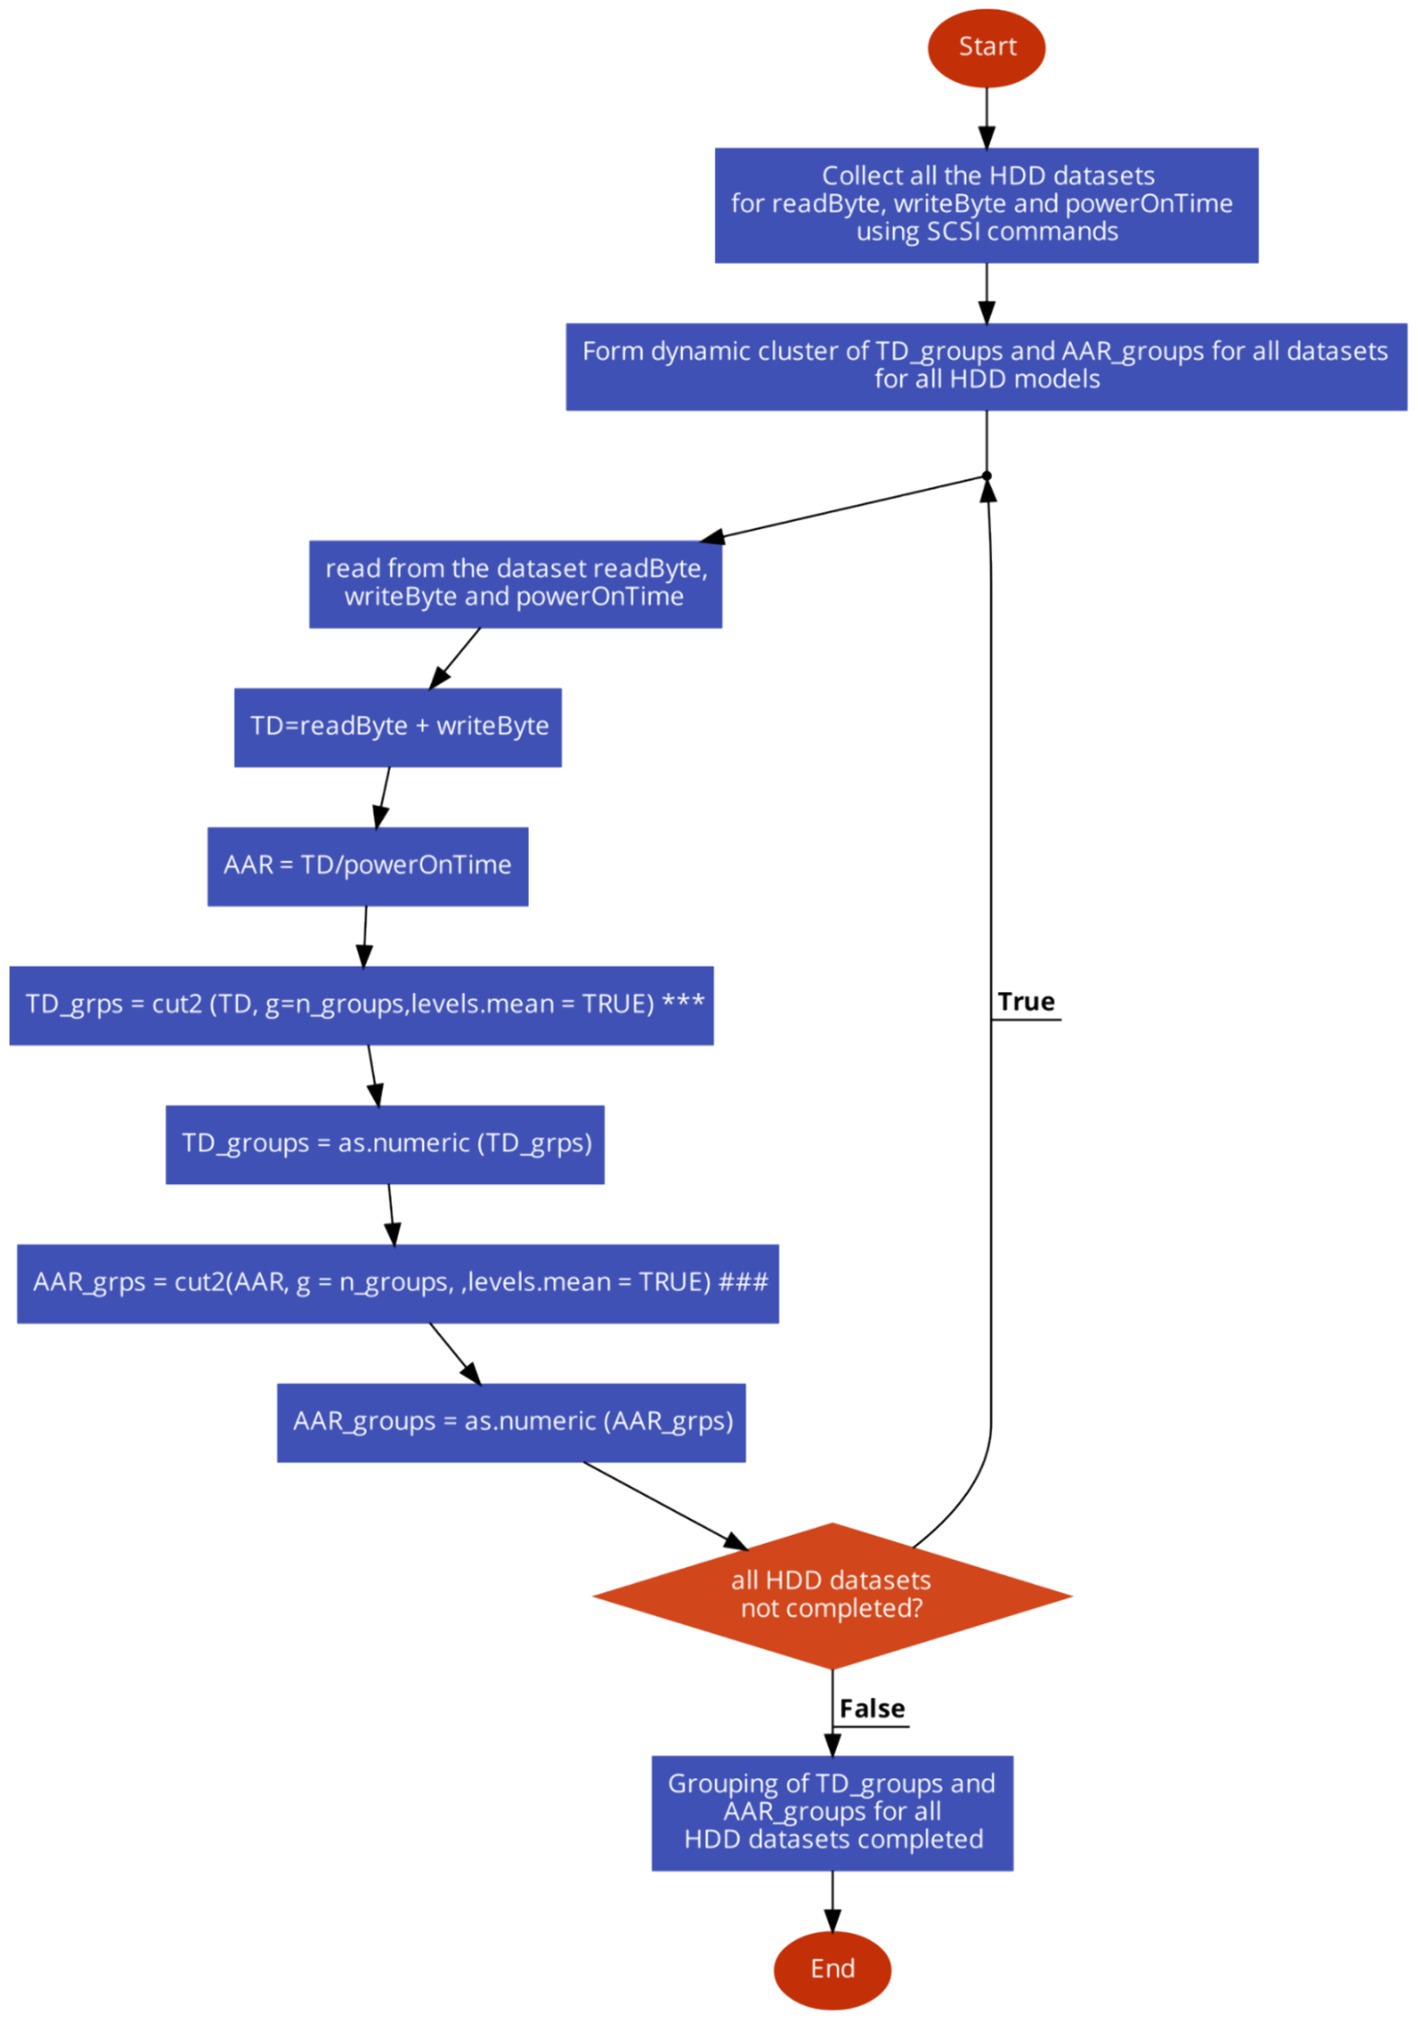
Figure 1. The flowchart to form the dynamic cluster of TD groups and ARR groups from the HDD datasets.
The flowchart shown above for formation of TD_groups (denoted as *** inside Figure 1) utilizes the cut2 function in R to divide the variable AAR into groups or intervals. The components of the algorithm are as follows:
• AAR: This is the variable contains the AAR data. It represents the ratio of the total data accessed to the power-on time of the hard disk drive.
• cut2(): This is a function in R, contained in Hmisc package, is used to divide a continuous variable into intervals or groups. Unlike the base R cut() function, cut2() ensures that each group has approximately the same number of observations.
• g = n_groups: This argument specifies the desired number of groups into which the variable AAR is to be divided and n_groups represent the value assigned to the variable indicating the number of groups to be created.
• levels.mean = TRUE: This argument indicates that the labels for the intervals or groups should represent the mean value of the observations within each group. This helps with interpreting the intervals more intuitively.
• Overall, the cut2() function(denoted as ### inside Figure 1) with the provided arguments divides the AAR variable into n_groups intervals, ensuring that each interval contains approximately the same number of observations, and assigns labels representing the mean value of the observations within each interval.
From the data and plotted graphs (Figures 2A,B), it is observed that there are initially a large number of failures, but later, the rate of failures is constant for some time and then increases again. This behavior seems to correspond to a “bathtub” -type curve.
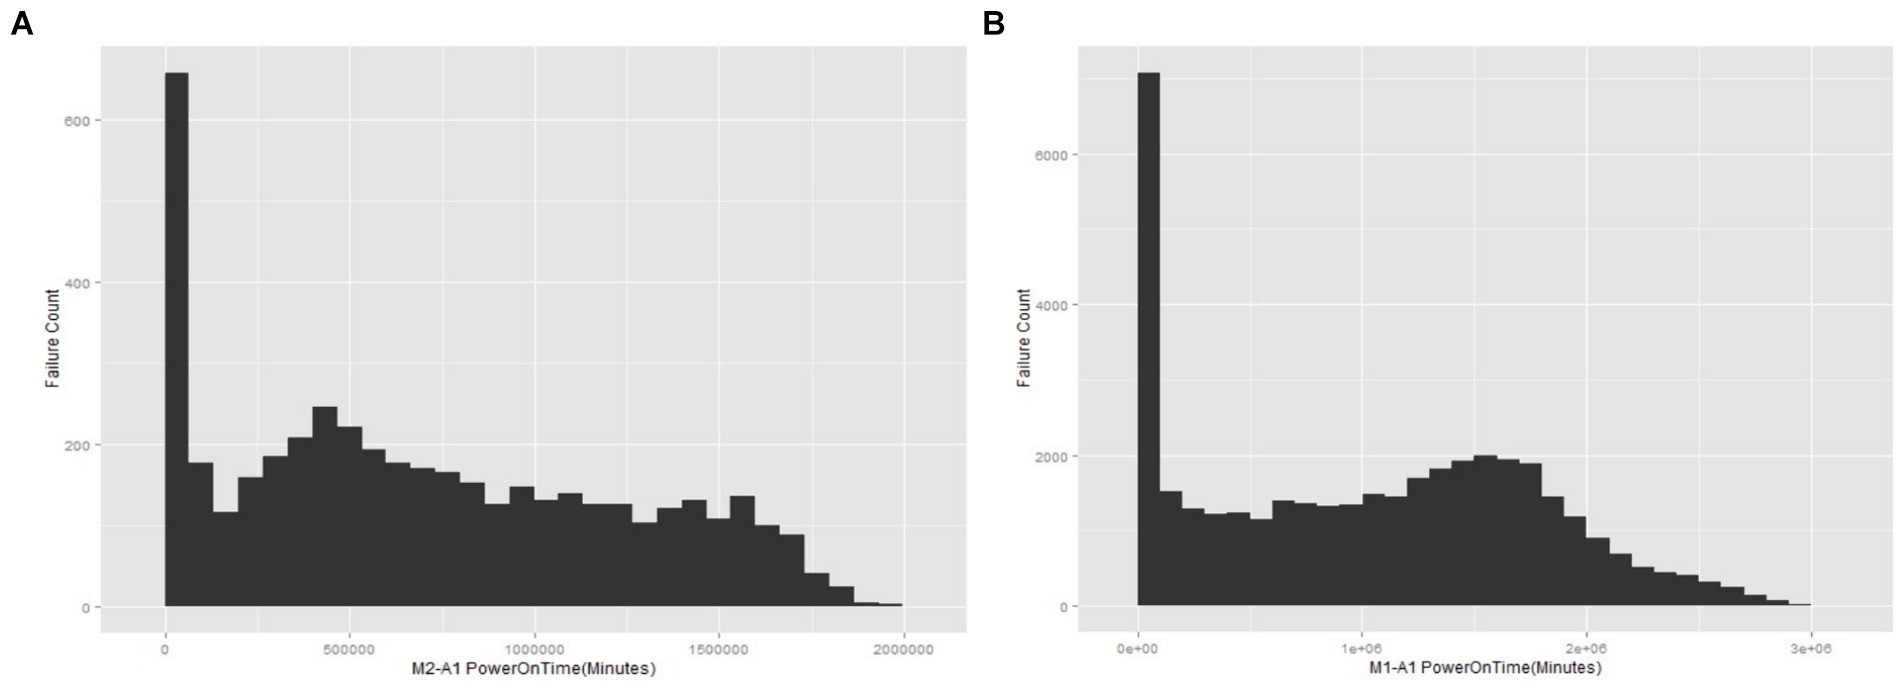
Figure 2. (A) The failure counts vs. power-on time for the M1-A1 hard drive model. (B) The failure counts vs. power-on time for the M2-A1 hard drive model.
3.3 Procedure for replicating the model analysis
i. Setting Up the Environment.
R is installed on the system along with necessary libraries.
ii. Reading and Formatting Raw Data.
The CSV file containing the dataset is read ensuring appropriate file path.
The SSUITEstatus column is formatted in order to convert it to numeric.
iii. Grouping Data Based on Total Data and Data Rate.
Total Data (TD) and Average Access Rate (AAR) are calculated. TD and AAR are grouped into specified number of groups.
iv. Converting Data frame to Data Table.
The dataframe is converted to a data.table for efficient data manipulation:
v. Calculating Cumulative Sum and Percentage Failures.
Cumulative sums and percentage failures by AAR_groups are calculated.
vi. Splitting Data into Passed and Failed Subsets.
Subsets of the data for passed and failed tests are created. Cumulative sums and percentages for both subsets are calculated.
vii. Creation of a Survival Object.
A survival object using PowerOnTime and SSUITEstatus is created.
viii. Creation of Cox Proportional Hazards Model.
The Cox model is created using AAR_groups and TD_groups.
ix. Checking of Proportional Hazards Assumption.
cox.zph is used to check the proportional hazards assumption.
x. Predictions Based on the created Cox Model.
The output is predicted based given inputs using Cox model.
xi. Display of the Output.
The predicted pass or fail value is printed.
4 Case studies and comparison of results
Previous research examined the susceptibility to failure of the new generation of hard disks because of a reduction in the spacing between the heads and media. The research also examined the effect of the amount of data written to or read from the drive. The current research attempts to evaluate the effect of the data access rate on the survivability of the HDDs using the Cox model.
4.1 SMART data based model for internal test suit
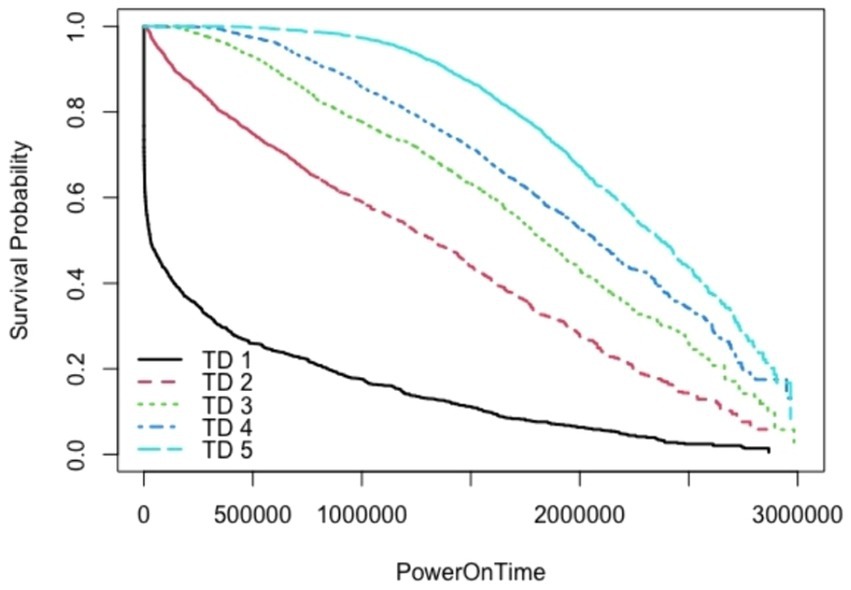
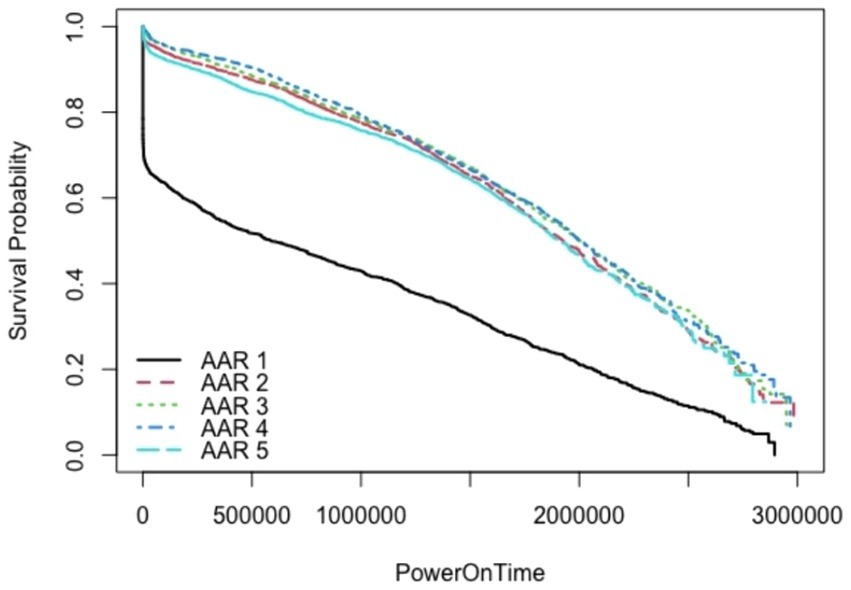
SMART is a standard technology embedded in most modern hard disk drives (HDDs) to monitor various indicators of drive health. These indicators include attributes, like read error rates, spin-up time, temperature, and reallocated sectors, count. The primary goal of SMART is to predict drive failures before they occur, allowing for preventive measures such as data backup or drive replacement. The SMART system has been reported in literature (Villalobos, 2020; Rajashekarappa and Sunjiv Soyjaudah, 2011) for HDD failure prediction. The internal analysis for the SMART based data has employed Kaplan-Meir approach. The impact of TD and AAR are exhibited in the following Figures 3, 4.
SMART is widely used and supported across the industry, making it a reliable standard for monitoring HDD health (Villalobos, 2020; Rajashekarappa and Sunjiv Soyjaudah, 2011). It provides early warnings based on predefined thresholds for various health indicators, enabling proactive maintenance. However, it is limited by the predefined thresholds and May not account for all failure modes; sometimes produces false positives or misses failures. It is evident from the above figures that KME is well suited for incorporating one impact of TD on survival probability. The impact of AAR is also reflected in survivability in Figure 4. However, the simultaneous two impact of both TD and ARR is not possible to capture using KME approach.
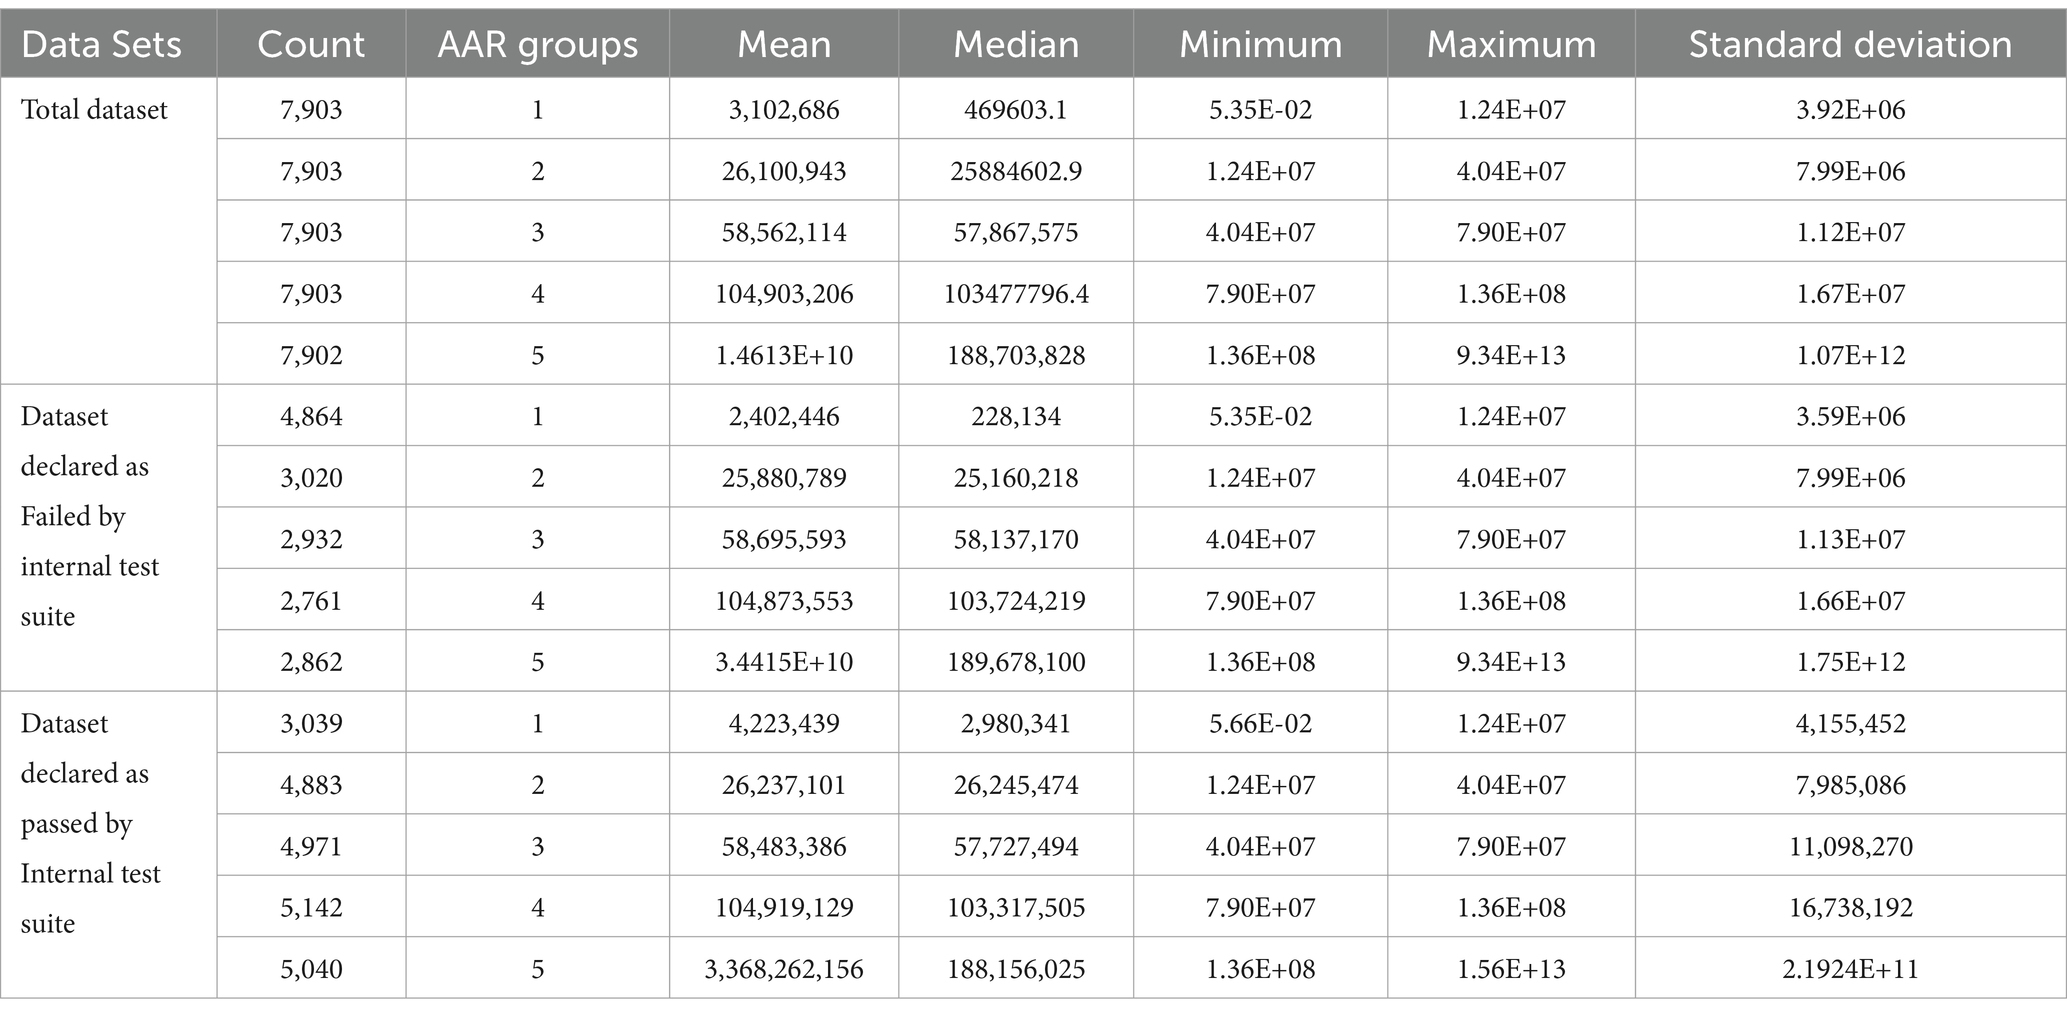
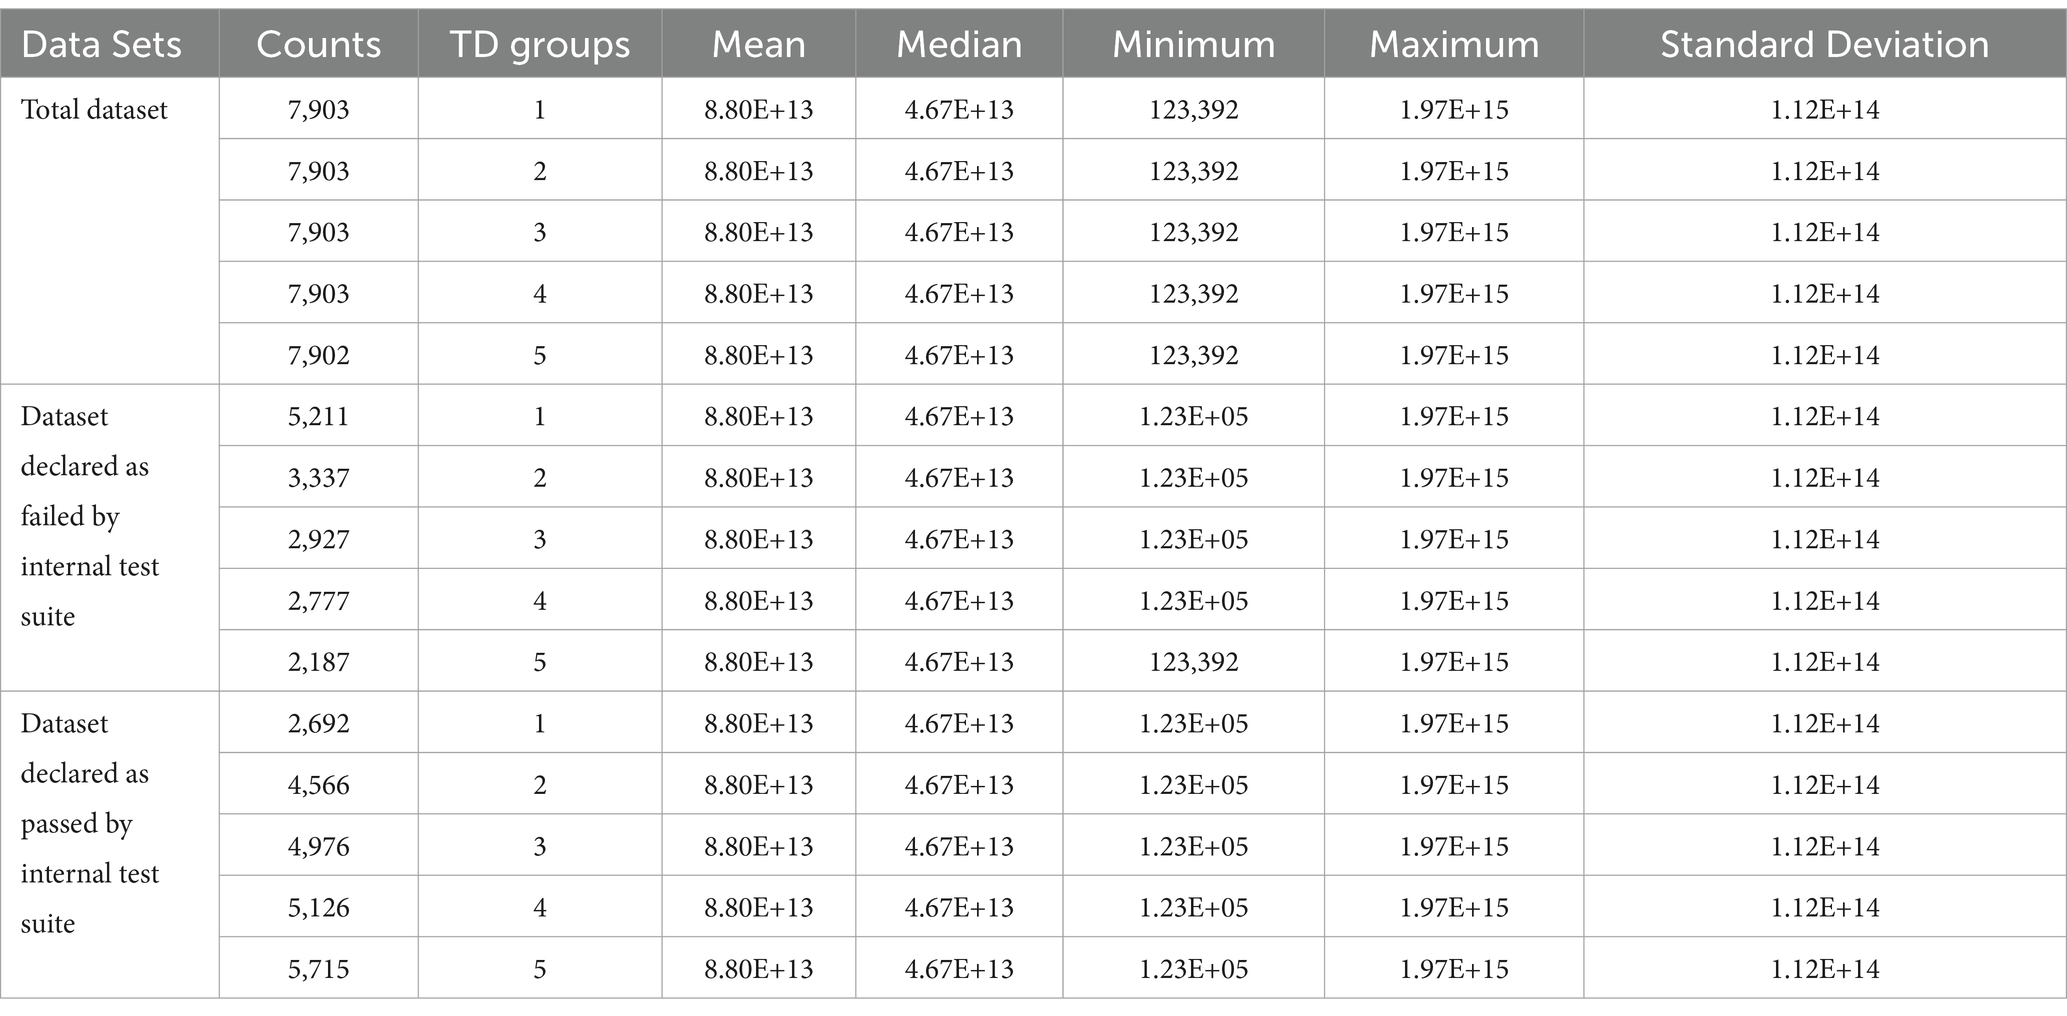
Figures 5A,B, 6A,B present the data for HDDs with model parameters of interest in this analysis, namely, TD and AAR. The color code indicates which groups the hard drives belong to and the total amount of data read by or written to them. Figures 5, 6 show AAR and TD distributions of the drive population. The dispersion of the data used for the M1-A1 model is given below in Table 2 (for AAR_groups) and Table 3 (for TD_groups).
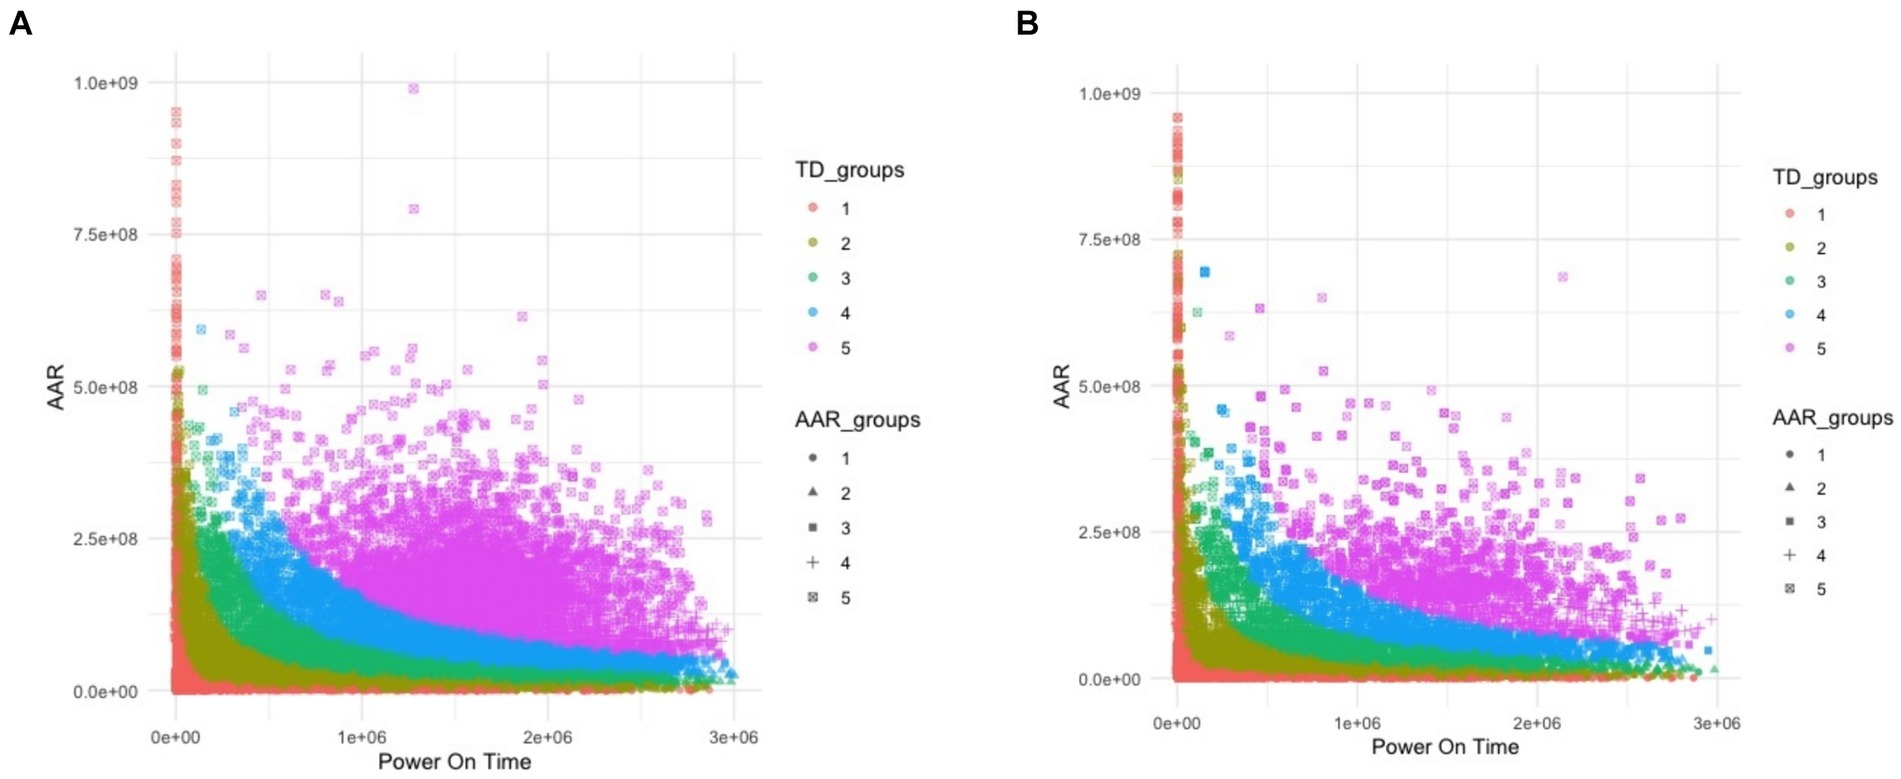
Figure 5. (A) The M1-A1 model HDDs declared “passed” by internal test suite. (B) The M1-A1 model HDDs declared “failed” by internal test suite.

Figure 6. (A) The M2-A1 model HDDs declared “passed” by internal test suite. (B) The M2-A1 model HDDs declared “failed” by internal test suite.
Some interesting inferences can be made from the plots shown in Figures 5, 6. Figure 5A shows the data for M1-A1 HDDs that failed in the customer environment as soon as a certain rate of access was reached but passed the internal test suite run in the lab. The drives were declared failed either by the storage controllers that were using them or by the test suites run on them later. This shows that each drive has an access rate threshold point, after which the probability of failure increases drastically.
Figure 5B presents the data for M1-A1 HDDs that failed in the customer environment and failed in the internal suite. Figure 6A shows the data for M2-A1 HDDs that failed in the customer environment as soon as a certain rate of access was reached but passed the internal test suite run in the lab. Figure 6B shows the data for the M2-A1 HDDs that failed in the customer environment and failed in the internal suite. These figures show that the failures are similar between groups with different amounts of data. After a certain rate of access, the majority of the drives failed regardless of the amount of data accessed.
4.2 Survivability analysis using cox proportionality model
The proposed model is a predictive model based on Total Data (TD) read/written and Average Access Rate (AAR). It introduces a novel strategy of reallocating HDDs with high failure probabilities to different redundancy groups.
It provides with a proactive approach to HDD management by predicting failures based on data access patterns. It enhances system resilience by dynamically reallocating resources based on failure probabilities. Also, it utilizes real-world data from storage controllers for validation, ensuring practical applicability. However, it May need customization for different storage environments and workloads.
The Cox Model uses the parameters of the AAR groups and TD groups to generate the survival model. The equation for the Cox model using R is (Equation 10):
The Cox model equation fits a Cox proportional hazards regression model (coxph()) to the survival data (M1A1_surv). It includes the average access rate (AAR_groups) and the total data groups (TD_groups) as covariates. The model aims to understand how these factors influence the hazard rate or survival probability over time. The output, M1A1_cox, is a Cox model object containing the results of the regression analysis.
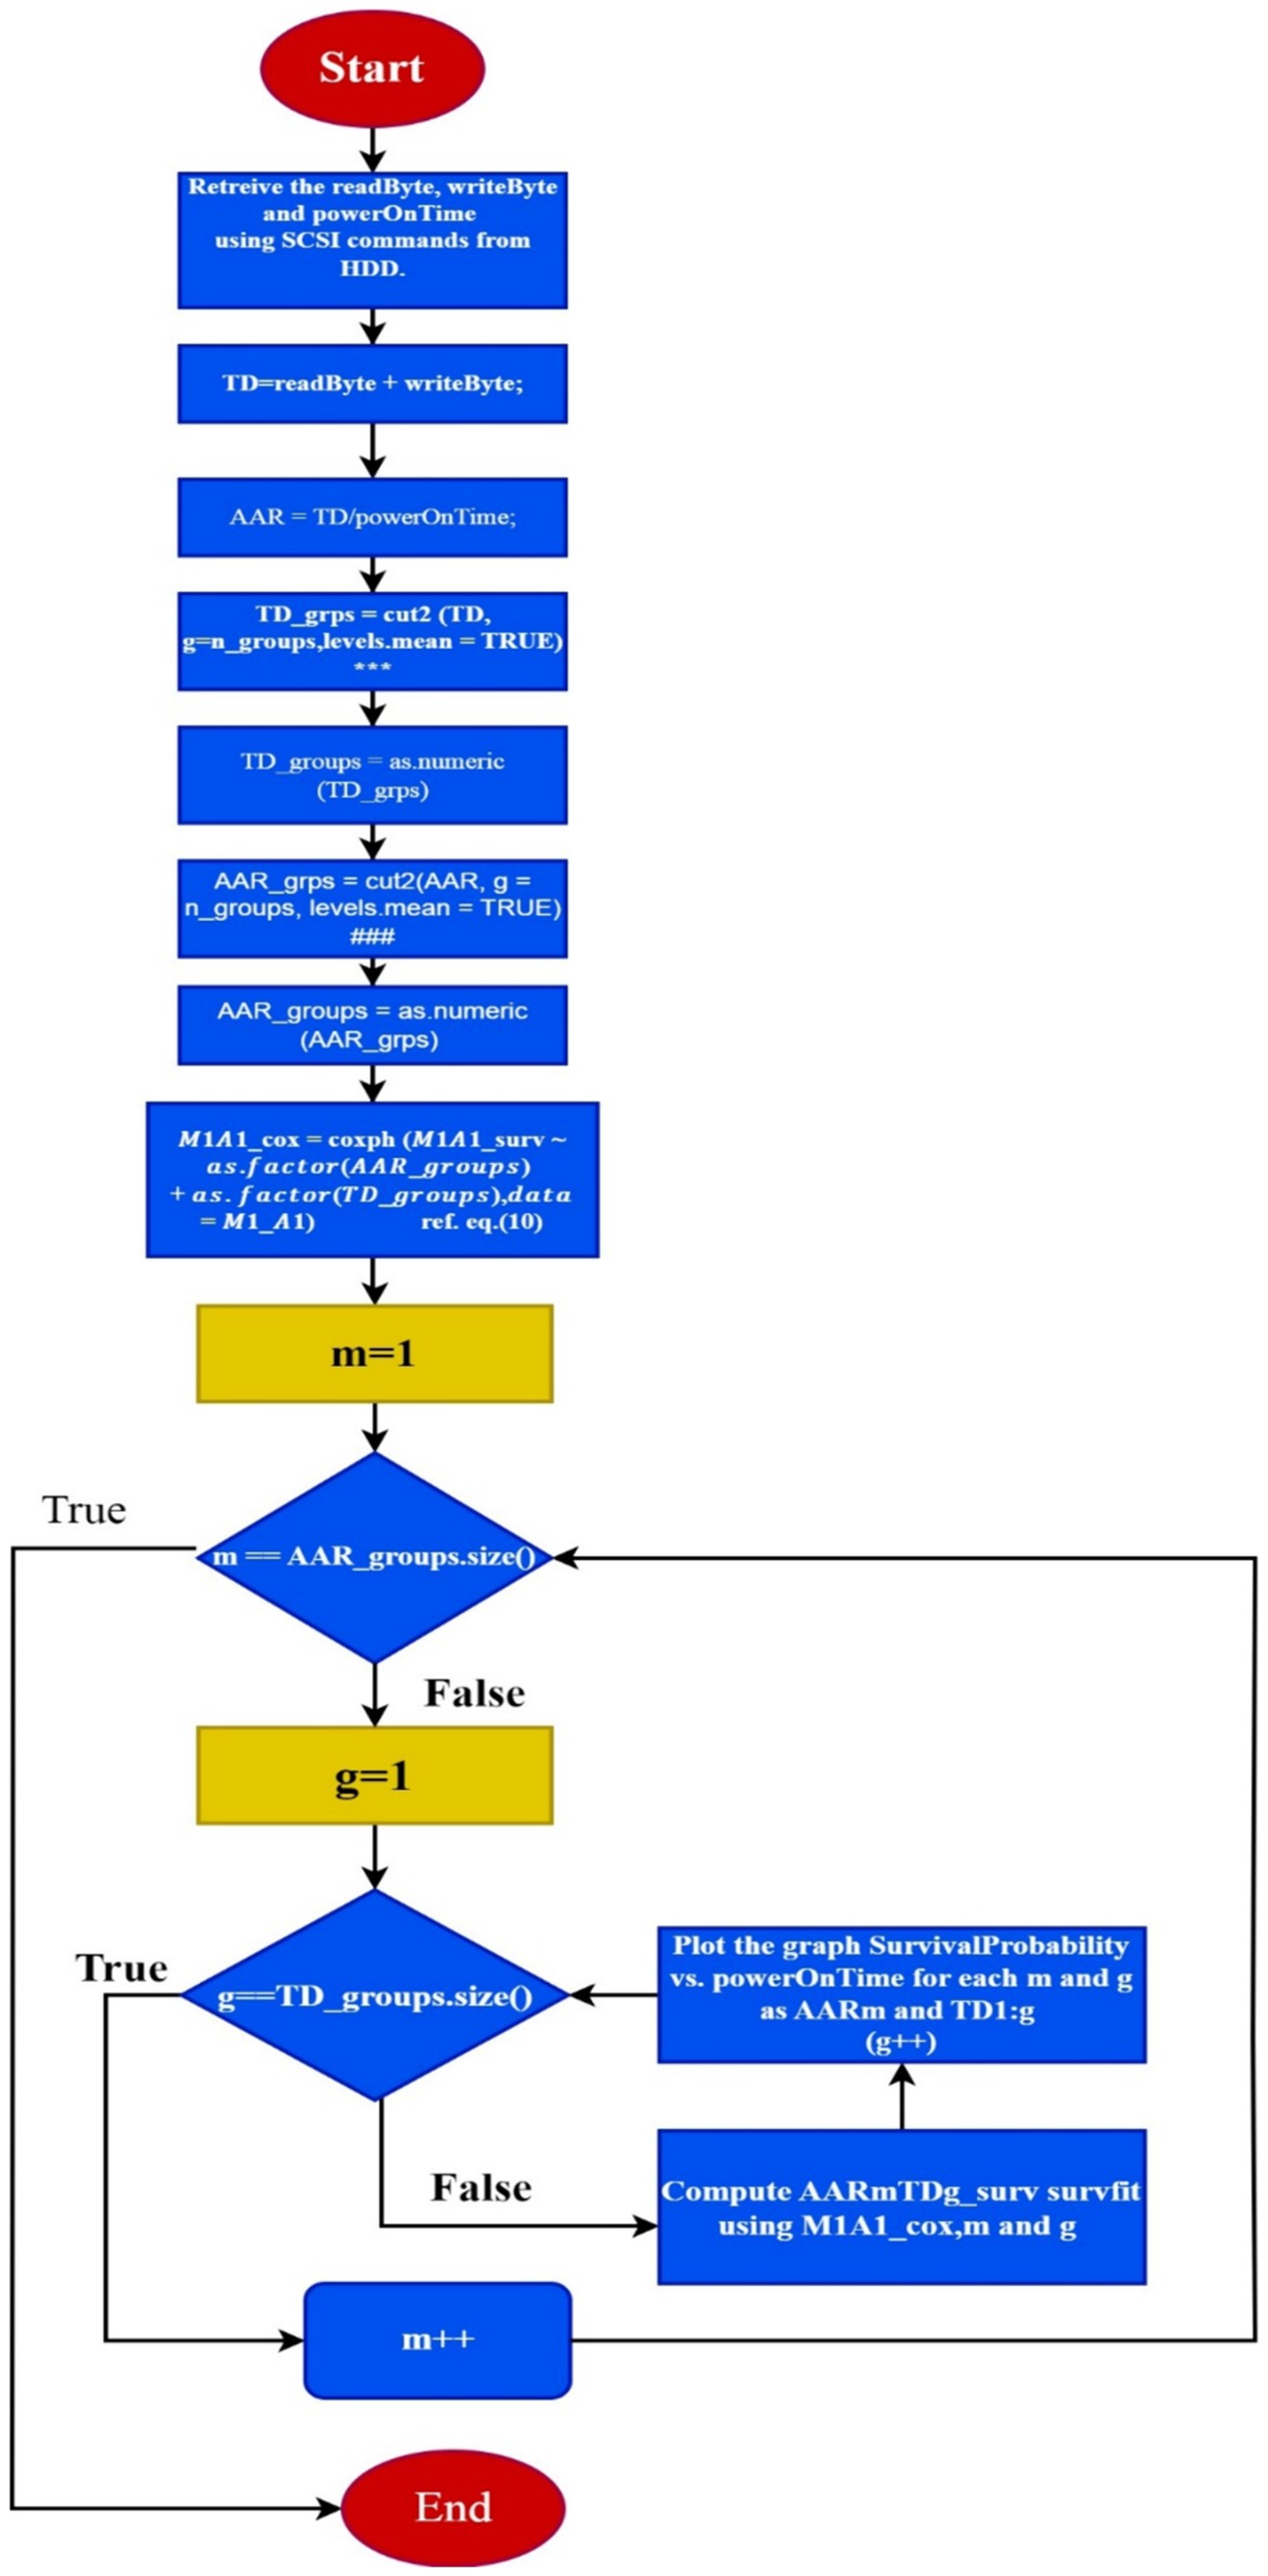
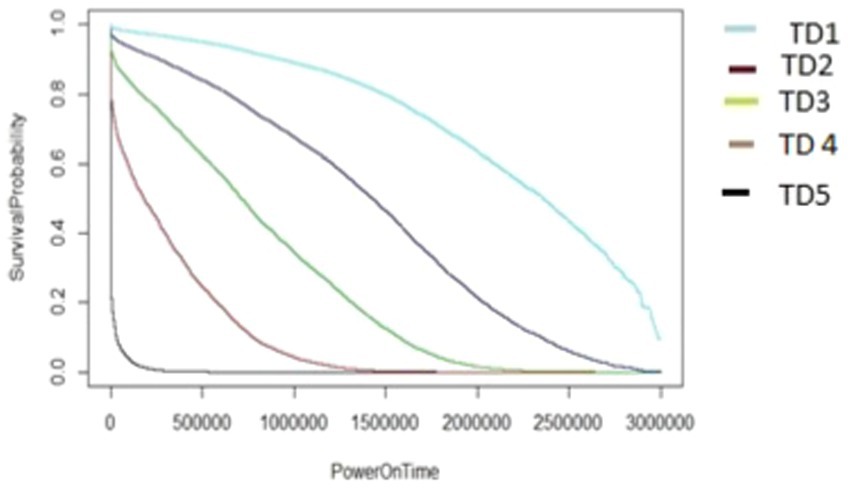
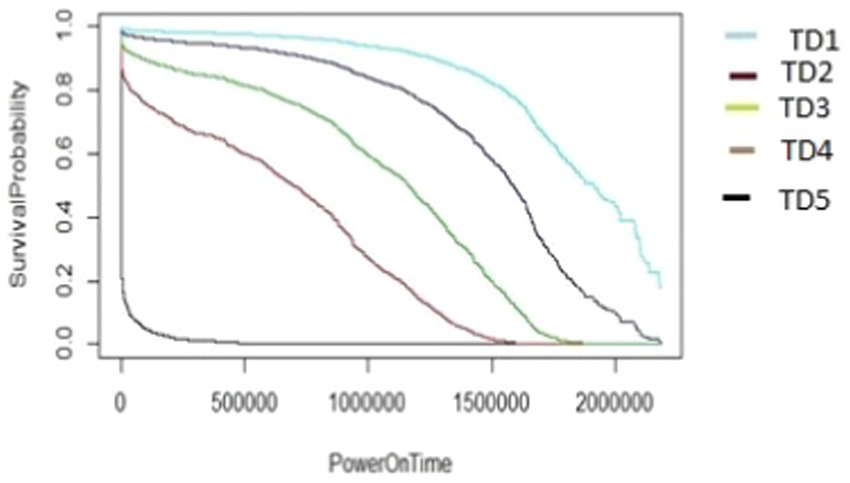
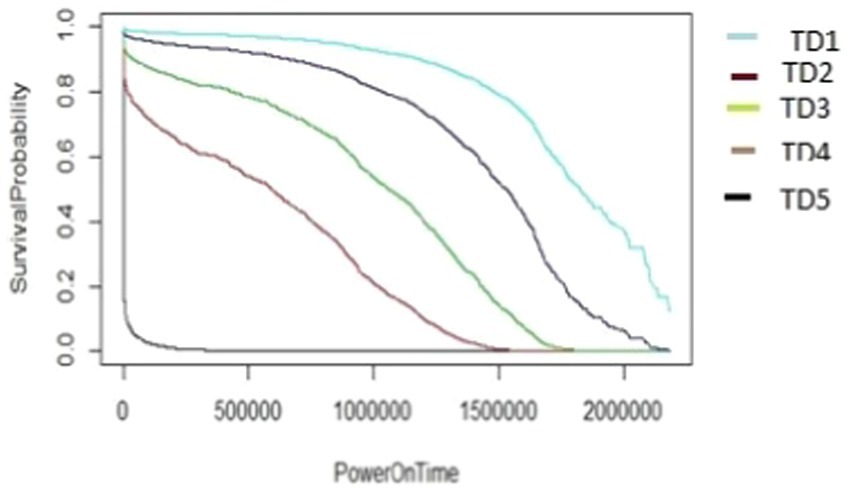
The effect of the AAR on each of these TD groups was analyzed. For a given AAR, the survival data were generated for each of the TD groups using the above Cox model, whose algorithm is outlined in Figure 7.
For each value of AAR, survival data were generated for the different data groups, using the algorithm given below in Figure 7.
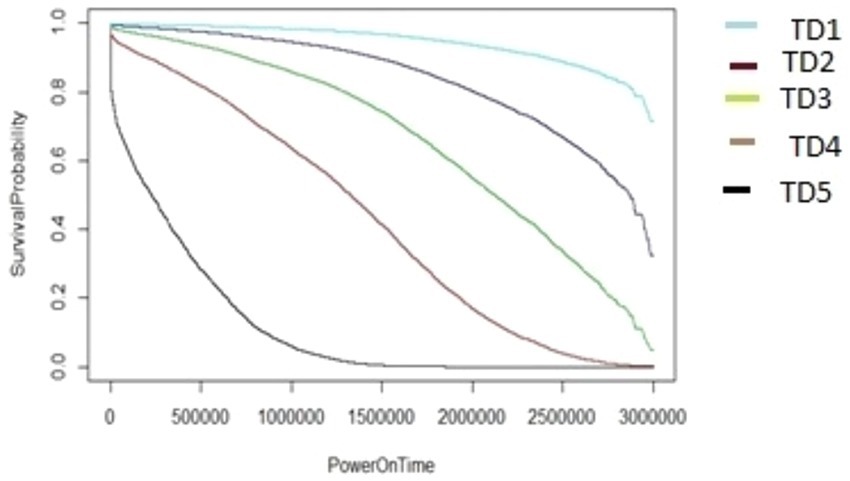
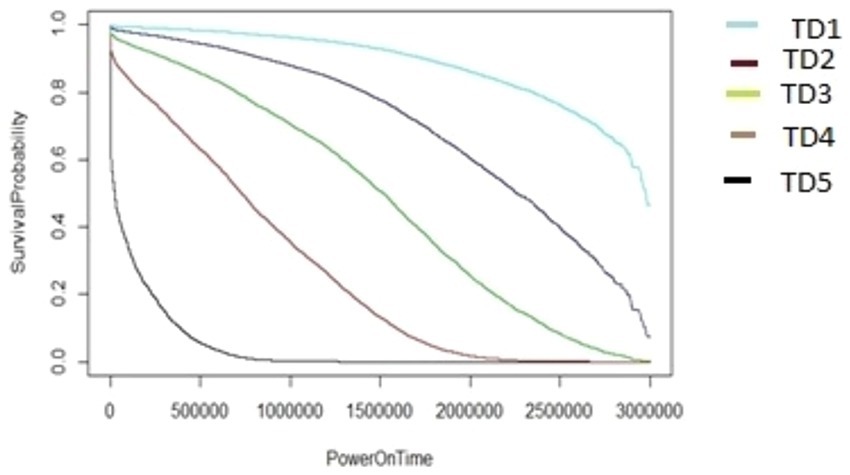
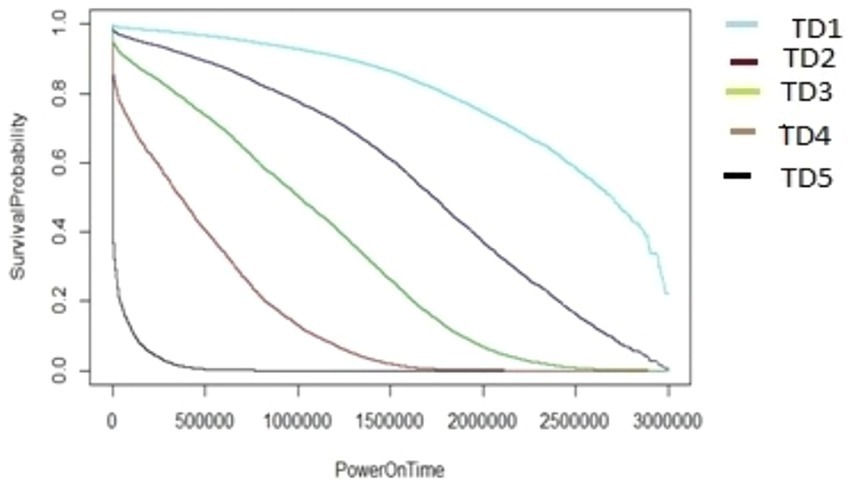
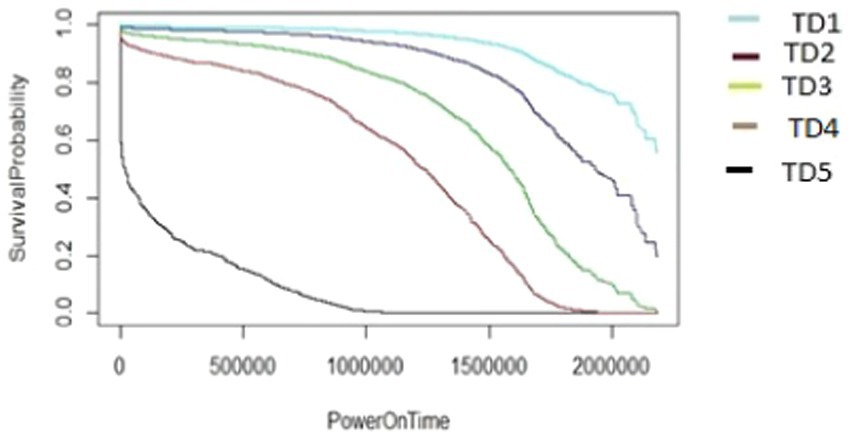
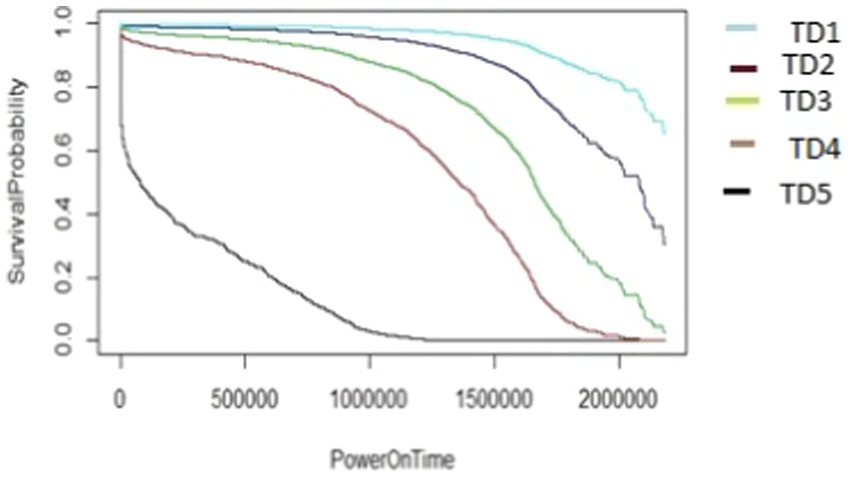
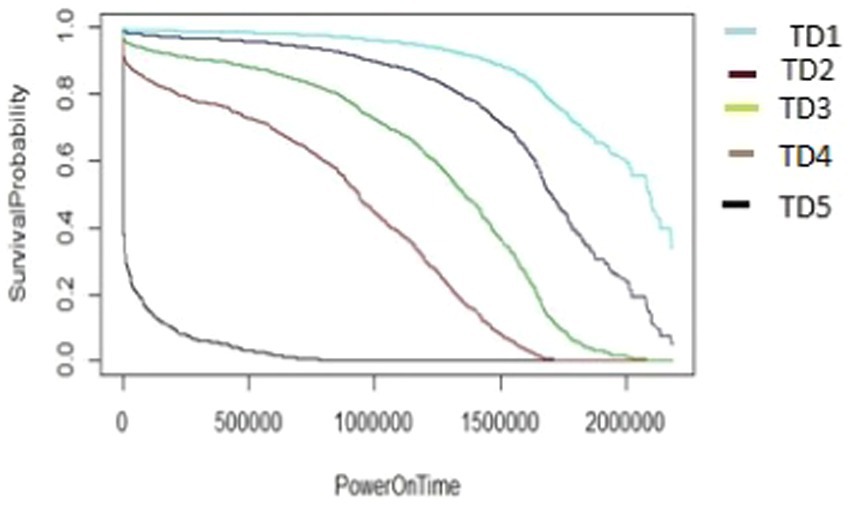
The algorithm in Figure 7, as demonstrated using ARR1 values for different TD groups (TD1-TD5), was applied in a similar way to generate the survival graphs for the other AAR groups, AAR2–AAR5. It utilizes cut2() for formation of TD_groups (denoted as *** inside Figure 7) and also for AAR_groups (denoted as ### inside Figure 7). In the algorithms, the HDD model M1-A1 was used as an example. The same algorithms can be used for M2-A2 model drives to generate survival data and survival graphs. The unit of the PowerOnTime (X-axis) in Figures 8–17 is in minutes. The effect of workload on the survivability of a hard disk (M1-A1 model).
In summary, the proposed method stands out by integrating workload-specific metrics (TD and AAR) into the predictive model, which offers a more targeted approach to identifying potential HDD failures compared to traditional SMART models. By focusing on empirical data from actual storage systems and introducing dynamic reallocation strategies, this method aims to provide a more practical and effective solution for mitigating HDD failures in enterprise environments.
This comparison highlights the advantages of the proposed method in enhancing system resilience and optimizing resource allocation, while also acknowledging the challenges and areas for further improvement. The authors emphasize that this comprehensive approach can significantly contribute to the advancement of storage system reliability and efficiency.
The graphs shown in Figures 8–12 were plotted using data for the HDD model M1-A1. They show that for a given data volume (TD), as the access rate is changed from AAR1 to AAR5, the survival probabilities are reduced. They also show that the access rate has a significant effect on HDD failures.
The graphs shown in Figures 8–12 also confirm that for a fixed amount of data, if the data access rate is increased, the survival probability of the drives decreases. They also show that the rate of access has a significant impact on survivability apart from just the total data written or read.
The graphs shown in Figures 13–17 were plotted using data from the HDD model M2-A1. They show that for a given amount of data (TD), as the access rate changes from AAR1 to AAR5, the survival probabilities are reduced. They also show that the access rate has a significant effect on HDD failures. The graphs shown in Figures 12–16 confirm that, for a fixed amount of data, if the data access rate is increased, the survival probability of the drives decreases. They also show that the rate of access has a significant impact on survivability apart from just the total data written or read.
5 Conclusion
In the modern digital world, data is one of the critical assets of any business, and data availability and data access are important metrics for predicting the failure of HDDs. The method for storage system controller firmware proposed in this work could be used to manage failure-predicted disk drives efficiently and intelligently, in order to provide greater data availability and survivability to customers. This approach allows one to apply better throttling mechanisms and the preemptive migration of data from HDDs that are predicted to fail. The proposed model paves the way for facilitating collaborations between storage experts, workload analysts, and system architects to merge domain-specific insights. This interdisciplinary approach could foster innovation by integrating expertise from various fields, leading to more robust and comprehensive survivability analyses. Thus, this work should make significant contributions toward improving data availability in companies.
Data availability statement
The datasets presented in this article are not readily available because these datasets are vendor specific. Requests to access the datasets should be directed to YW1hbm1hbGxpazAxQGdtYWlsLmNvbQ==.
Author contributions
AM: Conceptualization, Methodology, Writing – original draft, Writing – review & editing, Data curation, Formal analysis, Investigation, Software, Validation, Visualization. BR: Formal analysis, Methodology, Writing – original draft, Investigation, Project administration, Resources. GS: Formal analysis, Investigation, Supervision, Writing – review & editing, Validation.
Funding
The author(s) declare that no financial support was received for the research, authorship, and/or publication of this article.
Conflict of interest
The authors declare that the research was conducted in the absence of any commercial or financial relationships that could be construed as a potential conflict of interest.
Publisher’s note
All claims expressed in this article are solely those of the authors and do not necessarily represent those of their affiliated organizations, or those of the publisher, the editors and the reviewers. Any product that may be evaluated in this article, or claim that may be made by its manufacturer, is not guaranteed or endorsed by the publisher.
References
David, C. R. (1972). Regression models and life tables (with discussion). J. R. Stat. Soc. 34, 187–202. doi: 10.1111/j.2517-6161.1972.tb00899.x
George, T. (2013). Why specify workload?. Western Digital technologies, Inc., 3355 Michelson drive. Suite 100 Irvine. California.
Hamerly, G., and Elkan, C. (2001). Bayesian approaches to failure prediction for disk drives. ICML 1, 202–209.
Hosmer, D. W., Lemeshow, S., and May, S. (2008). Applied survival analysis: Regression modeling of time-to-event data. Hoboken, New Jersey, USA: John Wiley & Sons.
Kalbfleisch, J. D., and Prentice, R. L. (2011). The statistical analysis of failure time data. Hoboken, New Jersey, USA: John Wiley & Sons.
Kaplan, E. L., and Meier, P. (1958). Nonparametric estimation from incomplete observations. J. Am. Stat. Assoc. 53, 457–481. doi: 10.1080/01621459.1958.10501452
Kleinbaum, D. G., and Klein, M. (1996). Survival analysis a self-learning text. Springer 52:1528. doi: 10.2307/2532873
Lambert, P. C., and Royston, P. (2009). Further development of flexible parametric models for survival analysis. Stata J. 9, 265–290. doi: 10.1177/1536867X0900900206
Lane, W. R., Looney, S. W., and Wansley, J. W. (1986). An application of the cox proportional hazards model to bank failure. J. Bank. Financ. 10, 511–531. doi: 10.1016/S0378-4266(86)80003-6
Liu, Q., and Xing, L. (2020). Survivability and vulnerability analysis of cloud RAID systems under disk faults and attacks. Int. J. Math. Eng. Manag. Sci. 6, 15–29. doi: 10.33889/ijmems.2021.6.1.003
Mohanta, T., and Ananthamurthy, S. (2006). A method to predict hard disk failures using SMART monitored parameters. Recent developments in National Seminar on devices, circuits and communication (NASDEC2-06). Ranchi. India 243–246.
Mohanta, T., Basireddy, R. R., Nayaka, B. G., and Chirumamilla, N. (2015). Method for higher availability of the SSD storage system. In 2015 international conference on computational intelligence and networks (pp. 130–135). IEEE.
Murray, J. F., Hughes, G. F., and Kreutz-Delgado, K. (eds.) (2003). Hard drive failure prediction using non-parametric statistical methods.
Rajashekarappa, S, and Sunjiv Soyjaudah, K. M. (2011). Self monitoring analysis and reporting technology (SMART) Copyback. In International conference on information processing (pp. 463–469). Berlin, Heidelberg: springer Berlin Heidelberg.
Rincón, C. A., Pâris, J. F., Vilalta, R., Cheng, A. M., and Long, D. D. (2017) Disk failure prediction in heterogeneous environments. In 2017 international symposium on performance evaluation of computer and telecommunication systems (SPECTS) (pp. 1–7). IEEE.
Royston, P., and Sauerbrei, W. (2008). Multivariable model-building: A pragmatic approach to regression anaylsis based on fractional polynomials for modelling continuous variables. Hoboken, New Jersey, USA: John Wiley & Sons.
Shen, J., Wan, J., Lim, S. J., and Yu, L. (2018). Random-forest-based failure prediction for hard disk drives. Int. J. Distrib. Sensor Netw. 14:155014771880648. doi: 10.1177/1550147718806480
Smith, T., and Smith, B. (2001). Survival analysis and the application of Cox’s proportional hazards modeling using SAS. SAS conference proceedings:. SAS Users Group International.
Smith, T., and Smith, B., (2004).Kaplan Meier and cox proportional hazards modeling: hands on survival analysis. SAS conference proceedings: Western users of SAS software 2004 Pasadena, California.
Smith, T., and Smith, B. (2005). Graphing the probability of event as a function of time using survivor function estimates and the SAS® System's PROC PHREG. In SAS Conference Proceedings: Western Users of SAS Software (pp. 21–23).
Villalobos, C. C., (2020) Survival analysis: hard drive reliability sample. Available at: https://github.com/cconejov/Surv_Analysis_HDD (Accessed November 11, 2023).
Keywords: cox proportional hazards model, storage system risk reduction, HDD failure prediction, survivability probability, enterprise storage systems
Citation: Mallik A, Reddy BR and Sahoo G (2024) A survivability analysis of enterprise hard drives incorporating the impact of workload. Front. Comput. Sci. 6:1400943. doi: 10.3389/fcomp.2024.1400943
Edited by:
Nicola Zannone, Eindhoven University of Technology, NetherlandsReviewed by:
Antoine Rauzy, NTNU, NorwayKrishna Kumar Mohbey, Central University of Rajasthan, India
Copyright © 2024 Mallik, Reddy and Sahoo. This is an open-access article distributed under the terms of the Creative Commons Attribution License (CC BY). The use, distribution or reproduction in other forums is permitted, provided the original author(s) and the copyright owner(s) are credited and that the original publication in this journal is cited, in accordance with accepted academic practice. No use, distribution or reproduction is permitted which does not comply with these terms.
*Correspondence: Aman Mallik, YW1hbm1hbGxpazAxQGdtYWlsLmNvbQ==
 Aman Mallik
 B Ranjith Reddy
 Gadadhar Sahoo