- Department of Industrial Engineering and Operations Research, University of the Philippines Diliman, Quezon City, Philippines
This study aims to help in the area of depression screening in the Philippine setting, focusing on the detection of depression symptoms through language use and behavior in social media to help improve the accuracy of symptom tracking. A two-stage detection model is proposed, wherein the first stage deals with the detection if depression symptoms exist and the second stage focuses on the detection of depression symptom category or type for English and Filipino language. A baseline data set with 14 depression categories consisting of 86,163 tweets was used as input to various machine learning algorithms together with Twitter user behaviors, linguistic features, and psychological behaviors. The two-stage detection models used Bidirectional Long-Short Term Memory type of Artificial Neural Network with dropout nodes. The first stage, with a binary output classifier, can detect tweets with “Depression Symptom” or “No Symptom” categories with an accuracy of 0.91 and F1-score of 0.90. The second stage classifier has 6 depression symptom categories, namely “Mind and Sleep,” “Appetite,” “Substance use,” “Suicidal tendencies,” “Pain,” and “Emotion” symptoms that has an accuracy of 0.83 and F1-score of 0.81. The two-stage algorithm can be used to complement mental health support provided by clinicians and in public health interventions to serve as high-level assessment tool. Limitations on misclassifications, negation, and data imbalance and biases can be addressed in future studies.
1 Introduction
Depression is a health condition involving changes in emotion, thinking, or behavior. Anyone can experience it regardless of nationality, culture, gender, age, financial status, or lifestyle, making it a global concern. The Philippines has one of the highest cases of depression, affecting 3.3 million Filipinos (World Health Organization, 2017), and has seen an increase in mental health concerns over the years. Its National Center for Mental Health (NCMH) reported suicide-related calls increased from an average of 400 in 2019 to 700 in 2020. The Philippine Statistics Authority (PSA) reported a suicide rate increase of 57% from 2019 to 2020 (Philstar Global, 2021). WHO assessed that by 2030, depression will be the chief source of the worldwide disease burden, but despite the increase worldwide, access to mental health support and services poses a problem. Compared to the global median ratio of mental health workers to population of 13:100,000 (World Health Organization, 2021), the Philippines has an average of 1.68 (0.22 psychiatrists, 0.78 mental health nurses and 0.08 psychologists), highlighting the lack of mental health care providers and limited capacity for research and services (Francisco, 2017; Tolentino, 2004). This low ratio combined with stigma and other factors, leads to undiagnosed and underreported depression cases.
Depression can be screened and diagnosed through questionnaires (Goldberg, 1993; American Psychiatric Association, 2013; DiSantostefano, 2009; Kroenke et al., 2001; Beck and Steer, 1993), interviews, and brain scans. While easy to use and low-resource, questionnaires are not designed to be used for diagnosis and might be affected by biases and limitations (Kerr and Kerr, 2001). Questionnaires are commonly followed by more accurate and reliable clinical tests and interviews (Harvard Health Publications, 2020), and sometimes brain scans, but are time-, cost-, and resource-intensive (American Psychiatric Association, 2013). Financial constraints and inaccessibility of services are cited as barriers on formal help-seeking for Filipinos (Martinez et al., 2020). Detecting depression patterns from daily living activity could complement existing initial screening methods, and help discover symptoms that can be clinically validated.
More than two-thirds of Filipinos use social media (Kemp, 2024) which was found to be increasingly used by those with mental health concerns to connect, share experiences, and support each other (Gowen et al., 2012). In the US, internet users with stigmatized illnesses are more likely to use online resources for health-related information and communication than people with other chronic illness (Naslund et al., 2014). Depressed individuals perceived social media as a means of maintaining social awareness and consoling themselves, while non-depressed individuals perceived it as a means of information sharing and consumption (Berger et al., 2005). Social media can be leveraged for depression detection. Previous studies looking at depression included Twitter (Shen et al., 2017; De Choudhury and Gamon, 2013; Tsugawa et al., 2015; Shen et al., 2018; Kabir et al., 2022), Reddit (Cornn, 2019; Losada et al., 2017; Adarsh et al., 2023), Facebook (Katchapakirin et al., 2018; Rosa et al., 2019), Weibo (Shen et al., 2018; Wang et al., 2022; Li et al., 2023) and Sina Micro-Blog (Wang et al., 2013). Detecting depressed users from social networks is a common theme (user-level detection), with depressed users (Shen et al., 2017; De Choudhury and Gamon, 2013; Shen et al., 2018; Katchapakirin et al., 2018; Rosa et al., 2019; Wang et al., 2022; Li et al., 2023; Wang et al., 2013), self-harm (Losada et al., 2020) and suicidal risk (Adarsh et al., 2023). Some studies explored the detection from specific comments or texts (Cornn, 2019; Losada et al., 2020), detecting the degree of depression—mild, moderate, or severe (Tsugawa et al., 2015; Kabir et al., 2022; Losada et al., 2020) and detecting early signs of depression (Losada et al., 2017; Losada et al., 2020; Parapar et al., 2022).
Different features of social media posts were used to investigate depression including linguistic patterns, behavior, visual cues and demographics. Linguistic patterns include both content and structure like focus on oneself and detachment (Durkheim, 1951; Ramirez-Esparza et al., 2021), focus on negative aspects of life (Ramirez-Esparza et al., 2021; Pyszczynski and Greenberg, 1987), number of punctuations (De Choudhury and Gamon, 2013), use of depressive-related terms and topics (Shen et al., 2017; De Choudhury and Gamon, 2013; Rosa et al., 2019; Wang et al., 2022; Li et al., 2023), and “what” the post is about (Kabir et al., 2022; Cornn, 2019; Adarsh et al., 2023), measured through word count or use frequency. Behaviors describe how one uses social media including posting (time, frequency of posts, frequency original posts versus posting posts from others, and frequency of including pictures/links), connections (number of friends, followers, or accounts followed), and interactions (commenting on other’s posts, replying, liking posts, sharing, forwarding, and tagging people). Visual features that detect depression included color combinations (Wang et al., 2013) and image recognition (Li et al., 2023). Finally, demographic factors included age and gender (most common), climate, race, and socio-economic factors like income, unemployment, job retention, mortgage delinquencies, and education (Kerr and Kerr, 2001; Harvard Health Publications, 2020; Shen et al., 2018; Lerner et al., 2004; National Institute of Mental Health, 2007; Puyat et al., 2021).
Previous studies examined these factors or a combination of these to identify depression symptoms, detect depression, or categorize depression severity. These include preprocessing techniques such as psycholinguistic resource LIWC (Pennebaker et al., 2015) and ANEW lexicon (Bradley and Lang, 1999) to determine word sentiment and rating, Latent Dirichlet Allocation (LDA) model (Blei et al., 2003) to determine the co-occurrence and relevance of words, and word embeddings like word2vec (bag or words/skip-ngram; Mikolov et al., 2013), Global Vectors (GloVe; Pennington et al., 2014), Bidirectional Encoder Representations from Transformers (BERT; Devlin et al., 2019), and other forms of BERT to capture word meanings based on surrounding words. Classification techniques are then used to detect depression in user and non-user level (tweets or comments), such as Logistic regression (Cornn, 2019; Aliman et al., 2022), Naïve Bayes (Shen et al., 2017; Wang et al., 2013), Support Vector Machine (De Choudhury and Gamon, 2013; Kabir et al., 2022; Cornn, 2019; Adarsh et al., 2023; Katchapakirin et al., 2018; Aliman et al., 2022), and Random Forest (Katchapakirin et al., 2018; Wang et al., 2013; Nartia et al., 2021). More advanced techniques use Deep Learning Models such as Convolutional Neural Network (Cornn, 2019; Rosa et al., 2019; Pyszczynski and Greenberg, 1987) and Recurrent Neural Network (Cornn, 2019; Losada et al., 2017; Rosa et al., 2019; Losada et al., 2020).
Gaps in previous studies that developed models to detect depression were identified. First, most studies focus on screening the users (user-level) instead of the existence of depression symptoms in social media language. User-level detection not based on symptom tracking can mimic screening methods but are not efficient to implement since clinical diagnosis still needs expert help. However, a two-stage depression symptom detection model on a Tweet level that can accurately identify symptoms over time can complement clinical practice and improve its efficiency. Second, studies using Filipino and English have been done but they focus on creating a mobile app that screens and monitors for depression symptoms using pattern matching, rather than machine learning methods (Bitsch et al., 2015), and development of a bot that classifies potential mental health crisis tweets using machine learning, detecting those in need, rather than identifying depression symptoms (Aliman et al., 2022). No other Philippine context and language-based studies on depression detection focus on symptoms. Lastly, previous depression detection studies collected data from group or topic involvement and keyword search in social media sites, lacking the validation from clinical interviews. This study used a data set generated from depression questionnaires and validated by clinical experts, the gold standard for depression diagnosis. Our previous research describes the methodology and validation of the data set used in this study (Tumaliuan et al., 2024).
This research addresses the gaps by determining patterns that lead to depression in social media through language use, behavior, and linguistic data to augment depression screening methods. It aims to determine presence of depression symptoms (stage 1) and depression symptom category (stage 2) from daily living activities of social media users through a two-stage depression symptom detection model. Early intervention and detection are important in depression cases (Halfin, 2007), and research focused on symptom detection can facilitate a proactive and personalized approach to care. This research can pave the way for clinical practice integration by enabling real-time monitoring and detection, or during clinical interviews to provide a list of symptoms during consultations. Use of an open-source framework will enable application of the algorithm to other data sets, and can be applied to develop detection algorithms for other languages. The detection model can be expanded in public health initiatives by deployment in web-based systems that will run the algorithm using a social media Application Programming Interface (API) or simple text input, making it widely available. This can provide a cost-efficient intervention to help public health institutions with a high-level assessment tool to gain insights on the mental status of the population during periods of high stress (e.g., calamities).
2 Methods
This section describes the machine learning methods for creating a two-stage depression symptom detection model.
Figure 1 summarizes the methods and design of this study.
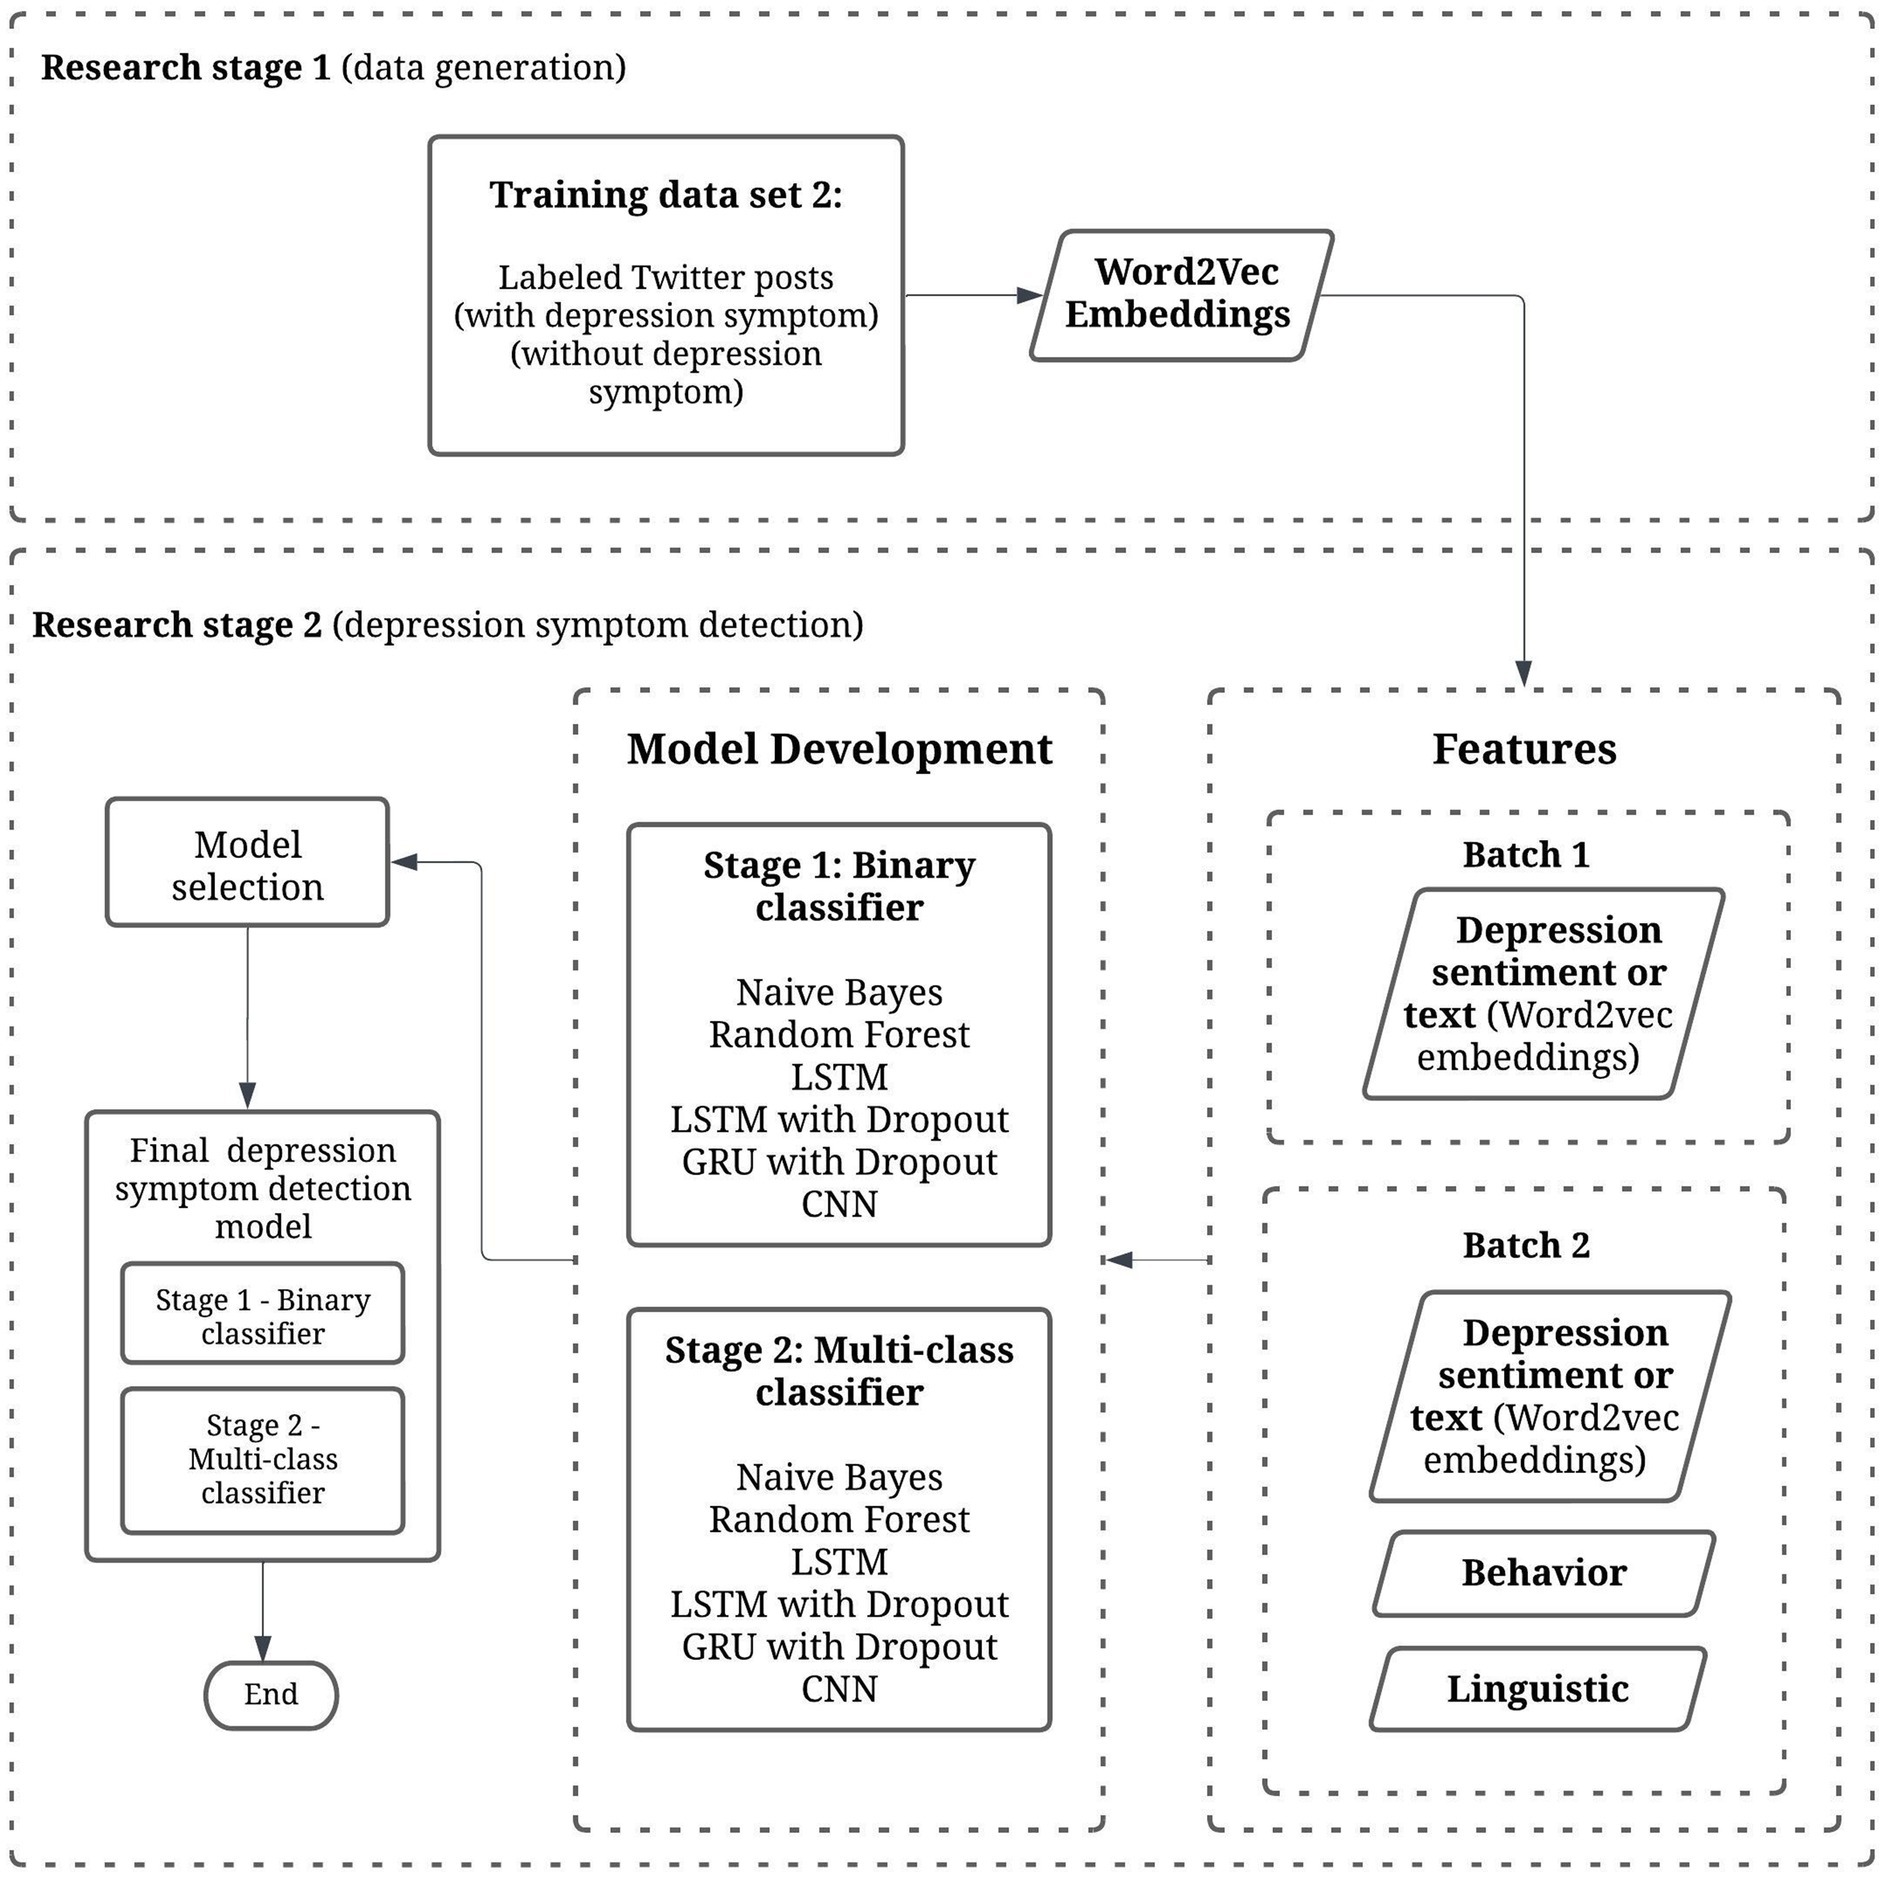
Figure 1. Methods and study design. This study (Research stage 2) combines depression sentiment text, behavior, and linguistic features to create a two-stage depression symptom detection model using machine learning techniques.
2.1 Study design
This study is a two-stage research that aims to detect depression symptom patterns in social media. It involves Stage 1 (data generation; Tumaliuan et al., 2024) and Stage 2 (depression symptom detection). This paper focuses on the second stage, which is the development of a depression symptom detection model.
2.2 Data set information
2.2.1 Data generation
In our previous work (Tumaliuan et al., 2024), 75 participants were assessed for depression through clinical interviews with mental health experts. Out of the 75 participants, 6 contributed 2 Twitter accounts each, resulting to 81 Twitter users. This resulting user-level data set, tagged as data set 1—is a combination of survey and demographic data, PHQ-9 depression assessment questionnaire results, and Mental Health Assessment results.
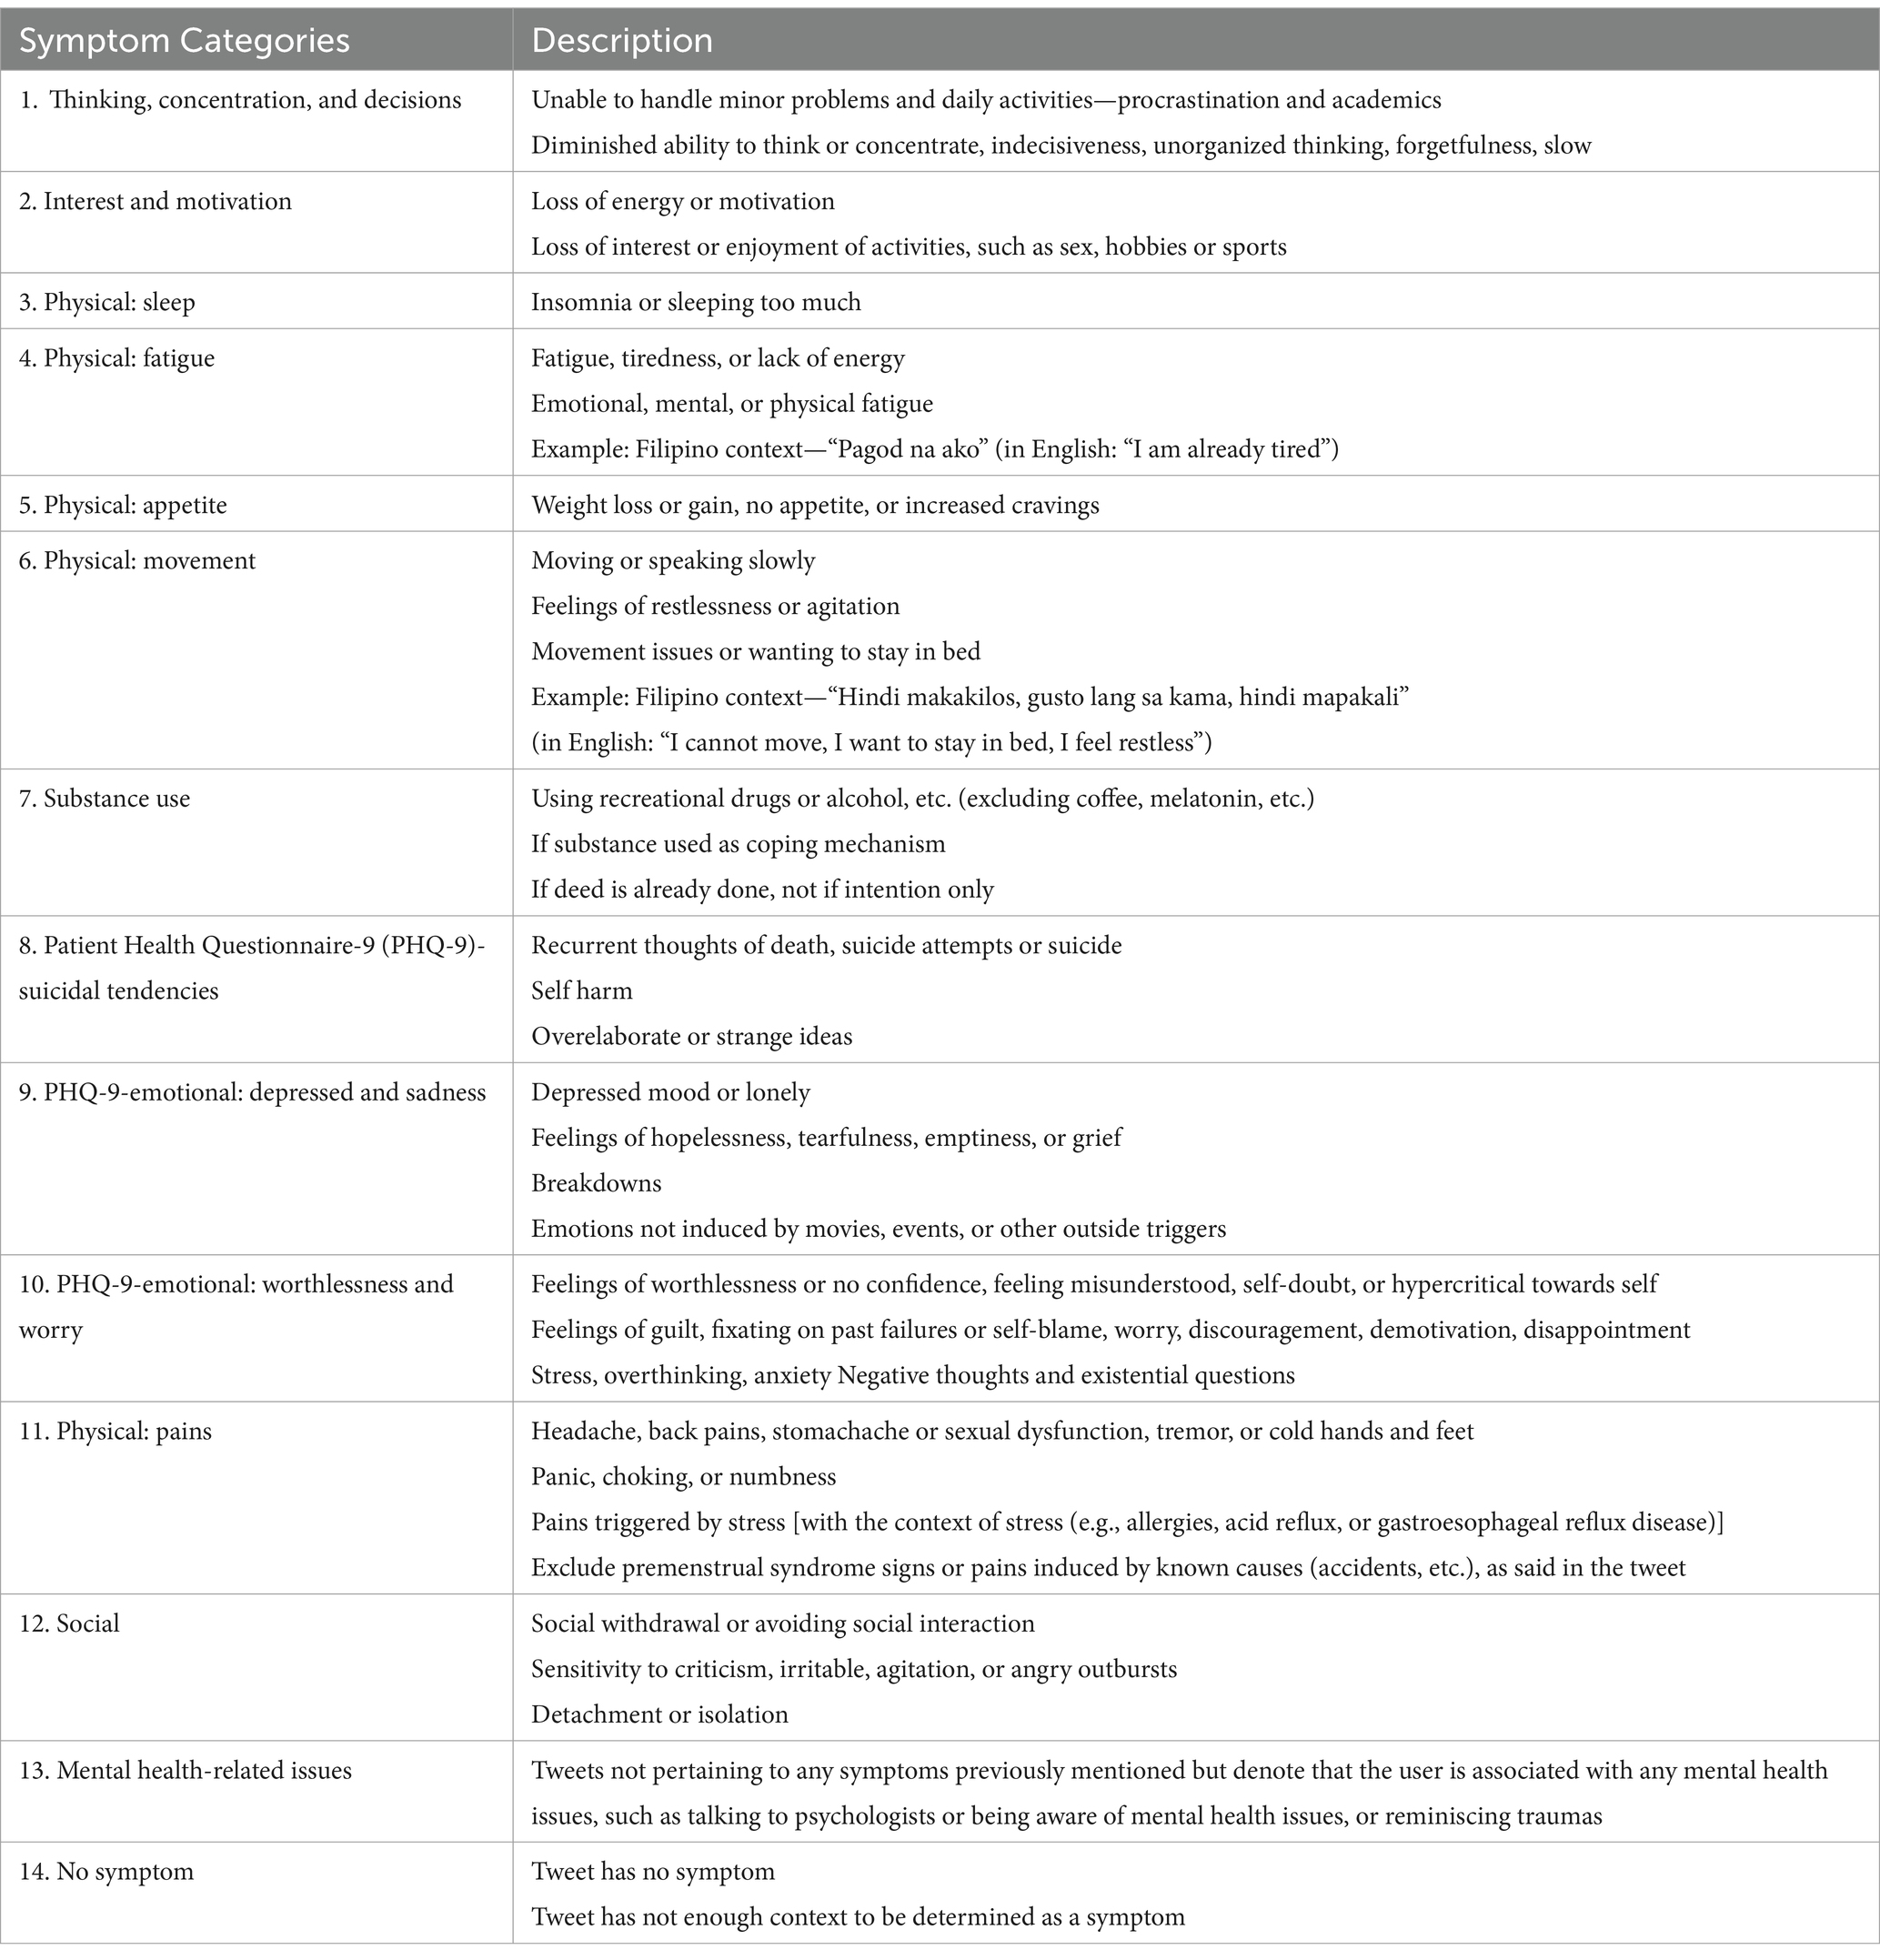
To create a tweet-level depression symptom data set, data set 2 was created in which individual tweets were manually annotated as having depression symptoms or no symptoms. All 81 Twitter users have been included in this data set and their respective tweets. The objective was to create depression symptom categories and to determine rules and guidelines for annotating tweets into the respective categories. Annotation guidelines were created and was held with 2 licensed clinical psychologists in a series of online sessions. A reviewed and finalized depression symptom categories with the psychologists was then obtained. These categories are based on the DSM-5 criteria for depression (The Structured Clinical Interview for DSM-5; American Psychiatric Association, 2013), PHQ-9 results (Kroenke et al., 2001), and Mental Health Assessment results.
The annotation process started with setting an inclusion and exclusion criteria like language, date of tweet, and removal of unoriginal tweets (retweets) for selection of tweets to be annotated. Three annotators reviewed the resulting depression symptom tweets. Tweets were annotated anonymously, individually, and in a randomized order. Tweet label categories were considered correct if at least 2 annotators selected the same symptom category. Annotators labeled a maximum of 3 symptoms per tweet. After each iteration, an annotation review is conducted within the annotators for tweets that do not have two agreeing annotations on the symptom category. After the annotation process, a validation step is held wherein 4 to 5 samples per category were chosen through random sampling, a total of 68 tweets. These tweets were reviewed by the psychologists together with the annotators. There were only 3 out of 68 validation tweets in which the psychologists disagreed with the category label, which results to a 95.59% psychologist validation score. Another validation step is used using the Fleiss Kappa to measure the inter-annotator score using the tweets annotated by three annotators and 13 label categories. The agreement score is 0.735, interpreted as “Substantial agreement” from the interpretation of the Fleiss Kappa measurement.
2.2.2 Data set summary
The annotated training data set (data set 2—Tweet-level Depression Symptom Category) and Word2vec language model created in our previous study are used to develop the depression symptom detection model. It consists of 11,865 tweets tagged with 13 Depression symptom categories and 74,298 tweets tagged as “No symptom” from all 75 users. These tweets are written in a combination of English and Filipino, which are pre-cleansed and tokenized.
Table 1 shows the symptom categories and descriptions from the data generation (annotation guideline) output of our previous study.
2.3 Model features
This study uses (1) Sentiment Analysis, and (2) Sentiment Analysis with behavior and linguistic features as input to machine learning models. The following paragraphs summarizes these features.
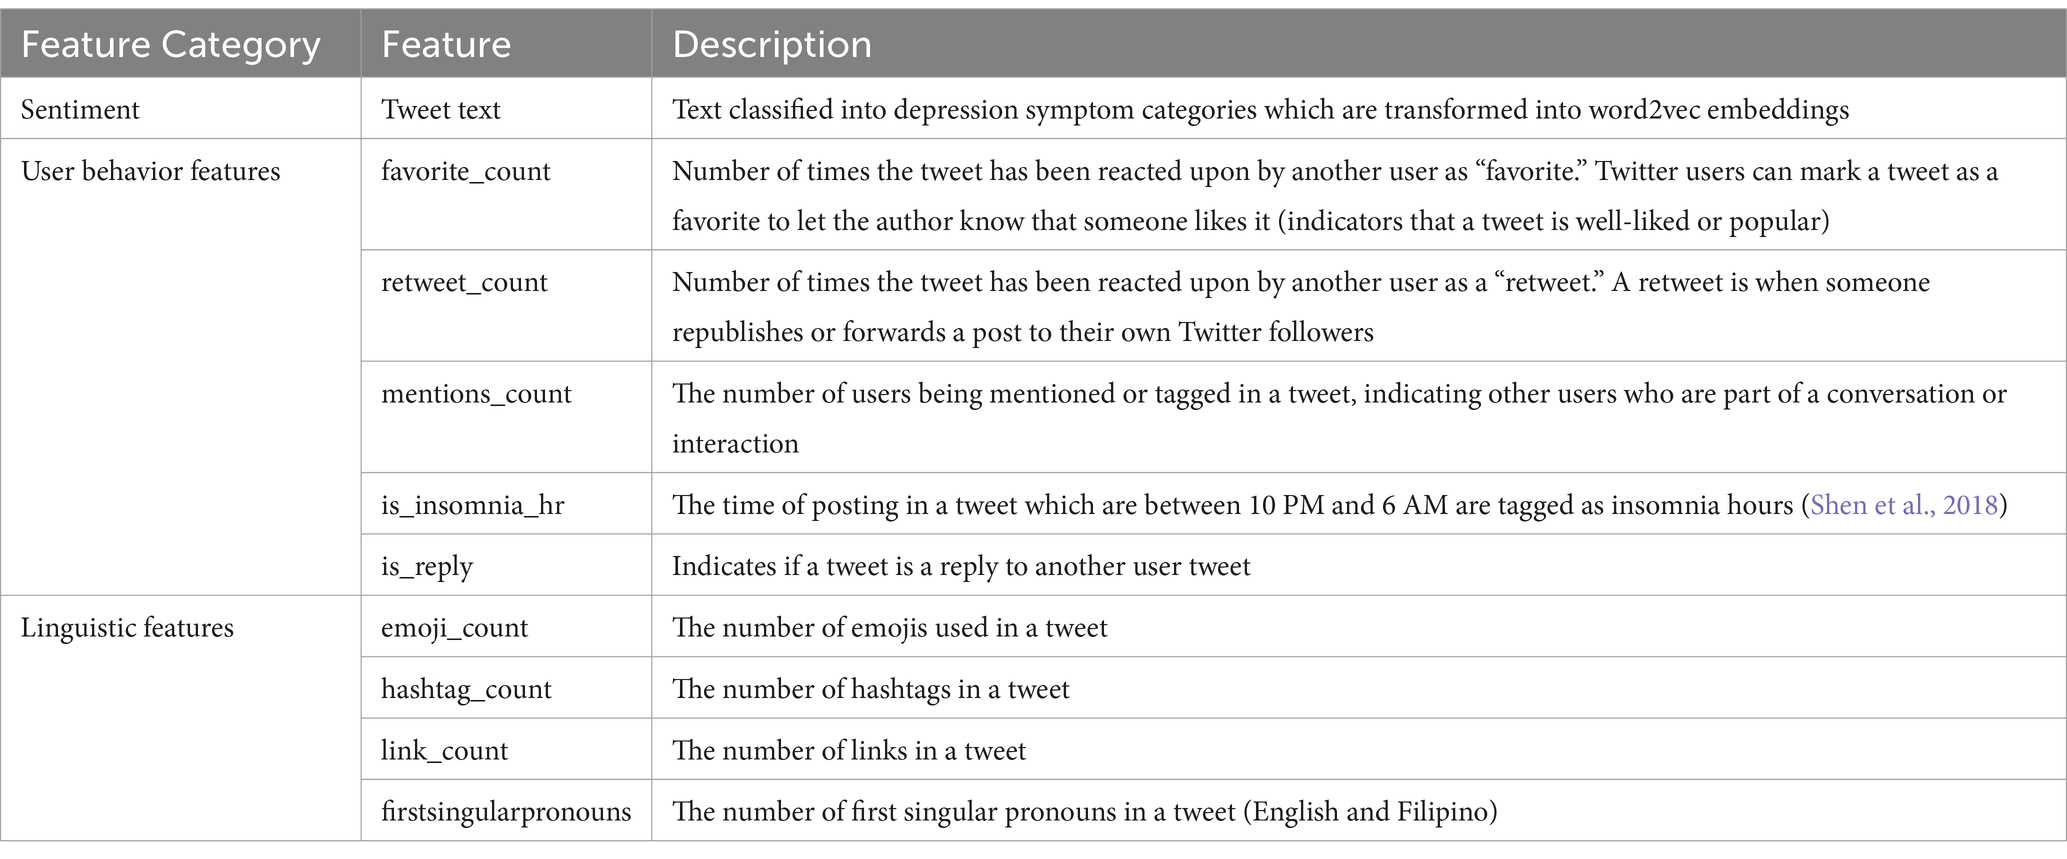
Sentiment analysis methods (technique used to determine sentiments of texts through data polarity—e.g., positive, negative, neutral, or emotion—e.g., angry, surprise, happy, sad) are used to determine text classifications. In this study, sentiment of texts is determined through the occurrence of depression symptoms, since tweet texts can express sentiments or emotions which are categorized into these different symptoms. All training models are first tested on this singular text feature represented via word vectors using Word2vec word embedding, tagged as Batch 1.
Some user behavior data from Twitter are also used, including linguistic features gathered from the same text data to compare how these additional features can improve the detection model. Two features, like “is_insomnia_hr” and the “firstsingularpronouns,” are psychological features from previous studies which claim to be significant in determining depression symptoms in users. Other linguistic and behavior features are also used as per the features used in studies as mentioned in Table 2. This set of input features is tagged as Batch 2.
2.4 Model development
2.4.1 Classifier output
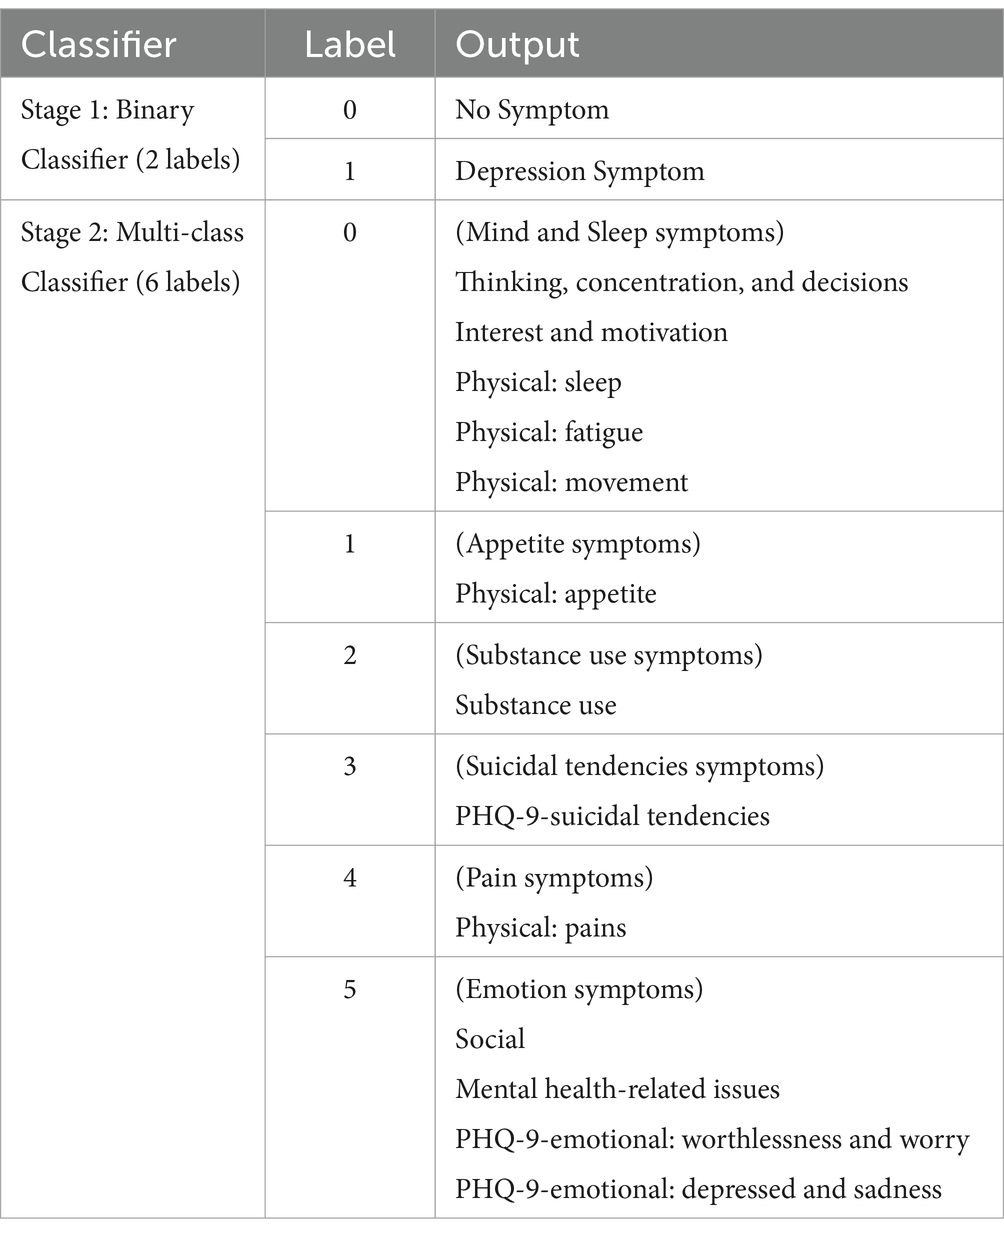
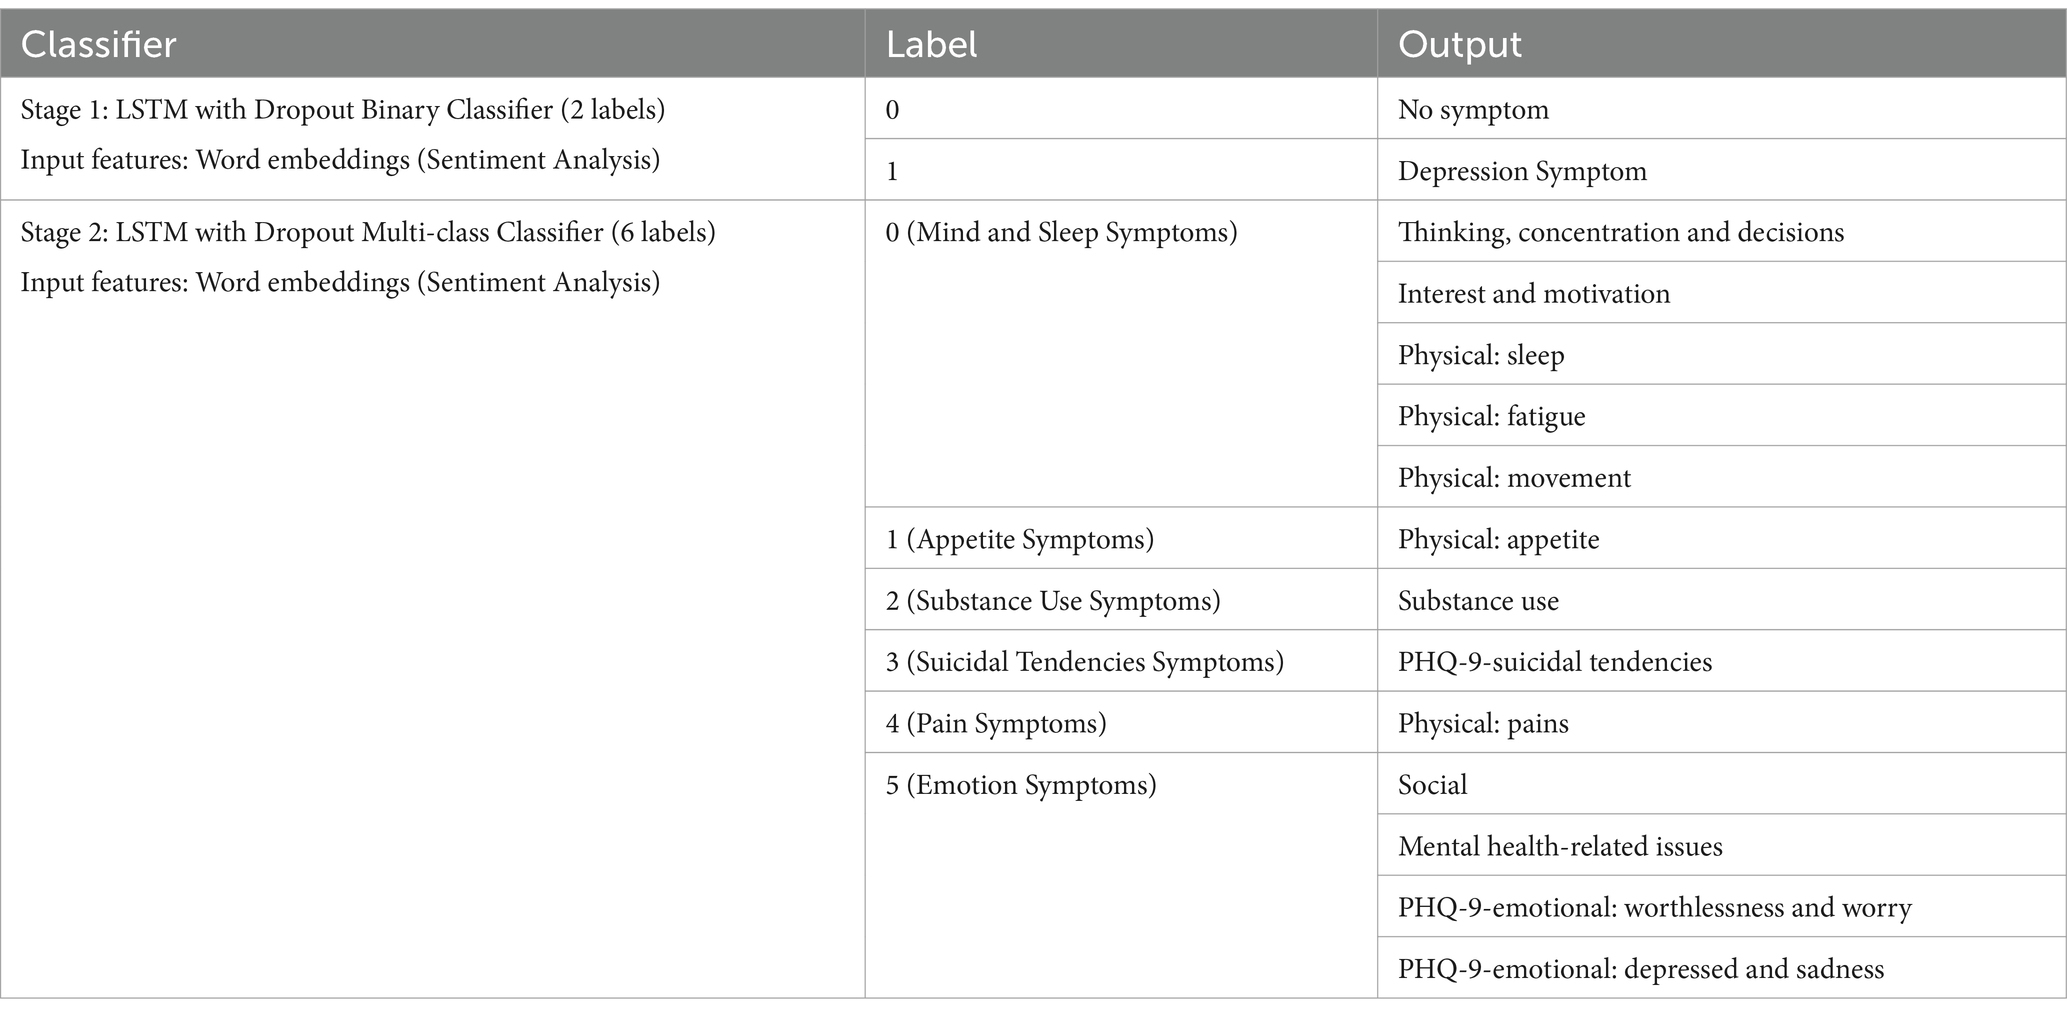
The first stage detection model created for this study is a binary classifier which predicts if a text is a “Depression Symptom” or “No Symptom” (Stage 1 detection). The second stage model created is a multi-class classifier with 6 labels which include the grouped symptoms which are all depression symptom categories (Stage 2 detection). The final goal for the two-stage detection is to have an initial binary classifier for stage 1 detection. If the output from the initial stage is a “Depression Symptom,” a second classifier (stage 2 detection) will determine what symptom category the text belongs to base on the 6-label classifier.
Groupings of the labels for the second stage multi-class classifier (6 labels) are based on the symptoms that mostly co-occur from the result of the annotation training data for data set 2. Some tweets are categorized as having more than one symptom, and a co-occurrence matrix was used to determine which categories are mostly seen together in individual tweets. Symptoms with at least 20 instances of co-occurrence with other symptoms are considered to be grouped together, thus, 1 (Appetite Symptoms), 2 (Substance Use Symptoms), 3 (Suicidal Tendencies Symptoms), and 4 (Pain Symptoms) are labeled in separate groups. PHQ-9-emotional: worthlessness and worry is seen to mostly co-occur, in descending order, with PHQ-9-emotional: depressed and sadness, Thinking, concentration, and decisions, Social, and Mental health-related issues. Most symptom in this group are emotion symptoms, thus they are labeled together as 5 (Emotion symptoms) with the exception of Thinking, concentration, and decisions. This symptom mostly co-occurs with Physical: sleep, which in turn co-occurs with Interest and motivation, and in turn co-occurs with Physical: movement. These are grouped together as 0 (Mind and Sleep symptoms) together with Physical: fatigue which co-occurs more with the symptoms in this category rather than the emotion symptoms. This co-occurrence matrix is provided in the Supplementary materials.
Summarized in Table 3 are the classifiers, labels, and output which are generated and compared in this study.
2.4.2 Predictive power
In order to measure and compare the performance of the machine learning models which are to be used in this study, we look at the predictive power of the models, which is the ability to generate testable predictions. The equation below shows how we compute performance measurements using the actual and predicted values of model outputs, where TN = True Negative, FP = False Positive, FN = False Negative, TP = True Positive.
The accuracy of a model is the ability to differentiate the depression symptom and no symptom cases correctly. Precision measures how many identified positive items are actually correct, also known as “quality.” Recall, on the other hand, measures how many positive items were identified correctly, also known as “quantity.” The F1 Score combines precision and recall using their harmonic mean, and maximizing the F1 score implies simultaneously maximizing both precision and recall.
For this study, F1 score is used to measure the predictive power of our models since it maximizes precision and recall and it shows how good our models can predict the depression symptom class (TP). We also output the accuracy measure to be able to compare the results to other studies indicated in the literature review.
2.4.3 Class imbalance on training data
In real world scenarios, there is a small percentage of depressed users (8.9% of young adults) in the Philippines (Puyat et al., 2021). Our data sets significantly contain more depressed users (80%), and this may affect results in a user-level detection. Although our model is on a tweet-level detection, it also follows that depression symptoms occur significantly less in real-world scenarios in social media data. For our tweet-level detection, our depression symptom class is 14% of the training data or 11,865 total number of instances out of 86,163 total training records. While this may or may not represent the actual percentage of depression symptoms in the real world, this data set contains 18 months of real life, unbiased Twitter data for 81 users and is a good start to model predictions to see how well the patterns of depression symptoms in text occur.
The binary classification models in this study are trained in different class sizes. All models are run containing balanced class data selected randomly (50% With Depression Symptom with downsampling, 50% No Symptom with upsampling), and another run is performed for imbalanced class data (all data in training data set, with 14% With Depression Symptom and 86% No Symptom) for comparative purposes.
2.4.4 Machine learning models
Two model development batches are run. Batch 1 includes only the word vector embedded input, and Batch 2 includes word vector embedded inputs with additional behavior and linguistic features as inputs.
Machine learning models are implemented for Batch 1 to predict text data on tweet-level depression detection for the Stage 1 Binary Classifier and Stage 2 Multi-class classifier detection models. The models used are—Naïve Bayes, Random Forest, Convolutional Neural Network (CNN), Bidirectional Long-Short Term Memory (LSTM), Bidirectional Long-Short Term Memory with Dropout (LSTM with Dropout), and Gated Recurrent Unit (GRU).
For an unbiased evaluation of the model, the training data set is split randomly into training and test data using the “sklearn” package “train_test_split” which handles the splitting and sub-sampling of data. Random state seed has been set for this to ensure that shuffling of data before the split is reproducible, and stratified sampling is used to handle class imbalances. All models are configured to have a test size of 0.2, in which 20 percent is chosen randomly as test data used to evaluate the models, while the remaining 80% are part of the training set. Random forest and neural networks take word2vec vectors as embedding layer inputs. All models are ran with balanced and imbalanced (all data) classes, and are ran 3X with 20 epochs each through hold-out method. Data set seeds are used for the random selection of data (for balanced class data) and model seeds are used during the model development. All models have a random seed set for every run for all three runs, to ensure reproducibility of results. These are also ran with different class label outputs (binary and multi-class classifier with 6 labels). Detailed hyperparameters and configurations are provided in the Supplementary materials.
3 Results
3.1 Batch 1: word embedding features
3.1.1 Stage 1: binary classifier
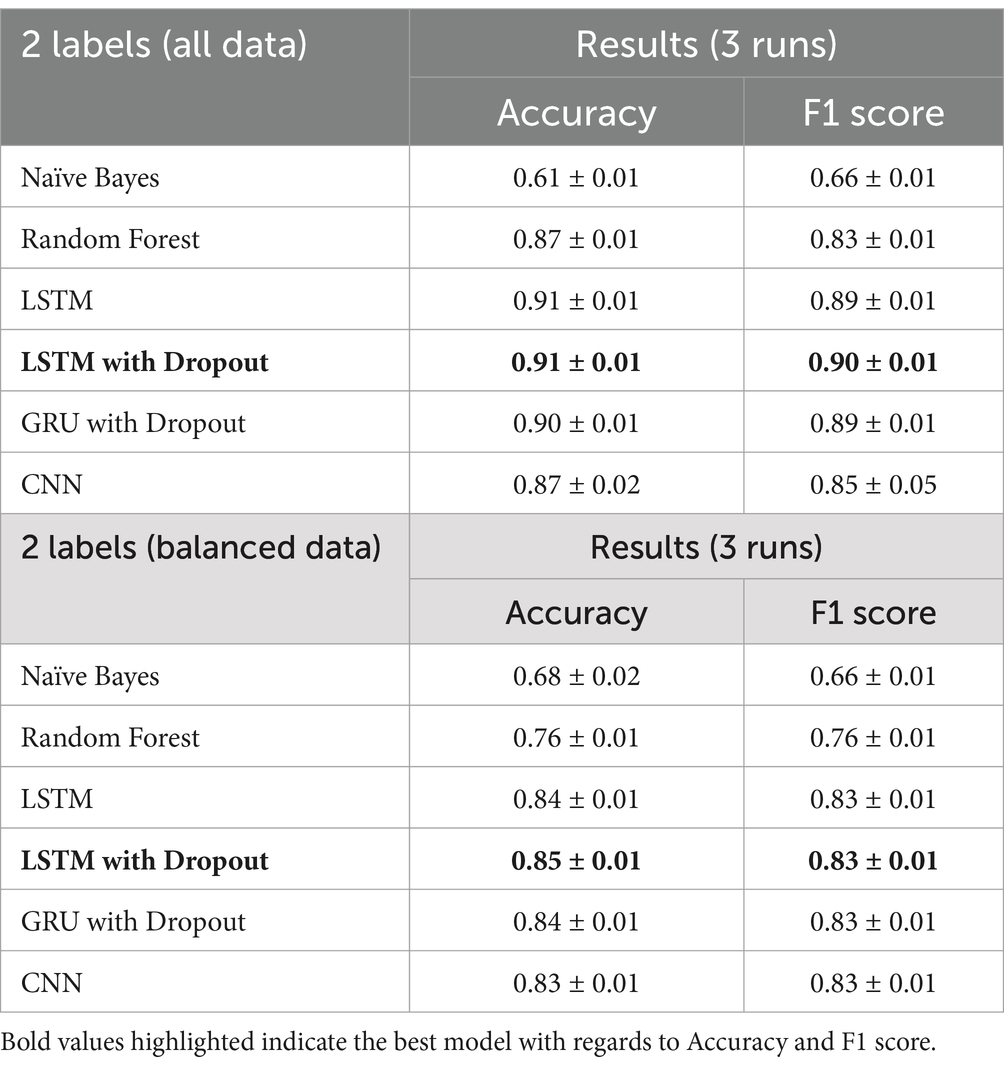
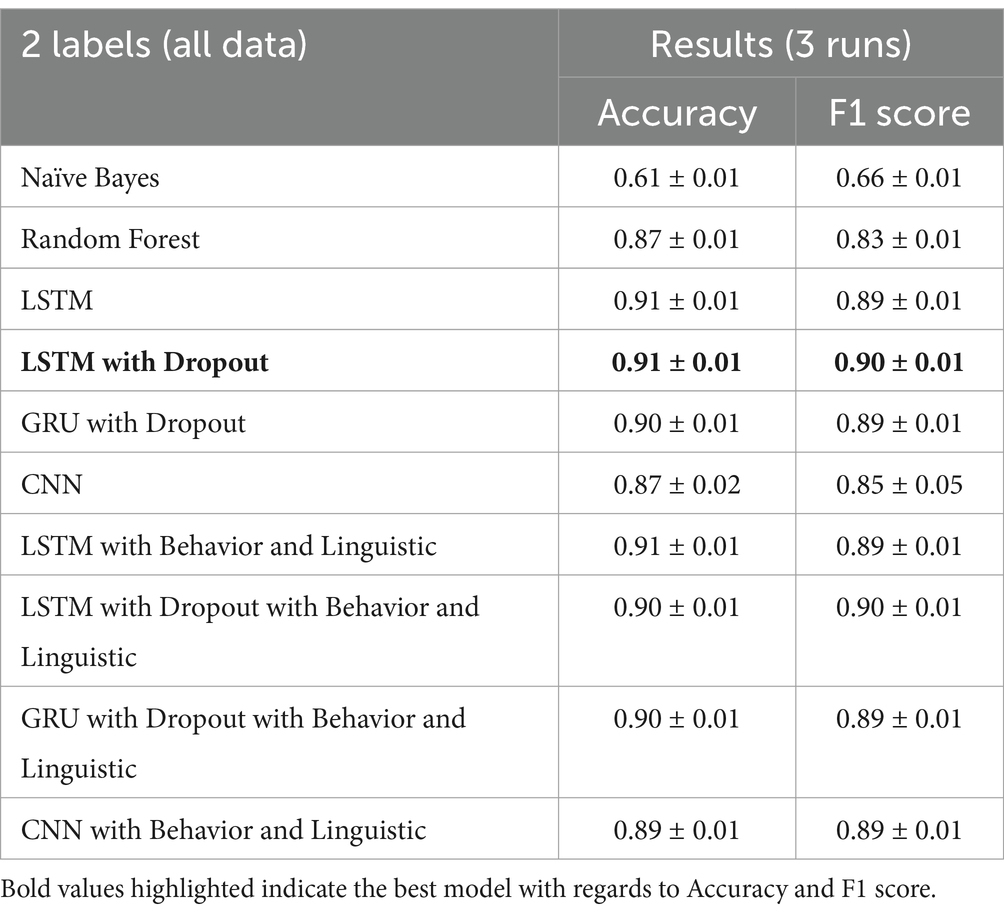
Using word2vec word embeddings as input, we compare the benchmark results with deep learning techniques and use two training data sets, all data (14% with depression symptoms, 86% no symptom), and a balanced data set, (50% with depression symptoms, 50% no symptom). Our output is a binary classifier, “depression symptom” and “no symptom.” We use the hold-out method for the three runs and select the validation accuracy value of the epoch run with the lowest validation loss. Table 4 shows the summarized results for all models, with the highest accuracy and F1 scores in bold.
For this classification task, the final model is the LTSM with dropout with all data, since it has the highest F1-score of 0.90, maximizing precision (number of identified depression cases actually correct) and recall (number of depression symptoms correctly identified).
The LSTM with dropout has the most consistent results and also has the highest accuracy (all data—0.91, balanced data—0.85) and F1-score (all data—0.90, balanced data—0.83) in all three runs of the experiment. From all the models, the CNN has the most fluctuating results. LSTM with dropout has also improved the F1-score of the benchmark model Random Forest by 8.4% for all the data and 9.2% for the balanced data.
3.1.2 Stage 2: multi-class classifier (6 labels)
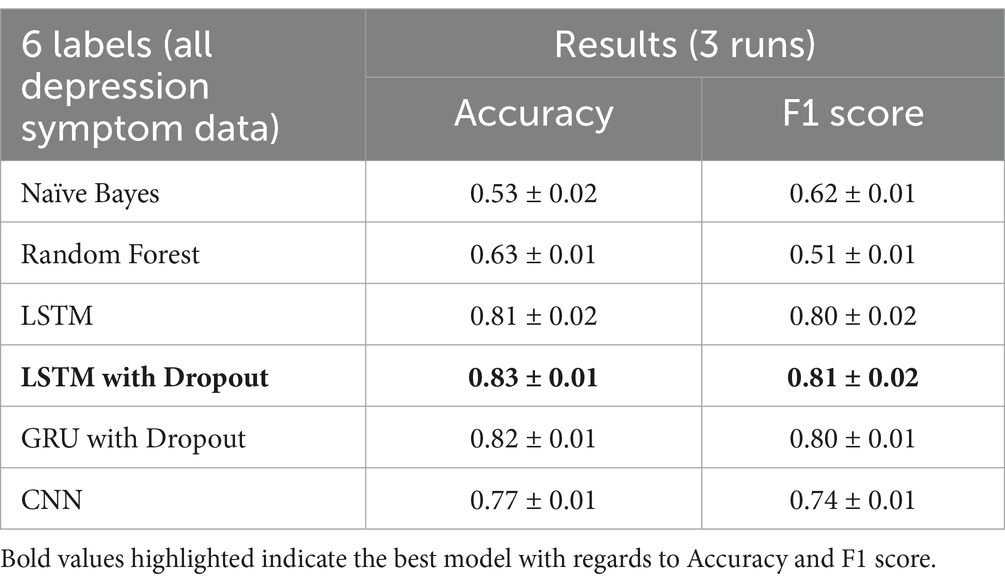
Our next multi-class classifier serves as the secondary classifier to our initial binary classifier. If the initial binary classifier output is a depression symptom, then this classifier outputs the depression category out of the 6 labeled group categories. Thus, we use only one training data set for this task (100% depression symptoms). We use the hold-out method for the three runs and select the validation accuracy value of the epoch run with the lowest validation loss. Table 5 shows the results for all models during the three runs.
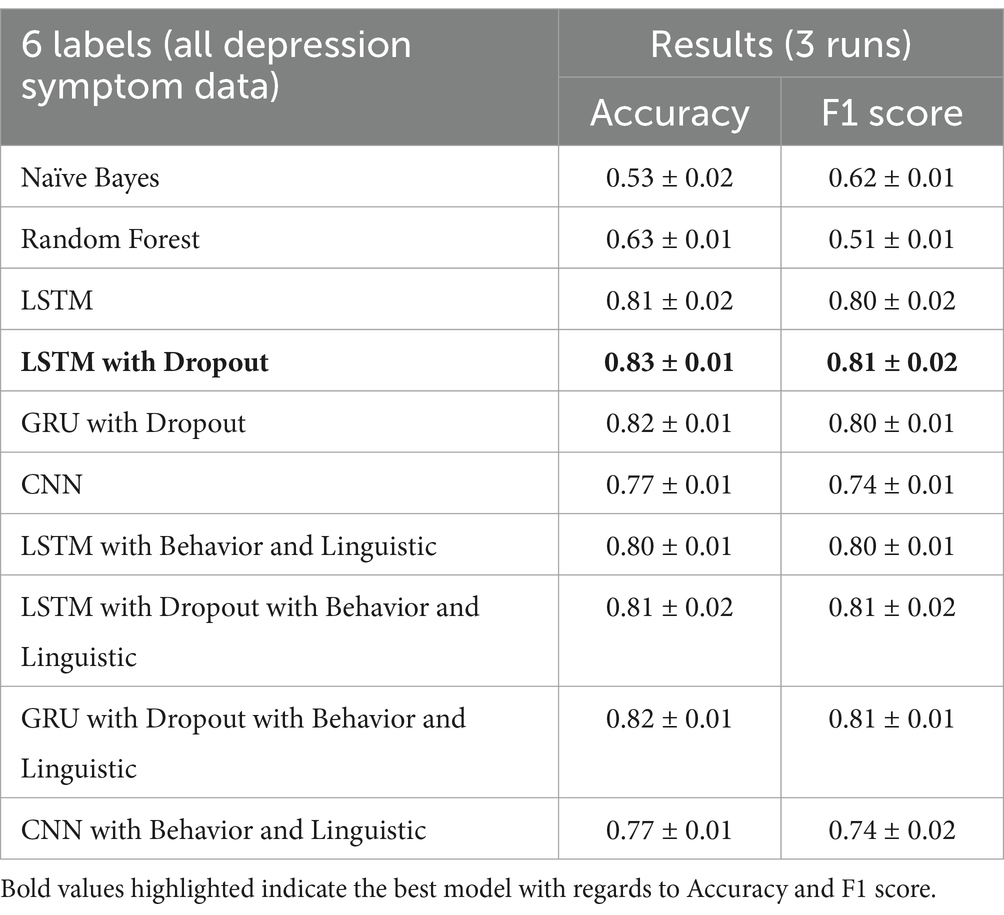
The LSTM with dropout again has the most consistent results and also has the highest accuracy at 0.83 and F1-score at 0.81. Random Forest performed poorly for this classification task, with only 0.51 of F1-score, which is understandable since there are 6 output labels in this task. LSTM with dropout has improved the F1-score of the Random Forest by 58.8%.
3.2 Batch 2: word embedding, behavior, and linguistic features
3.2.1 Stage 1: binary classifier
The LSTM with Dropout with behavior and linguistic features has improved the accuracy of LSTM with Dropout on some runs. As shown in Table 6, there is not much of an improvement since the average accuracy is still at 0.91 and F1-score at 0.90. For this classification task, the final model is the LTSM with dropout with all data since it produces more consistent results and the word embedding features attribute to most of the performance of the model.
3.2.2 Stage 2: multi-class classifier (6 labels)
Running the models on the stage 2 multi-class classifier (all depression symptom data) give the same result in stage 1, in which adding behavior and linguistic features slightly improve the performance on some runs. The average of all the runs show that the LSTM with Dropout still outperforms the LSTM with Dropout with behavior and linguistic features included as shown in Table 7.
3.3 Final model
From the previous model results, we now choose the final model with the best F1 score, which maximizes the precision (number of identified depression cases actually correct) and recall (number of depression symptoms correctly identified). The final model is a two-stage classifier, an LSTM with Dropout binary classifier and an LSTM with Dropout multi-class classifier with 6 labels using all data. Batch 1 (Word embedding features) model is chosen since the behavior and linguistic features did not significantly improve the performance of the model. Table 8 shows the final label outputs of the two-stage detection model.
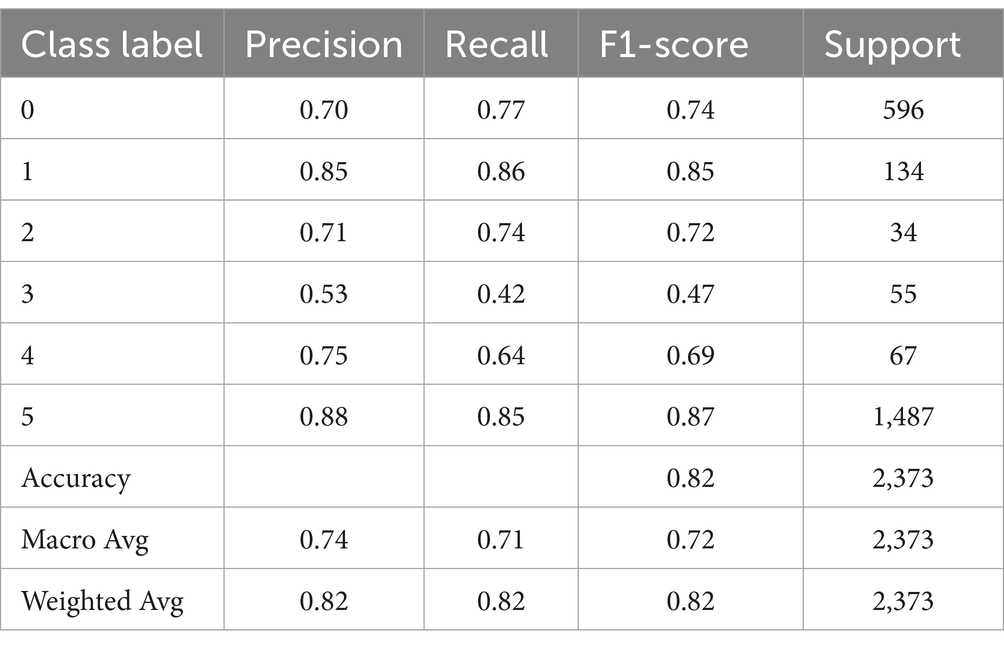
The binary classifier has 209 maximum tokens while the multi-classifier has 96 due to training data differences. The training data for the multi-classifier were all “depression symptoms” and the maximum number of tokens for the tweets under this category is 96.
Table 9 shows the precision and recall of each predicted class. It shows that class labels with the highest F1-scores are 5 (Emotion Symptoms), 1 (Physical: appetite), and 0 Mind and Sleep Symptoms with 0.87, 0.85, and 0.74 F1-scores, respectively. The multi-class classifier model can identify these symptoms (emotions, appetite, thinking, sleep, and movement) with more accuracy than other symptoms like 2 (Substance use), 4 (Physical: pains) and 3 (PHQ-9-suicidal tendencies) with F1-scores 0.72, 0.69, and 0.47, respectively. It is important to note that these three symptom categories are also the lowest in prevalence in our data set, as the tweets for these symptoms add up to only 780 tweets in total out of 11,865 tweets labeled with depression symptoms.
The final implementation design with our Depression Symptom Detection Model using these classifier results which have been discussed in this section accepts a text input and prediction outputs are resulted firstly by the stage 1 binary classifier model, and then the second stage multi-class classifier model.
4 Discussion
4.1 Two-stage depression symptom detection model
The depression symptom detection model developed in this study can help improve the accuracy of symptom tracking, with two stages of detection (detection of symptom and detection of symptom category). The first stage with binary output classifier can detect tweets with “Depression Symptom” or “No Symptom” categories with an accuracy of 0.91 and F1-score of 0.90. The second stage classifier has 6 depression symptom categories (Mind and Sleep, Appetite, Substance use, Suicidal tendencies, Pain, and Emotion symptoms) that has an accuracy of 0.83 and F1-score of 0.81.
This depression symptom detection model created can be used during clinical interviews to track depression symptoms in text data. Since it can identify symptoms with 0.91 accuracy, it is an efficient and accurate way to identify symptoms in daily living activity through Twitter historical timelines. This can help address the factors causing depressed individuals to be undiagnosed and underreported, since it can help mental health experts during their initial screening method in diagnosing depression.
In comparison to similar studies with the same classifier output of tweet or comment level detection, the result of this study is almost at par with the detection accuracy of Cornn’s study with data at an estimated ~300,000 comments (0.925 Accuracy) compared to our lesser data of 86,163 tweets and at 0.91 accuracy. While Cornn’s final model used CNN model without word embeddings, our model used word embeddings with LSTM with Dropout.
Moreover, to the best of our knowledge, no other studies have developed a model which outputs symptom categories similar to our second stage classifier of 6 depression symptom categories, which can provide a more granular approach to studying depression symptoms. Detecting depression on tweet-level symptom categories can show the emergence of symptoms in social media language over time, which can show experts the user’s mental state through daily activities (Park et al., 2013).
4.2 Model limitations
The final symptom detection model limitations rely on the language model used for word embeddings and the training data set used for the model building. By using the 86,163 tweets for the training data set, we were able to get 0.91 accuracy on the binary classifier and 0.83 on the multi-class classifier. These results can be improved with more training data, but these results are acceptable for establishing a benchmark multi-class classifier depression symptom detection model in Filipino and English in social media, which is the first of its kind as of writing.
A limitation of the model includes some misclassifications mostly attributed by frequent word association. Certain words that are associated with most of the depression symptoms in the training data tend to strongly weigh into the predictions to be classified as depression symptoms. Examples are “No Symptom” misclassified as “Depression Symptom” due to strong influence of words like “tinamad” (“lazy”), “sakit ulo” (“headache”), and “hate.” Misclassifications are also seen due to negation cases not sufficiently captured by the model. It also does not help that most symptoms of depression are on extreme ends or opposites of each other, like sleeping too much or not sleeping at all, eating too much or not eating at all, etc. For example, texts “I am angry” and “I am not angry” are both classified as Depression Symptom (Social—Anger issues).
Some potential issues from data set generation might contribute to bias in the data set. Restricting Filipino and English in the inclusion criteria of Tweets also restricts the geographic location of Twitter users, since most Filipino language speakers are from the Luzon region of the Philippines. Due to this, participants mostly come from the regions of Luzon, some from Visayas, and none from Mindanao. Tweets from users with excluded non-Filipino and English tweets may or may not denote depression symptoms. Ilokano, Cebuano, Bisaya, Korean, and Japanese, to name a few are excluded. Part of the data generation step, the manual annotation task, is also prone to human biases and errors. Personal upbringing, opinions, or culture of the annotators versus the tweets they are annotating are example biases.
Depression symptoms also vary in manifestation and intensity, and not all depression symptom classes are easily translated or recognizable through language use. For example, physical symptoms of movement and restlessness are hard to put into writing. Motivation and mood related symptoms also contribute to inactivity, and will not be recorded at all through language. Due to this, small sample of symptoms relating to low mood or activity are seen in the data set.
Lastly, when it comes to model interpretability, deep learning methods are “black-box” solutions since it is difficult to explain or interpret how the model’s predictions are concluded. Most of these limitations can be addressed by collecting more data, or including more languages, which are both possible as the methodologies applied in both data set generation and model generation can be reproduced and further improved.
5 Conclusion
Solutions that can identify depression patterns from daily living activity that does not hinder with depression symptoms and can help with initial screening methods are needed. This study aimed to help in the area of depression screening with the focus of detecting depression symptoms through language use in social media in the Philippine setting. The proposed process included interdisciplinary methods between psychology and data science methods, implementing depression symptom categorization with the help of psychologists and exploration of the significance of social media behavior features and linguistic features. The final detection model created is a two-stage output with binary and multi-class depression outputs, using word embeddings of text as inputs. The final detection models use Bidirectional Long-Short term Memory with dropout neural networks, the first stage with binary output classifier can detect tweets with “Depression Symptom” or “No Symptom” categories with an accuracy of 0.91 and F1-score of 0.90. The second stage classifier has 6 depression symptom categories that has an accuracy of 0.83 and F1-score of 0.81. The model can accept any text input with a maximum of 209 words per input, and can predict depression symptom categories (“Depression Symptom” or “No Symptom”) and multi-class categories (Mind and Sleep, Appetite, Substance use, Suicidal tendencies, Pain, and Emotion symptoms). In this study, the Twitter behavior and linguistic features in text are not significant in improving the accuracy of the depression symptom detection in tweets.
5.1 Areas for future studies
For future research, four directions can be explored. (i) First is the comparison of the detection symptom model results versus the results of PHQ-9 screening and mental health assessment data (data set 1 from previous study; Tumaliuan et al., 2024). This can validate if the detection symptom model can capture actual depression symptoms from clinical interviews and screening questionnaires, or in what percentage these symptoms actually occur or manifest for users in their social media language. From this, it can also be determined if depression symptoms identified are significant in identifying depressed individuals in a user-level depression detection. (ii) Second is the exploration of these depression symptoms detected in a time series study of the occurrence of the symptoms versus the clinical results. (iii) Another direction is the implementation and validation of the detection symptom model in clinical interviews for future research. (iv) Lastly, the integration of the detection model with well-being intervention tools like mobile applications.
Data availability statement
Research data outputs, and code can be shared (including processed data sets and supporting data for the outputs). Please contact the corresponding author to request access.
Ethics statement
The authors confirm that the social media data was accessed and analysed in accordance with the platform's terms of use and all relevant institutional/national regulations.
Author contributions
FT: Conceptualization, Data curation, Formal analysis, Investigation, Methodology, Visualization, Writing – original draft. LG: Conceptualization, Funding acquisition, Methodology, Project administration, Resources, Supervision, Writing – review & editing. EJ: Conceptualization, Funding acquisition, Investigation, Methodology, Project administration, Resources, Supervision, Validation, Writing – review & editing.
Funding
The author(s) declare that financial support was received for the research, authorship, and/or publication of this article. This work was funded by the University of the Philippines (UP) System Emerging Inter-Disciplinary Research Program (OVPAA-EIDR-C09-07).
Acknowledgments
The authors are grateful to all participants for their interest and contribution, who believe this research will open doors to mental health research opportunities in the country. Furthermore, the authors would like to thank reviewers for their support and influence in shaping our methods and results, and #MentalHealthPH and other clinics and organizations for helping us in our participant recruitments.
Conflict of interest
The authors declare that the research was conducted in the absence of any commercial or financial relationships that could be construed as a potential conflict of interest.
Publisher’s note
All claims expressed in this article are solely those of the authors and do not necessarily represent those of their affiliated organizations, or those of the publisher, the editors and the reviewers. Any product that may be evaluated in this article, or claim that may be made by its manufacturer, is not guaranteed or endorsed by the publisher.
Supplementary material
The Supplementary material for this article can be found online at: https://www.frontiersin.org/articles/10.3389/fcomp.2024.1399395/full#supplementary-material
References
Adarsh, V., Arun Kumar, P., Lavanya, V., and Gangadharan, G. (2023). Fair and explainable depression detection in social media. Inf. Process. Manag. 60:103168. doi: 10.1016/j.ipm.2022.103168
Aliman, G., Nivera, T., Olazo, J., Ramos, D., Sanchez, C., Amado, T., et al. (2022). Sentiment analysis using logistic regression. J. Comp. Innov. Eng. Appl. 7, 35–40.
American Psychiatric Association (2013). Diagnostic and statistical manual of mental disorders. 5th Edn. Arlington: American Psychiatric Association.
Beck, A., and Steer, R. (1993). Beck depression inventory: Manual. San Antonio: The Psychological Corporation. Hartcourt Brace & Company.
Berger, M., Wagner, T., and Baker, L. (2005). Internet use and stigmatized illness. Soc. Sci. Med. 61, 1821–1827. doi: 10.1016/j.socscimed.2005.03.025
Bitsch, J., Ramos, R., Ix, T., Ferrer-Cheng, P., and Wehrle, K. (2015). Psychologist in a pocket: towards depression screening on Mobile phones. Stud. Health Technol. Inform. 211, 153–159. doi: 10.3233/978-1-61499-516-6-153
Blei, D., Ng, A., and Jordan, M. (2003). Latent Dirichlet allocation. J. Mach. Learn. Res. 3, 993–1022. doi: 10.5555/944919.944937
Bradley, M., and Lang, P. J. (1999). Affective norms for English words (ANEW): instruction manual and affective ratings. The center for research in psychophysiology. University of Florida 30, 25–36.
Cornn, J. (2019). Identifying depression on social media. [Online]. Available at: https://web.stanford.edu/ (Accessed November 22, 2024).
De Choudhury, M, and Gamon, M. (2013). “Predicting depression via social media.” in Proc. Seventh Int. AAAI Conf. Weblogs Soc. Media.
Devlin, J., Chang, M.-W., Lee, K., and Toutanova, K. (2019). BERT: pre-training of deep bidirectional transformers for language understanding. arXiv. doi: 10.48550/arXiv.1810.04805
DiSantostefano, J. (2009). International classification of diseases 10th revision (ICD-10). J. Nurse Pract. 5, 56–57. ISSN 1555-4155. doi: 10.1016/j.nurpra.2008.09.020
Francisco, K. (2017). Rappler. [Online]. Available at: https://www.rappler.com/newsbreak/iq/184754-philippines-mental-health-care (Accessed September 7, 2024).
Goldberg, I. (1993). Questions and answers about depression and its treatment: A consultative with a leading psychiatrist. Charless: Press publishers.
Gowen, K., Deschaine, M., Gruttadara, D., and Markey, D. (2012). Young adults with mental health conditions and social networking websites: seeking tools to build community. Psychiatr. Rehabil. J. 35, 245–250. doi: 10.2975/35.3.2012.245.250
Halfin, A. (2007). Depression: the benefits of early and appropriate treatment. Am. J. Managed Care 13:S92.
Harvard Health Publications (2020). Understanding Depression. A Harvard Medical School Special Health Report. [Online]. Available at: http://hrccatalog.hrrh.on.ca/InmagicGenie/DocumentFolder/understanding%20depression.pdf (Accessed July 28, 2024).
Kabir, M., Ahmed, T., Hasan, B., Laskar, T., Joarder, T., Mahmud, H., et al. (2022). DEPTWEET: a typology for social media texts to detect depression severities. Comput. Hum. Behav. 139:107503. doi: 10.1016/j.chb.2022.107503
Katchapakirin, K, Wongpatikaseree, K, Yomabootand, P, and Kaewpitakkun, Y. (2018). “Facebook social Media for Depression Detection in the Thai community.” in 15th International Joint Conference on Computer Science and Software Engineering (JCSSE). pp. 1–6.
Kemp, S. (2024). DIGITAL 2024: THE PHILIPPINES. 21 Feb 2024. [Online]. Available at: https://datareportal.com/reports/digital-2024-philippines (Accessed September 7, 2024).
Kerr, L., and Kerr, L. (2001). Screening tools for depression in primary care: the effects of culture, gender, and somatic symptoms on the detection of depression. West. J. Med. 175:349. doi: 10.1136/ewjm.175.5.349
Kroenke, K., Spitzer, R. L., and Williams, J. B. (2001). The PHQ-9: validity of a brief depression severity measure. J. Gen. Intern. Med. 16, 606–613. doi: 10.1046/j.1525-1497.2001.016009606.x
Lerner, D., Adler, D., Chang, H., Lapitsky, L., Hood, M., Perissinotto, C., et al. (2004). Unemployment, job retention, and productivity loss among employees with depression. Psychiatr. Serv. 55:1371. doi: 10.1176/appi.ps.55.12.1371
Li, Z., An, Z., Cheng, W., Zhou, J., Zheng, F., and Hu, B. (2023). MHA: a multimodal hierarchical attention model for depression detection in social media. Health Inform. Sci. Syst. 11:6. doi: 10.1007/s13755-022-00197-5
Losada, D., Crestani, F., and Parapar, J. (2017). eRISK 2017: CLEF lab on early risk prediction on the internet: experimental foundations : CLEF. 346–360.
Losada, D., Crestani, F., and Parapar, J. (2020). Overview of eRisk 2020 early risk prediction on the internet. Lect. Notes Comput. Sci 12260:pp. doi: 10.1007/978-3-030-58219-7_20
Martinez, A., Co, M., Lau, J., and Brown, J. (2020). Filipino help-seeking for mental health problems and associated barriers and facilitators: a systematic review. Soc. Psychiatry Psychiatr. Epidemiol. 55, 1397–1413. doi: 10.1007/s00127-020-01937-2
Mikolov, T, Sutskever, I, Chen, K, Corrado, G, and Dean, J. (2013). “Distributed representations of words and phrases and their compositionality.” in 26th International Conference on Neural Information Processing Systems. Red Hook, NY, USA.
Nartia, E, Paragas, J, and Pascual, N. (2021). “Detection of students’ mental health status: a decision support system.” in 3rd international conference on research and academic community services (ICRACOS). Surabaya, Indonesia. pp. 160–165.
Naslund, J., Grande, S., Aschbrenner, K., and Elwyn, G. (2014). Naturally occurring peer support through social media: the experiences of individuals with severe mental illness using YouTube. PLoS One 9:e110171. doi: 10.1371/journal.pone.0110171
National Institute of Mental Health (2007). Depression (Full Book). U.S. Department of Health & Human Services, National Institutes of Health, National Institute of Mental Health. Bethesda. MD: NIH Publication No, 07–3561.
Parapar, J, Martín-Rodilla, P, Losada, D, and Crestani, F. (2022). Overview of eRisk at CLEF 2022: early risk prediction on the internet (extended overview). CEUR Workshop Proceedings (CEUR-WS.org).
Park, M, McDonald, D, and Cha, M. (2013). “Perception differences between the depressed and non-depressed users in twitter.” in Proceedings of the International Conference on Weblogs and Social Media.
Pennebaker, J., Booth, R., Boyd, R., and Francis, M. (2015). Linguistic inquiry and word count: LIWC. Austin, TX: Pennebaker Conglomerates.
Pennington, J., Socher, R., and Manning, C. (2014). Glove: global vectors for word representation. EMNLP 14, 1532–1543. doi: 10.3115/v1/D14-1162
Philstar Global (2021). Pandemic year sees 57% rise in suicide rate in Philippines. 6 Jul 2021. [Online]. Available at: https://www.philstar.com/headlines/2021/07/06/2110596/pandemic-year-sees-57-rise-suicide-rate-philippines (Accessed July 28, 2024).
Puyat, J., Gastardo-Conaco, M., Natividad, J., and Banal, M. (2021). Depressive symptoms among young adults in the Philippines: results from a nationwide cross-sectional survey. J. Affect. Disord. Rep. 3:100073. doi: 10.1016/j.jadr.2020.100073
Pyszczynski, T., and Greenberg, J. (1987). Self-regulatory perseveration and the depressive self-focusing style: a self-awareness theory of reactive depression. Psychol. Bull. 102, 122–138. doi: 10.1037/0033-2909.102.1.122
Ramirez-Esparza, N., Chung, C., Kacewic, E., and Pennebaker, J. (2021). The psychology of word use in depression forums in English and in Spanish: testing two text analytic approaches. Proc. Int. AAAI Conf. Web Soc. Media 2, 102–108. doi: 10.1609/icwsm.v2i1.18623
Rosa, R., Schwartz, G., Ruggiero, W., and Rodríguez, D. (2019). A knowledge-based recommendation system that includes sentiment analysis and deep learning. IEEE Trans. Industr. Inform. 15, 2124–2135. doi: 10.1109/TII.2018.2867174
Shen, G, Jia, J, Nie, L, Feng, F, Zhang, C, Hu, T, et al. (2017). “Depression detection via harvesting social media: a multimodal dictionary learning solution ” in Proceedings of the twenty-sixth international joint conference on artificial intelligence. AAAI Press
Shen, T, Jia, J, Shen, G, Feng, F, He, X, Luan, H, et al. (2018). “Cross-domain depression detection via harvesting social media.” in Proceedings of the Twenty-Seventh International Joint Conference on Artificial Intelligence.
Tolentino, U. (2004). The state of mental health in the Philippines. Int. Psychiatry 1, 8–11. doi: 10.1192/S1749367600006950
Tsugawa, S, Kikuchi, Y, Kishino, F, Nakajima, K, Itoh, Y, and Ohsaki, H. (2015). “Recognizing depression from twitter activity.” in Proceedings of the 33rd Annual ACM Conference on Human Factors in Computing Systems.
Tumaliuan, F., Grepo, L., and Jalao, E. (2024). Development of depression data sets and a language model for depression detection: mixed methods study. JMIR Data 5:e53365. doi: 10.2196/53365
Wang, Y., Wang, Z., Li, C., Zhang, Y., and Wang, H. (2022). Online social network individual depression detection using a multitask heterogenous modality fusion approach. Inf. Sci. 609, 727–749. doi: 10.1016/j.ins.2022.07.109
Wang, X., Zhang, C., Ji, Y., Sun, L., Wu, L., and Bao, Z. (2013). A depression detection model based on sentiment analysis in Micro-blog social network. PAKDD Workshops 7867, 201–213. doi: 10.1007/978-3-642-40319-4_18
World Health Organization (2017). Depression and Other Common Mental Disorders: Global Health Estimates. Available at: https://www.who.int/publications/i/item/depression-global-health-estimates (Accessed July 28, 2024).
World Health Organization (2021). Mental health atlas 2020. [Online]. Available at: https://apps.who.int/iris/handle/10665/345946 (Accessed March 21, 2024).
Keywords: depression detection, social media, natural language processing, neural networks, Filipino
Citation: Tumaliuan FB, Grepo L and Jalao ER (2024) Development of a two-stage depression symptom detection model: application of neural networks to twitter data. Front. Comput. Sci. 6:1399395. doi: 10.3389/fcomp.2024.1399395
Edited by:
Hyewon Jeong, Massachusetts Institute of Technology, United StatesCopyright © 2024 Tumaliuan, Grepo and Jalao. This is an open-access article distributed under the terms of the Creative Commons Attribution License (CC BY). The use, distribution or reproduction in other forums is permitted, provided the original author(s) and the copyright owner(s) are credited and that the original publication in this journal is cited, in accordance with accepted academic practice. No use, distribution or reproduction is permitted which does not comply with these terms.
*Correspondence: Faye Beatriz Tumaliuan, ZmF5ZXR1bWFsaXVhbkBnbWFpbC5jb20=
†ORCID: Faye Beatriz Tumaliuan, orcid.org/0009-0005-3440-8738
Lorelie Grepo, orcid.org/0000-0001-9709-301X
Eugene Rex Jalao, orcid.org/0000-0001-9539-3262
 Faye Beatriz Tumaliuan
 Lorelie Grepo
 Eugene Rex Jalao