- 1Department of Computer Science, University of Virginia, Charlottesville, VA, United States
- 2STR, Vision and Image Understanding Group, Woburn, MA, United States
- 3Geometric Data Analytics, Inc., Durham, NC, United States
- 4Math, Stats, and CS Department, University of Wisconsin-Stout, Menomonie, WI, United States
- 5Department of Mathematics, Duke University, Durham, NC, United States
- 6Department of Electrical and Computer Engineering, University of Virginia, Charlottesville, VA, United States
Many deep generative models, such as variational autoencoders (VAEs) and generative adversarial networks (GANs), learn an immersion mapping from a standard normal distribution in a low-dimensional latent space into a higher-dimensional data space. As such, these mappings are only capable of producing simple data topologies, i.e., those equivalent to an immersion of Euclidean space. In this work, we demonstrate the limitations of such latent space generative models when trained on data distributions with non-trivial topologies. We do this by training these models on synthetic image datasets with known topologies (spheres, torii, etc.). We then show how this results in failures of both data generation as well as data interpolation. Next, we compare this behavior to two classes of deep generative models that in principle allow for more complex data topologies. First, we look at chart autoencoders (CAEs), which construct a smooth data manifold from multiple latent space chart mappings. Second, we explore score-based models, e.g., denoising diffusion probabilistic models, which estimate gradients of the data distribution without resorting to an explicit mapping to a latent space. Our results show that these models do demonstrate improved ability over latent space models in modeling data distributions with complex topologies, however, challenges still remain.
1 Introduction
Recent advances in deep generative models (DGMs) have resulted in the unprecedented ability of these models to produce realistic data, including imagery, text, and audio. While qualitative evaluation of generated data makes it clear that DGMs are improving at a rapid pace, quantifying how well a model produces samples similar to the original data distribution on which it was trained is a challenging task and an area of active research. Inherent to this problem is that generative models are fundamentally meant to produce data that would be judged to be realistic to a human observer, and quantifying human perception—of images, language, or audio—is a difficult task.
A common approach to evaluating a generative model is to compute an empirical distributional distance between a sample from the data distribution and a sample generated by the model. For example, in computer vision, the Fréchet inception distance (FID) (Heusel et al., 2017) is a popular choice for such a distance metric. The FID approximates both the data distribution and the generated image distribution as multivariate normal distributions on the outputs of an Inception v3 model trained on ImageNet. The Fréchet distance between the resulting multivariate normal distributions is then computable in closed-form. More recently, precision and recall (Sajjadi et al., 2018) were proposed to separately evaluate how close generated samples are to the data distribution (precision) and how well they cover the data distribution (recall).
The manifold hypothesis of machine learning informally states that data distributions naturally lie near lower-dimensional manifolds embedded in the higher-dimensional Euclidean space formed by their raw representations. One class of DGMs, including variational autoencoders (VAEs) (Kingma and Welling, 2014) and generative adversarial networks (GANs) (Goodfellow et al., 2014), attempt to model the data manifold explicitly. They do this by generating data by mapping points from a prior distribution in a lower-dimensional latent space into the data representation space. This has led researchers to investigate the manifold properties of such DGMs and use manifold methods to evaluate their quality. Shao et al. (2018) develop algorithms for computing geodesic curves and parallel translation of VAEs. They observed that while VAEs were able to capture the curvature of synthetic data manifolds when trained on real image data, the manifolds generated by VAEs were nearly flat. Arvanitidis et al. (2018) propose that deterministic generators lead to a distortion of the data manifold in the latent space that fails to capture the intrinsic curvature of the data. They propose a stochastic Riemannian metric to correct for this and show that this results in improved variance estimates. Chen et al. (2018) demonstrate that Riemannian geodesics in the latent space of a DGM give better interpolations and visual inspection of generated data. Shukla et al. (2018) show that disentangled dimensions of the latent space of a VAE demonstrate higher curvature.
While these works have investigated the differential and metric geometry of DGMs, less is known about the topological properties of DGMs. Theoretically, models that generate data from a continuous mapping of a Gaussian prior distribution into Euclidean space, such as VAEs and GANs, are not able to faithfully reproduce data with non-trivial topology (e.g., spheres, tori, or other spaces with “holes”). In practice, these models may be able to perform fairly well in approximating non-trivial data topologies by shifting density away from holes. The chart autoencoder (CAE) model by Schonsheck et al. (2019) extends the topological abilities of VAEs/GANs by modeling a manifold topology with multiple overlapping charts. On the other hand, DDPMs and their relatives have no topological constraints in theory. However, the topological abilities of these various DGMs have not been empirically tested or compared. This paper empirically tests the ability of generative models to handle data arising from distributions with underlying topology, and is, to the best of our knowledge, the first systematic study in this direction. There have been papers that use topological techniques, such as Manifold Topology Divergence (Barannikov et al., 2021) or Geometry Score (Khrulkov and Oseledets, 2018), to quantify the quality of data produced by generative models. More broadly, there has been extensive recent work (Hensel et al., 2021) at the interface of TDA and DL/ML. These range from methods (e.g., Chen et al., 2019; Solomon et al., 2021; Nigmetov and Morozov, 2022) that integrate TDA-based loss functions into DL algorithms, to bespoke DNN architectures (Carrière et al., 2020) that incorporate layers that process persistence diagrams, to works (e.g., Naitzat et al., 2020; Wheeler et al., 2021) that use TDA to analyze the structure of data as it moves through DNN layers.
This paper is organized as follows. In Section 2 we review the methods used in this paper, namely, the DGMs and metrics for evaluating their quality, including persistent homology. In Section 3 we present our experiments comparing the ability of three DGMs—VAE, CAE, and DDPM—to learn to generate data with known non-trivial topologies. To do this, we use two synthetic image datasets with a torus and sphere topology, respectively, and a real dataset of conformations of cyclooctane, which is known to have topology equivalent to a Klein bottle intersecting with a 2-sphere (Martin et al., 2010). Note that this test is even more difficult from a topological perspective, as the cyclooctane conformations form a topology that is non-manifold, but rather a more complicated stratified space (in this case, the intersection of two manifolds). Finally, in Section 4 we discuss conclusions from these experiments and future directions.
2 Background and methods
In this section, we first review the three deep generative models (VAEs, CAEs, and DDPM) that we evaluated for their ability to learn data distributions with non-trivial topology. Next, we describe the evaluation metrics used for our study, both related and unrelated to the topological structure.
2.1 Deep generative models
Various structures for deep generative models have been proposed over time. Some of the popular models are normalizing flows (Rezende and Mohamed, 2015), variational autoencoders (Kingma and Welling, 2014), generative adversarial networks (Goodfellow et al., 2014), deep energy-based model (Du and Mordatch, 2019), and the recent denoising diffusion models (Ho et al., 2020). Each type of generator has different variations. Yet, topology is rarely considered in the design. Here we choose three models to discuss.
2.1.1 Variational autoencoders
A variational autoencoder (VAE) is a type of encoder-decoder generative model proposed by Kingma and Welling (2014). Unlike the traditional autoencoder (Hinton and Salakhutdinov, 2006), a VAE models the probability distribution of the latent representation, z, of each data point instead of a deterministic latent representation. A VAE models the marginal log-likelihood of the ith data point, x(i), as Equation 1:
where θ is a vector of the parameters for the generative model, and ϕ is a vector of the parameters for the variational approximation. The objective is to maximize the evidence lower bound (ELBO), which is derived to be Equation 2:
Usually the prior pθ(z) is set to be an isotropic Gaussian, . The encoder also models the as a Gaussian distribution . Therefore, the first term is easy to compute with predicted mean and variance of . On the other hand, the equation for the second term of the lower bound depends on what probability distribution we assume in the data space. For example, using an isotropic Gaussian distribution leads to the mean squared error loss, and using a Bernoulli distribution corresponds to minimizing the binary cross entropy loss.
As discussed above, VAEs usually assume a Gaussian distribution in the latent space. Although this might be a reasonable assumption for many data with trivial topology, it might cause problems when this is not the case. Even in a simple case where the data has an S1 topology which is a loop, the neural network could struggle to learn a mapping from two different topological spaces. Although one might argue the Gaussian can be deformed enough so that it resembles a loop in practice, we still need experiments to investigate this issue. Similarly, generative adversarial networks (Goodfellow et al., 2014) also use a Gaussian prior distribution in the latent space, and therefore might as well have problems learning data with non-trivial topology.
2.1.2 Chart autoencoders
In many applications of the VAE, its learned latent space is often treated as a linear space. For instance, generating interpolations between two points of a given dataset is often performed by generating the linear path between the embeddings of these points in latent space. This operation implicitly assumes that the geodesics between points correspond to linear paths in latent space. Yet, we know there exist manifolds, such as the sphere S2, which are not homeomorphic to a single linear space. It follows that the latent space learned by a VAE trained on such a manifold is not geometrically faithful. That is the latent space either contains a point that decodes to a point off the manifold, or the space cannot capture all geodesic paths. To this end, recent architectures have been introduced to rectify this problem. We consider one such architecture, the chart autoencoder (CAE) (Schonsheck et al., 2019).
Chart autoencoders are a generative model architecture motivated by the concept of an atlas in differential geometry. In comparison to the VAE, we learn a set of k encoders and decoders parameterized by and respectively. Each corresponding encoder and decoder is affiliated with a latent chart, Zi. Thus, the latent space of the CAE is composed of a set of linear latent spaces. The CAE output is determined by a chart prediction network, P. In the original work, P maps x from the input space X to p∈ℝk, where p represents the vector of log probabilities of the chart membership of x. In training, the output of the CAE is taken to be the sum of the outputs from the k decoders weighted by the chart prediction vector, p. During evaluation, the output is taken to be that of the decoder corresponding to the likeliest chart via p. In this work, we update the chart prediction network to map from the direct sum of the latent embeddings, zi, instead of x. This change was made to allow generations from the latent space without reference to any network input. Intuitively, this chart prediction network is analogous to the chart transition function affiliated with a geometric atlas. Indeed, the CAE is capable of transitioning between the outputs of different latent charts when a linear interpolation is performed in latent space.
2.1.3 Denoising diffusion probabilistic models
In contrast to the previous two models, the denoising diffusion probabilistic model (DDPM) proposed by Ho et al. (2020) does not have a low-dimensional latent space. It is based on the diffusion probabilistic model by Sohl-Dickstein et al. (2015), which learns to reverse a diffusion process in which Gaussian noise is gradually added to the original image, x0, for T timesteps until we get a sampled image xT that is nearly pure noise. We call the diffusion process that adds noise the forward process, which is a Markov chain. The reverse process is also defined to be a Markov chain as follows Equation 3:
where βt's define the variance schedule and θ is the parameter vector of the model that learns the reverse process. During training, we can optimize the lower bound of the log-likelihood.
In the DDPM, βt is fixed and therefore the first term of the loss can be ignored. Σθ(xt, t) is also fixed for each time step t. Then DDPM reparameterizes xt with the added noise , and μθ(xt, t) with ϵθ(xt), which means the model is now trained to predict the noise ϵ. Their experiments also show that omitting the different weights dependent on t does not compromise the final performance, which results in the final loss (Equation 4):
with 's being expressions of βt's. It is also worth noting that Song et al. (2021) derived the same model from the view of a score based model, which learns the gradient of the log probability density in the data space.
We can see that the DDPM does not assume any topology on the original data distribution. The sampling only depends on the fact that the diffused data distribution is Gaussian, which is achieved by using a prefixed time variance schedule. Therefore, theoretically, it should be able to learn the data of any topological structure. Yet, this needs to be examined through experiments. Similarly, energy based models (Du and Mordatch, 2019) also do not assume any topology on the data distribution, and during sampling start from Gaussian distribution and then travel to high probability regions of the data space. Thus, we could expect a similar ability in learning distributions of non-trivial topology.
2.2 Quantitative metrics for evaluating DGMs
Given the purpose of DGMs is to generate samples that are as realistic as possible for a human, the straightforward evaluation method would be the judgments by human eyes. However, there have been attempts to quantitatively measure their performances.
2.2.1 Wasserstein distance
We propose to evaluate how well a generative model learns a data probability distribution using a sample approximation to the L2 Wasserstein 2-distance. By definition this should be Equation 5:
where μ and ν are probability measures of the ground truth data and the generative model, respectively, Γ(μ, ν) is the set of any joint distribution of x and y such that ∫γ(x, y)dy = μ(x) and ∫γ(x, y)dx = ν(y). We implement the empirical version as Equation 6:
where X1, X2, …, Xn are random samples from μ, and Y1, Y2, …, Yn from ν, and π is any permutation of 1, 2, …, n. Since the datasets are simulated, we can easily sample from the ground truth data distribution μ. The best π is obtained using the Jonker–Volgenant algorithm (Jonker and Volgenant, 1988) implemented by SciPy (Virtanen et al., 2020).
There are some existing works (e.g., Genevay et al., 2018), that train generative models from the viewpoint of optimal transport, and therefore include the Wasserstein distance in the training loss. However, to the best of our knowledge, we are the first to employ Wasserstein distance to evaluate how well generators learn the overall data distribution. The high time complexity (O(n3)) of the Jonker–Volgenant algorithm forbids us from using too large sample sizes to represent ground truth and learned distributions. Therefore, one concern is whether the set of samples can adequately cover the whole distribution. However, in our experiments, we use data from known low-dimensional distributions that can be reasonably covered with relatively fewer samples.
2.2.2 Fréchet inception distance
Fréchet Inception Distance (FID) is computed by computing the Wasserstein distance on two probability distributions obtained by feeding a set of ground truth examples and a set of fake examples to an embedding function. The embedding function generally used is Inception v3 trained on ImageNet with the final layer truncated, yielding a 2048-dimensional vector for each sample. A normal distribution is fit in this space for each of the ground truth and fake sets, which are then the direct inputs for the Wasserstein distance. While FID has been shown to usually align with human judgement (Heusel et al., 2017), it has a number of shortcomings (Chong and Forsyth, 2020; Parmar et al., 2022). Despite its shortcomings, FID has established itself as the de facto standard metric for judging the quality of generative images (Borji, 2022).
2.2.3 Density, coverage
A line of work has defined metrics that separate failure modes by using multi-valued metrics. For example, a metric might focus on fidelity which captures the degree to which a generated image resembles those in a dataset, whereas another might focus on diversity which captures the degree to which a sample reflects the variation in generative factors that gives rise to a dataset.
The earliest work, Precision and Recall (Sajjadi et al., 2018), introduces two metrics that successfully separate dropping and adding modes (recall) from image quality (precision), but have some shortcomings including not being robust to outliers and requiring more significant tuning to be accurate.
Density and Coverage (Naeem et al., 2020) address these limitations by, still in an embedding space, defining a manifold for a set of ground truth examples and measuring how often generated points land in it. For their reported results, they use the 4,096-dimensional layer of a truncated VGG16 trained on ImageNet as the embedding space. They then form the real manifold as k-nearest neighbor balls for each real point. Density is then a cumulative measure of how many real neighborhood balls the generated points land in, normalized for the number of points. Intuitively, this value is greater than 1 when many generated samples occur in a few real modes and less than 1 when the generated samples are too diverse or don't fall in real modes. The other half of the metric, Coverage, is then the percentage of real neighborhood balls that have a generated point within them. Intuitively, this is 1 when all modes of the original data are covered, and less than 1 otherwise.
2.2.4 Topological data analysis: persistent homology
Here we give some brief intuition about the information carried by the persistent homology of a point cloud. Readers interested in a fuller and more rigorous discussion are pointed to textbooks such as Edelsbrunner and Harer (2010) or Oudot (2017).
Suppose that X = {x1, …, xn} is a point cloud in some Euclidean space. For example, let X be the collection of points on the left of Figure 1. The persistence diagram Dk(X) is a compact summary of some of the k-dimensional multi-scale shape information carried by X. We now give some more details about what this means.
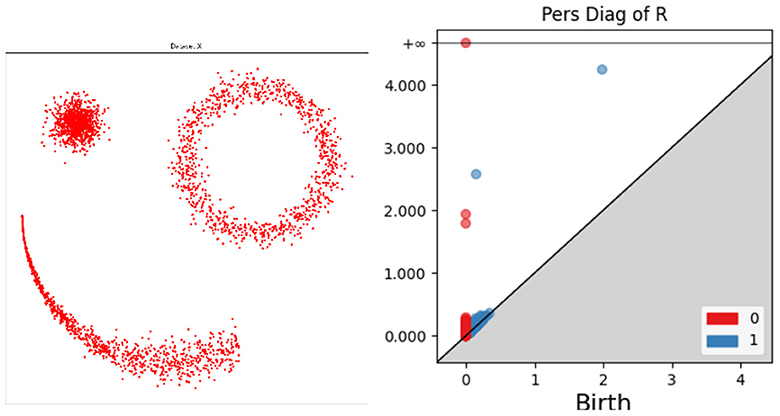
Figure 1. Illustration of persistence diagrams (right) for the Rips homology filtration on a point cloud (left). Persistence is shown in dimensions zero (red) and one (blue).
For each threshold value r≥0, let Note that whenever r<s, we have Xr⊂Xs, and as r moves from 0 to ∞, the union of balls around the points in X grows from the points themselves to the entire Euclidean space. During this process, various shape changes occur. In our working example, as r increases, the number of connected components, which began as |X|, rapidly becomes 3 as clusters form and then subsequently decreases as those clusters merge. The r values at which these mergers happen are recorded as death values and stored in the zero-dimensional persistence diagram D0(X); see the red dots on the right side of Figure 1. The higher-level connectivity of the union of balls also changes as r increases. In our working example, an annulus forms in the upper right of X at a very small value of r, and a ring appears connecting the three clusters at a larger value of r. In technical terms, these features are called one-dimensional homology classes (Edelsbrunner and Harer, 2010) and have rigorous algebraic definitions. The r values at which they first appear are called birth value. Each homology class eventually fills in as r increases; for example, the annulus at the upper right fills in at the apparent radius of the feature. These death values of the one-dimensional features are paired with the birth values that created the feature, and they are plotted in the one-dimensional persistence diagram D1(X); see the blue dots on the right side of Figure 1.
Thus, each persistence diagram Dk(X) consists of a (multi-) set of dots in the plane, with each dot recording the birth and death value of a k-dimensional homological feature. Intuitively 0 and 1 dimensional features represent connected components and loops/holes, respectively. Not shown in this example are two-dimensional features, which represent voids, and still higher-dimensional features. The persistence of a feature is the vertical distance of its dot to the major diagonal y = x in the persistence diagram. Higher-persistence features are generally thought of as genuine representatives of the underlying space, while lower-dimensional features are more likely to be caused by sampling noise. This intuition can be formalized in inference theorems (e.g., Cohen-Steiner et al., 2007; Fasy et al., 2014).
Persistence diagrams of point clouds are computed by transforming the growing union of balls into combinatorial objects called filtered simplicial complexes. Without going into the technical details here, we note that many software packages for doing this exist (Otter et al., 2017 gives a nice overview), and that the experiments in this paper use giotto-tda (Tauzin et al., 2021).
3 Experiments
3.1 Datasets
We conduct experiments on two synthetic image datasets and one real dataset. Samples of each dataset are shown in Figure 2.
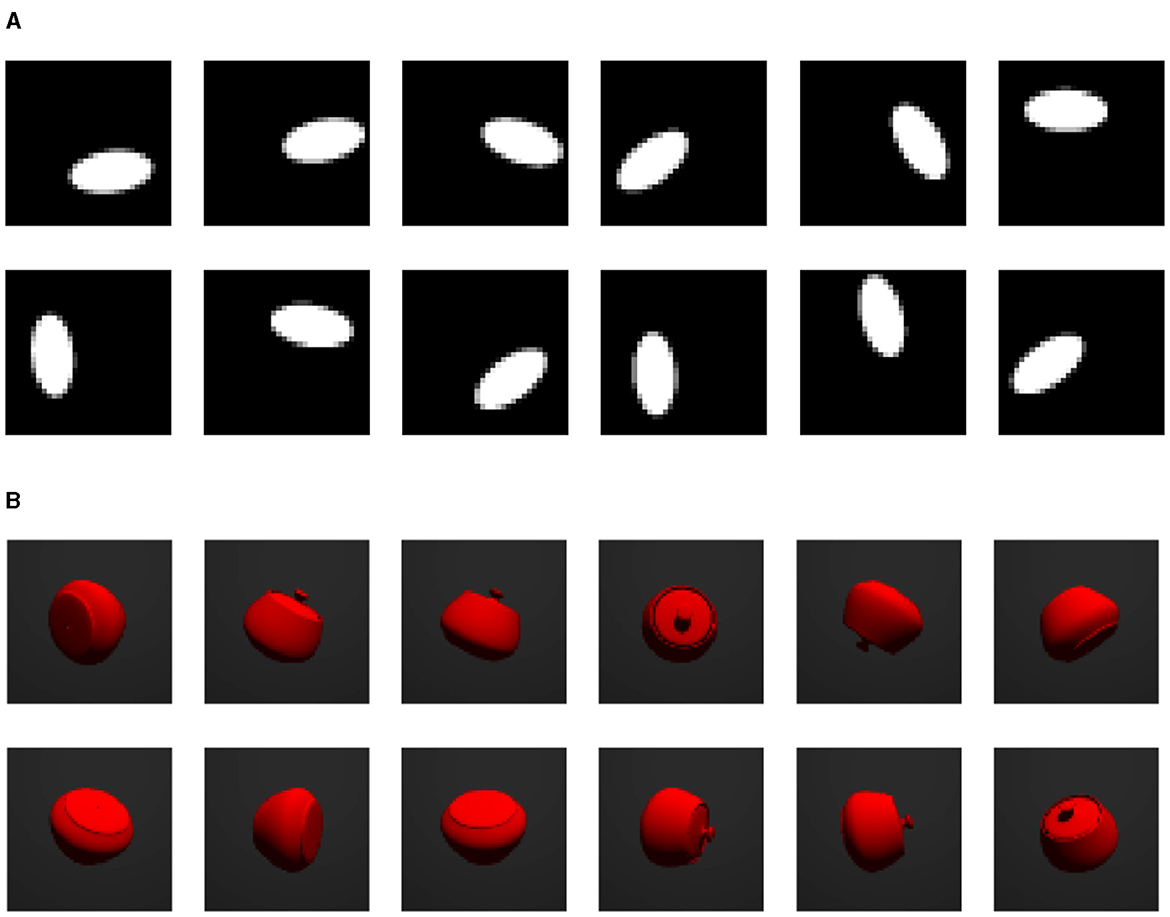
Figure 2. Samples from each dataset. (A) “Torus” ellipse image dataset. (B) Rotating jar image dataset.
The “torus” ellipse image dataset contains 10, 000 grayscale images of white ellipses on black backgrounds. Each image is of size 32 × 32 and contains one ellipse. The images are downsampled from 64 × 64 images so the edges of ellipses are blurred. The ellipse can rotate around itself 0 to π. And because the ellipse is 180−degree rotation symmetric, it renders the topology of S1. The center point position of the ellipse rotates 0 to 2π around the center of the image with a radius of 7 pixels, which independently renders another S1 topology. In combination this results in S1×S1 topology, i.e. a torus topology.
The rotating jar image dataset is generated using POV-Ray by Persistence of Vision Pty. Ltd. (2004). There are 10, 000 RGB colored samples of size 64 × 64. Each image contains one rotating jar in the fixed center position. The object has random three dimensional orientations and it has rotational symmetry with respect to the axis that connects the lid knob and the center point of the bottom. Therefore, the image is defined given the orientation of the lid knob. This indicates that the data has a S2 topology.
The cyclooctane dataset consists of 6, 040 points in ℝ24, corresponding to conformations of the cyclooctane molecule (C8H16) (Martin et al., 2010). A conformation is a configuration of atoms in a molecule up to rotation and translation of the molecule. Physical chemistry constraints for cyclooctane imply the positions of the 16 hydrogen atoms are determined by the positions of the 8 carbon atoms in each conformation (Hendrickson, 1967; Martin et al., 2010). Each point in the dataset consists of the 8 spatial coordinates of the carbon atoms flattened into a single vector, as in [(x1, y1, z1), (x2, y2, z2), …, (x8, y8, z8)] becomes .
3.2 Training setups
Here we introduce our training setups of different generative models. We adopted relatively simple architectures that are capable of generating reasonably good quality samples. VAE and DDPM used for the same dataset are designed to have a similar number of parameters, so that we know the performance difference is not because of different parameter numbers. Training hyper-parameters, including learning rates, epochs, weight values for VAE loss terms, and total time steps for DDPM, are determined using Bayesian search (Falkner et al., 2018) over a set of different options. Therefore, the hyper-parameters for each model are different but they are chosen to maximize the performance. Every model is trained using Adam optimizer (Kingma and Ba, 2015). For more details see Supplementary material.
3.3 Qualitative evaluation
First, we evaluate each generative model qualitatively by observing randomly generated samples and interpolations between two data points.
Samples from generators trained on the “torus” dataset are shown in Figure 3. We can see that DDPM produces high quality samples that are almost indistinguishable from ground truth images by human eyes. The ellipses have clear edges and are always in the same correct shape. In contrast, VAE sometimes generates clearly invalid images. The ellipse shapes are completely lost in some cases. Figure 4 shows samples from DGM trained on the rotating jar. Both VAE and DDPM generally produce credible images. However, we can see that VAE occasionally fails and generates misshapen jars. These results could be due to VAE not learning the correct topology of the dataset and possibly sampling on the “holes” of the torus or the sphere. We will explore this further in the following subsections.
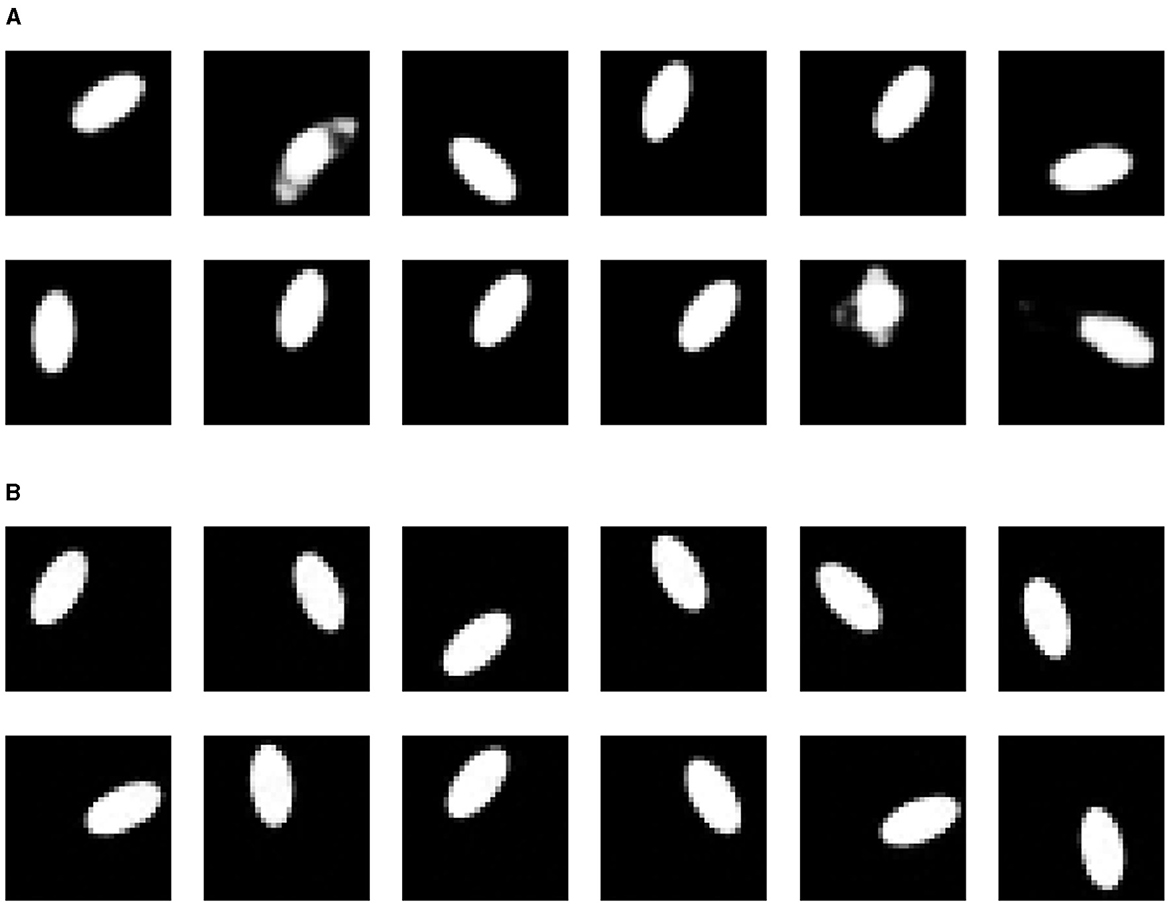
Figure 3. Random samples from different generators on “torus” ellipse image dataset. (A) Variational autoencoder. (B) Denoising diffusion probabilistic model.
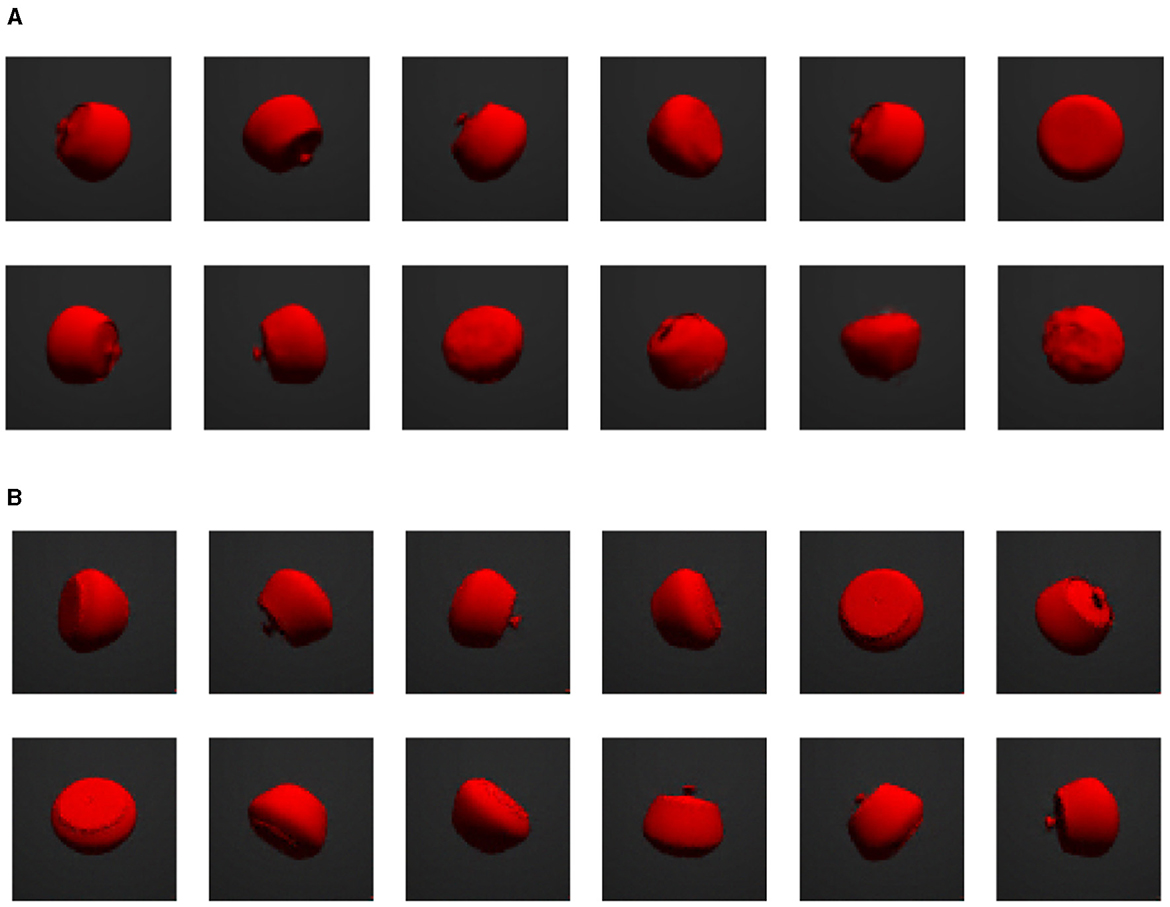
Figure 4. Random samples from different generators on rotating jar image dataset. (A) Variational autoencoder. (B) Denoising diffusion probabilistic model.
We also performed interpolation between two data points using different generators, visualized in Figures 5, 6. For the VAE, we linearly interpolate the latent space, which results in invalid images in the middle (5−th image for the “torus” and 3−rd image for the jar). We assume this happens because when we linearly interpolate between two points, we travel across the void of the latent distribution, where the VAE decoder cannot map to valid data points. For the DDPM, two end images are diffused for several time steps (t = 250 for the “torus” and t = 350 for the jar) and then linearly interpolated. Next, we apply the usual denoising steps until reversing back to t = 0 to get clean images. Due to the stochasticity in both the forward and reverse processes, the endpoints will be different from the original images to a certain degree, depending on the diffusing time steps. We can also see that although the generated images look valid but do not provide a reasonably continuous interpolation. This can be considered as a shortcoming of DDPM not having a latent space.

Figure 5. Interpolations from different generators on “torus” ellipse image dataset. (A) Variational autoencoder. (B) Denoising diffusion probabilistic model.

Figure 6. Interpolations from different generators on rotating jar image dataset. (A) Variational autoencoder. (B) Denoising diffusion probabilistic model.
In Figure 7, we see generated samples of cyclooctane under our different architectures. To visualize the conformations of cyclooctane, we embed the ℝ24 representations in ℝ3 using Isomap. This embedding is locally isometric and has been used in literature such as Martin et al. (2010). The original embedding of the dataset is visible on the left. Notice the geometry of this manifold involves a Klein bottle enveloped by a sphere. We find that the vanilla VAE struggles to generate conformations associated with the Klein bottle. This is not ideal as these conformations are associated with specific conformational states that do not correspond to any points on the outer sphere. Matching our intuition, the CAE is able to better cover the manifold of cyclooctane, where the embedded color represents chart membership. Still, we find the outer shell of the sphere is sparsely covered. Perhaps counterintuitively, the DDPM model visually best samples the data manifold. It is clear that the samples cover both the Klein bottle and the outer sphere with reasonable density.

Figure 7. A comparison of the cyclooctane conformations generated by sampling the various diffusion models. On the left, we display the Isomap embedding of the original cyclooctane data. For the CAE embeddings, the different colors denote the corresponding chart. Notice that the vanilla VAE struggles to generate the inner Klein bottle of the Isomap embedding. Counterintuitively, the DDPM generations most resemble the original data manifold even though its latent space is high dimensional.
3.4 Quantitative performance metrics
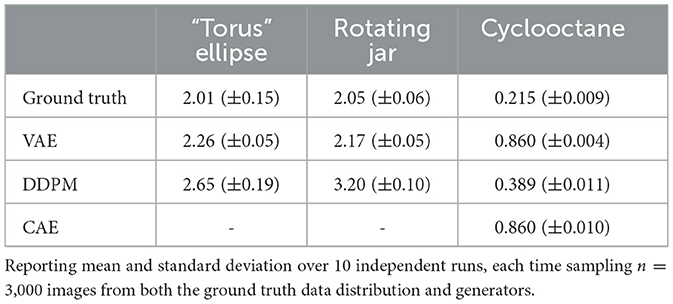
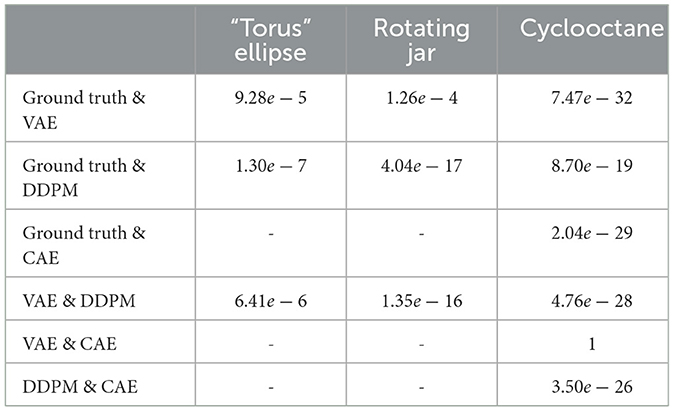
For each of the three datasets and each DGM, we computed the L2 Wasserstein metric between a sample set from the ground truth data distribution and a sample set generated by the DGM models. Because of the computational complexity of the Jonker-Volgenant algorithm, we were limited to computing with sample sizes of 3,000 data in both ground truth and DGM. To ensure that the metric values were stable at the given sample size, we repeated the metric calculation 10 times, each time with an independently drawn sample from both the ground truth and the DGM. For the cyclooctane dataset, since we only have 6,040 samples in the ground truth data, we randomly draw 3,000 samples each time without replacement. Results are shown in Table 1. Since the sample size used to approximate the Wasserstein distance is limited, to rule out the effects of random sampling, we also performed t-tests on Wasserstein distance observations and the resulting p-values are listed in Table 2. It is clear that the Wasserstein distances for different models are significantly different, except for between the VAE and CAE trained on cyclooctane, which have very similar results. We can see that on the image datasets, VAE has a consistently smaller distance to the ground truth data distribution than DDPM, despite what appears to be worse image quality to human eyes. The result is different for the cyclooctane dataset, with DDPM having a significantly smaller distance while CAE has a similar result to VAE. This should indicate in some datasets VAE is learning the overall distribution better than DDPM. It could be the case that in terms of L2 distance, although DDPM samples are more precise, or more close to the ground truth distribution, VAE samples cover the whole data distribution better. And we can also see that the probability based metric alone does not sufficiently represent the real world performance of models.
For the cyclooctane dataset, we calculated the bond lengths of generated samples and compared them to the bond lengths of the true cyclooctane data. Bond lengths for the true data are tightly distributed about the mean value of 1.52 with a standard deviation of 4.09e−05 . Figure 8 shows the distribution of each sample set's bond lengths. We can see that although the sample bond lengths of all the generative models are much more dispersed than the ground truth values, DDPM has a relatively better distribution. The expected errors of each distribution to the mean ground truth value are also calculated. This error is 0.165 for VAE, 0.155 for CAE and 0.04 for DDPM.
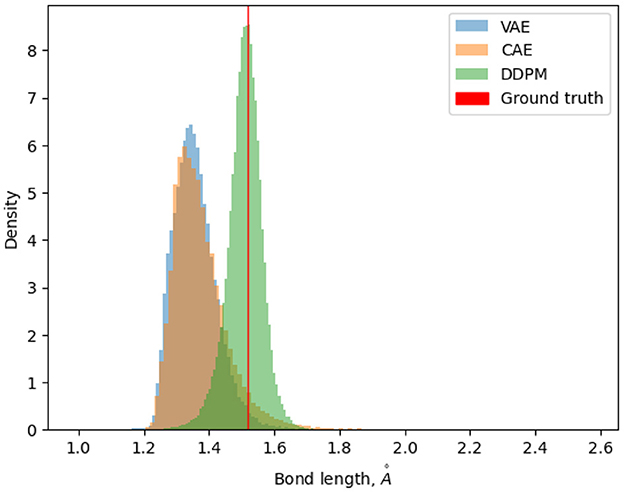
Figure 8. Density histogram of bond lengths of samples generated by different models, compared to the ground truth bond lengths.
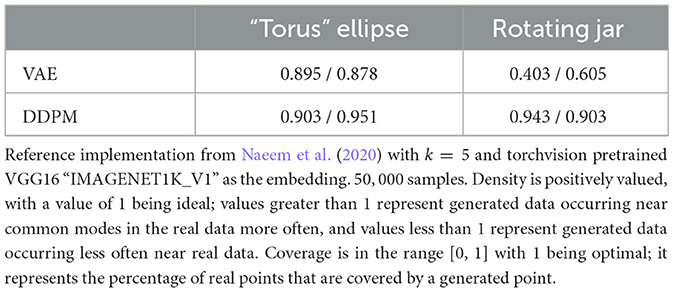
We also computed deep-learning-based metrics - FID, density, and coverage, for our two image datasets. The sample sizes of 50,000 are used for both ground-truth data distribution and the DGM learned distribution. The deep learning model used for embedding is VGG16 “IMAGENET1K_V1”. The FID results are shown in Table 3, and density and coverage results are shown in Table 4. Unlike in the case of Wasserstein distance, DDPM constantly has better metrics values than VAE. This could indicate that the deep learning model used to embed images does capture image features in a way that matches better with human visual experiences. The much larger sample size might also influence the results.
3.5 Topological properties
We also report the persistent homology of ground truth data and samples from generators. Giotto-tda (Tauzin et al., 2021) is used to obtain the results. As introduced in Section 2.2.4, the results show when a topological feature was born and died. Zero-dimensional features are connected components, one-dimensional features are loops, and two-dimensional features are voids (e.g., spheres). The further a point on the persistence diagram is from the diagonal line of “birth = death,” the longer they persist across a range of scales, that is, distance thresholds determining when points are connected. These points that stand out beyond the diagonal are more likely to indicate a topological structure.
As we can see in Figure 9A, the “torus” dataset has two significant one-dimensional loops [approximately (2.5, 8) and (2.5, 13)] and one two-dimensional sphere [approximately (6, 8)] because of its torus topology. The VAE captures this topological structure poorly (Figure 9B), and only significantly captures one one-dimensional loop structure. Although there are many other points relatively far above the diagonal line, there are no points that stand out from the others clearly. On the other hand, DDPM preserves this structure very well (Figure 9C), and we can clearly identify two one-dimensional loops [the points located at approximately (3, 8) and (3.5, 13)] and one two-dimensional sphere [located at approximately (7, 8)].

Figure 9. Persistent homology of ground truth data and generator samples on the “torus” dataset. (A) Ground truth data. (B) Samples from VAE. (C) Samples from DDPM.
This result gives insight into the fact that the VAE sometimes generates invalid samples despite its smaller Wasserstein distance. More intuitively, we show the PCA visualization of the data and the generator samples in Figure 10. We can clearly see that VAE wrongly generates samples in the middle of the torus and violates the original data topology, but DDPM does not. The results for the jar dataset are displayed in Figure 11. As we discussed above, the data has a spherical topology, which is indicated by a significant dimension 2 point in the persistence diagram in Figure 11A [located at approximately (5.5, 7.5)]. This structure is clearly better preserved by DDPM [approximately (5.5, 7.5)]. Whereas in the persistence diagram of the VAE model, the two-dimensional structure is much less significant, and also an incorrect one-dimensional loop appears [located at approximately (3, 5.5)].
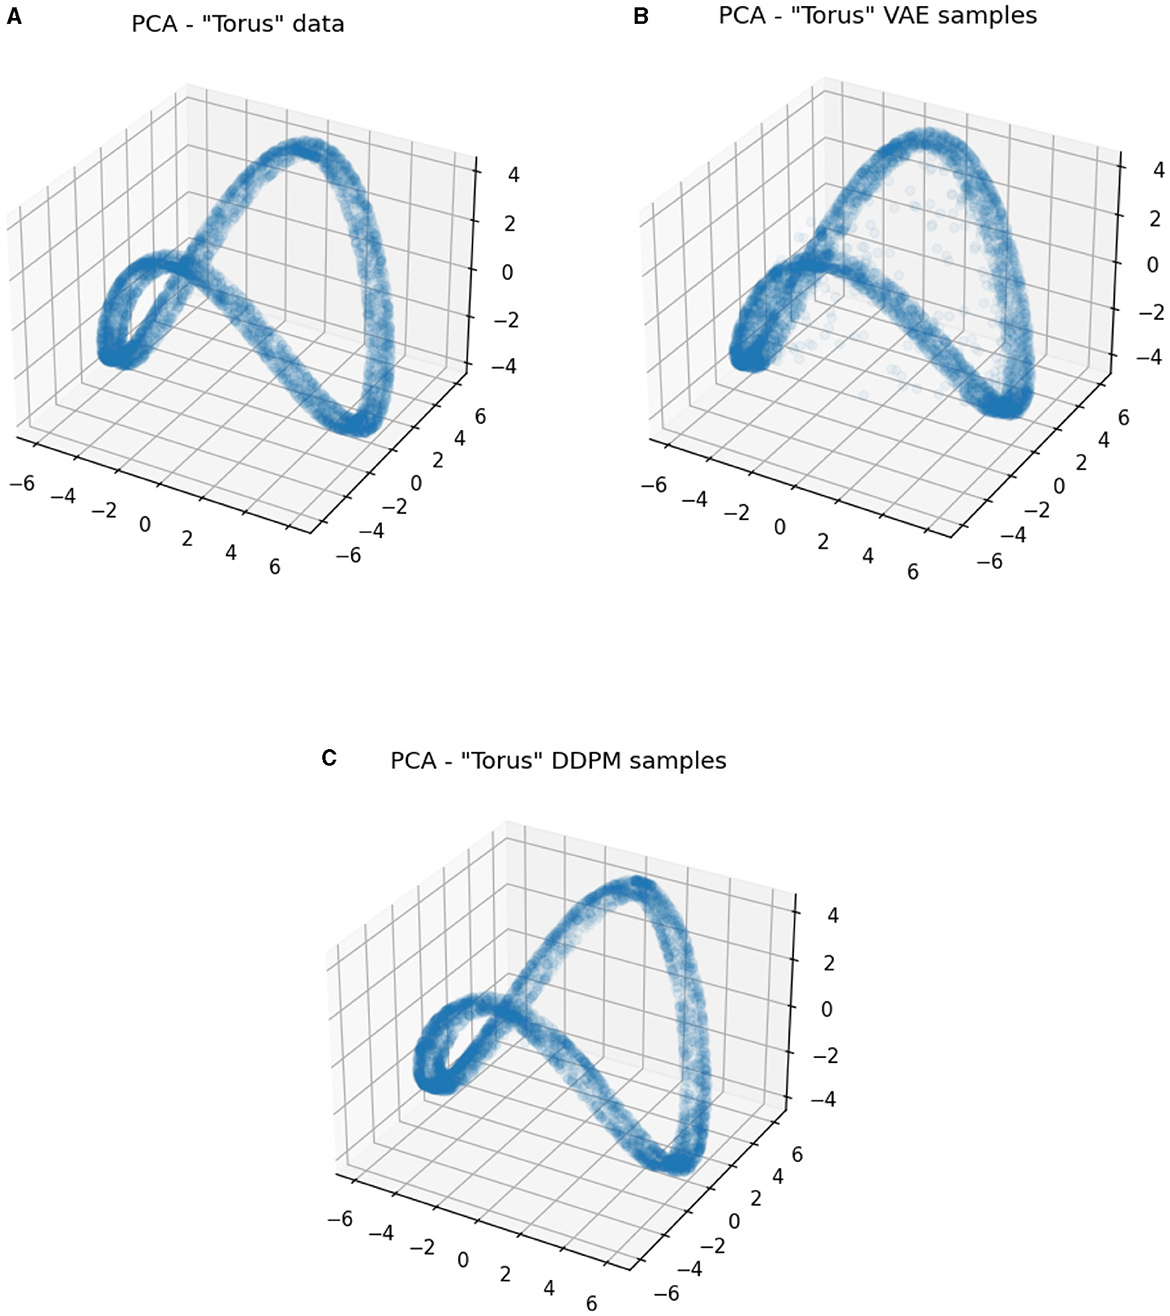
Figure 10. PCA visualizations of ground truth data and generator samples on the “torus” dataset. (A) Ground truth data. (B) Samples from VAE. (C) Samples from DDPM.
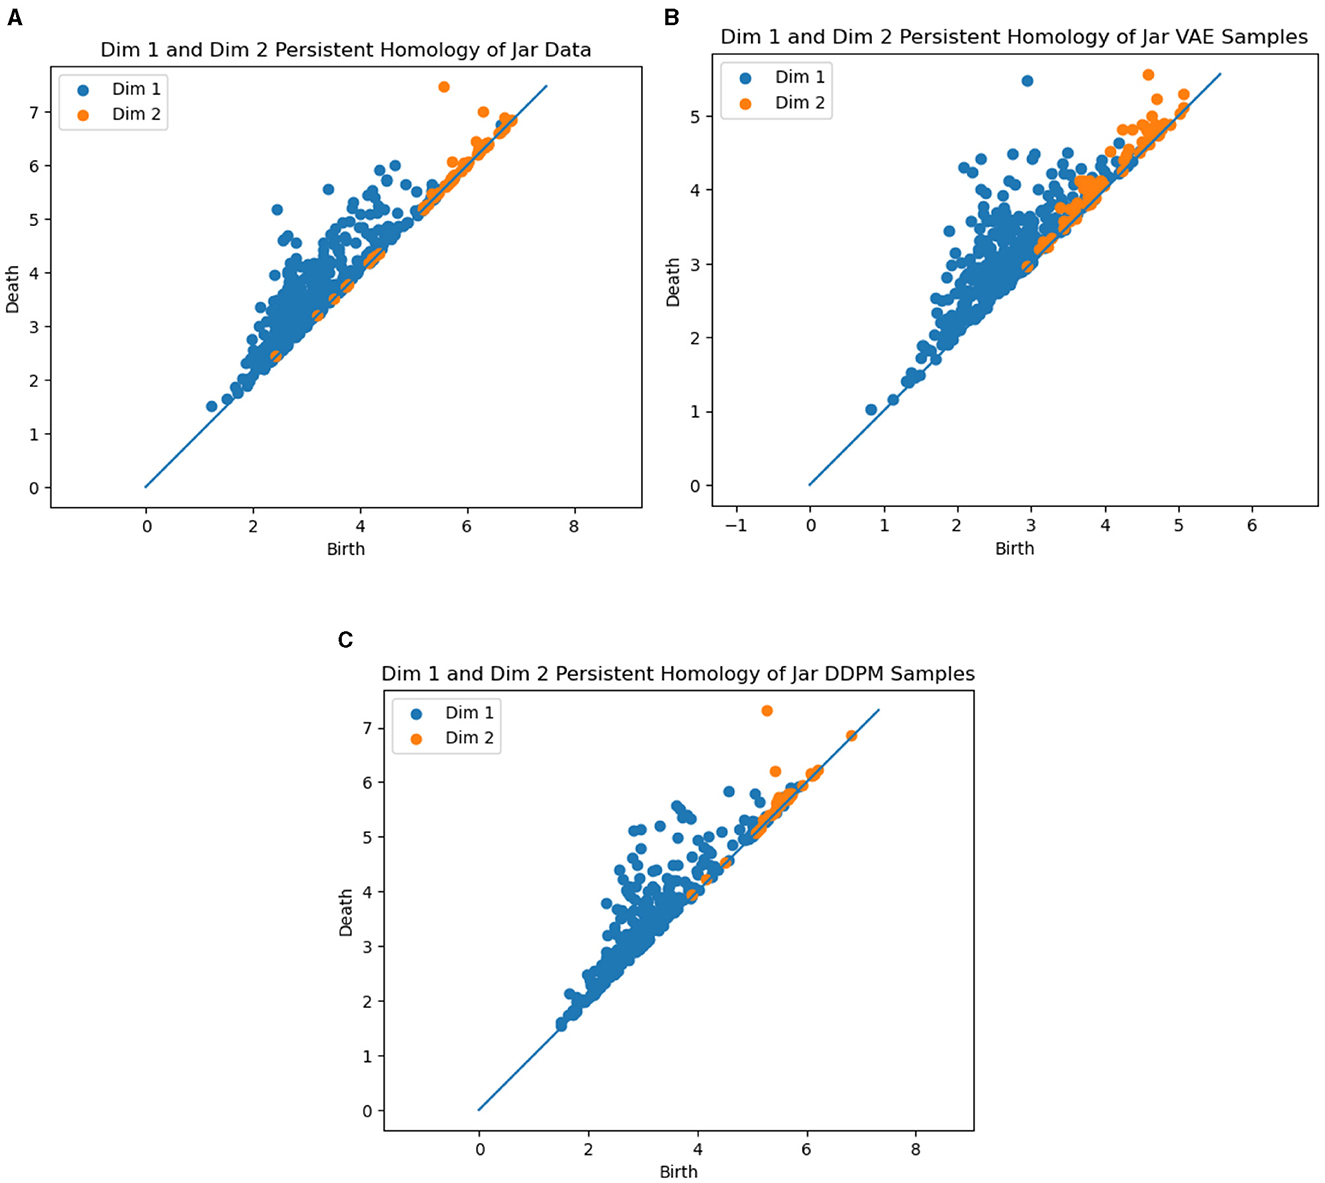
Figure 11. Persistent homology of the ground truth data and generator samples on jar dataset. (A) Ground truth data. (B) Samples from VAE. (C) Samples from DDPM.
4 Discussion and conclusion
In this paper, we investigated the ability of DGMs to model data distributions with non-trivial topologies. We hypothesized that VAEs would struggle to faithfully model non-Euclidean topologies because they generate data by continuously transforming a Gaussian random vector from a lower-dimensional, Euclidean latent space. This hypothesis was supported by our experiments on datasets with known topology. Our results comparing persistence diagrams of generated VAE samples vs. the ground truth persistence diagram show that a VAE does not faithfully recover the correct topology in the case of the torus (T2) or the sphere (S2). We further hypothesize that a similar failure to capture topology would hold for other models based on a Euclidean latent space, e.g., GANs, although this would need to be verified with further experiments.
Conversely, we hypothesized that DDPM and related score-based models, which theoretically have no constraint on their topology and learn the distribution in the original data dimension, would more effectively capture non-trivial data topologies. This turned out to be the case in our image experiments, where the DDPM persistence diagrams showed that they generated samples with much better matches to the ground-truth data topology. Furthermore, the ability of DDPMs to adapt to the topology of the data may explain their improved performance in generating realistic data samples, as they can avoid sampling in “holes” of the data distribution. However, one downside to DDPMs is that they do not parameterize the data distribution with a low-dimensional latent space. This makes moving along the data manifold, such as in the case of interpolation, more difficult with DDPMs. The CAE model tries in a sense to bridge this gap by providing a low-dimensional latent space, while at the same time also providing more topological flexibility. Our cyclooctane results show qualitatively and quantitatively that the CAE performs well on a complex data topology.
One unexpected result is the disagreement between the L2 Wasserstein metric and the other quantitative metrics (FID, density, and coverage). It may be the case the restriction on the sample size for the Wasserstein metric limits its approximation accuracy. Or it may be the case that the exact matching of points between the two samples is prone to outliers or other artifacts in the samples. Or it may simply be that “perceptual distances” mimicked by the VGG16 network are substantially different enough from L2 distances to cause reverse conclusions in the two classes of metrics. This discrepancy, and the more general question of how to best measure the distribution quality of a DGM, are directions ripe for future research.
In conclusion, our main novel contribution is the first test of the abilities of generative models to handle different data topologies. Our empirical findings highlight the limitations of a simplistic data topology assumption. The main takeaways are as follows:
• Generative models that assume data can be continuously mapped from a Euclidean latent space, e.g., VAEs, have limited ability to capture more complex topologies present in data.
• Conversely, DDPMs operate in the full-dimensional data space and without assumptions about the data topology. This results in DDPMs being better able to capture non-trivial topologies in data.
• However, the absence of straightforward Euclidean latent spaces in DDPM presents obstacles, particularly in tasks such as interpolations.
• Finally, our research underscores that distribution-based evaluation metrics sometimes fail to provide a comprehensive assessment of a generative model's ability to accurately capture the underlying data topology.
Data availability statement
The datasets presented in this study are either publicly available or can be generated from publicly available packages/softwares that can be found at online repositories. The names of the repository/repositories and accession number(s) can be found in the article/Supplementary material.
Author contributions
YJ: Writing – original draft, Writing – review & editing. RM: Writing – original draft. NT: Writing – original draft. MC: Writing – original draft. AS: Writing – original draft, Writing – review & editing. PB: Writing – original draft, Writing – review & editing. MD: Writing – original draft, Writing – review & editing. PF: Writing – original draft, Writing – review & editing.
Funding
The author(s) declare financial support was received for the research, authorship, and/or publication of this article. This work was funded by the Agreement HR0011-22-9-0076 from the Defense Advanced Research Projects Agency (DARPA), as part of the Geometries of Learning (GoL) Artificial Intelligence Exploration (AIE) program, the National Science Foundation under awards 2019239, 2129824, and 2205417, and the Air Force Office of Scientific Research under award number FA9550-21-0164.
Conflict of interest
NT is employed by STR. MC, AS, and PB are employed by Geometric Data Analytics, Inc.
The remaining authors declare that the research was conducted in the absence of any commercial or financial relationships that could be construed as a potential conflict of interest.
Publisher's note
All claims expressed in this article are solely those of the authors and do not necessarily represent those of their affiliated organizations, or those of the publisher, the editors and the reviewers. Any product that may be evaluated in this article, or claim that may be made by its manufacturer, is not guaranteed or endorsed by the publisher.
Supplementary material
The Supplementary Material for this article can be found online at: https://www.frontiersin.org/articles/10.3389/fcomp.2024.1260604/full#supplementary-material
References
Arvanitidis, G., Hansen, L. K., and Hauberg, S. (2018). “Latent space oddity: on the curvature of deep generative models,” in Proceedings of the 6th International Conference on Learning Representations, ICLR 2018.
Barannikov, S., Trofimov, I., Sotnikov, G., Trimbach, E., Korotin, A., Filippov, A., et al. (2021). “Manifold topology divergence: a framework for comparing data manifolds,” in Proceedings of Advances in Neural Information Processing Systems 34: Annual Conference on Neural Information Processing Systems 2021, NeurIPS 2021, 7294–7305.
Borji, A. (2022). Pros and cons of GAN evaluation measures: new developments. Comput. Vis. Image Underst. 215:103329. doi: 10.1016/j.cviu.2021.103329
Carriére, M., Chazal, F., Ike, Y., Lacombe, T., Royer, M., and Umeda, Y. (2020). “Perslay: a neural network layer for persistence diagrams and new graph topological signatures,” in Proceedings of the 23rd International Conference on Artificial Intelligence and Statistics, AISTATS 2020, 2786–2796.
Chen, C., Ni, X., Bai, Q., and Wang, Y. (2019). “A topological regularizer for classifiers via persistent homology,” in Proceedings of the 22nd International Conference on Artificial Intelligence and Statistics, AISTATS 2019, 2573–2582.
Chen, N., Klushyn, A., Kurle, R., Jiang, X., Bayer, J., and van der Smagt, P. (2018). “Metrics for deep generative models,” in Proceedings of the 21st International Conference on Artificial Intelligence and Statistics, AISTATS 2018, 1540–1550.
Chong, M. J., and Forsyth, D. (2020). Effectively unbiased FID and inception score and where to find them. arXiv:1911.07023.
Cohen-Steiner, D., Edelsbrunner, H., and Harer, J. (2007). Stability of persistence diagrams. Discr. Comput. Geom. 37, 103–120. doi: 10.1007/s00454-006-1276-5
Du, Y., and Mordatch, I. (2019). Implicit generation and generalization in energy-based models. arXiv:1903.08689.
Edelsbrunner, H., and Harer, J. (2010). Computational Topology - an Introduction. New York: American Mathematical Society. doi: 10.1090/mbk/069
Falkner, S., Klein, A., and Hutter, F. (2018). “BOHB: robust and efficient hyperparameter optimization at scale,” in Proceedings of the 35th International Conference on Machine Learning, ICML 2018, 1436–1445.
Fasy, B. T., Lecci, F., Rinaldo, A., Wasserman, L., Balakrishnan, S., and Singh, A. (2014). Confidence sets for persistence diagrams. Ann. Stat. 42, 2301–2339. doi: 10.1214/14-AOS1252
Genevay, A., Peyré, G., and Cuturi, M. (2018). “Learning generative models with sinkhorn divergences,” in International Conference on Artificial Intelligence and Statistics, AISTATS 2018, 1608–1617.
Goodfellow, I. J., Pouget-Abadie, J., Mirza, M., Xu, B., Warde-Farley, D., Ozair, S., et al. (2014). “Generative adversarial nets,” in Proceeding of Advances in Neural Information Processing Systems 27: Annual Conference on Neural Information Processing Systems 2014, NEURIPS 2014, 2672–2680.
Hendrickson, J. B. (1967). Molecular geometry. V. Evaluation of functions and conformations of medium rings. J. Am. Chem. Soc. 89, 7036–7043. doi: 10.1021/ja01002a036
Hensel, F., Moor, M., and Rieck, B. (2021). A survey of topological machine learning methods. Front. Artif. Intell. 4:681108. doi: 10.3389/frai.2021.681108
Heusel, M., Ramsauer, H., Unterthiner, T., Nessler, B., and Hochreiter, S. (2017). GANs trained by a two time-scale update rule converge to a local nash equilibrium. Adv. Neural Inf. Process. Syst. 30, 6626–6637.
Hinton, G. E., and Salakhutdinov, R. R. (2006). Reducing the dimensionality of data with neural networks. Science 313, 504–507. doi: 10.1126/science.1127647
Ho, J., Jain, A., and Abbeel, P. (2020). Denoising diffusion probabilistic models. Adv. Neural Inf. Process. Syst. 33, 6840–6851. doi: 10.48550/arXiv.2006.11239
Jonker, R., and Volgenant, T. (1988). “A shortest augmenting path algorithm for dense and sparse linear assignment problems,” in Proceedings of the 16th Annual Meeting of DGOR in Cooperation with NSOR, 622–622. doi: 10.1007/978-3-642-73778-7_164
Khrulkov, V., and Oseledets, I. V. (2018). “Geometry score: a method for comparing generative adversarial networks,” in Proceedings of the 35th International Conference on Machine Learning, ICML 2018, 2626–2634.
Kingma, D. P., and Ba, J. (2015). “Adam: a method for stochastic optimization,” in 3rd International Conference on Learning Representations, ICLR 2015.
Kingma, D. P., and Welling, M. (2014). “Auto-encoding variational bayes,” in Proceedings of the 2nd International Conference on Learning Representations, ICLR 2014.
Martin, S., Thompson, A., Coutsias, E. A., and Watson, J.-P. (2010). Topology of cyclo-octane energy landscape. J. Chem. Phys. 132:234115. doi: 10.1063/1.3445267
Naeem, M. F., Oh, S. J., Uh, Y., Choi, Y., and Yoo, J. (2020). “Reliable fidelity and diversity metrics for generative models,” in Proceedings of the 37th International Conference on Machine Learning, ICML 2020, 7176–7185.
Naitzat, G., Zhitnikov, A., and Lim, L.-H. (2020). Topology of deep neural networks. J. Mach. Learn. Res. 21, 184:7503–184:7542. doi: 10.48550/arXiv.2004.06093
Otter, N., Porter, M. A., Tillmann, U., Grindrod, P., and Harrington, H. A. (2017). A roadmap for the computation of persistent homology. EPJ Data Sci. 6, 1–38. doi: 10.1140/epjds/s13688-017-0109-5
Oudot, S. Y. (2017). Persistence Theory: From Quiver Representations to Data Analysis. New York: American Mathematical Society.
Parmar, G., Zhang, R., and Zhu, J.-Y. (2022). On aliased resizing and surprising subtleties in GAN evaluation. arXiv:2104.11222.
Persistence of Vision Pty. Ltd. (2004). Persistence of vision raytracer (version 3.6) [computer software]. Available online at: http://www.povray.org/download/ (accessed July 18, 2023).
Rezende, D. J., and Mohamed, S. (2015). “Variational inference with normalizing flows,” in Proceedings of the 32nd International Conference on Machine Learning, ICML 2015, 1530–1538.
Sajjadi, M. S. M., Bachem, O., Lucic, M., Bousquet, O., and Gelly, S. (2018). “Assessing generative models via precision and recall,” in Proceedings of Advances in Neural Information Processing Systems 31: Annual Conference on Neural Information Processing Systems 2018, NeurIPS 2018, 5234–5243.
Schonsheck, S., Chen, J., and Lai, R. (2019). Chart auto-encoders for manifold structured data. arXiv:1912.10094.
Shao, H., Kumar, A., and Fletcher, P. T. (2018). “The Riemannian geometry of deep generative models,” in Proceedings of 2018 IEEE Conference on Computer Vision and Pattern Recognition Workshops, CVPR Workshops 2018, 315–323. doi: 10.1109/CVPRW.2018.00071
Shukla, A., Uppal, S., Bhagat, S., Anand, S., and Turaga, P. K. (2018). “Geometry of deep generative models for disentangled representations,” in Proceedings of ICVGIP 2018: 11th Indian Conference on Computer Vision, Graphics and Image Processing, 68:1–68:8. doi: 10.1145/3293353.3293422
Sohl-Dickstein, J., Weiss, E. A., Maheswaranathan, N., and Ganguli, S. (2015). “Deep unsupervised learning using nonequilibrium thermodynamics,” in Proceedings of the 32nd International Conference on Machine Learning, ICML 2015, 2256–2265.
Solomon, E., Wagner, A., and Bendich, P. (2021). “A fast and robust method for global topological functional optimization,” in Proceedings of the 24th International Conference on Artificial Intelligence and Statistics, AISTATS 2021, 109–117.
Song, Y., Sohl-Dickstein, J., Kingma, D. P., Kumar, A., Ermon, S., and Poole, B. (2021). “Score-based generative modeling through stochastic differential equations,” in Proceedings of the 9th International Conference on Learning Representations, ICLR 2021.
Tauzin, G., Lupo, U., Tunstall, L., Pérez, J. B., Caorsi, M., Medina-Mardones, A. M., et al. (2021). giotto-tda:: a topological data analysis toolkit for machine learning and data exploration. J. Mach. Learn. Res. 22, 39:1–39:6. doi: 10.48550/arXiv.2004.02551
Virtanen, P., Gommers, R., Oliphant, T. E., Haberland, M., Reddy, T., Cournapeau, D., et al. (2020). SciPy 1.0: fundamental algorithms for scientific computing in python. Nat. Methods 17, 261–272. doi: 10.1038/s41592-019-0686-2
Keywords: data topology, generative model, variational autoencoder (VAE), diffusion probabilistic models (DDPM), topological data analysis
Citation: Jin Y, McDaniel R, Tatro NJ, Catanzaro MJ, Smith AD, Bendich P, Dwyer MB and Fletcher PT (2024) Implications of data topology for deep generative models. Front. Comput. Sci. 6:1260604. doi: 10.3389/fcomp.2024.1260604
Received: 18 July 2023; Accepted: 12 July 2024;
Published: 26 August 2024.
Edited by:
Maria Rodriguez Martinez, Yale University, United StatesReviewed by:
Zhanglin Cheng, Chinese Academy of Sciences (CAS), ChinaAnkita Shukla, University of Nevada, Reno, United States
Copyright © 2024 Jin, McDaniel, Tatro, Catanzaro, Smith, Bendich, Dwyer and Fletcher. This is an open-access article distributed under the terms of the Creative Commons Attribution License (CC BY). The use, distribution or reproduction in other forums is permitted, provided the original author(s) and the copyright owner(s) are credited and that the original publication in this journal is cited, in accordance with accepted academic practice. No use, distribution or reproduction is permitted which does not comply with these terms.
*Correspondence: Yinzhu Jin, eWozY3pAdmlyZ2luaWEuZWR1
 Yinzhu Jin
 Rory McDaniel1
 N. Joseph Tatro
 Paul Bendich
 P. Thomas Fletcher