Abstract
Introduction:
Data-driven simulation allows the discovery of process simulation models from event logs. The generated model can be used to simulate changes in the process configuration and to evaluate the expected performance of the processes before they are executed. Currently, these what-if scenarios are defined and assessed manually by the analysts. Besides the complexity of finding a suitable scenario for a desired performance, existing approaches simulate scenarios based on flow and data patterns leaving aside a resource-based analysis. Resources are critical on the process performance since they carry out costs, time, and quality.
Methods:
This paper proposes a method to automate the discovery of optimal resource allocations to improve the performance of simulated what-if scenarios. We describe a model for individual resource allocation only to activities they fit. Then, we present how what-if scenarios are generated based on preference and collaboration allocation policies. The optimal resource allocations are discovered based on a user-defined multi-objective optimization function.
Results and discussion:
This method is integrated with a simulation environment to compare the trade-off in the performance of what-if scenarios when changing allocation policies. An experimental evaluation of multiple real-life and synthetic event logs shows that optimal resource allocations improve the simulation performance.
1. Introduction
Understanding the behavior of the resources who execute the tasks is a critical factor for the performance of a business process (Thevendran and Mawdesley, 2004). Evaluating the impact on process performance due to changes on the allocation of resources is a valuable and challenging task. The impact analysis on resource allocation changes can be evaluated through various approaches. Modeling approaches (Russell et al., 2005; Wolter and Schaad, 2007; Cabanillas et al., 2011; Vasilecas et al., 2014; Bocciarelli et al., 2016) enhance existing modeling languages like BPMN by incorporating resource assignment tools for task execution. This type of analysis is descriptive and static, hindering the assessment of resource impact on the process execution success. Process Mining (PM) approaches use historical data to analyze resource performance in task execution (Song and van der Aalst, 2008; Huang et al., 2012; Pika et al., 2014). These approaches identify resource patterns, such as preferences for executing certain activities, which is beneficial for measuring process performance resulting from the actual resource allocation. Finally, process simulation approaches assist us in specifying resource allocation changes for specific tasks, enabling a proactive assessment of their potential impact on process performance (Si et al., 2018; Durán et al., 2019). However, creating and refining what-if scenarios remains a highly time-consuming and cumbersome manual task with yet margins to improve. In particular, what-if scenarios rely on the analyst's discretion, which is prone to yielding less than optimal process configurations and failing to leverage data knowledge on resource patterns.
We address this gap by enhancing a data-driven simulation method (Camargo et al., 2020) by adding the capability to automate the discovery of optimal resource allocations, thereby improving the performance of simulated what-if scenarios. This new method and tool are named SimodR, which allows for:
C1 Discovering a model for individual resource allocation only to activities they fit. This constraints the allocations to resources that are enabled to execute an activity.
C2 Generating multiple what-if scenarios by changing the allocation of resources of the PSM model based on allocation policies. We present the implementation of preference and collaboration policies to allocate resources. Each change generates a potential process configuration to be implemented.
C3 Discovering the optimal configuration of what-if scenarios based on a user defined multi-objective optimization function on performance metrics (waiting time, flow time, workload, cost). We adapted the NSGA-II evolutionary algorithm to tackle the MultiObjective Resource Allocation Problem.
This paper is structured as follows. Section 2 introduces the core concepts, related work on data-driven simulation, and the challenges for analyzing process improvements based on resource changes. Section 3 details the proposed method. Section 4 discusses the experiments performed to evaluate how optimizing what-if scenarios based on resources allocation changes improves the estimation in process performance while analyzing their trade-offs. We used three event logs to discover the PSM models and their configuration parameters, especially regarding resources. Section 5 concludes and outlines directions for future work.
2. Motivation and problem statement
2.1. Core concepts
A business process is a collection of activities and decision gates logically related to creating products or services that provide value to the client or user (Dumas et al., 2018). Each process execution corresponds to an instance or case, grouping a set of events performed by a resource (e.g., a customer). The events executed for a process instance can be extracted and pre-processed from Process-Aware Information Systems (PAIS) to produce an event log representing the set of traces. A trace represents the sequence of events (activities) that were executed by specific resources for a particular case. An event log must contain at least a case identifier, the activity name, timestamps (start and end), and optionally categorical, numerical, or textual attributes that might be of interest according to the analysis performed (resources, data objects, costs, etc.).
Process Mining (PM) encompasses techniques that use event logs as input to reflect on the causal relationship between the observed activities (Rozinat et al., 2009). For instance, to discover process models, to compare process variants, to check conformance among events and process models, and to analyze process performance. The latter capability involves measuring process performance metrics associated with cases and traces such as processing time, cycle time, execution cost, and workload.
Process simulation is a technique for quantitative analysis of business processes, which allows the detection of bottlenecks and performance estimation based on a PSM (Dumas et al., 2018). A PSM comprises various parameters (arrival rate, inter-arrival times, time constraints on activities, resources allocation, timetables) configured for a process model. These PSMs facilitate the creation of alternative process configurations (what-if scenarios) by adjusting parameters to compare their performance. Data-driven simulation uses PM to discover automatically PSMs that mirror the actual process execution. Using data as a starting point enables the analysis of all executed paths (not just designed ones), reducing the effort and complexity to build the baseline PSM necessary for defining what-if scenarios.
Simulation approaches cannot optimize the configuration of what-if scenarios (see Sections 2.2 and 2.3). Besides the complexity of defining and finding the desired what-if scenario manually, most approaches configure them based on flow and data patterns leaving aside a resource-based analysis. Resources are critical to the process performance since they carry out costs, time, and quality.
2.2. Related work
Existing works on resource allocation in business processes analysis can be classified into those focusing on the Modeling stage and those focusing on the Execution stage.
Modeling-centered approachespropose the introduction of new components in formal languages to represent the relationship between resources and process tasks. Cabanillas et al. (2011) suggest a Resource Assignment Language (RAL) that represents the organizational structure of resources and their allocation in process activities. Bocciarelli et al. (2016) define resources in terms of non-functional properties such as workload, performance, reliability, and resource management. Vasilecas et al. (2014) describes resources based on attributes such as name, function, duration, quantity, availability, and use cost. Wolter and Schaad (2007) incorporate authorizations into the process model, enabling the definition of resource allocation patterns such as Separation of Duty, Role-Based Assignment, Case Management, or History-Based Assignment in BPMN. While these works offer a static view of process resources, the proposed characterizations can be dynamically discovered and utilized to allocate resources based on past executions and user preferences to enhance process performance.
Execution-centered approachesemploy process mining (PM) techniques to discover patterns in the behavior of resources and rely on historical information recorded in event logs as their main source of analysis. They can be sub-classified into Static and Dynamic approaches. Static analysis approaches help to analyze the processes' performance from the perspective of the underlying organizational structures observed in the data. They take a descriptive approach by analyzing past events, leaving aside the impact assessment on potential process performance due to changes in the resource assignment. On the other side, Dynamic analysis approaches are mainly based on Process simulation, more specifically Data-Driven Simulation (DDS). They analyze the relationship between the resources' behavior and the process performance, offering a new way to evaluate improvement scenarios based on user optimization preferences.
Regarding Static analysis techniques, Martin et al. (2020) present a method that automatically extracts resource availability calendars from event logs containing information about process execution. This method takes an event log as input and generates resource availability calendars as output. The primary objective of this research is to identify the availability restrictions followed by resources during the execution of a process. Similarly, Song and van der Aalst (2008) introduces clustering techniques and mathematical analysis methods to uncover the underlying organizational model by utilizing social network analysis and information flow analysis between different organizational entities. The authors aim to provide analysts with insights into how tasks have been executed within the process compared to the predefined organizational structure. Schonig et al. (2016) develop a process mining framework to discover cross-perspective patterns that establish relationships between resource behaviors and the control flow of a process. This approach inputs an event log and organizational background knowledge (such as roles, capabilities, and resource membership in organizational units). The discovered patterns aim to enhance the understanding of the dynamics within the process.
Huang et al. (2012) proposes measuring resource behavior from four perspectives to facilitate process improvements. The “Preference” perspective estimates the resources' inclination toward frequently executed activities, indicating their high or low preference for performing them. The “Availability” perspective determines whether a resource can perform a task within a specific time range. The “Competence” perspective assesses a resource's ability to carry out a particular type of activity. The “Cooperation” perspective indicates the level of coordination between two resources in a process. The authors develop mathematical models to quantify these perspectives based on an event log and propose a recommendation mechanism for resource allocation that considers these behavior measurements. Pika et al. (2014) introduce Resource Behavior Indicators (RBI) to extract knowledge about resources from event logs, incorporating the Preference and Collaboration perspectives described by Huang et al. (2012). Additionally, they propose three additional perspectives: the “Skills” perspective, which measures the capabilities of a resource; the “Utilization” perspective, which assesses the activities performed by a resource; and the “Productivity” perspective, which evaluates the effectiveness of a resource in performing its tasks.
Regarding Dynamic analysis techniques, Durán et al. (2019) propose using the Maude simulator to manually define different scenarios for allocating resources in a process and evaluate its performance impact looking to minimize the average execution time. The monitored variables to propose the allocation scenarios are the resource usage over time and the usage percentage for each resource replica. Si et al. (2018) propose the use of process simulation with Colored Petri Nets in combination with a Genetic Algorithm for optimization of resource allocation. The target is minimizing task execution times by considering restrictions on the availability of resources. The work was validated using two real event logs corresponding to Macau Historical Archives and an insurance claim workflow, which reflected significant improvements in execution times compared to the times measured in the event logs. These approaches need to be improved in the configuration of What-if scenarios. In Durán et al. (2019), the what-if scenarios are configured manually by the analysts, entailing a high complexity and effort to analyze multiple scenarios. The authors in Si et al. (2018) assume the knowledge of an AS-IS scenario, which includes the size and composition of the resource pools, which is only sometimes possible in a real setting.
López-Pintado et al. (2021) presents a study that optimizes process performance through a multi-objective approach (NSGA-II), balancing the conflicting goals of reducing cycle time and resource costs using simulation techniques. This approach does not consider the creation of possible resource allocation scenarios that seek to benefit the specific needs of a business case, for example, help the cooperation of particular resources at the time of their allocation. Kuchař and Vondrák (2016) proposes a method for specifying resource competencies using competency models. This approach simulates the human capacity and productivity of resources, offering a more realistic context for resource allocation. However, the proposed approach only considers time for resource allocation, which is unrealistic since changing resource allocation affects other metrics such as cost, workload, and waiting time. Ihde et al. (2019) propose a framework that introduces a new component called the Resource Manager, aiming to optimize resource allocation in processes. This framework enables the specification of resource requirements, which the Resource Manager utilizes to determine resource allocation for different activities within the process. However, the authors assume that the execution of the process strictly adheres to the resource allocation plan, which is often not the case in real-world processes. Resource allocation depends on resource availability and is usually done to optimize process performance.
In this paper, we propose a Dynamic analysis approach that joins the power of DDS, Multi-objective optimization, and an adaptation of the preference and cooperation perspectives presented by Huang et al. (2012) to create allocation policies to simulate changes in the allocation of resources.
Among the baseline studies considered, the work authored by López-Pintado et al. (2021) stands out as a more direct point of reference for our research. This is primarily due to its utilization of simulation techniques and the NSGA II optimization algorithm within the optimization loop. However, we have opted not to adopt this work as a baseline for our research. The rationale behind this decision is rooted in the fact that López-Pintado et al.'s work relies on the BIMP simulator as its foundation, and this simulator operates with resource pools rather than individual resources. Such a distinction impedes the application of resource allocation policies at the granularity we aim to achieve, which is at the individual resource level. Additionally, variations in the simulation mechanisms between their simulator (BIMP) and ours (Sylla) could significantly impact the generation of event logs, potentially leading to an inequitable comparison of the two approaches. Assessing and contrasting the disparities in simulation mechanisms lies beyond the scope of our research.
Looking forward to performing a fair comparison, we choose to employ Simod (Camargo et al., 2020) as our baseline for comparison because it provides a fully automated method for identifying and optimizing business process simulation models using event logs. This selection eliminates potential biases introduced by manually tuning simulation parameters and model calibration, ensuring a fair and objective comparison. This approach allows us to evaluate our method on an even footing with approaches like the one presented by López-Pintado, which centers on resource allocation based on resource pools.
2.3. Challenges on data-driven simulation: a case study
We selected a manufacturing production (MP) process log as a case study to illustrate the capabilities of data-driven simulation approaches to generate PSMs and their shortcomings for configuring optimal what-if scenarios based on resource patterns. The MP event log, exported from an Enterprise Resource Planning (ERP) system (Levy, 2014), contains the activities (e.g., Turning and Milling, Turning Q.C, Laser Marking, etc.) that need to occur within a company before delivering the item to a client. Table 1 presents an extract of this log and its main execution features: case ID, activity name, start and end timestamps, and the resource. The process discovered from the log consists of 24 activities, 46 resources, 4,953 events related to 225 cases, and 217 different execution paths (process variants).
Table 1
| CaseID | Activity | Start timestamp | Complete timestamp | Resource |
|---|---|---|---|---|
| 1 | Turning & Milling | 2012-01-30T06:24:00 | 2012-01-30T12:43:00 | ID4932 |
| 1 | Turning & Milling Q.C. | 2012-01-31T20:20:00 | 2012-01-31T21:50:00 | ID4163 |
| 1 | Lapping | 2012-02-14T07:00:00 | 2012-02-14T08:15:00 | ID4882 |
| 1 | Lapping | 2012-02-14T16:05:00 | 2012-02-14T16:38:00 | ID4882 |
| 101 | Setup | 2012-03-14T01:47:00 | 2012-03-14T03:03:00 | ID4219 |
| 101 | Turning & Milling | 2012-03-14T03:38:00 | 2012-03-14T06:03:00 | ID4219 |
| 101 | Turning & Milling | 2012-03-14T06:04:00 | 2012-03-14T06:49:00 | ID4219 |
Extract of the manufacturing process event log.
We used Simod (Camargo et al., 2020) to generate the complete PSM (the process model and its corresponding parameters) associated with this log. The BPMN process model was generated by using SplitMiner (Augusto et al., 2017), which allows to analyze models with different levels of sensitivity. Figure 1 illustrates the resulting process model abstracted by case frequency to show only the 60% of the most frequent activities and the 25% of the most frequent arcs from the complete process execution.
Figure 1
Simod calculates the gateway's probabilities (see some parameters in Table 2), and generates a PSM configured with a resources pool that assumes a fixed similarity rate of 50%, and with the time and allocation parameters (see Table 3). The generated resource model contains 11 role groups with a different number of resources each. The performance metrics of this process (see Table 4 in Section 4) are used as a reference when evaluating the process with the proposed resource allocation policies.
Table 2
| Node 1 | Prob 1 (%) | Node 2 | Prob 2 (%) |
|---|---|---|---|
| Turning | 97 | Setup Turning & Milling | 3 |
| Packing | 53 | Decision gate | 47 |
| Change version | 67 | Rework Milling | 33 |
| Flat grinding | 26 | Decision gate | 74 |
Discovered decision gates configuration.
Table 3
| Activity | Distribution | Distribution variables (s) | Resource role |
|---|---|---|---|
| Arrival rate | Exponential | 28,230 | - |
| Start | Constant | 0 | Role 0 |
| Nitration Q.C. | Constant | 0 | Role 0 |
| Turning Rework | Constant | 0 | Role 0 |
| Final Inspection Q.C. | Triangular | L: 60 P: 3,600 U: 22,200 | Role 2 |
| Turn & Mill. & Screw Assem | Constant | 0 | Role 0 |
Extract of PSM parameters discovered by Simod.
A PSM that is automatically generated by using data-driven simulation methods (e.g., Simod), can be executed in existing process simulators (e.g., Bimp, Scylla). However, the following challenges still remain as gaps for defining what-if scenarios.
G1 Discover resource changes. Defining what-if scenarios is often constrained to a predefined resources model representing roles rather than individual resources. Discovering PSM changes in terms of the resource's behavior (e.g., group resources by efficiency) is desired to simulate scenarios based on business preferences. Moreover, redistributing the resource pools manually is very expensive and highly dependent on the analyst's criteria. This could create a big gap from the reality of the process execution and generate unrealistic simulation scenarios.
G2 Prescribe optimal configurations. Configuring what-if scenarios is a complex and highly time-consuming task, given the exponential amount of possible PSM changes (resources allocation, resources pool composition, activities order). Furthermore, each defined what-if scenario may yield uncertain results in terms of optimal performance (minimize execution times and/or maximize workload). This complexity makes it challenging to compare scenarios effectively. Consequently, finding the best configuration of simulation parameters is not always guaranteed, leading to suboptimal performance results.
3. SimodR: a method to create what-if scenarios based on optimal resource allocations
The goal of the research is to come up with optimal resource allocations to improve the performance of simulated what-if scenarios. To achieve this goal, we developed a method and tool called SimodR. SimodR extends a data-driven simulation system with capabilities to generate process simulation models with individual resources allocated to activities. It also allows defining how resources-related simulation parameters are discovered based on allocation policies. A resource allocation policy is the guideline for resources distribution within a PSM.
SimodR introduces three allocation policies and implements an algorithm to optimize resource allocation based on specific optimization goals defined by process analysts. These goals can connect to one or multiple performance metrics such as waiting time, flow time, workload, and cost. SimodR performs resource allocations within PSMs and then evaluates them through simulations. Figure 2 illustrates the activities we defined to automate the configuration of what-if scenarios based on optimal resource allocation changes. The scope of these activities and the adaptation of an evolutionary algorithm to tackle the MultiObjective Resource Allocation Problem are detailed below.
Figure 2
3.1. A model for individual resource allocation
Generating simulation models that allocate individual resources to activities, rather than relying on traditional role-based allocation, requires analyzing which resources are enabled to perform each activity. This analysis is achieved by identifying the resources that have previously executed each activity.
SimodR analyzes the event log and generates an enabling matrix (see Equation 1). In this matrix, the rows represent the resources found in various traces, and the columns represent the process activities. Each matrix entry indicates how many times a particular resource has executed a corresponding activity. The enabling matrix prevents a resource from performing an activity for which it is not qualified (e.g., a nurse should not be allocated to a surgery activity).
3.2. Allocation policies to configure what-if scenarios
Simod identifies available resources, their timetables, and the relationships between activities and resources from an event log. SimodR utilizes the resources previously discovered by Simod as input. A resource indicates what or who performs a specific activity (a participant, a software system, or a mechanical element that performs a job).
We defined two algorithms to allocate resources to activities within the PSM: the preference and collaboration policies. These policies scope the rules for resource allocation, as long as they match the enabling matrix. In scenarios where neither of these policies is applied, SimodR uses a no-policy strategy, allowing all enabled resources to be associated with activities in the PSM.
3.2.1. Resource allocation by preference
The preference policy uses a score which is a measure of how well a given resource allocation solution adheres to the most common allocations on an activity. In essence, the preference score measures how evenly and likely the activities are allocated to the available resources, taking into account the number of repetitions of each pair activity-resource from historical executions.
Let nij be the number of repetitions of activity i allocated to resource j, Ti be the total number of repetitions of activity i, and Rj be the total number of repetitions of resource j. Then, the preference score Pij for a given solution can be defined as:
The preference score considers both the proportion of times resource j has performed activity i and the overall involvement of resource j in performing all activities. The policy iterates over each activity in the process model and it calculates the degree to which the allocated resources are likely to perform each activity. The number of times a resource j has performed an activity i is retrieved from the enabling matrix (see Section 3.1). The ratio of the allocated resources is then calculated, and this ratio is squared and added to a running total. The preference score is the sum of the squared ratios calculated for each activity-resource pair. The higher the preference score is, the most likely (preferred) their resources are to perform each activity.
We hypothesize that using this policy, the user is implicitly selecting those resources that have a certain preference or ability to carry out a specific activity. Therefore, the flow time is expected to improve.
3.2.2. Resource allocation by cooperation
We implemented a metric based on resource cooperation, as described by Huang et al. (2012), to enhance the model of allocating individual resources. This metric measures the degree to which two resources in a process tend to follow each other in sequence. In essence, it quantifies the relative frequency with which two resources appear consecutively when carrying out their corresponding activities.
Our hypothesis is that by using this policy, the execution of activities is well-coordinated, and they are likely to complete the process instance with less delay and less idle time. A high cooperation score also indicates that there is a high level of communication and collaboration between the resources that execute the activities, which can lead to better problem-solving, fewer errors, and improved overall process result.
The correlation between two resources (r1 and r2) for a pair of successive activities (a1 and a2) is defined in Equation (3) as proposed in Huang et al. (2012). It calculates the probability of activity a1 being assigned to resource r1 and activity a2 being assigned to resource r2, divided by the product of their individual probabilities. The value of this correlation will be 1 if the assignments of the activities to the resources are independent, less than 1 if they are negatively correlated (one tends to happen if the other does not), and more than 1 if they are positively correlated (both tend to happen together).
Based on this correlation, the cooperation between two resources (r1 and r2) performing two activities (a1 and a2) is defined in Equation (4) as proposed in Huang et al. (2012). A correlation greater than 1 might indicate a high level of synchronization or mutual interplay between the two resources. In this case, the cooperation measure is the joint probability of both activities being assigned to their respective resources, subtracted by the product of the individual probabilities of the activities being assigned to their resources, and then divided by the product of the individual probability of the first activity being assigned to its resource and the complement of the second activity being assigned to its resource. A correlation fewer than 1 indicates that the activities and resources are not strongly linked so they will not be taken into account to calculate the cooperation for the whole process. In this case, the cooperation measure is defined as zero.
For every pair of activities (ai, aj), the cooperation measure between resources r1 and r2 is calculated summing up the cooperation value of every combination of activities (over the A activities of the process). Then, all of these individual measures are summed up to get the overall measure of cooperation between r1 and r2 (see Equation 5 as proposed in Huang et al., 2012). SimodR then generates a cooperation matrix by calculating the defined metric and, from that matrix, calculates the cooperation metric according to the assignments generated by the algorithm. To obtain the process cooperation metric, the average of the cooperation values of the different resources is calculated.
3.3. Multiobjective resource allocation
We decided to adapt the Non-dominated Sorting Genetic Algorithm II (NSGA-II) to tackle the Multiobjective resource allocation problem associated to changing the allocation parameters to generated simulation models. This algorithm assumes that the individuals of a species improve as generations pass because the characteristics that are best adapted to the environment are those that are transmitted through generations (Deb et al., 2002). Likewise, there are mutations that are random and atypical events where new characteristics appear in the population to favor its adaptation to the environment. In this context, the following terms can be scoped:
An Individual represents a particular solution with the allocation of activities to resources in the BPS model. Each individual can be represented as a list of integers, where each integer corresponds to the resource allocated and the position in the array represents the corresponding activity. The allocation of resources is done by creating permutations of the available resources and assigning them to the tasks in the BPS model. The NSGA-II algorithm is used to optimize these permutations based on multiple objectives such as cost, waiting time, flow time, workload, preference, and cooperation. The granularity of permutations in SimodR is at the activity level. This means that each activity in the BPMN model is a decision variable in the optimization problem, and the algorithm generates permutations of activities and resources to find the optimal allocation.
The Population represents a group of individuals or solutions that are evaluated and updated in each generation of the NSGA-II algorithm. The size of the population is a parameter defined by the user.
A Generation represents a single iteration of the NSGA-II algorithm, where a new population of solutions is created from the previous population by applying crossover and mutation genetic operators.
The crossover operator generates new individuals from the parent individuals. SimodR uses the Simulated Binary Crossover (SBX) operator, which creates offspring solutions by exchanging information from two parent solutions selected from the current population. The SBX operator uses a probability distribution that determines the probability of the offspring being near to the parents or far away from them. This allows the algorithm to explore different regions of the solution space.
The mutation operator is applied to individuals in a population to introduce diversity and explore the solution space. Mutations within a BPS model can be either swapping resources between the activities or just changing the resource that performs one activity. The mutation to use is defined by a uniform distribution. SimodR uses a Polynomial Mutation (PM) operator, which modifies the decision variable of a solution by adding or subtracting a polynomial perturbation. The PM operator is used to provide new solutions to the algorithm when it is stuck in local optima. SimodR uses the mutation operator with a probability rate of 1/number of activities, which ensures that every decision variable in the solution is mutated at least once in each generation. The algorithm also uses a parameter called the mutation index to determine the magnitude of the mutation perturbation. The mutation index is a variable that increases over generations to reduce the search space as the algorithm progresses.
The stopping criteria for the algorithm is defined as the point at which convergence is achieved. Convergence is often achieved when the average distance between adjacent solutions in the Pareto-optimal front is below a certain threshold. In this case when the incumbent solution (best solution found) does not change at all in a defined number of generations.
Algorithm 1 illustrates a pseudocode that summarizes how the NSGA-II algorithm was adapted to a BPS model to generate optimal what-if scenarios.
Algorithm 1
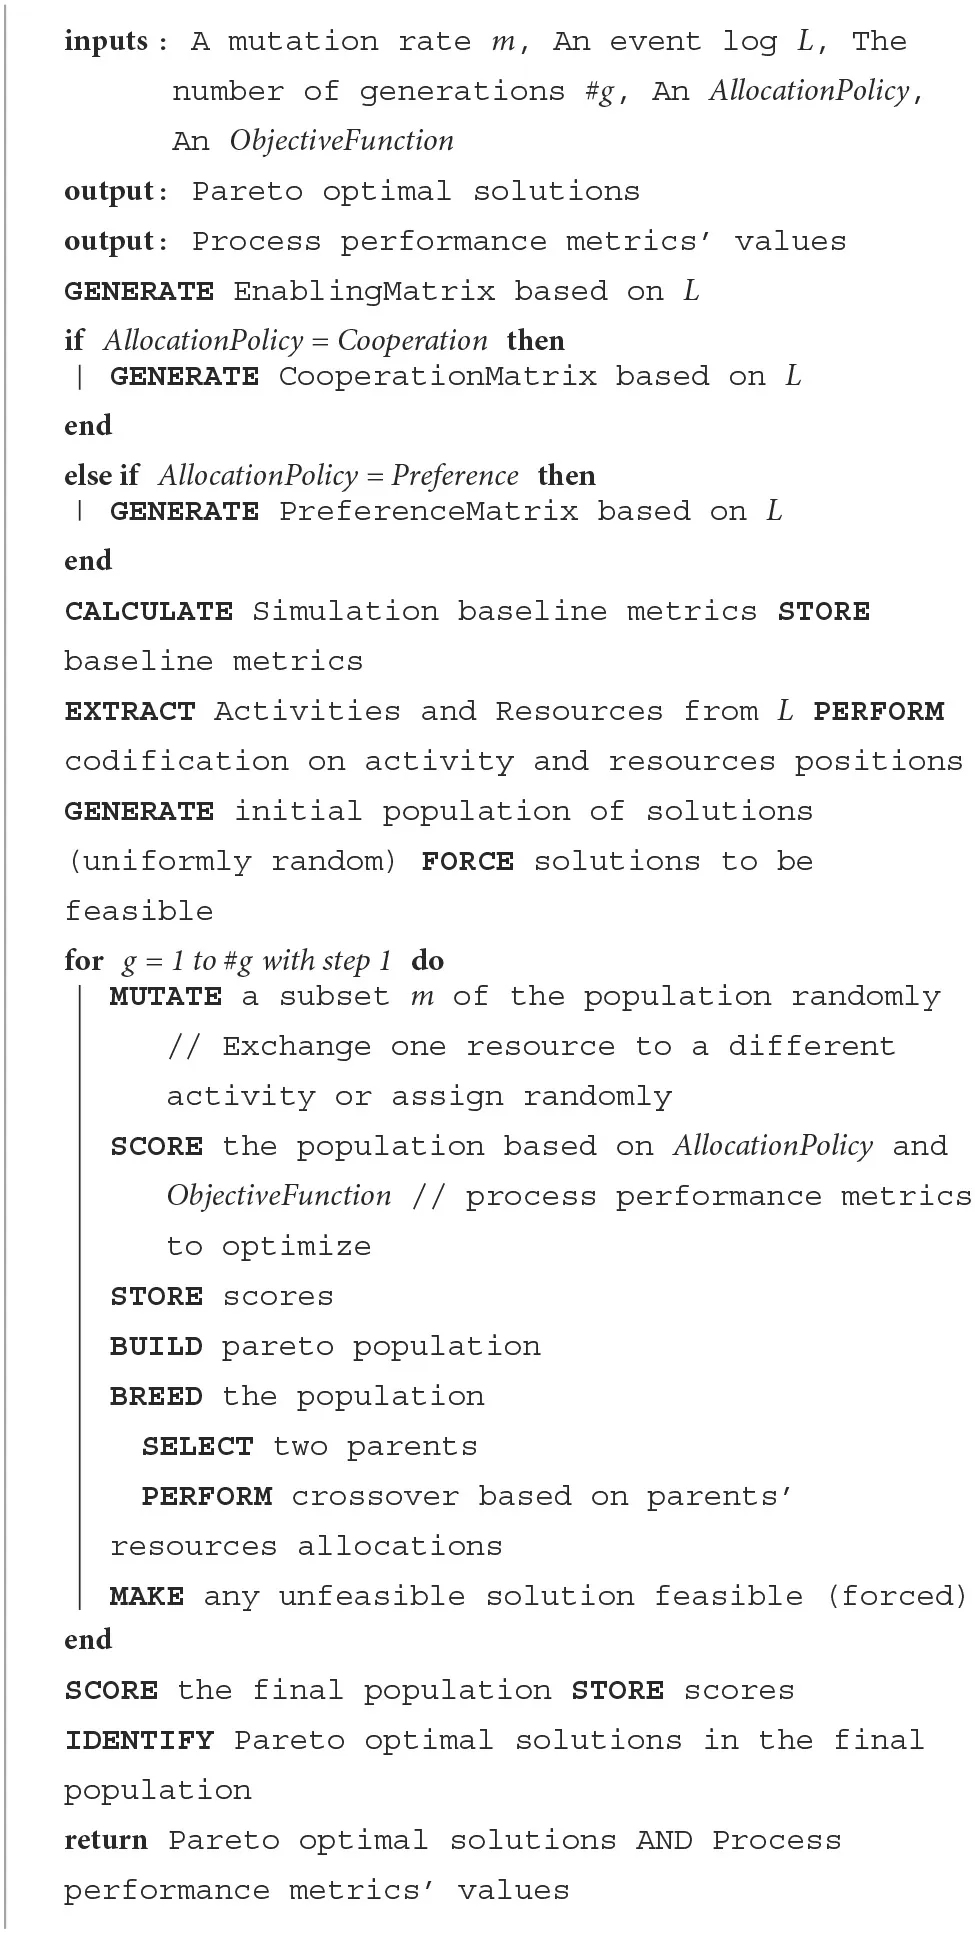 |
Pseudocode of the algorithm to generate optimal what-if scenarios.
The NSGA-II algorithm starts with a population of randomly generated solutions (allocation of resources) and uses crossover and mutation operations to create new solutions in each generation. The algorithm evaluates each solution based on multiple objectives. In SimodR, these correspond to cost, waiting time, flow time, workload, preference, and cooperation. Then, it sorts the solutions into a hierarchy of non-dominated fronts based on their dominance relationships. In general, each generation of the NSGA-II algorithm performs the following steps.
Create a random population of solutions with the size defined by the parameter.
Generate a new population from crossovers between individuals of the original population and mutations on them.
Join the original population with the generated population and calculate the corresponding objective-corresponding functions for each individual of the population.
Identify Pareto fronts (solutions that are not dominated by each other) until the number of selected individuals exceeds the population size received per parameter. Solutions that do not fall within any of the selected Pareto fronts are discarded. The algorithm continues until a stopping criteria (such as convergence) is met, and the best solution(s) are returned as the optimized allocation of resources.
If it happens that the defined population limit is exceeded, the solutions are filtered using the Crowding distance method.
We adapted the NSGA-II algorithm by implementing as set of principles to generate what-if scenarios that change their configuration in terms of resource allocation.
The Diversity principle in SimodR guarantees that the search space to generate optimal solutions is as diverse as possible so that the solutions correspond to a representative sample of all possible solutions. This is in order to increase the possibility that the calculated solution corresponds to a global optimum of the optimization function. SimodR uses a uniform distribution to reproduce a set of candidate solutions, which are subsequently modified to ensure their feasibility. In particular, resources that are not enabled to execute a given activity are swapped for resources that are enabled. The selection of enabled resources is carried out randomly between the list given by the enabling matrix. Diversity is fundamental in genetic algorithms, therefore it is common to find mutation mechanisms that provide diversity and help to avoid that the search space is reduced. Traditionally, a uniform distribution approach has been adopted for initial population generation to extensively explore the solution space without introducing premature biases toward particular regions of the solution space. We acknowledge the potential for the advantageous application of the Monte Carlo method or similar stochastic sampling techniques in NSGA-II population initialization as presented in Rullo et al. (2017). Future work could explore this avenue, particularly in contexts where a clear trend has been identified or empirical evidence has accumulated indicating the solution space structure and the likely location of non-dominated solutions. In the absence of insights indicating a specific statistical distribution associated with the location of non-dominated solutions, the application of the Monte Carlo technique could introduce an undesired bias into the algorithm, deterring the exploration of potentially promising regions of the solution space.
The Elitism principle in SimodR guarantees that non-dominated solutions are reproduced, which represent the trade-off between the objectives. In the implementation, the best solutions from the current generation are directly copied to the next generation, without any modification. This ensures that the best solutions are not lost over time and can be further improved by the algorithm. During the selection process, the algorithm uses a concept called Pareto dominance, which allows it to select the best non-dominated solutions for the next generation. The NSGA-II algorithm sorts the population based on Pareto dominance, and selects solutions from the non-dominated fronts until the population is filled. The non-dominated front refers to a set of non-dominated solutions, where each solution has the same level of dominance, and the first front is the set of all non-dominated solutions.
The Mutation principle in SimodR defines a dynamic mutation probability based on the diversity of the images of the solutions in the population. This is done to avoid having a constant value for the mutation probability (proportion of individuals in the population that will be mutated), This is because it was observed in practice that the solutions can converge easily. Therefore, the mutation probability increases when the population becomes uniform and decreases when the population is diverse. The proportion of individuals to mutate is defined in Equation (6), where s are the population scores, different(s) is the number of distinct solutions and size(s) is the number of solutions.
In a hypothetical scenario in which all solutions are equivalent, the algorithm will mutate 25% of them at last. In general, solutions mutate between 1 and 5%. Each gene in the chromosome represents an activity and the respective allele represents the resource allocated for this activity. This coding makes it possible to ensure that all activities have an assigned resource and that an activity cannot have more than one assigned resource.
Two transition mechanisms were implemented instead of one as in the original version of the algorithm. When a solution is chosen to be mutated randomly and with the same probability, one of the two defined mechanisms is applied:
Exchange of resources between activities: Two different activities are randomly chosen. Subsequently, the resource assigned to one of the activities is assigned to the other and vice versa.
Change of resource in an activity: An activity is randomly selected and the resource assigned to that activity is changed to another randomly selected resource.
3.4. Selection of the what-if scenario that performs better
The NSGA-II algorithm aims to provide a set of Pareto optimal solutions rather than a single solution. Pareto optimality means that no solution can be improved in one objective without worsening at least one other objective. Thus, the final solution should be taken as a set of non-dominated solutions. The set of non-dominated solutions is referred to as the Pareto front or the Pareto set.
The Pareto front is obtained by evaluating the fitness of each individual in the final population and selecting those that are non-dominated. These non-dominated individuals form the Pareto front, which represents the trade-off between the different objectives. The user can then choose the solution that best suits their needs based on the trade-off between the objectives.
4. Validation
The proposed method to configure optimal what-if scenarios was implemented into a tool named SimodR. SimodR takes a PSM as input, which can be generated by any data-driven simulation approach, and automates the generation of PSMs that comply with multi-objective business optimization preferences. We conducted two experiments to address the following research questions:
RQ1 To what extent the resource allocation optimization improves the performance of what-if scenarios?
RQ2 What is the trade-off in performance measures of what-if scenarios when changing allocation policies?
4.1. Datasets
We validated the proposed approach using one synthetic event log and two real-life event logs. The first log used for validation belongs to a manufacturing process (MP) which corresponds to the process described in the case study. The second log corresponds to a purchase-to-pay process (PP) available from the process mining tool Disco1. The process includes 21 activities, 27 resources, and 9,119 events related to 608 cases. The third log corresponds to an Academic Credentials Recognition (ACR) process of a Colombian University and it was obtained from its Business Process Management (BPM) system (Bizagi). This log contains approximately 13,700 events.
These three logs satisfy the requirement of having both a start and end timestamp. The costs associated with each resource for the first two logs were included manually with random values. Table 4 characterizes the logs that were used for validation.
Table 4
| Metric | Manufacturing | Purchase-to-pay | ACR |
|---|---|---|---|
| Events | 4,953 | 9,119 | 13,700 |
| Cases | 225 | 608 | 954 |
| Activities | 24 | 21 | 16 |
| Median case duration | 13.9 days | 11.9 days | 5.31 days |
| Mean case duration | 20.6 days | 21.5 days | 14.9 days |
| Start date | 02.01.2012 00:00:00 | 01.01.2011 00:00:00 | 01.02.2016 13:23:00 |
| End date | 31.03.2012 05:45:00 | 14.10.2011 15:31:00 | 01.07.2016 01:13:00 |
Event logs characterization.
4.2. Experiment 1: optimization in resource allocation
4.2.1. Setup
This experiment compares the impact of utilizing NSGA-II (see Section 3.3) in conjunction with a Single-Objective (SO) optimization function vs. a NSGA-II with a Multi-Objective (MO) optimization function for resource allocation optimization in business processes. The evaluation considers factors such as total cost, flow time, and workload. To assess the effects of resource allocations on these metrics, we utilize the Scylla simulator, which enables individual resource allocation to activities and resource pooling.
For the SO function, we perform three independent runs, each focused on minimizing either flow time, process cost, or waiting time. In contrast, for evaluating the MO function, we execute the tool with a configuration that aims to balance all three objectives simultaneously. As a baseline, we employ the resource pool-based distribution obtained from the unmodified Simod tool. Table 5 summarizes the parameters used to execute SimodR. These parameters were carefully selected to balance processing time while aiming to achieve high-performance solutions across the various metrics. Notably, a maximum processing time of 1 day was set for optimizing each metric within each event log.
Table 5
| Parameter | Value |
|---|---|
| generations | 100 |
| initial_population | 20 |
| min_population | 20 |
| max_population | 40,000 |
Parameters used to execute the experiments.
4.2.2. Results
The results of Experiment 1 are depicted in Figure 3. For the Figure 3 ACR event log, it is evident that the MO optimization produces the most favorable outcomes for the Cost, Flow time, and Waiting time metrics. It also demonstrates comparable results in the Workload metric compared to the SO optimization. It is essential to emphasize that the Workload metric provides insights into the extent of resource utilization, and its interpretation should be contextually linked to the other performance metrics. Elevated resource occupancy is not inherently beneficial if it does not coincide with reductions in cost, flow time, and waiting time. For this reason, although for this log, the workload results of MO optimization are lower than those of SO-Waiting, the overall performance is superior due to the lower cost and comparable flow and waiting times. These findings suggest that resources operate with a somewhat more relaxed disposition while concurrently achieving improved results.
Figure 3
For the Figure 3 MP event log, the MO optimization does not achieve the best results compared to the SO optimization. Nevertheless, MO optimization exhibits a more balanced performance across various metrics. Specifically, the SO-Cost optimization outperforms the Cost metric, the SO-Flow time optimization excels in the Flow time metric, and the SO-Waiting time optimization obtains the least waiting time. The Baseline method, while producing results on par with the SO-optimization methods, notably attains the highest scores in the Workload metric.
In the case of MO optimization, the results portray a trade-off scenario: process cost ranks as the second-best outcome, flow time experiences a slight increase, and waiting time is lower than most other policies. The selection of the most suitable policy in this particular scenario depends on the priority attribute desired by the process owner. For instance, if the emphasis is on minimizing flow time, even at the expense of waiting time, the optimal choice might be SO-Cost, as it achieves these results at a lower cost and maintains a competitive workload. In this context, the Baseline approach achieves similar performance but incurs higher costs and significantly greater resource occupancy.
Conversely, if the goal is to minimize waiting time for the user while keeping costs low, MO optimization emerges as the preferred option, even though it entails a slight increase in flow time. Under these conditions, SO-Waiting, despite delivering the lowest waiting time, is not the best choice, as it sacrifices other key performance indicators. Notably, there appears to be a correlation between waiting time and workload in this log. For MO and SO-Waiting, this correlation suggests that resources may be allocated among activities in a manner that minimizes workload across the activities, consequently reducing waiting times throughout the entire process. Despite the potential for workforce inefficiency, MO optimization maintains a competitive process cost.
Regarding the Figure 3, P2P event log illustrates that the MO optimization performs best in the Cost and Flow time metrics while also exhibiting similar results to the SO optimization in the Waiting time metric. Conversely, the SO Cost optimization maximizes the workload metric. Overall, the analysis of the event logs reveals that the MO optimization yields balanced, highly comparable, and sometimes even superior results when juxtaposed with SO optimization.
In this context, it is noteworthy that the SO-Cost optimization yields the highest Workload metric and generally ranks as the second-worst performer across all other metrics. This phenomenon may be attributed to the exclusive focus on cost minimization, leading to allocating numerous “cheap” resources to tasks that do not alleviate process congestion. Consequently, a bottleneck ensues in certain parts of the process, resulting in an increased workload for some resources. These bottleneck-afflicted resources, in turn, adversely affect both waiting and flow times, ultimately failing to achieve any of the optimization objectives.
4.3. Experiment 2: trade-off analysis of allocation policies
4.3.1. Setup
This experiment investigates the influence of employing different resource allocation strategies on the equilibrium of process metrics. To achieve this objective, we implement three allocation policies: the Cooperation Policy (CP), Preference Policy (PP), and No Policy (NP). These policies are detailed in Section 3.2. The resource allocation strategies are applied to the Multi-Objective (MO) optimization function, which was identified as the best-performing function in the previous experiment.
In this experimental setup, the parameters outlined in the Table 5 were employed. To optimize resource allocation, the initial population was iteratively evolved across multiple generations, resulting in a collection of solutions aligned with the Pareto front. For the different solutions derived from the Pareto front, metrics encompassing cost, flow time, waiting time, and workload were computed. To determine the overall metric associated with each event log, the average of the metrics for each solution within the Pareto front was utilized. Likewise, for each metric within each event log, the values were subjected to normalization, enhancing their visual clarity and facilitating the identification of the optimal trade-off between distinct metrics for each applied policy.
4.3.2. Results
The results associated with Experiment 2 are depicted in Figure 4. This figure compares performance metrics when different policies are employed using MO optimization. Figure 4 (ACR) displays the results related to the ACR event log. It is observed that the No-Policy (NP) achieves the best configuration of results, outperforming the Cost, Waiting time, and Workload metrics. Moreover, it demonstrates close results in the Flow time metric compared to the other policies. Figure 4 (MP) illustrates the results associated with the Manufacturing event log. The NP policy obtains the best results in most metrics, excelling in Cost, Flow time, and Workload, although it performs poorly in the Waiting time metric. Additionally, the Cooperation Policy (CP) shows promising results across the analyzed metrics, providing a good trade-off when considering the overall set of metrics. Figure 4 (P2P) presents the metrics associated with the P2P event log. The NP policy generates the best results for the Cost, Flow time, and Waiting time metrics, albeit achieving the worst result in the Workload metric.
Figure 4
Across the different graphs, it is evident that the NP policy consistently yields better results. However, during the execution of the various experiments, it was observed that the execution time was significantly longer. This is attributed to the larger search space for resource optimization when using the NP policy compared to the other policies. Nevertheless, this issue could potentially be addressed by employing a more efficient optimizer, as the simulation of each configuration contributes to the extended execution time. On the other hand, the graphs illustrate that employing the CP policy leads to more balanced results across the various metrics. This alternative proves to be an interesting option as the trade-off generated by this policy is favorable compared to the NP policy.
4.4. Threats to validity
The experimental evaluation is restricted to two synthetic and one real-life event logs. As such, the generalization of the results is limited. In particular, for all the event logs the costs were incorporated manually, so there is synthetic data that was adapted for testing. The efficacy of the policies suggested in this paper is contingent upon the specific circumstances in which they are enacted. Nevertheless, the policies outlined herein offer a complementary route for investigation that incorporates a more practical and true-to-life setting than those found in previous research.
5. Conclusion
This paper presents a data-driven simulation approach to automatically generating optimal what-if simulation scenarios based on resource behavior patterns from event logs. The method clusters the resources found in the log using three different perspectives related to similarity, preference, and availability of tasks execution. Four allocation policies were defined from these clusters to enable changes in the resource model associated with a PSM and thus to execute resource-based simulations. The generated resource-based PSMs are executed in the Scylla simulator. Moreover, the proposed method finds the optimal simulation scenarios based on PSM configuration that allocates resources from a user-defined optimization function. The target optimization functions seek to reduce the flow times, waiting times, or costs.
The validation of the method using three event logs demonstrates its viability by finding an optimal possible scenario for each proposed objective variable. Likewise, the results presented allow the evaluation of trade-offs of possible scenarios, providing essential support for decision-making on process changes.
The first line of action for future work is to evaluate different algorithms to support multi-objective optimization when creating what-if scenarios. We also plan to adapt and incorporate allocation policies based on Competence, Cooperation, Skills, and Productivity perspectives used in PM (see Section 2.2) into our simulation approach for automating the discovery of optimal what-if scenarios.
Statements
Data availability statement
The source code and the datasets analyzed and generated for this study are included in the article/supplementary material, further inquiries can be directed to the corresponding author.
Author contributions
JB: Investigation, Writing — original draft, Software. DB: Software, Validation, Writing — review & editing. OG-R: Validation, Writing — review & editing, Conceptualization, Investigation, Methodology, Project administration, Resources, Supervision, Writing — original draft. MC: Data curation, Validation, Writing — review & editing.
Funding
The author(s) declare that received financial support for the publication of this article from the Systems and Computing Engineering Department, Universidad de los Andes, Bogotá, Colombia.
Conflict of interest
MC was employed by Apromore. The remaining authors declare that the research was conducted in the absence of any commercial or financial relationships that could be construed as a potential conflict of interest.
Publisher’s note
All claims expressed in this article are solely those of the authors and do not necessarily represent those of their affiliated organizations, or those of the publisher, the editors and the reviewers. Any product that may be evaluated in this article, or claim that may be made by its manufacturer, is not guaranteed or endorsed by the publisher.
Footnotes
1.^Available at: http://fluxicon.com/academic/material/.
References
1
AugustoA.ConfortiR.DumasM.RosaM. L. (2017). “Split miner: Discovering accurate and simple business process models from event logs,” in IEEE International Conference on Data Mining (ICDM) (New Orleans, LA: IEEE), 1–10.
2
BocciarelliP.D'AmbrogioA.GiglioA.PagliaE. (2016). “A BPMN extension to enable the explicit modeling of task resources,” in CEUR Workshop Proceedings (Turin), 40–47.
3
CabanillasC.ResinasM.Ruiz-CortésA. (2011). “Defining and analyzing resource assignments in business processes with RAL,” in Service-Oriented Computing, eds G. Kappel, Z. Maamar, and H. R. Motahari-Nezhad (Berlin; Heidelberg: Springer), 477–486.
4
CamargoM.DumasM.González-RojasO. (2020). Automated discovery of business process simulation models from event logs. Decis. Support Syst.134, 113284. 10.1016/j.dss.2020.113284
5
DebK.PratapA.AgarwalS.MeyarivanT. (2002). A fast and elitist multiobjective genetic algorithm: NSGA-II. IEEE Trans. Evol. Comput.6, 182–197. 10.1109/4235.996017
6
DumasM.La RosaM.MendlingJ.ReijersH. A. (2018). Fundamentals of Business Process Management. Berlin; Heidelberg: Springer.
7
DuránF.RochaC.SalaünG. (2019). “Analysis of resource allocation of BPMN processes,” in Service-Oriented Computing, eds S. Yangui, R. I. Bouassida, K. Drira, and Z. Tari (Cham: Springer), 452–457.
8
HuangZ.LuX.DuanH. (2012). Resource behavior measure and application in business process management. Expert Syst. Appl.39, 6458–6468. 10.1016/j.eswa.2011.12.061
9
IhdeS.PufahlL.LinM.-B.GoelA.WeskeM. (2019). “Optimized resource allocations in business process models,” in Business Process Management Forum (Cham: Springer), 55–71.
10
KuchařŠ.VondrákI. (2016). Automatic allocation of resources in software process simulations using their capability and productivity. J. Simul.10, 227–236. 10.1057/jos.2015.8
11
LevyD. (2014). Production Analysis With Process Mining Technology. NooL - Integrating People & Solutions. Available online at: https://data.4tu.nl/articles/_/12697997/1
12
López-PintadoO.DumasM.YerokhinM.MaggiF. M. (2021). “Silhouetting the cost-time front: multi-objective resource optimization in business processes,” in Business Process Management Forum, eds A. Polyvyanyy, M. T. Wynn, A. Van Looy, and M. Reichert (Cham: Springer), 92–108.
13
MartinN.DepaireB.CarisA.SchepersD. (2020). Retrieving the resource availability calendars of a process from an event log. Inform. Syst.88, 101463. 10.1016/j.is.2019.101463
14
PikaA.WynnM. T.FidgeC. J.ter HofstedeA. H. M.LeyerM.van der AalstW. M. P. (2014). “An extensible framework for analysing resource behaviour using event logs,” in Advanced Information Systems Engineering, eds M. Jarke, J. Mylopoulos, C. Quix, C. Rolland, Y. Manolopoulos, H. Mouratidis, and J. Horkoff (Cham: Springer), 564–579.
15
RozinatA.MansR. S.SongM.van der AalstW. M. P. (2009). Discovering simulation models. Inform. Syst.34, 305–327. 10.1016/j.is.2008.09.002
16
RulloA.SerraE.BertinoE.LoboJ. (2017). “Shortfall-based optimal placement of security resources for mobile iot scenarios,” in Computer Security – ESORICS 2017, eds S.N. Foley, D. Gollmann, and E. Snekkenes (Cham: Springer), 419–436.
17
RussellN.AalstW.TerA.EdmondD. (2005). “Workflow resource patterns: identification, representation and tool support,” in Advanced Information Systems Engineering, eds O. Pastor and J. Falcão e Cunha (Berlin; Heidelberg: Springer), 216–232.
18
SchonigS.CabanillasC.JablonskiS.MendlingJ. (2016). A framework for efficiently mining the organisational perspective of business processes. Decis. Support Syst.89, 87–97. 10.1016/j.dss.2016.06.012
19
SiY. W.ChanV. I.DumasM.ZhangD. (2018). A petri nets based generic genetic algorithm framework for resource optimization in business processes. Simul. Modell. Pract. Theory86, 72–101. 10.1016/j.simpat.2018.05.004
20
SongM.van der AalstW. M. P. (2008). Towards comprehensive support for organizational mining. Decis. Support Syst.46, 300–317. 10.1016/j.dss.2008.07.002
21
ThevendranV.MawdesleyM. J. (2004). Perception of human risk factors in construction projects: an exploratory study. Int. J. Project Manage.22, 131–137. 10.1016/S0263-7863(03)00063-2
22
VasilecasO.LaureckasE.RimaA. (2014). Analysis of using resources in business process modeling and simulation. Appl. Comput. Syst.16, 19–25. 10.1515/acss-2014-0009
23
WolterC.SchaadA. (2007). “Modeling of task-based authorization constraints in BPMN,” in Business Process Management, eds G. Alonso, P. Dadam, and M. Rosemann (Berlin; Heidelberg: Springer), 64–79.
Summary
Keywords
data-driven simulation, what-if analysis, resource allocation, optimization, NSGA-II
Citation
Bejarano J, Barón D, González-Rojas O and Camargo M (2023) Discovering optimal resource allocations for what-if scenarios using data-driven simulation. Front. Comput. Sci. 5:1279800. doi: 10.3389/fcomp.2023.1279800
Received
18 August 2023
Accepted
10 October 2023
Published
02 November 2023
Volume
5 - 2023
Edited by
Fernando Yepes-Calderon, Science Based Platforms LLC, United States
Reviewed by
Andres Montano, Universitat Politecnica de Catalunya, Spain; Antonino Rullo, University of Calabria, Italy
Updates
Copyright
© 2023 Bejarano, Barón, González-Rojas and Camargo.
This is an open-access article distributed under the terms of the Creative Commons Attribution License (CC BY). The use, distribution or reproduction in other forums is permitted, provided the original author(s) and the copyright owner(s) are credited and that the original publication in this journal is cited, in accordance with accepted academic practice. No use, distribution or reproduction is permitted which does not comply with these terms.
*Correspondence: Oscar González-Rojas o-gonza1@uniandes.edu.co
Disclaimer
All claims expressed in this article are solely those of the authors and do not necessarily represent those of their affiliated organizations, or those of the publisher, the editors and the reviewers. Any product that may be evaluated in this article or claim that may be made by its manufacturer is not guaranteed or endorsed by the publisher.