 Fang Zhao
 Dongming Xiang
 Guanjun Liu
- 1School of Microelectronics and Data Science, Anhui University of Technology, Maanshan, China
- 2School of Computer Science and Technology, Zhejiang Sci-Tech University, Hangzhou, China
- 3Key Laboratory of the Ministry of Education for Embedded System and Service Computing, Department of Computer Science and Technology, Tongji University, Shanghai, China
- 4Shanghai Electronic Transactions and Information Service Collaborative Innovation Center, Tongji University, Shanghai, China
Introduction: How to measure the trace consistency between process models in workflow net systems have become a crucial part of process mapping, process integration, and difference testing. Workflow net with data (WFD-net) is an effective language to describe a complete model of a workflow net system. Checking their trace consistency is a significant challenge in service-based software engineering. However, most of the existing research on trace consistency measurement has not taken the data into consideration. Therefore, they cannot accurately calculate the trace consistency degree of two WFD-net systems, especially when data operations and guard functions are complex.
Methods: We explore all traces in two WFD-net systems based on guard analysis and data dependencies.
Results: We point out that the trace consistency degree is uncertain when the values of guard functions are considered.
Discussion: We conduct experiments to evaluate our method and show its effectiveness.
1. Introduction
Nowadays, business process models with data are very important in the development of business process systems (Song et al., 2016). They are very effective in reflecting the relations of activities. Here, we mainly focus on studying workflow net systems, which can be used to automate, optimize, and manage these business process models. They have become a major way to construct business processes in software systems (IEEE, 1990; Song et al., 2018). Software designers and business analysts may simulate workflows in the same granularity standards but with different extra activities (i.e., activities without correspondences). Meanwhile, service-based workflow net systems become more and more extensive, and the traces (i.e., firing sequences of transitions) of a system may be affected by data. Therefore, we should provide an effective way to measure the trace consistency of these workflow net systems.
Many models can be taken to describe workflow net systems, i.e., UML activity diagram (Fahland, 2008), Business Process Modeling Notation (BPMN) (van der Aalst et al., 2010; Zhu et al., 2014; Assy et al., 2015), Business Process Execution Language (BPEL) (Weidlich et al., 2014), Event-driven Process Chain (EPC) (Dijkman et al., 2011; Li et al., 2014), and Workflow net with data (WFD-net) (Trcka et al., 2009; Sidorova et al., 2011). Unfortunately, the first four modeling languages have not taken the delete operations into consideration. Compared with these modeling methods, WFD-net is a workflow net with data operations and guard functions. Therefore, we use WFD-net as an adequate formalism to model workflow net systems (Trcka et al., 2009; Sidorova et al., 2011) to analyze the trace consistency in this paper.
At present, many methods are used to measure the trace consistency degree, e.g., DTC (Degree of Trace Consistency) (Weidlich et al., 2011) and CDAT (Consistency Degree of Aligned Traces) (Wang et al., 2018). Based on the sets of projected firing sequences, the first method can be used to obtain the trace consistency degree of two models without data. Based on the direct dependence relations and independence relations on transitions, the second method is used to calculate the trace consistency degree of two traces. Moreover, these methods only considered transitions with correspondence relations, while those without correspondence relations are ignored. However, they may affect the traces of transitions with correspondences. Therefore, these methods are ambiguous and cannot reflect the real traces in two models, especially when there are guard functions and data dependencies. They cannot accurately assess the trace consistency degree of systems with data information. Furthermore, calculating the trace consistency degree would require a lot of work, e.g., if there are k concurrently-executed transitions in a process, then there are k! different traces at most. Therefore, calculating the trace consistency degree would require a lot of work.
To solve these problems, a new behavioral profile relation is defined based on weak behavioral relations, guard functions, control and data dependency. After then, the formalization of correspondence relation and projected firing sequence are provided. Finally, we develop a new method to calculate trace consistency degree.
The contributions of this paper are shown in the following:
1) We reveal that the trace consistency degree of two WFD-net systems is non-uniqueness when their guard functions are uncertain since these guard functions may affect the real traces.
2) We point out that transitions without correspondence relations but with data dependencies should not be ignored as they may affect the traces of the systems.
3) We minimize the number of traces in WFD-net systems based on guard functions and data dependencies.
The rest of this paper is arranged as follows. Section 2 introduces some basic concepts used in this paper and provides a motivating example. Section 3 defines control dependency, data dependency and behavioral profile relations, order relation, firing sequence, trace, correspondence relation, projected firing sequence and trace consistency measurement method. Section 4 presents experiments to show that guard functions and data dependencies can affect the traces in WFD-net systems. Section 5 reviews the related work about the existing consistency measurement methods. Section 6 concludes this paper and presents future work.
2. Preliminaries and motivation
In this section, we first introduce some concepts about WF-net, weak order relation, weak behavioral profile, and WFD-net. Some symbols are demonstrated in Table 1. The related details can be found in Li and Liu (2009), Weidlich and van der Werf (2012), Liu et al. (2017), Liu et al. (2018), Xiang et al. (2021), and Zhao et al. (2022a). Furthermore, a motivating example is given.
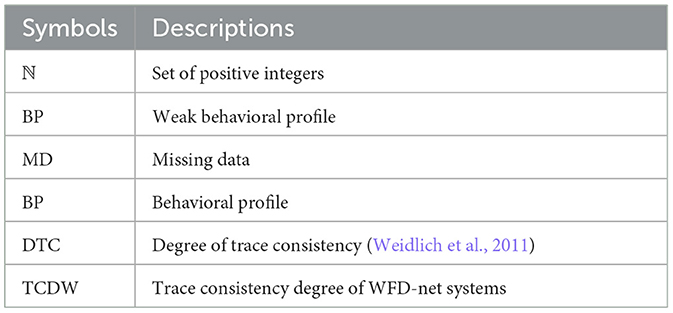
Table 1. Common symbols used in this paper.
2.1. Preliminaries
A Petri net N = (P, T, F) as a tool is often used to simulate and analyze the trace (i.e., firing sequences of transitions) of a workflow system (Liu et al., 2019; Zhang et al., 2022), where P is a finite non-empty set of places, T is a finite non-empty set of transitions, P ∩ T = ∅, and F ⊆ (P × T) ∪ (T × P) is a set of arcs. Given a node x ∈ P ∪ T, the preset of x is ·x = {y|(y ∈ P ∪ T) ∩ (y, x) ∈ F}, and the post-set of x is x· = {y|(y ∈ P ∪ T) ∩ (x, y) ∈ F}. If x is the initial place, it must satisfy ·x = ∅; If x is the final place, it must satisfy x· = ∅. Given a set of nodes X ⊆ P ∪ T and x ∈ X, the preset of X is denoted by ·X, and the post-set of X is denoted by X·, where ·X = {Y|(Y ⊆ P ∪ T) ∧ (y ∈ Y) ∧ (y, x) ∈ F} and X· = {Y|(Y ⊆ P ∪ T) ∧ (y ∈ Y) ∧ (x, y) ∈ F}. In Figure 1A, if X = {t5, t6}, we have , and . If we use k to denote the preset number, then we have , and k = 1 (resp. ) = {p4}, and k = 3). For the post-set number of X, it can be defined analogously.
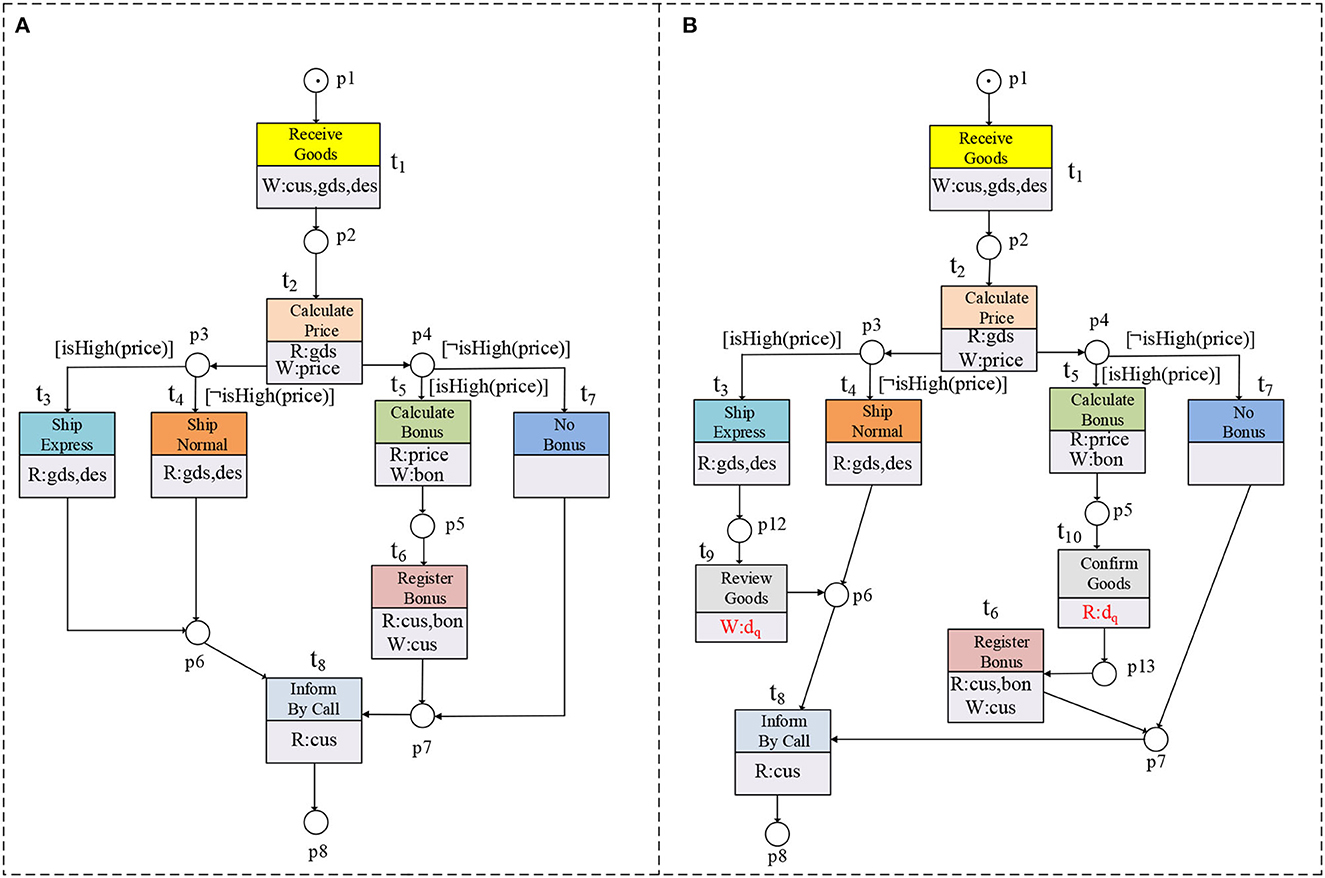
Figure 1. Two shipper process models are shown in (A, B). There are no correspondences of t9, t10, and dq in (B).
The following parts present the workflow net (WF-net), as a special Petri net satisfying the following conditions (Liu et al., 2013).
Definition 1 [WF-net (Liu, 2014, 2022)]. Let N = (P, T, F) be a workflow net (WF-net), if the following conditions hold:
(1) There exists only one place pi ∈ P as begin and only one place po ∈ P as end in N; and
(2) The short-circuit net is strongly connected, where t′ ∉ T.
A WF-net system (N, M0) is a WF-net extended with an initial marking M0. The dynamic behaviors of workflow systems are decided by distributing different markings. Figures 1A, B depict two WF-net systems if the guard functions and data operations are ignored.
In general, we can distinguish three basic weak behavioral relations between transition pairs in a WF-net system, and they are based on the concept of weak order relation (Weidlich et al., 2011).
Definition 2 [Weak order relation (Weidlich et al., 2011; Zhao et al., 2022b)]. Given a WF-net system (N, M0) = (P, T, F, M0), the weak order relation ≻c ⊂ T × T contains transition pairs tx, ty ∈ T, there exists a weak firing sequence σ = t1t2 ⋯ tn(n ∈ ℕ) with (N, M0)[σ >, x ∈ {1, 2, ⋯ , n − 1}, and x < y ≤ n.
For the example of Figure 1A, we have t1 ≻c t2 and t2 ⊁c t1. The set of all weak firing subsequences is denoted by T*, and , where σ(ε) = tx1 tx2 ⋯ txε, and tx1, tx2, ⋯ , txε ∈ T.
Based on the above definitions, weak behavioral profile between two transitions is shown in the following.
Definition 3 [Weak behavioral profile, bp (Weidlich et al., 2011)]. Given a WF-net system (N, M0) = (P, T, F, M0), a pair of transitions tx, ty ∈ T is in one of the following relations, where k ∈ {1, 3, ⋯ , n}, n = 2m − 1, and m ∈ ℕ:
(1) Weak strict order relation (tx →c ty), if (tx ≻c ty) ∧ (ty ⊁c tx);
(2) Weak exclusiveness relation (tx +c ty), if (tx ⊁c ty) ∧ (ty ⊁c tx); or
(3) Weak interleaving order relation (tx ∥c ty), if (tx ≻c ty) ∧ (ty ≻c tx). It contains the following two kinds:
1) Weak circulation relation (tx ↔c ty), if ; or
2) Weak concurrency relation (tx ⇄c ty), if .
The above relations comprise the weak behavioral profile of (N, M0), denoted as bp = {bp1, bp2, bp3}, where bp1 = →c, bp2 = +c, and bp3 = ∥c. As for the inverse order relation of bp1 [i.e., (tx ⊁c ty) ∧ (ty ≻c tx)], we denote it as or bp−1. If tx →c ty, then we have or (ty, tx) = bp−1. The weak behavioral profile relation is also called weak behavioral relation in this paper. In Figure 1A, we have t1 →c t2, t3 +c t4, and t3 ∥c t5. They are denoted as (t1, t2) = bp1, (t3, t4) = bp2, and (t3, t5) = bp3, respectively.
A workflow net with data (WFD-net) is a WF-net with every transition t ∈ T labeled with four elements at most:
(1) Some data items need to be read before firing t;
(2) Some data items would be written after firing t;
(3) Some data items may be deleted after firing t;
(4) Some data items may be the guard functions of t (optional).
The update of data items can be seen as the combination of read/write operations on transitions. Furthermore, writing a data item on a transition for the first time can be known as creating the data item. We also assume that there are no read operations or guard functions on the initial transition (Trcka et al., 2009; Sidorova et al., 2011).
Definition 4 [WFD-net (Trcka et al., 2009; Sidorova et al., 2011)]. A WFD-net ND = (P, T, F, D, Guard, R, W, De, Gd) is a workflow net (WF-net) extended with data, it consists of the following:
(1) (P, T, F) is a WF-net;
(2) D is a different set of data items;
(3) Guard is a set of guards over D;
(4) R : T → 2D is the read operation set;
(5) W : T → 2D is the write operation set;
(6) De : T → 2D is the delete operation set; and
(7) Gd : T → Guard is a function that assign guards to transitions.
A WFD-net system is a WFD-net with an initial marking M0, it can be denoted as (ND, M0) = (P, T, F, M0, D, Guard, R, W, De, Gd). In the following, all workflow systems are in the form of WFD-net systems. Figures 1A, B depict two WFD-net systems.
2.2. Motivating example
This subsection takes two shipper process models as a motivating example to illustrate our work, as shown in Figures 1A, B. There are 5 same data items in these figures (i.e., cus, gds, des, price, and bon, where cus denotes the data of customers, gds stands for the data of goods, des represents the destination of goods, price means the price of goods, and bon denotes the bonus), and the set of guards is Guard = {isHigh(price), ¬isHigh(price)}. For the transition t5, its data operations and guard function are R(t5) = {price}, W(t5) = {bon}, De(t5) = ∅, and Gd(t5) = {isHigh(price)}, respectively.
Figure 1A describes a shipper process model in the shape of a WFD-net system. Firstly, shippers receive goods from customers and write 3 data items, i.e., the data of customers and goods, and the destination of goods. Then, shippers should calculate the price by reading the data of goods and generating the price. Afterwards, customer advisers and shipment departments execute their tasks concurrently. If the goods' price is high, express shipment is used by reading the data of goods and the destination of the goods. Under the same condition, customer advisors calculate the bonus for customers by reading the price and producing the bonus. If the price of goods is not high, normal shipment is taken by reading the data of goods and the destination of goods, and there is no bonus to calculate. If the customer advisors calculate the bonus for customers, then they should register the bonus by reading the data of customers and the bonus as well as generating new data of customers. At last, customers who send goods are informed by call.
Figure 1B shows a similar model to Figure 1A. However, there are some extra transitions (i.e., t9 and t10) and data items (i.e., dq) without any correspondences in Figure 1B. The transition t9 represents Review Goods, the transition t10 denotes Confirm Goods, and the data item dq stands for the quality of the goods.
The method of DTC ignores those transitions without correspondence, e.g., t9 and t10 in Figure 1B. Therefore, the method of DTC is insensitive to these extended elements, and the trace consistency degree of Figures 1A, B computed by this method is 1. This result means that the traces in the above figures are the same. However, these extensions may produce data dependencies (cf. Def. 6) and affect the real traces. Therefore, the DTC method may be inappropriate for analyzing the real trace consistency degrees of WFD-net systems.
3. Trace consistency measurement based on data and behavioral profiles
Before introducing the trace consistency degree of two WFD-net systems, we present control dependency and data dependency of transition pairs in this section. Then, we illustrate trace and trace consistency degree.
Definition 5 (Control dependency). Given two transitions tx and ty in (ND, M0), tyis control-dependent on tx if tx →c ty.
When the specific read/delete operation of a transition is derived from the write operation of another transition, we say there exists a data dependency. The data dependency may affect the traces in a model. The specific details are shown as follows.
Definition 6 (Data dependency). Given two transitions tx and ty in (ND, M0), ty is data-dependent on tx (i.e., tx →c ty) if:
(1) There exists a data item d ∈ D:[d ∈ W(tx) ∩ (R(ty) ∪ Gd(ty))] ∧ [d ∉ De(tx)]; and
(2) There is no transition tw enabled between tx and ty, such that d ∈ W(tw) ∪ De(tw).
Let tx and ty be a pair of transitions derived from (ND, M0). The control dependency indicates there is a weak strict order relation such that tx →c ty. In Figures 1A, B, we have t1 →c t2. The control dependency satisfies the transitivity. That is, if (tx →c ty) ∧ (ty →c tr), then we have tx →c tr. A transition ty is data-dependent on another transition tx implies that ty reads/deletes a data item written by tx. If there is no data dependency between tx and ty, then we have tx ∥d ty. In Figure 1B, t10 is data-dependent on t9 as dq ∈ W(t9) ∩ R(t10) and there is no transition tw enabled between t9 and t10, such that dq ∈ W(tw) ∩ De(tw).
Definition 7 [Distance between transitions in weak circulation relation (Zhao et al., 2022a)]. Let (ND, M0) = (P, T, F, M0, D, Guard, R, W, De, Gd) be a WFD-net system, , and , where t is a transition outside the weak circulation relation with tx and ty, k1 and k2 are the minimum number of post-sets, such that k1, k2 ∈ {2, 4, ⋯ , 2m}, and m ∈ ℕ. The distance between tx and ty is defined as δ[ty, tx] = k2 − k1.
For the example of Figure 2A, we have tx ↔c ty, and δ[ty, tx] = k2 − k1 = 2.
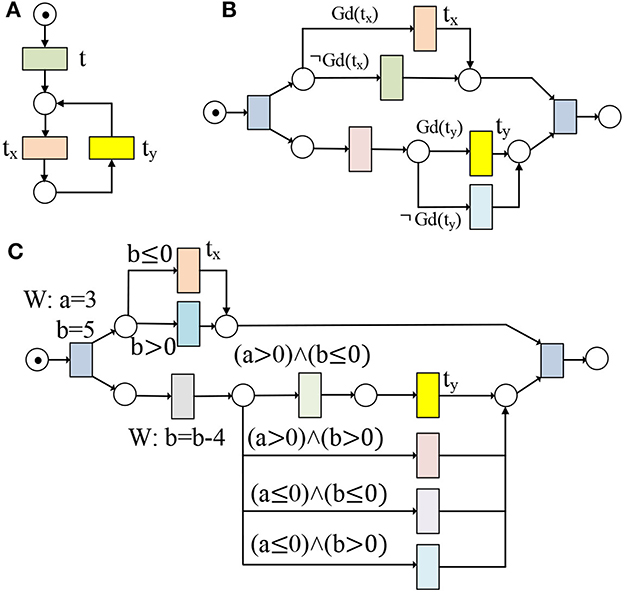
Figure 2. (A) tx and ty are in weak circulation relation (i.e., tx ↔c ty); (B, C) The behavioral relation of tx and ty depends on their guard functions.
3.1. Transition pairs behavioral relations in a WFD-net system
Before formalizing the relation of transitions tx and ty in a WFD-net system, we first explain some relevant symbols as follows:
(1) Rel(Gd(tx)) (resp. Rel(Gd(ty))) is the set of data items in guards related to tx (resp. ty), and Rel(Gd(tx(d))) (resp. Rel(Gd(ty(d)))) is the value of d in guards related to tx (resp. ty); and
(2) Γ(Rel(Gd(tx))) (resp. Γ(Rel(Gd(ty)))) is the set of final values of data items in Rel(Gd(tx))(resp. Rel(Gd(ty))), and Γ(Rel(Gd(tx(d))))(resp. Γ(Rel(Gd(ty(d)))) is the final value of d in Rel(Gd(tx))(resp. Rel(Gd(ty))).
For the transition ty in Figure 2C, we have
(1) Rel(Gd(ty)) is {a, b}, and Rel(Gd(ty(a)))(resp. Rel(Gd(ty(b))) is a > 0 (resp. b ≤ 0) in guards related to ty; and
(2) Γ(Rel(Gd(ty))) is the set of final values of {a, b} in Rel(Gd(ty)), and Γ(Rel(Gd(ty(a))))(resp. Γ(Rel(Gd(ty(b)))) is a = 3 (resp. b = 5 − 4 = 1) in Rel(Gd(ty)).
The transition pairs' behavioral relations in a WFD-net system depend on their weak behavioral relations, data dependencies, and guard functions. The following behavioral relations compose the behavioral profile of a WFD-net system.
Definition 8 (Behavioral profile, BP). Given a WFD-net system (ND, M0) = (P, T, F, M0, D, Guard, R, W, De, Gd) and a pair of transitions tx,ty ∈ T, we have
(1) Strict order relation (tx →cd ty), if
1) (tx →c ty) ∧ [(tx →d ty) ∨ (tx ∥d ty)]; or
2) (tx ⇄c ty) ∧ (tx →d ty).
(2) Exclusiveness relation (tx +cd ty), if
1) (tx +c ty) ∧ (tx ∥d ty);
2) If (tx ∥d ty) ∨ (tx →c ty) ∨ (ty →c tx), ∃d:d ∈ Rel(Gd(tx)) ∩ Rel(Gd(ty)), and [Rel(Gd(tx(d))) ∩ Γ(Rel(Gd(tx(d)))) = ∅] ∨ [Rel(Gd(ty(d))) ∩
Γ(Rel(Gd(ty(d)))) = ∅];
3) If tx ⇄c ty, ∃d:d ∈ Rel(Gd(tx)) ∩ Rel(Gd(ty)), and Rel(Gd(tx(d))) ∩ Rel(Gd(ty(d))) = ∅.
or
(3) Interleaving order relation (tx ∥cd ty). It can be divided into the following two kinds:
1) Circulation relation (tx ↔cd ty), if (tx ↔c ty) ∧ [(tx ∥d ty) ∨ ((δ[ty, tx] ≥ 0) ∧ (tx →d ty))]; or
2) Concurrency relation (tx ⇄cd ty), if
i) tx ⇄c ty and ∄d:d ∈ Rel(Gd(tx)) ∩ Rel(Gd(ty)); or
ii) tx ⇄c ty, Rel(Gd(tx)) ∩ Rel(Gd(ty)) = {𝔇}, and ∀d ∈ 𝔇:[Rel(Gd(tx(d))) ∩ Γ(Rel(Gd(tx(d)))) ≠ ∅] ∧ [Rel(Gd(ty(d))) ∩ Γ(Rel(Gd(ty(d)))) ≠ ∅]°
These relations constitute the behavioral profile of (ND, M0), denoted as BP = {BP1, BP2, BP3}, where BP1 = →cd, BP2 = +cd, and BP3 = ∥cd. We use BP−1 or to show the inverse order relation of BP1. It's worth noting that each transition pair can be in a single behavioral relation.
As we know, Rel(Gd(t3(price))) = Rel(Gd(t5(price))) = Rel(Gd(t6(price))) = {[isHigh(price)]} and Rel(Gd(t4(price))) = Rel(Gd(t7(price))) = {[¬isHigh(price)]}. Therefore, we have Rel(Gd(t3(price))) ∩ Rel(Gd(t7(price))) = ∅, Rel(Gd(t4(price))) ∩ Rel(Gd(t5(price))) = ∅, and Rel(Gd(t4(price))) ∩ Rel(Gd(t6(price))) = ∅. According to Def. 8, we have (t3, t7) = (t4, t5) = (t4, t6) = BP2, and (t3, t5) = (t4, t7) = BP3 in Figures 1A, B after taking these guard functions into consideration. Without considering data dependencies of transitions without correspondences, we have (t3, t6) = BP3 in Figures 1A, B. After considering the data item dq, we know dq ∈ W(t9) ∩ R(t10), and t9 →cd t10 as t10 is data-dependent on t9 in Figure 1B. Therefore, we have (t3, t6) = BP3 in Figure 1A and (t3, t6) = BP1 in Figure 1B. In Figure 2B, if there exists no data item d satisfying d ∈ Rel(Gd(tx)) ∩ Rel(Gd(ty)), then we have tx ⇄cd ty.
Definition 9 (Order relation). Let (ND, M0) = (P, T, F, M0, D, Guard, R, W, De, Gd) be a WFD-net system, the order relation tx ≻ ty includes transitions tx and ty satisfying one of the following conditions:
(1) tx →c ty;
(2) tx ⇄c ty;
(3) (tx ↔c ty) ∧ (δ[ty, tx]≥ 0).
If some transitions lack data dependencies, there is a missing data. Based on the above relation, we further formalize missing data.
Definition 10 (Missing data, MD). Given a WFD-net system (ND, M0) = (P, T, F, M0, D, Guard, R, W, De, Gd), T* is the set of all weak firing subsequences, ∃σ ∈ T*, and . A data item d ∈ D is missing if one of the following conditions is satisfied:
(1) ∃ty ∈ T, ∀tx ∈ σ:(tx ≻ ty) ∧ [((d ∉ W(tx)) ∧ (d ∈ De(tx) ∪ R(ty))) ∨ ((d ∉ W(tx) ∪ W(ty)) ∧ (d ∈ De(ty)))], which is denoted by d ⋖ MD; or
(2) ∃tx ∈ σ, ∃tz ∈ T, ∀ ty ∈ T:(tx ≻ tz) ∧ (tx ≻ ty) ∧ (ty ≻ tz) ∧ [d ∈ W(tx) ∩ (De(tx) ∪ De(ty)) ∩ (R(tz) ∪ De(tz))] ∧ (d ≶ R(ty)) ∧ [d ∉ W(ty) ∪ W(tz)], which is denoted by d ⋖ MD, where d ≶ R(ty) denotes d ∈ R(ty) or d ∉ R(ty).
A missing data appears when a data item is read or deleted but not written before (Meda et al., 2010), as shown in Figures 3A–D. This error may affect the trace (Def. 12) in a WFD-net system. If the missing data is not an ending error, we can analyze the trace consistency of two WFD-net systems. As shown in Figure 3B, we have t3 →cd t2 as t2 is data-dependent on t3.
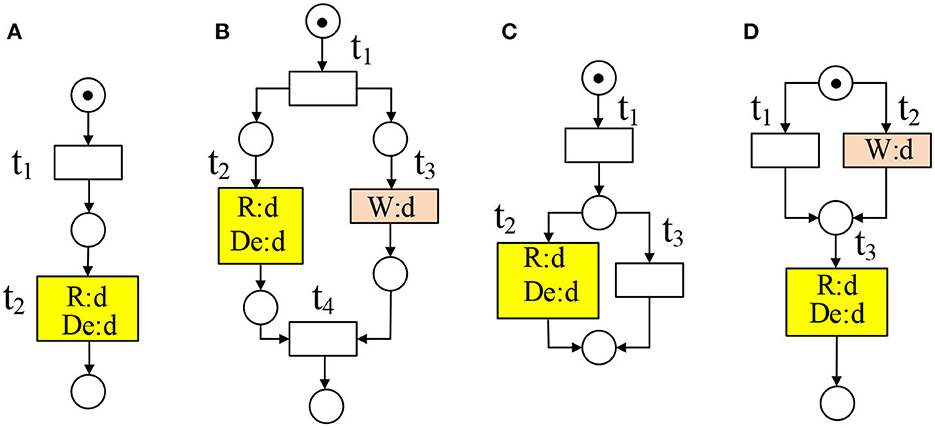
Figure 3. d is a missing data in (A–D).
Notice that, if [(tx →c ty) ∧ (ty →d tx)] ∨ [(tx +c ty) ∧ ((tx →d ty) ∨ (ty →d tx))] ∨ [(tx ↔c ty) ∧ (δ[ty, tx] > 0) ∧ (ty →d tx)], there is a missing data. When the missing data is an ending error, there is no point in analyzing the traces in two WFD-net models.
3.2. Firing sequence and traces in a WFD-net System
Before defining the trace, we present the definition of firing sequence.
Definition 11 (Firing sequence). Given a WFD-net system (ND, M0) = (P, T, F, M0, D, Guard, R, W, De, Gd), σi = t1t2 ⋯ tn(n ∈ ℕ) is a firing sequence in (ND, M0) if
(1) tx →cd ty, where 1 ≤ x < y ≤ n; or
(2) tx ∥cd ty, where 1 ≤ x < y ≤ n.
If tx →cd ty, then we denote it as txty. If tx ∥cd ty, then we denote it as {(tx)(ty)}. If tx ∥cd ty, tx ∥cd tr, and ty →cd tr, then we denote it as {(tx)(tytr)}. As shown in Figure 1A, t1t2{(t4)(t7)}t8 is a firing sequence.
Definition 12 (Trace). Given a WFD-net system (ND, M0) = (P, T, F, M0, D, Guard, R, W, De, Gd), a trace in (ND, M0) is a firing sequence σi = t1t2 ⋯ tn(n ∈ ℕ). The set of all traces is defined as , where k is the number of traces.
The definition of a trace depends on the firing sequence, and there is no circulation relation by default. For the example of Figure 1A, the traces are t1t2{(t3)(t5t6)}t8 and t1t2{(t4)(t7)}t8. After then, we provide a way to compute the trace consistency degree of two WFD-net systems.
3.3. Trace consistency measurement method
Before providing the trace consistency measurement method, we must introduce correspondence relation and projected firing sequence in WFD-net systems. The correspondence relation of two WFD-net systems relates their transitions to each other. In the following, we formalize the correspondence relation.
Definition 13 [Correspondence relation (Weidlich et al., 2011)]. Let (ND1, M01) = (P1, T1, F1, M01, D1, Guard1, R1, W1, De1, Gd1) and (ND2, M02) = (P2, T2, F2, M02, D2, Guard2, R2, W2, De2, Gd2) be two WFD-net systems. The non-empty correspondence relation ~⊆ T1 × T2 aligns (ND1, M01) and (ND2, M02) by relating corresponding transitions to each other. is a set of transitions with correspondences in (ND1, M01) satisfying . The set for (ND2, M02) is defined analogously.
For the examples of Figures 1A, B, the set of transitions with correspondences in Figure 1A is .
Definition 14 [Projected firing sequence (Weidlich et al., 2011)]. Let (ND1, M01) = (P1, T1, F1, M01, D1, Guard1, R1, W1, De1, Gd1) and (ND2, M02) = (P2, T2, F2, M02, D2, Guard2, R2, W2, De2, Gd2) be two WFD-net systems. The projected firing sequence σ~ is a firing sequence that contains all transitions with correspondences.
As shown in Figure 1B, t1t2{(t3)(t5)}t6t8 is a projected firing sequence.
Definition 15 (Trace consistency degree of WFD-net systems, TCDW). Let (ND1, M01) = (P1, T1, F1, M01, D1, Guard1, R1, W1, De1, Gd1) and (ND2, M02) = (P2, T2, F2, M02, D2, Guard2, R2, W2, De2, Gd2) be two WFD-net systems. They are aligned by ~. Let and be the sets of all projected firing sequences, such that and be the sets of same projected firing sequences. The trace consistency degree is defined as .
3.4. Trace consistency degree of WFD-net systems
Notice that there are only 1:1 correspondence relation in this paper. The transitions with correspondence relations read, write and delete the same data items. Therefore, we use the same transitions to denote them (e.g., transitions t1 ~ t8 in Figures 1A, B). A trace consistency guarantees that the essential rotes are reserved among transitions with correspondences in two WFD-net systems. According to our method, the inconsistencies manifest there exist traces without correspondence.
According to Def. 15, we propose Algorithm 1 to calculate the trace consistency degree. This algorithm uses the sets of projected firing sequences and , and the sets of the same projected firing sequences and in two WFD-net systems as inputs, and the trace consistency degree TCDW~ as outputs. Step 1 initializes TCDW~, , , , and . and can be calculated by taking Steps 2–7. and are derived from Steps 8–21. Finally, the trace consistency degree TCDW~ is calculated according to , , , and , as shown in Step 22.
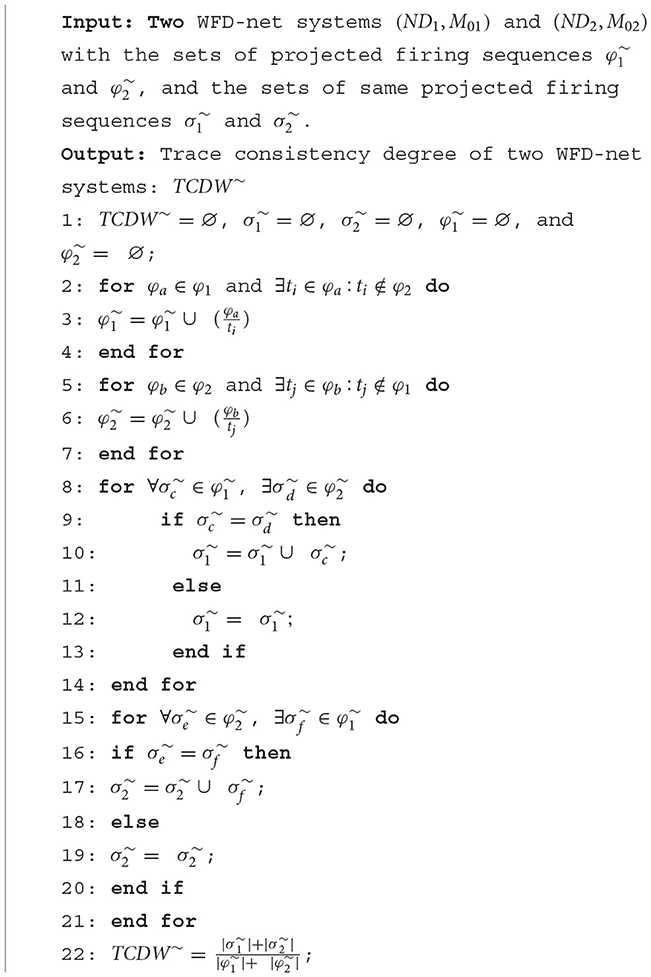
Algorithm 1. Trace consistency degree of two WFD-net systems.
The number of firing sequences in (ND1, M01) is n1, and the number of firing sequences in (ND2, M02) is n2. The time cost of finding projected firing sequences in (ND1, M01) and (ND2, M02) is n1 + n2. Let n be the number of the max firing sequences in these two models [i.e., n = max(n1, n2)], and then their projected firing sequences can be found in O(n2). The calculation of trace consistency degree is in linear time with the calculation of projected firing sequences. Therefore, the time complexity of this algorithm is O(n2).
According to the DTC method, there are 10 traces in Figures 1A, B if data operations and guard functions are ignored. The traces in Figures 1A, B are t1t2{(t3)(t5t6)}t8, t1t2{(t4)(t5t6)}t8, t1t2{(t3)(t7)}t8, and t1t2{(t4)(t7)}t8, as shown in Figure 4A. Therefore, the trace consistency degree of these two models computed by the DTC method is 1.
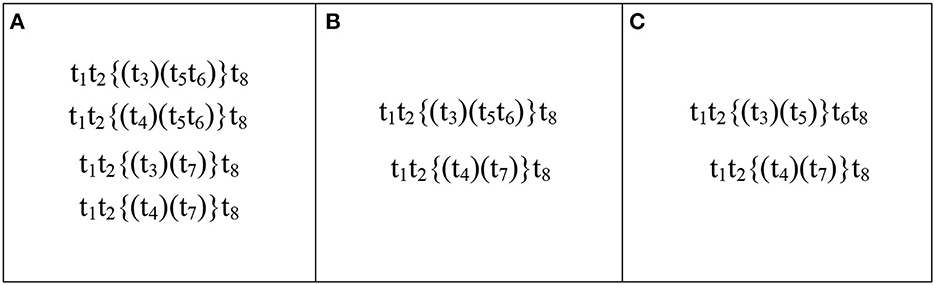
Figure 4. DTC (Weidlich et al., 2011) method: (A) shows the traces of Figures 1A, B. Our method: (B) reveals the traces of Figure 1A, (C) illustrates the traces of Figure 1B.
However, there are 5 traces (resp. 4 traces) in Figure 1A (resp. Figure 1A) when data operations and guard functions are considered. The traces in Figure 1A are t1t2{(t3)(t5t6)}t8, t1t2{(t4)(t7)}t8, and the traces in Figure 1B are t1t2{(t3)(t5)}t6t8 and t1t2{(t4)(t7)}t8, as shown in Figures 4B, C. Therefore, the trace consistency degree of these two models is .
4. Experiments
To evaluate the trace consistency of eight pieces of pseudo-code (i.e., Tables 2, 3), we use eight WFD-net systems to model them, as shown in Figures 5, 8. Although the method of DTC (Weidlich et al., 2011) can be used to measure the trace consistency degree, we want to address the following three problems.
RQ1: How do guard functions affect the traces in WFD-net systems?
RQ2: How do data dependencies affect the traces in WFD-net systems?
RQ3: Is our method more effective in measuring the trace consistency degree?

Table 2. Four kinds of pseudo-codes with guard functions.
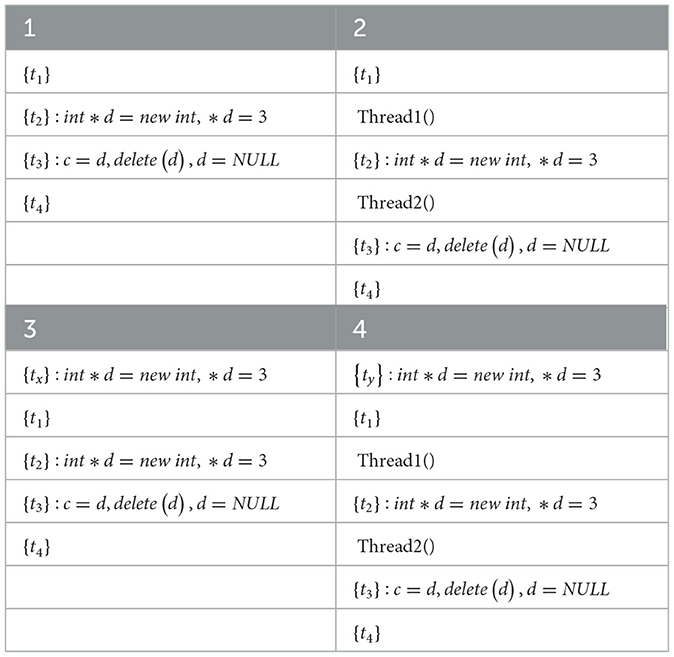
Table 3. Four kinds of pseudo-codes with data dependencies.
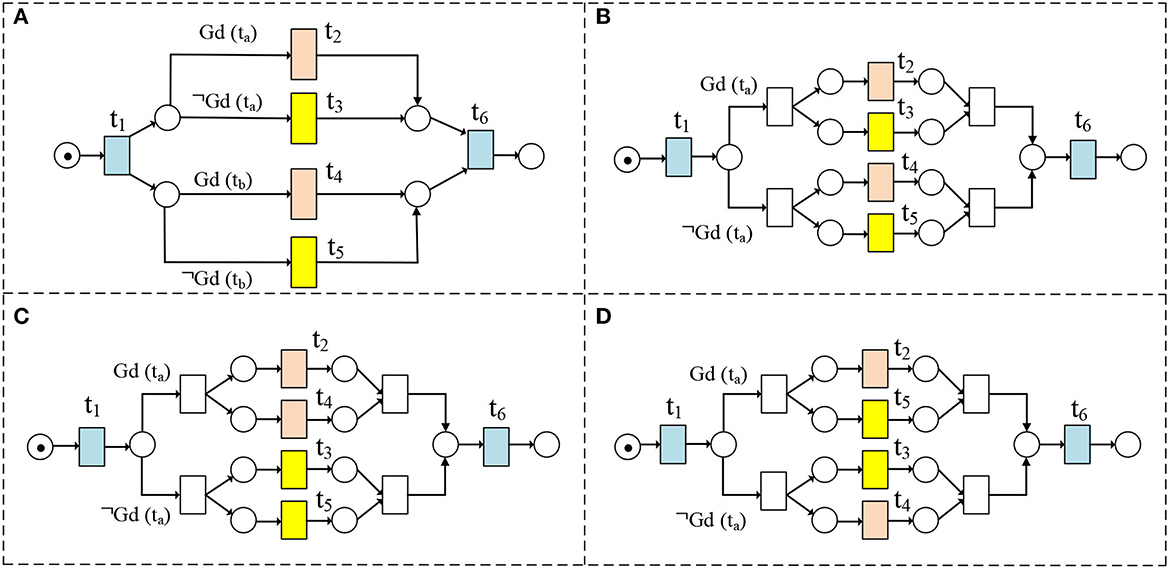
Figure 5. (A–D) are WFD-net models of Table 2.
To answer RQ1-RQ3, we analyze the above-mentioned eight WFD-net systems. These systems include weak strict order relations, weak exclusiveness relations, and weak interleaving order relations. To compare our method with the DTC method, we analyze the trace consistency degree of these models with guard functions and data dependencies.
4.1. RQ1: The effect of guard functions on traces
As shown in Section 3, we know the guard functions may change the behavioral relations. Therefore, we discuss the traces in the general cases (e.g., Figure 5A) as follows:
(1) If there exists no data item d satisfying d ∈ Rel(Gd(tx)) ∩ Rel(Gd(ty)), we have (t2 ∥cd t4) ∧ (t2 ∥cd t5) ∧ (t3 ∥cd t4) ∧ (t3 ∥cd t5) in Figure 5A. The corresponding traces are illustrated in Figure 6A.
(2) If Γ(Rel(Gd(tx))) = Γ(Rel(Gd(ty))), then we have (t2 ∥cd t4) ∧ (t2 +cd t5) ∧ (t3 +cd t4) ∧ (t3 ∥cd t5) in Figure 5A. The corresponding traces are illustrated in Figure 6B.
(3) If Γ(Rel(Gd(tx))) = Γ(Rel(¬Gd(ty))), then we have (t2 +cd t4) ∧ (t2 ∥cd t5) ∧ (t3 ∥cd t4) ∧ (t3 +cd t5) in Figure 5A. The corresponding traces are illustrated in Figure 6C.
(4) If Rel(Gd(tx)) ∩ Rel(Gd(ty)) = {𝔇} and ∀d ∈ 𝔇:[Rel(Gd(tx(d))) ∩ Γ(Rel(Gd(tx(d)))) ≠ ∅] ∧ [Rel(Gd(ty(d))) ∩ Γ(Rel(Gd(ty(d)))) ≠ ∅], we have (t2 ∥cd t4) ∧ (t2 +cd t5) ∧ (t3 +cd t4) ∧ (t3 +cd t5) in Figure 5A. The corresponding traces are illustrated in Figure 6D.
(5) If Rel(Gd(tx)) ∩ Rel(¬Gd(ty)) = {𝔇}, and ∀d ∈ 𝔇:[Rel(Gd(tx(d))) ∩ Γ(Rel(Gd(tx(d)))) ≠ ∅] ∧ [Rel(¬Gd(ty(d))) ∩ Γ(Rel(¬Gd(ty(d)))) ≠ ∅], we have (t2 +cd t4) ∧ (t2 ∥cd t5) ∧ (t3 +cd t4) ∧ (t3 +cd t5) in Figure 5A. The corresponding traces are illustrated in Figure 6E.
(6) If Rel(¬Gd(tx)) ∩ Rel(Gd(ty)) = {𝔇}, and ∀d ∈ 𝔇:[Rel(¬Gd(tx(d))) ∩ Γ(Rel(¬Gd(tx(d)))) ≠ ∅] ∧ [Rel(Gd(ty(d))) ∩ Γ(Rel(Gd(ty(d)))) ≠ ∅], we have (t2 +cd t4) ∧ (t2 +cd t5) ∧ (t3 ∥cd t4) ∧ (t3 +cd t5) in Figure 5A. The corresponding traces are illustrated in Figure 6F.
(7) If Rel(¬Gd(tx)) ∩ Rel(¬Gd(ty)) = {𝔇}, and ∀d ∈ 𝔇:[Rel(¬Gd(tx(d))) ∩ Γ(Rel(¬Gd(tx(d)))) ≠ ∅] ∧ [Rel(¬Gd(ty(d))) ∩ Γ(Rel(¬Gd(ty(d)))) ≠ ∅], we have (t2 +cd t4) ∧ (t2 +cd t5) ∧ (t3 +cd t4) ∧ (t3 ∥cd t5) in Figure 5A. The corresponding traces are illustrated in Figure 6G.
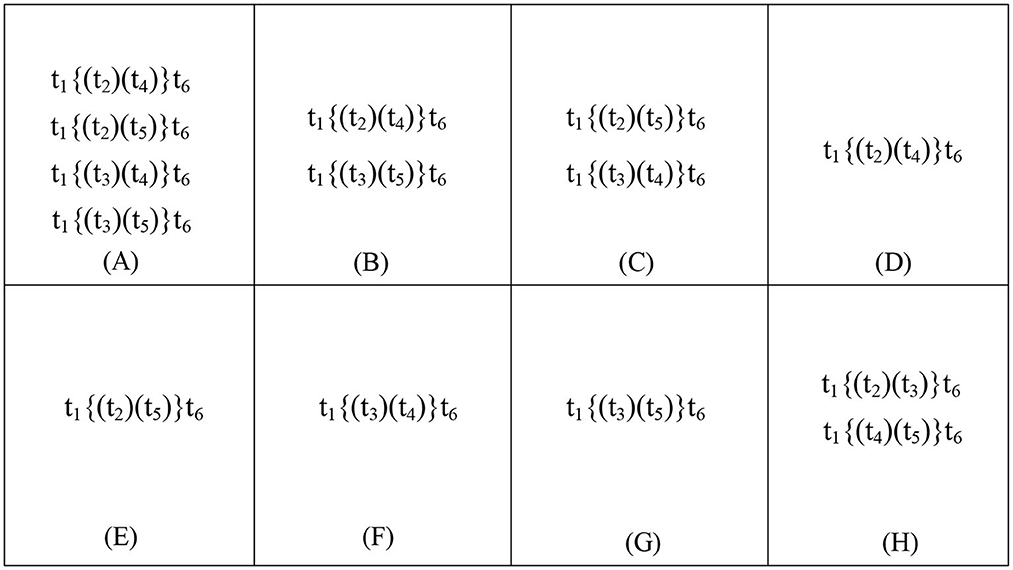
Figure 6. DTC (Weidlich et al., 2011) method: (A) shows the traces of Figure 5A, (H) shows the traces of Figure 5B, (B) shows the traces of Figure 5C, and (C) shows the traces of Figure 5D. Our method: (A–G) shows the traces of Figure 5A, (H) shows the traces of Figure 5B, (B) shows the traces of Figure 5C, and (C) shows the traces of Figure 5D.
In our method, Figure 6H shows the traces of Figure 5B, Figure 6B shows the traces of Figure 5C, and Figure 6C shows the traces of Figure 5D. Therefore, the traces in a WFD-net system are more than one when their guard functions are uncertain, e.g., Figure 5A. Figure 7 shows the trace consistency degrees of models in Figures 5A–D.
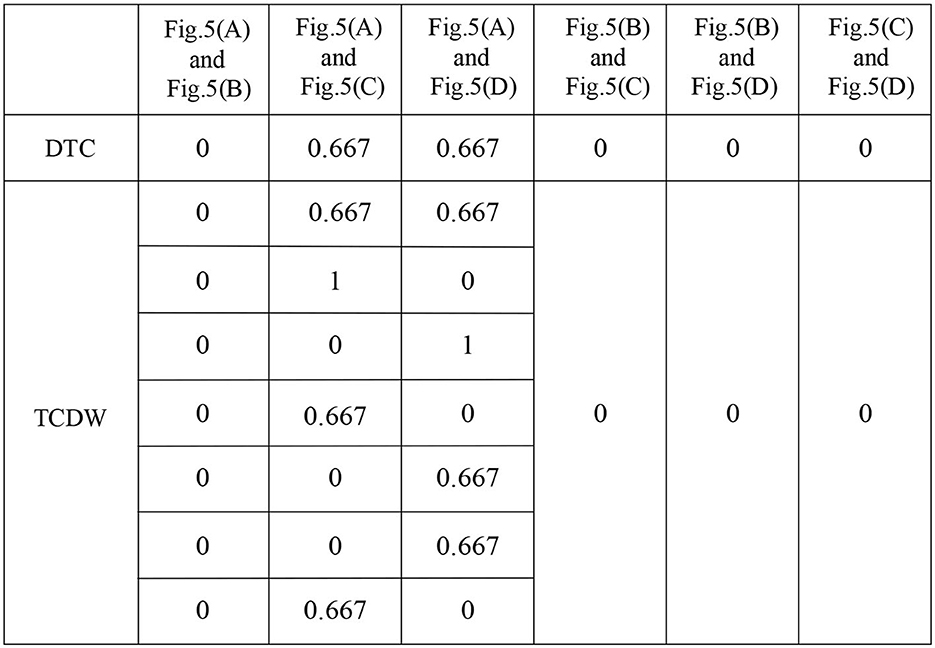
Figure 7. Trace consistency degree measurement results by taking DTC (Weidlich et al., 2011) and TCDW methods.
4.2. RQ2: The effect of data dependencies on traces
In this subsection, we discuss the traces that may be affected by data dependencies, as shown in Figure 8. Based on Def. 7, the data dependencies in Figures 8A, C, D cannot change the traces. Although we have d ⋖ MD in Figure 8B, the final place can be reached. The data dependencies in Figure 8B can change the traces if there is no locking mechanism. In a word, we have t2 →cd t3 in Figure 8B. Therefore, the corresponding traces of Figures 8A–D are shown in Figure 9. Figure 10 shows the trace consistency degrees of models in Figures 8A–D.
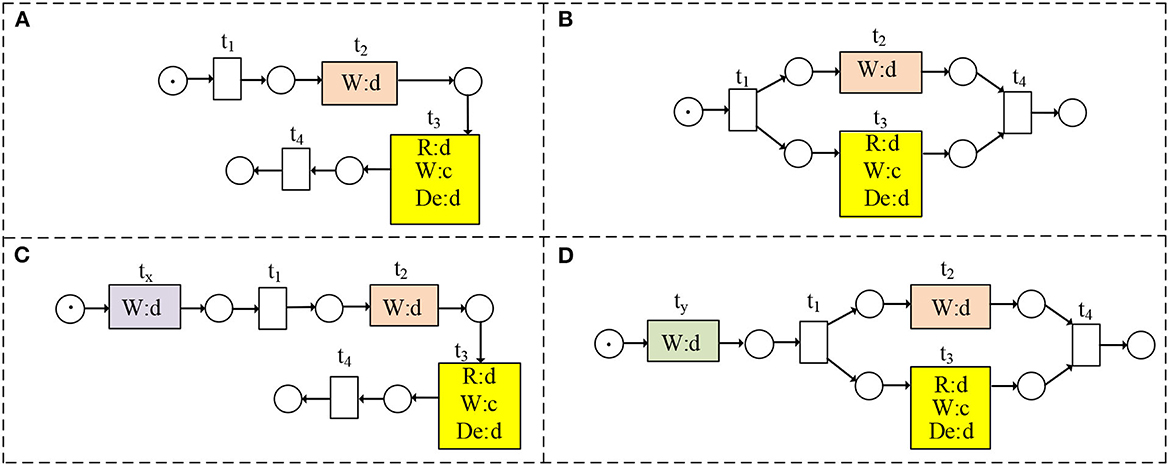
Figure 8. (A–D) are WFD-net models of Table 3.
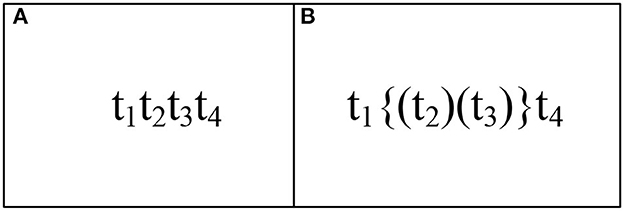
Figure 9. DTC (Weidlich et al., 2011) method: (A) reveals the traces of Figures 8A, C, (B) shows the traces of Figures 8B, D. Our method: (A) illustrates the traces of Figures 8A–C, (B) shows the traces of Figure 8D.
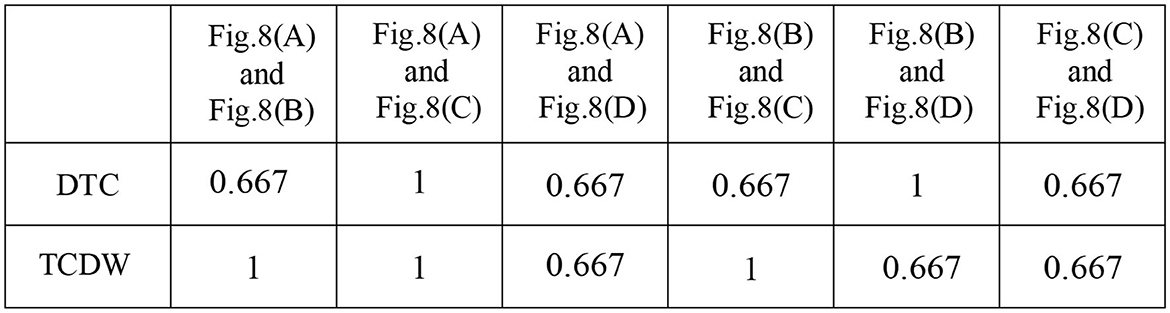
Figure 10. Trace consistency degree measurement results by taking DTC (Weidlich et al., 2011) and TCDW methods.
4.3. RQ3: Comparison between different trace consistency measurement methods
In this subsection, we present a comparison between different methods for trace consistency measurements. The comparison includes two methods in total. The DTC method does not consider the trace consistency degree affected by guard functions and data dependencies of transitions. The results of our method (i.e., TCDW) take both sides into consideration, especially when the values of guard functions are uncertain.
In Figure 7, we can get 3 kinds of trace consistency degrees of Figures 5A, C as the values of guard functions are uncertain, i.e., TCDW1 = 0, 0.667 or 1. Figures 7, 10 present the comparison results of the DTC method with the TCDW method on trace consistency measurement. Obviously, our result is more reasonable than the existing methods.
5. Related work
Consistency checking has become a critical technology in checking how a process model is similar to another. It is significant in the matching process models (Weidlich et al., 2012). Existing studies on the measurements of consistency degree can be classified into two categories: with or without data. The following parts review some related work about the existing measuring methods.
5.1. Consistency degree of process models without data
Consistency measurement is very important in process alignment and process integration. It can be taken to detect the deviations between the process models and corresponding event logs. Recently, many researchers have focused on measuring the consistency degrees of process models from the angle of control flow.
Decker and Weske (2007) presented the standard for an optimum consistency relation regarding a given compatibility relation. They guaranteed that the implemented services' behaviors were compatible with others. Therefore, they checked the consistency degree of specifications and service implementations. After then, van der Aalst (2011) and van der Aalst et al. (2007) depicted the conformity relationship between event logs and process models. The consistency measurement techniques can be used to compare the modeled behavior in the initial process model with the observed behavior in event logs. The consistency guarantees there is no contradiction between the two models (Rull et al., 2008). Rozinat and van der Aalst (2008) proposed a method to check the consistency of an event log to a process model. This method is based on monitoring real behavior. Unfortunately, these studies cannot distinguish between slight inconsistencies and complete inconsistencies.
Based on existing research, Weidlich and Mendling (2010), Weidlich and van der Werf (2012), and Weidlich et al. (2011) solved this problem. They defined behavioral profile relations that can capture the behavioral restrictions of a model. Moreover, they put forward the trace consistency as the number of the same traces in two models to the number of traces with transitions in correspondences. Additionally, based on correspondence relations, they defined the profile consistency degree. They also illustrated that consistency-checking technology states how the real behavior is consistent with the observed. After then, Nagel et al. (2013) described process model quality constraints that can be taken to obtain consistency among the goals and the process models. van der Aa et al. (2015) used natural language processing techniques to recognize the inconsistencies between textual descriptions and relevant process models. Awadid and Nurcan (2016) reviewed the existing consistency measurement methods. One aim of their research is to master the inter-model consistency issue. Besides, Wang et al. (2018) proposed relation profile methods to analyze the consistency degrees of different process models. Although these consistency measurement methods have been proposed, they mostly rely on detecting the consistency decrease caused by the difference in process models. They have not taken the data dependencies or guard functions into consideration.
5.2. Consistency degree of process models with data
Generally speaking, the consistency degree of process models in workflow systems would be affected by the data. Song et al. (2013) and Song and Jacobsen (2015) proposed a way to calculate the consistency degrees between conceptual and executable process models. At the same time, they developed a tool named COCO to quantitatively calculate the consistency degree. After then, they measured the trace consistency degree between the two models on account of control dependence and data dependence and provided a new computing method to quantify the trace consistency (Song et al., 2021). Based on the program dependency graphs, Zhang et al. (2018) and Zhang et al. (2019) proposed a systematic method to check consistencies between different BPEL processes. They identified that the data dependencies can affect the consistency degrees of different models. They took advantage of activity constraint graphs to calculate the consistency degree of models with control flow and data-flow information. After taking their methods, we can distinguish different event constraints and check the consistency of conceptual and logical process models.
However, these studies are mainly based on analyzing the consistency of physical processes with read/write operations. They have not considered that the guard functions may affect the trace consistency degree. Usually, the transitions without correspondence relations but with data dependencies are ignored by them, too. However, all of them may affect the real trace consistency degree. By comparison, our measurement methods can solve these problems.
6. Conclusions and future work
The trace consistency measurement is important to service-based workflow net systems. This paper presents the behavioral profile relation in a WFD-net system, and provides a new way to calculate the trace consistency of two WFD-net systems. Compared with the DTC method, the advantages of our method are shown as follows. Firstly, we illustrate that the guard functions may affect the traces in two WFD-net systems. Therefore, the trace consistency degree is non-uniqueness when the values of guard functions are uncertain. Secondly, we point out that the transitions with or without correspondence but with some data dependencies can also affect the traces and the real trace consistency degree. Some experiments on WFD-net systems above demonstrate that our method is more efficient in measuring trace consistency than the existing method.
This paper shows some directions for future research:
(1) Our methods need to be improved so as to measure the trace consistency between transitions in WFD-net systems extended with complex correspondence relations;
(2) Some measures should be taken to repair control/data-flow errors as they may affect the actual traces; and
(3) We need to develop a tool to help us calculate trace consistency automatically.
Data availability statement
The original contributions presented in the study are included in the article/supplementary material, further inquiries can be directed to the corresponding author.
Author contributions
Before writing this paper, FZ, DX, and GL have discussed the relevant details about trace consistency measurement. Afterwards, FZ wrote the paper. DX and GL revised the paper. All authors contributed to the article and approved the submitted version.
Funding
This work was partially supported by the National Nature Science Foundation of China under Grant 62002328, 62172299 and 62032019, the Youth Foundation of Anhui University of Technology under Grant QZ202215, and the Key Laboratory of Embedded System and Service Computing under Grant ESSCKF 2021-02.
Conflict of interest
The authors declare that the research was conducted in the absence of any commercial or financial relationships that could be construed as a potential conflict of interest.
Publisher's note
All claims expressed in this article are solely those of the authors and do not necessarily represent those of their affiliated organizations, or those of the publisher, the editors and the reviewers. Any product that may be evaluated in this article, or claim that may be made by its manufacturer, is not guaranteed or endorsed by the publisher.
References
Assy, N., Chan, N. N., and Gaaloul, W. (2015). An automated approach for assisting the design of configurable process models. IEEE Trans. Serv. Comput. 8, 874–888. doi: 10.1109/TSC.2015.2477815
Awadid, A., and Nurcan, S. (2016). A systematic liturature review of consistency among business process models. BPMDS/EMMSAD 2016 LNBIP 248, 175–195. doi: 10.1007/978-3-319-39429-9_12
Decker, G., and Weske, M. (2007). “Behavioral consistency for B2B process integration,” in 19th International Conference on Advanced Information System Engineering, CAiSE 2007 (Trandheim: Springer), 81–95. doi: 10.1007/978-3-540-72988-4_7
Dijkman, R., Dumas, M., van Dongen, B., Kaarik, R., and Mendling, J. (2011). Similarity of business process models: metrics and evaluation. Inf. Syst. 36, 498–516. doi: 10.1016/j.is.2010.09.006
Fahland, D. (2008). Translating UML2 Activity Diagrams to Petri Nets. Berlin, Germany: Humboldt Universitat zu Berlin.
IEEE (1990). IEEE standard glossary of software engineering terminology. Inst. Electrical Electron. Eng. 42, 112–118.
Li, H., El-Amine, H. M., and Mohamed, H. (2014). “Merging several business process variants,” in The 26th Chinese Control and Decision Conference (Changsha, China), 2, 5218–5223. doi: 10.1109/CCDC.2014.6853112
Li, Z. W., and Liu, G. Y. (2009). An iterative synthesis approach to petri net based on deadlock prevention policy for flexible manufacturing systems. IEEE Trans. Syst. Man. Cybern. Syst. 39, 362–371. doi: 10.1109/TSMCA.2009.2013446
Liu, G. J. (2014). Some complexity results for the soundness problem of workflow nets. IEEE Trans. Serv. Comput. 7, 322–328. doi: 10.1109/TSC.2013.36
Liu, G. J. (2022). Petri Nets: Theoretical Models and Analysis Methods for Concurrent Systems. Springer. doi: 10.1007/978-981-19-6309-4
Liu, G. J., Jiang, C. J., and Zhou, M. C. (2018). Time-soundness of time Petri nets modeling time-critical systems. ACM Transac. Cyber Phys. Syst. 2, 11. doi: 10.1145/3185502
Liu, G. J., Jiang, C. J., Zhou, M. C., and Xiong, P. C. (2013). Interactive Petri nets. IEEE Trans. Syst. Man Cybernet. Syst. 43, 291–302. doi: 10.1109/TSMCA.2012.2204741
Liu, G. J., Zhou, M. C., and Jiang, C. J. (2017). Petri net modelling and collaborativeness for parallel processes with resource sharing and message passing. ACM Trans. Embedded Comput. Syst. 16, 1–20. doi: 10.1145/2810001
Liu, G. Y., Li, P., Li, Z. W., and Wu, N. Q. (2019). Robust deadlock control for automated manufacturing systems with unreliable resources based on Petri net reachability graphs. IEEE Trans. Syst. Man. Cybern. Syst. 49, 7, 1371–1385. doi: 10.1109/TSMC.2018.2815618
Meda, H. S., Sen, A. K., and Bagchi, A. (2010). On detecting data flow errors in workflows. ACM J. Data Inf. Qual. 2, 1–31. doi: 10.1145/1805286.1805290
Nagel, B., Gerth, C., Engels, G., and Post, J. (2013). “Ensuring consistency among business goals and business process models,” in IEEE Enterp. Distrib. Object Comput (Washington, DC, USA), 17–26. doi: 10.1109/EDOC.2013.12
Rozinat, A., and van der Aalst, W. M. P. (2008). Conformance checking of processes based on monitoring real behavior. Inf. Syst. 33, 64–95. doi: 10.1016/j.is.2007.07.001
Rull, G., Farre, C., Teniente, E., and Urpf, T. (2008). Validation of mappings between schemas. Data Knowl. Eng. 66, 414–437. doi: 10.1016/j.datak.2008.04.009
Sidorova, N., Stahl, C., and Trcka, N. (2011). Soundness verification for conceptual workflow nets with data: early detection of errors with the most precision possible. Inf. Syst. 36, 1026–1043. doi: 10.1016/j.is.2011.04.004
Song, W., and Jacobsen, H. A. (2015). Static and dynamic process change. IEEE Trans. Serv. Comput. 11, 215–231. doi: 10.1109/TSC.2016.2536025
Song, W., Jacobsen, H. A., Cheung, S. C., Liu, H. Y., and Ma, X. X. (2018). Workflow refactoring for maximizing concurrency and block-structuredness. IEEE Trans. Serv. Comput., 14, 1224–1237. doi: 10.1109/TSC.2018.2867593
Song, W., Jacobsen, H. A., Ye, C. Y., and Ma, X. X. (2016). Process discovery from dependence-complete event logs. IEEE Trans. Serv. Comput. 9, 714–727. doi: 10.1109/TSC.2015.2426181
Song, W., Jacobsen, H. A., Zhang, C. Z., and Ma, X. X. (2021). Dependence-based data-aware process conformance checking. IEEE Trans. Serv. Comput. 14, 654–667. doi: 10.1109/TSC.2018.2821685
Song, W., Zhang, W. J., Zhang, G. X., Ding, J. H., and Zhang, X. W. (2013). “Quantifying consistency between conceptual and executable business processes,” in 2013 IEEE International Conference on Services Computing (Santa Clara, CA: IEEE), 9–16. doi: 10.1109/SCC.2013.47
Trcka, N., van der Aalst, W. M. P., and Sidorova, N. (2009). Data-Flow Anti-Patterns: Discovering Data-Flow Errors in Workflows. Berlin, Heidelberg: Springer, 425–439. doi: 10.1007/978-3-642-02144-2_34
van der Aa, H., Leopold, H., and Reijers, H. A. (2015). Detecting Inconsistencies Between Process Models and Textual Descriptions. Cham: Springer, 90–105. doi: 10.1007/978-3-319-23063-4_6
van der Aalst, W. M. P. (2011). Service mining: using process mining to discover, check, and improve service behavior. IEEE Trans. Services Comput. 6, 1–13. doi: 10.1109/TSC.2012.25
van der Aalst, W. M. P., Dumas, M., Gottschalk, F., ter Hofstede, A. H. M., La Rosa, M., and Mendling, J. (2010). Preserving correctness during business process model configuration. Formal Aspects Comput. 22, 459–482. doi: 10.1007/s00165-009-0112-0
van der Aalst, W. M. P., Reijers, H. A., and Werjters, A. J. M. (2007). Business process mining: an industrial application. Inf. Syst. 32, 713–732. doi: 10.1016/j.is.2006.05.003
Wang, M. M., Ding, Z. J., Liu, G. J., Jiang, C. J., and Zhou, M. C. (2018). Measurement and computation of profile similarity of workflow nets based on behavioral relation matrix. IEEE Trans. Sys., Man Cybern. Syst. 50, 1–18. doi: 10.1109/TSMC.2018.2852652
Weidlich, M., Dijkman, R., and Weske, M. (2012). Behavior equivalence and compatibility of business process models with complex correspondences. Comput. J. 55, 1398–1418. doi: 10.1093/comjnl/bxs014
Weidlich, M., Dijkman, R., and Weske, M. (2014). “Efficient analysis of BPEL 2.0 processes using p-calculus,” in Proceedings of IEEE 30th International Conference on Data Engineering (Chicago, IL: IEEE), 376–387.
Weidlich, M., and Mendling, J. (2010). Perceived consistency between process models. Inf. Syst. 37, 80–98. doi: 10.1016/j.is.2010.12.004
Weidlich, M., Mendling, J., and Weske, M. (2011). Efficient consistency measurement based on behavioral profiles of process models. IEEE Trans. Softw. Eng. 37, 410–429. doi: 10.1109/TSE.2010.96
Weidlich, M., and van der Werf, J. J. (2012). On profiles and footprints relational semantics for Petri nets. Applic. Theor. Petri Nets. 7347, 148–167. doi: 10.1007/978-3-642-31131-4_9
Xiang, D. M., Liu, G. J., Yan, C. G., and Jiang, C. J. (2021). A guard-driven analysis approach of workflow net with data. IEEE Trans. Services Comput. 14, 1650–1661. doi: 10.1109/TSC.2019.2899086
Zhang, X. W., Song, W., Wang, J. J., Xing, J. C., and Zhou, Q. Z. (2019). Measuring business process consistency across different abstraction levels. IEEE Trans. Netw. Serv. Manag. 16, 294–307. doi: 10.1109/TNSM.2018.2883362
Zhang, X. W., Wang, J. J., Xing, J. C., Song, W., and Yang, Q. L. (2018). Measuring data-aware process consistency based on activity constraint graphs. IEEE Access 6, 21005–21019. doi: 10.1109/ACCESS.2018.2795701
Zhang, Z. L., Liu, G. Y., Barkaoui, K., and Li, Z. W. (2022). Adaptive deadlock control for a class of Petri nets with unreliable resources. IEEE Trans. Syst. Man. Cybern. Syst. 52, 3113–3125. doi: 10.1109/TSMC.2021.3062469
Zhao, F., Xiang, D. M., Liu, G. J., and Jiang, C. J. (2022a). A new method for measuring the behavioral consistency degree of WF-net systems. IEEE Trans. Comput. Social Syst. 9, 480–493. doi: 10.1109/TCSS.2021.3099475
Zhao, F., Xiang, D. M., Liu, G. J., Jiang, C. J., and Zhu, H. H. (2022b). Detecting and repairing data-flow errors in WFD-net systems. Comput. Modeling Eng. Sci. 131, 1337–1363. doi: 10.32604/cmes.2022.018872
Zhu, X., Zhu, G., van den Broucke, S., and Recker, J. (2014). “On merging business process management and geographic information systems: modeling and execution of ecological concerns in processes,” in Communications in Computer and Information Science, vol 482 (Berlin, Heidelberg: Springer), 486–496. doi: 10.1007/978-3-662-45737-5_48
Keywords: trace consistency, WFD-net system, data operation, guard analysis, data dependency
Citation: Zhao F, Xiang D and Liu G (2023) The trace consistency measurement between WFD-net systems. Front. Comput. Sci. 5:1136057. doi: 10.3389/fcomp.2023.1136057
Received: 02 January 2023; Accepted: 20 February 2023;
Published: 13 March 2023.
Edited by:
Gaiyun Liu, Xidian University, ChinaReviewed by:
Xiaoliang Chen, Xihua University, ChinaLi Yin, Macau University of Science and Technology, Macao SAR, China
Copyright © 2023 Zhao, Xiang and Liu. This is an open-access article distributed under the terms of the Creative Commons Attribution License (CC BY). The use, distribution or reproduction in other forums is permitted, provided the original author(s) and the copyright owner(s) are credited and that the original publication in this journal is cited, in accordance with accepted academic practice. No use, distribution or reproduction is permitted which does not comply with these terms.
*Correspondence: Dongming Xiang, Zmx5c2t5X3hkbUAxNjMuY29t