 Elina Kuosmanen
 Aku Visuri
 Simo Hosio
94% of researchers rate our articles as excellent or good
Learn more about the work of our research integrity team to safeguard the quality of each article we publish.
Find out more
ORIGINAL RESEARCH article
Front. Comput. Sci., 07 September 2022
Sec. Mobile and Ubiquitous Computing
Volume 4 - 2022 | https://doi.org/10.3389/fcomp.2022.971793
Sleep tracking has been rapidly developing alongside wearable technologies and digital trackers are increasingly being used in research, replacing diaries and other more laborious methods. In this work, we describe the user expectations and experiences of four different sleep tracking devices used simultaneously during week-long field deployment. The sensor-based data collection was supplemented with qualitative data from a 2-week long daily questionnaire period which overlapped with device usage for a period of 1 week. We compare the sleep data on each of the tracking nights between all four devices, and showcase that while each device has been validated with the polysomnography (PSG) gold standard, the devices show highly varying results in everyday use. Differences between devices for measuring sleep duration or sleep stages on a single night can be up to an average of 1 h 36 min. Study participants provided their expectations and experiences with the devices, and provided qualitative insights into their usage throughout the daily questionnaires. The participants assessed each device according to ease of use, functionality and reliability, and comfortability and effect on sleep disturbances. We conclude the work with lessons learned and recommendations for researchers who wish to conduct field studies using digital sleep trackers, and how to mitigate potential challenges and problems that might arise regarding data validity and technical issues.
Sleep timing and quality play a prominent role in individuals' everyday life and well-being. Human-centered studies often collect behavioral data from study participants' life, of which sleep is also a part (see, e.g., Dobmeier et al., 2011; Tettamanti et al., 2020; Evans et al., 2021). Traditionally, collecting reliable longitudinal sleep data has been challenging, as it has relied on diary methods or assessment of sleep timings, i.e., bedtimes and wake-up times, or a combination of diaries and manual logging methods.
The rapid development of both commercial and research-grade wearable technologies has allowed researchers to leverage unobtrusive and automated sleep tracking methods as part of their studies. Many devices based on actigraphy (tracking movements), heart rate and breathing are available off the shelf for personal use. These devices offer reasonably accurate information about detailed sleep metrics, such as sleep phases, disruptions, and onset times. While these devices do not provide accuracy comparable to polysomnography (PSG), considered the gold standard for sleep tracking, numerous validation studies have shown that the data is still useful.
From the perspective of the human-computer interaction community, we now have information about the technical quality of these products for research purposes through validations in lab conditions. However, empirical studies and experience reports on how these devices perform in longitudinal field studies are lacking. Table 1 provides a summary of the devices' features.
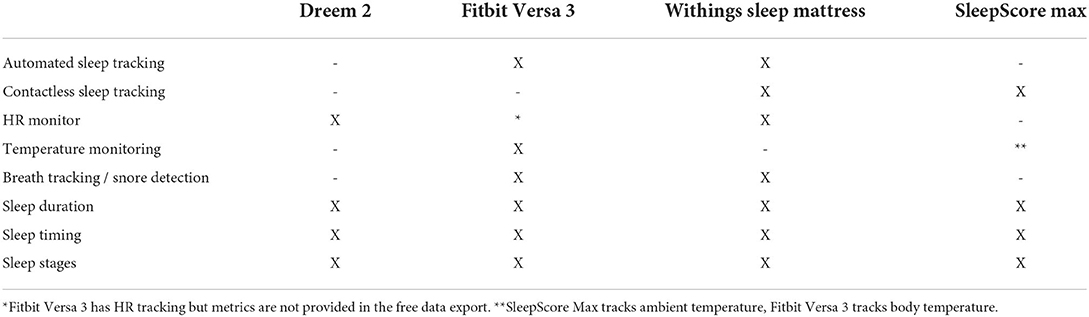
Table 1. Device capabilities related to sleep tracking.
We designed a 2-week field experiment to study how participants experience using different sleep tracking technologies in their daily lives. Participants used four different sleep tracking technologies: an actigraphy wearable smartwatch (Fitbit Versa 3), an EEG headband (Dreem 2), a sleep tracking mattress (Withings Sleep Analyzer), and a sonar-based device (SleepScore Max). We collected the sleep data from the devices and conducted semi-structured interviews with the participants regarding their expectations and experiences with the devices.
The purpose of this experiment was to assess how reliable the data collected from these devices would be perceived i) by the end-users, in our case, the study participants, i.e., does the data offered by the devices match the participants' subjective assessment, and ii) from the perspective of data similarity and between-devices comparison; do different technological approaches or algorithms provide different data when worn or used simultaneously.
Our results show that the data provided by different devices vary significantly. Different technological approaches track detailed sleep metrics such as sleep stages differently. We also discovered several issues with using these technologies in a field study, caused either by the devices themselves, their technical requirements, or problems caused by the participants' behavior or forgetfulness. These issues have implications for future studies with such technologies. As a result, we provide recommendations for research that leverages sleep tracking as part of the study procedure and suggestions on mitigating issues that lead to inaccurate data in field studies that leverage sleep tracking technologies.
Sleep is an essential factor in health (Buysse, 2014), it affects various aspects of our daily life quality (Bonnet, 1985), our physiology and behavior (Bonnet, 1989). The use of wearable devices and other sleep trackers for research purposes in human subject studies has been steadily gathering more interest (Robbins et al., 2019). The commercial sleep trackers are low-cost and designed to be used in daily life. On the other hand, the proprietary algorithms and lack of standardization might hinder their use in research.
There are several methods to measure sleep quality, including clinical modalities such as polysomnography (Douglas et al., 1992; Chesson et al., 1997), multiple sleep latency tests (MSLT), maintenance of wakefulness test (MWT), and home sleep apnea testing (HSAT), consumer technology like smartphone applications (Ong and Gillespie, 2016; Choi et al., 2018), wearable trackers (De Zambotti et al., 2016; Dunn et al., 2018), and non-wearable tracker (Sadek et al., 2019), and crowdsourcing sleep research or self-assessment methods like sleep questionnaires or sleep diaries (Shelgikar et al., 2016; Ibáñez et al., 2018). Most wearable trackers use accelerometer sensors, heat flux sensors, and optical blood-flow sensors (Jeon and Finkelstein, 2015). There is no perfect sleep assessment method for in-the-wild tracking; all methods have advantages and disadvantages. The few scientific validation comparing smartphone applications against polysomnography report that they are not helpful as a tool for sleep estimation (Patel et al., 2017) and are still not accurate enough to be used as clinical tools (Bhat et al., 2015; Ibáñez et al., 2018). Some clinicians are skeptical of the accuracy and use of sleep information offered by consumer devices (De Zambotti et al., 2016; Shelgikar et al., 2016).
PSG combines data from multiple sources, such as brain (EEG), heart (ECG), and muscle (EMG) activity, snoring and oxygen levels (pulse oximetry), carbon dioxide (capnography), eye movement (EOG) (Ibáñez et al., 2019). However, PSG is expensive, requires trained specialists, and not suitable to measurements done in home environment (Ibáñez et al., 2019).
Sleep tracking devices can be classified as contact and contactless devices (Ibáñez et al., 2019). Contactless devices may utilize a microphone, camera, thermometer, pressure and accelerometer (Ibáñez et al., 2019). In addition, there are echo-based devices, sonar, radar or lidar-based (Ibáñez et al., 2019). Contact devices use sensors that are in contact with the body (Ibáñez et al., 2019). Wearable devices, such as bracelets, rings or headbands, are called as actigraphs, and in addition to motion sensors (gyroscope, accelerometer) they may collect body measures (e.g., skin temperature, heart rate) and ambient measures (e.g., light, sound, temperature) (Ibáñez et al., 2019).
Validation studies present the device accuracy as sensitivity (true positive rate) and specificity (true negative rate) (Ibáñez et al., 2019). Sensitivity describes the device's ability to detect sleep, and specificity describes the device's ability to detect wake (Ibáñez et al., 2019). Overall, contact devices have often better accuracy than contactless devices (Ibáñez et al., 2019). In contactless devices, the positioning of the device might impact on the accuracy, e.g., the radar accuracy depends on the distance to the sleeper (Ibáñez et al., 2019). Consumer sleep tracking devices have inconsistencies in tracking sleep stages, but are better in detecting sleep and wake (Chinoy et al., 2021).
Liang and Ploderer (2020) conducted a qualitative study with 22 participants wearing three sleep trackers simultaneously for 3 nights: Fitbit Charge 2 (worn in a wrist, accelerometer and optical heart rate sensor), Neuroon (eye mask, EEG), and SleepScope (a medical sleep monitor, electrodes attached to head, EEG). Liang et al. found that the perceived credibility of the sleep-tracker is affected by several factors: the collected sleep data, the device functionality, the physical appearance and interaction with the device. Judgements can be based on presumptions, reputation and on first impressions based on simple inspections in addition to actual experience. Furthermore, the interpretation of the sleep stages was experienced as difficult by some participants, and it was challenging to understand how the data was sensed or processed.
Liu et al. (2015) investigated challenges of sleep tracking technologies through analyzing online discussions. The study covered mobile apps, wearable and embedded sensors. They grouped the challenges into four themes: tracking continuity (discomfort, health concerns, wearable battery limit, mobile battery limit, sleep partner, manual setting, naps, irregular work shifts, portability, detection range), trust (tracking reliability, results congruence, sleep automation, development immaturity), data manipulation (data amendment, data export, integration tools), and data interpretation (sleep knowledge, no context, data granularity, generic coaching, lack of time).
We conducted a home-based 2-week sleep tracking study using four sleep tracking devices concurrently. Our sample contains interview data, daily surveys, and sleep data from 1 week device usage period. Ten participants (six female, four male, ages 22–48) took part in the study over a period of 12 weeks. The participants did not receive any further compensation for their participation. According to the Finnish National Advisory Board on Research Ethics guidance and our institution's internal guidelines a formal ethical review is not required for this study (National Advisory Board on Research Ethics, 2019).
We selected two contact devices and two contactless devices for sleep tracking: Dreem 2 EEG headband, Fitbit Versa 3 actigraph smartwatch, Withings Sleep Analyzer mattress, and SleepScore Max sonar-based sleep tracking device. The devices are depicted in Figure 1 and described in detail next.
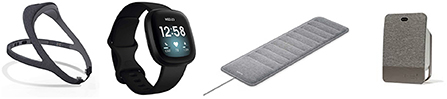
Figure 1. Hardware used in our experiment. From the left: Dreem 2, Fitbit Versa 3, Withings Sleep Analyzer and SleepScore Max.
Dreem 2 is a headband capable of measureing brainwaves using reduced-montage dry-electroencephalographic (EEG) sensors. In addition, it measures heart rate with a red-infrared pulse oximeter and movement, position and breath frequency using a 3D accelerometer.
Dreem 2 reached similar performance in automatic sleep staging with a consensus of five scorers using medical-grade PSG data, with wake time slightly underestimated (Arnal et al., 2020).
Fitbit Versa 3 is a wearable smartwatch that automatically tracks sleep via motion and heart rate sensors. It provides time asleep, sleep states, and a sleep score that describes the overall sleep quality (Fitbit, 2001).
Compared to PSG, sleep-staging Fitbit models show no significant difference in wake after sleep onset, total sleep time, and sleep efficiency but it underestimates sleep onset latency (Haghayegh et al., 2019). Compared to a medical device, Fitbit tends to overestimate the probability of staying in a sleep stage while underestimating the probability of transiting to another stage (Liang and Chapa-Martell, 2019). This can lead to prolonged durations of sleep stages.
Withings Sleep Analyzer is a mat placed under mattress. It measures sleep timing and stages. Heart rate, respiratory rate and body movements are tracked via a pneumatic sensor, and snoring and cessations in breathing are evaluated via a sound sensor. Withings has gone through a PSG validation study, but only for sleep apnea patients and without specifying accuracy for different sleep phases (Edouard et al., 2021). For overall sleep duration Withings tends to overestimate PSG metrics by 25 min.
ResMed Sleepscore Max sleep tracker is a non-wearable device placed on a bedside table. The device uses sonar technology to monitor sleep and sleep environment (Zaffaroni et al., 2019). That means the device sends radio waves (electromagnetic radiation) and measures the time the waves take to return (Ibáñez et al., 2019).
Compared to actigraphy, the SleepScore algorithm which uses sonar technology had higher overall specificity and lower overall sensitivity, it's overall sleep/wake agreement with PSG was higher (Schade et al., 2019). However, SleepScore statistically significantly under-estimates REM sleep (Zaffaroni et al., 2019).
The study was conducted in three phases: Pre-equipment (1 week), Equipment (1 week) and Post-Equipment (an interview session).
During the Pre-equipment phase, the researcher visited the participants in person at their homes or in a public location. Participants were informed of and gave their consent to the study. The researcher then conducted a semi-structured interview in person regarding the participant's expectations of the devices before using them. The interview contained three themes: ease-of-use, functionality and reliability, and comfortability and sleep disturbance. The participants then completed the Pittsburgh Sleep Quality Index (PSQI) self-report questionnaire (Buysse et al., 1989) which assesses long-term sleep quality. We employed this questionnaire to detect outliers in the participant sample. In this phase, the participants also manually tracked their sleep by responding to the daily sleep tracking survey every morning for 1 week (see Section 3.2.1). This stage was designed to raise the participants' awareness of their sleep quality and prepare them for the Equipment stage.
In the Equipment phase, participants tracked their sleep for 1 week using all the digital sleep monitoring devices simultaneously. They also continued filling in the daily sleep tracking survey each morning, which now included additional questions about their use of the devices, and any experienced technical problems. The researcher again visited the participants, provided them with the four devices, and gave instructions on how to use them and how to e.g., connect the devices to a Wi-Fi network when required. All participants used the same set of devices in turns, with their own smartphones.
In the Post-equipment phase, the data was collected from the devices for the analysis. The participants participated in another interview about how their experiences with the device matched their expectations. The participants evaluated the devices according to the same themes as in Pre-equipment phase. In addition, they ranked the devices according to their own user needs. The interviews were conducted by a researcher in either a public meeting location or at the participants' homes. All answers and collected data were anonymized and stored in an online repository.
The daily survey consisted of the following questions in the Pre-equipment study phase:
• When did you fall asleep yesterday? (5-Point Likert-scale: Earlier-Later than normal)
• When did you wake up and leave the bed this morning? (5-Point Likert-scale: Earlier-Later than normal)
• How long did it take to fall asleep after you went to bed yesterday? (5-Point Likert-scale: Less-More time than normal)
• How often do you remember waking up during last night? (5-Point Likert-scale: Less-More than usually)
• In your own opinion, how well did you sleep last night? (10-Point Likert-scale: Worse-Better than normal)
• In your own opinion, how well rested did you feel after waking up today? (10-point Likert-scale: More tired-refreshed)
• Please describe any factors that may have affected your last nights sleep, in either positive or negative (Open ended)
During the Equipment study phase, the survey also contained following questions regarding the used devices:
• Select devices that accurately logged your sleep data last night (Multiple choice)
• Select all sleep-related variables which were inaccurate or seemed inaccurate in last night's sleep data according to each device (Multiple choice grid: Devices, sleep variables)
• Select devices which you experienced some form of problem, error or other malfunction with during last evening, night, or morning (Multiple choice)
• How well does device provided sleep metric correspond to your feeling or alertness or restfulness (5-Point Likert scale per device: Does not correspond-Corresponds)
• Did you sleep by yourself, or next to someone else (Yes, No, Do not wish to disclose)
We recruited participants with open calls at the authors' workplace and using social media to publish the calls to the general public (but limited to the city where the research was conducted). The participants were selected to include both young adults and older participants. Ten participants were recruited and ultimately consisted of four males, six females, with ages ranging from 22 (P2, P4, P7) to 48 (P5, P9).
The participants PSQI scores (range of 0–21, less is better) ranged from average (12, P9) to good (5, P2). Hence no participants' results were removed as outliers due to abnormal sleep routines or schedules. The full participant information is shown in Table 2.
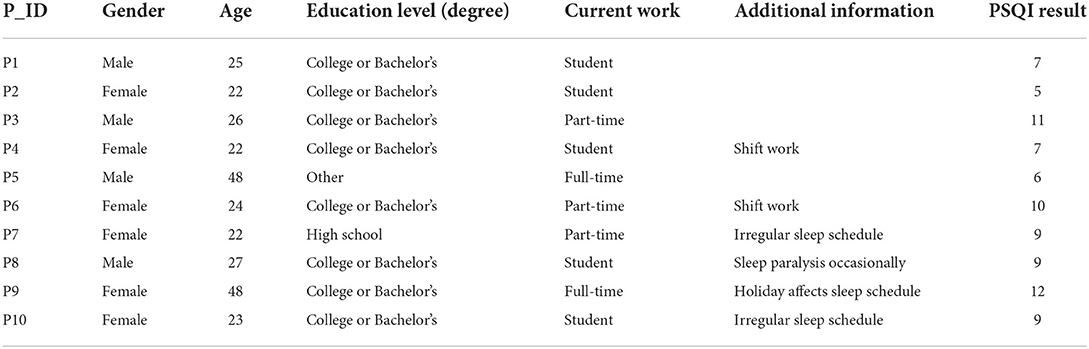
Table 2. Participant information.
In a longitudinal study, participants subjective expectations on devices used may have impact on motivation to register to the study, and to collect data and adhere study requirements. If a participant does not trust the device to provide accurate data, and feels no benefit of collecting data, the effort must be compensated otherwise, i.e., with monetary reward. The devices have to be also easy to use, not to cause burden for study participants.
During the Pre-equipment study phase, we conducted initial technology expectations interviews with the participant, and the devices were introduced and given to the participant. The purpose was to collect the participants' initial expectations on how the different devices would function. Each device and its technical sleep tracking capabilities were described to the participant, how they are used and what information they offer to the user.
During the Post-equipment phase, another interview session was held. The participants were asked to evaluate the devices regarding their thoughts on the devices after the tracking week and talk about their experiences with the technologies. The interview covered the same themes as the expectations interview; thus, participants were able to share insights about both their expectations and their experiences. The participants also ranked the devices from best to worst according to user needs. We evaluate the findings of these interviews through the lens of expectation disconfirmation theory (EDT) (Olson and Dover, 1979) which is frequently used to assess trust in technology (Bhattacherjee and Premkumar, 2004). Essentially, the theory assesses users' expectations of the technology with their experiences after using it. The theoretical framework implies that unfilled expectations and unexpected (emerged) experiences are more potent motivators for trust (or lack of) than fulfilled experiences. The semi-structured interview again consisted of the following themes: ease-of-use, functionality and reliability, and comfortability and sleep disturbance.
SleepScore Max (7/10 participants) and Withings Sleep Analyzer (6/10 participants) were expected to be the most straightforward devices to use, as they are not worn but placed in the sleep environment. Further, Dreem 2 was expected to be the hardest to use or require the most effort (6/10 participants), as it requires the participant to put it on every night before bed. People who are used to wearing a watch expected Fitbit Versa 3 to be easy to use: “I already use a wristwatch, so I think Fitbit Versa 3 will be easy and comfortable.” (P1). P4 thought that if a device requires calibration before use, it will be more burdensome to use.
In practice, Dreem 2 took the most effort to put on (5/10), especially with long hair (1/10) and was dislocated easily (3/10). P3 specified that when wearing Dreem 2, you have to “pull long hair through headband when you have your hair open” (P3). Dreem 2 also had a short battery life (5/10), “Even about 60% battery charge did not last through whole night”(P1). For 4/10 participants, Withings Sleep Analyzer did not connect easily or at all and the mattress needed to be restarted multiple times before connecting: “Withings Sleep Analyzer needed more effort to use since it sometimes had to be unplugged multiple times before connecting to the phone” (P10). Even though Withings Sleep Analyzer required 10 min for calibration after plugging in, half of the participants described it as easy to use.
Withings Sleep Analyzer and SleepScore Max did not connect at all for two users with Android phones even though the operating system fulfilled the requirements: “SleepScore Max did not connect at all for me, even though I tried everything” (P7). The application kept logging out and freezing until it crashed if the device connected at all, the connection would be lost soon after. 6/10 said Fitbit Versa 3 was the easiest device to use.
3/10 participants expected EEG technology of Dreem 2 to provide accurate sleep stage data. Two participants doubted that sleep could be monitored with a mattress, and only one expected Withings Sleep Analyzer to be functional. Some participants were familiar with specific features of the devices, e.g., P6 describes “I am interested to know whether the light level of the room is affecting my sleep” (P6), and P9 tells “The white noise feature of Dreem 2 might help me with my recent troubles with falling asleep” (P9). Four participants said that although they were introduced to the devices, they were unfamiliar with them. Hence, they did not have any expectations related to the technical features of the devices.
After the tracking week, the participants reported that Dreem 2 and SleepScore Max had the most interesting features. Two participants liked the Dreem 2 ocean sounds, but one did not. P9 said the sounds went on by accident and was hard to put off. One participant mentioned the alarm of Dreem 2 as a good thing, even though it woke up the person sleeping next to the participant. For some nights, Dreem 2 did not give the data after pressing the “End Night” -button, and the short battery life made the recording sometimes stop before the night was over. The data transfer time in the morning varied on all devices.
Dreem 2 divided expectations about reliability, 5/10 of participants thought it seemed the most reliable device, but 2/10 were concerned about results being affected due to the headband moving during sleep. P4 based his expectations on the ubiquitousness of the devices, “I doubt that Dreem 2 and Withings Sleep Analyzer are as reliable in sleep monitoring as Fitbit Versa 3 because I have never heard of those devices before being used in sleep monitoring. Watches have been used for a long time and thus seem reliable.” (P4).
The devices that measure sleep remotely were considered less reliable. P5 thought that Withings Sleep Analyzer would be the least reliable device, and P6 doubted if the data is affected by the sleeper turning in the bed. On the other hand, P8 had heard about mattresses used in sleep apnea studies and thought Withings Sleep Analyzer would be the most capable device. Due to lack of physical contact during tracking, the SleepScore Max's ability to track sleep was doubted by 3/10 participants. P9 said he does not know the technologies used by the devices, but he trusts the data the devices provide.
During the tracking week, problems occurred with all the devices. Four participants told SleepScore Max was more reliable than they expected. P2 told “I think the Sleepscore Max was more reliable than I expected” (P2), and P3 compared the reliability of SleepScore Max and Fitbit “In my opinion, the watch and Sleepscore Max were almost on the same level”(P3). A participant who already wore the smartwatch to monitor his sleep was primarily relying on Fitbit Versa 3. Fitbit Versa 3 was thought to be reliable or quite reliable by 8/10 participants after the sleep tracking week, but 3/10 noticed that it had a lot of short awake times during the night: “Fitbit Versa 3 recorded a lot of short awake times, which made me think that maybe the sleep stages are not recorded correctly as well” (P2). Dreem 2 moving or coming off affected 3/10 of participants' feelings of the data being reliable, but when staying in its place, most thought it was probably the most reliable device: “Dreem 2 was the most reliable device although it did track 1 h less than other devices on one night” (P8). The sleeping position impacted tracking, “Sleeping on my stomach, I noticed the headband would always come off during the night.”(P2). 4/10 doubted the reliability of data provided by Withings Sleep Analyzer. There were concerns about whether the mattress would get affected by the person sleeping next to the participant. The device had problems recording the awake times during the night, according to 3/10 participants, in a way that they would know that they are awake, but the device records it as sleeping: “Withings Sleep Analyzer was great in sleep stage monitoring, but for some nights it recorded I was sleeping at a time I knew I was not” (P9).
The devices that track sleep without user contact, Withings Sleep Analyzer (4/10) and SleepScore Max (7/10), were expected to be the most comfortable devices to use and not disturb sleep. However, Withings Sleep Analyzer raised concerns in 2/10 of participants regarding whether the mattress would feel uncomfortable to sleep on. P7 thought that SleepScore Max looks like a camera, which might make falling asleep more difficult.
The comfortability of wearables raised more concerns than the contactless devices. Dreem 2 was expected to be uncomfortable to wear, and it may affect sleep, according to all participants. Fitbit Versa 3 split the views; others thought that it would be unnoticeable to use especially if you are already used to wearing a watch during sleep, while others doubted it might not be comfortable while sleeping: “I do not like wearing anything on my wrist while sleeping” (P9). Three participants wondered if the tightness or heaviness would make Fitbit Versa 3 uncomfortable to use.
4/10 participants thought that measuring sleep itself could affect the sleep quality negatively: “All devices may have a negative impact because of stressing about sleep quality” (P4). On the other hand, P7 believed that the user gets used to the devices in a week, and P8 thought that the devices probably do not disturb sleep at all. Even though P6 had some thoughts on the discomfort of devices, he stated he did not have expectations regarding sleep disturbance.
Aligned with the expectations, SleepScore Max and Withings Sleep Analyzer were comfortable to use since they work remotely. P3 described Withings Sleep Analyzer: “Sometimes the mattress made a small creaky sound during the night” (P3). The time to fall asleep was affected by some when focusing on the sleep monitoring aspect. SleepScore Max did not disturb the sleep when it was connected. However, some experienced the required effort to connect the device just before going to sleep negatively affected sleep latency. Withings Sleep Analyzer started the calibration all over again for some when going to sleep, which moved forward the time falling asleep as well.
As expected, the Dreem 2 was the most uncomfortable device according to 8/10 participants, even though many stated it was not as uncomfortable as they assumed. One participant said he got used to wearing it, and it became unnoticeable after a couple of nights. 2/10 participants could have used an even smaller attachment part than the smallest option, and no one had to change a bigger attachment part to the headband: “I had the smallest extension part but still thought the headband was not tight enough, because it moved and also came off the head multiple times.” (P2). 3/10 of participants recall waking up during the night thinking about the research and whether Dreem 2 would have come off: “I woke up to just feel if Dreem 2 was still on my head during the night” (P6). For some Dreem 2 charging slowly moved their sleeping time since they had to wait before starting the night: “Because Dreem 2 was so slow to charge, I sometimes had to wait for a long time for it to charge before going to bed” (P4).
Fitbit Versa 3 disturbed the sleep more of participants that are not used to wearing watches going to bed. P6 described that the screen of Fitbit Versa 3 turned on often, which was disturbing. 2/10 users said Fitbit felt a bit sweaty to use, and one got a rash out of it. Also, finding a good size was challenging according to P2, “Adjusting the size of the bracelet was in big steps, and I was between two sizes, so the watch was either too loose or too tight.” (P2). P9 said that the research overall was a bit uncomfortable because of all the devices together and all the wires of the devices.
Factors affecting sleep: Every morning, the participants described factors (with an open-ended field) that may have affected their sleep, either positively or negatively. In the following we provide an overview of factors that hindered people's sleep, as such knowledge might be useful for researchers planning to track people's sleep with different approaches.
Related to the device use specifically, we found that during the tracking week, the devices themselves were experienced to impact sleep in 15% (7/47) of the nights.
The most common factor impacting sleep was alcohol. It was mentioned on 16% (22/134) of nights. Work shifts, holidays, or unusual sleep schedule (early wake up or stay up late) were reported on 10% (15/134) nights.
Stress or anxiousness hampered sleep in 7% of nights (10/134). To ease falling asleep, melatonin intake was reported three times (3/134). Night-time temperature (too hot or too cold) impacted sleep quality on 9% (12/134) nights. Also, sleep partner (4/134) and noise from the neighbors (2/134) were mentioned.
The daytime activities were identified as contributing to sleep quality, physical exercise or activity was mentioned in 6% (8/134), relaxing activities, e.g., yoga or meeting friends 4% (5/134), and general daytime activeness 3% (4/134). Daytime napping was reported in 3% (4/134) of the responses. Surprisingly, smartphone use was identified as a factor impacting sleep only in one response (1/134).
Unusual occurrences, e.g., traveling (2/134), pain (1/134), a fight with someone (1/134), and not exercising as usual (1/134), were also reported.
The participants filled out the daily sleep tracking survey every morning, either with a smartphone or desktop computer. They reported factors that impacted their sleep quality, if they faced any issues with the devices and which devices succeeded in tracking their sleep accurately.
After each tracking night, the participants were asked if they experienced any technical problems, malfunction or other issues. Problems were experienced with SleepScore Max in 57% of nights, with Withings Sleep Analyzer in 39% of nights, Dreem 2 in 37% and with Fitbit Versa 3 only in 7% of nights. Two participants (P4, P5) experienced issues with Withings Sleep Analyzer every night, and two participants (P7, P9) with SleepsScore Max every night (included in percentages). In one-quarter of nights (25%), the participants managed to track their sleep with all the four devices without any technical problems or malfunctions.
During the research, it was found that to be able to download the device's applications and connect them to one's phone, and the operating system needed to be IOS 13 or OS 8.0 or higher than those. It was also found that logging in using Apple account would make the data transfer harder, so participants were advised to log in using a Google account instead.
After each tracking night, the participants were asked to select the devices that accurately logged their sleep data from that night (as a summary of bedtime, wake-up time, and total sleep time). The evaluation is based on participant's memory, and can be biased. Dreem 2 was experienced to be accurate most often, 76% of nights. SleepScore Max was accurate on 73%, Fitbit Versa 3 on 67%, and Withings Sleep Analyzer on 46% of nights. Participants also listed the parameters they felt were inaccurate, as seen in Table 3.

Table 3. How often the sleep parameters from each device were experienced as inaccurate.
The participants evaluated how well the provided sleep metrics correspond to their feeling of alertness and restfulness in the morning with a Likert scale of one to five, see Figure 2. Aligned with the experienced accuracy, the Dreem 2 matches the feelings best. Surprisingly, the SleepScore Max provides accurate sleep data more often than Fitbit Versa 3, but Fitbit Versa 3 corresponds to the participants' own experience and feelings better.
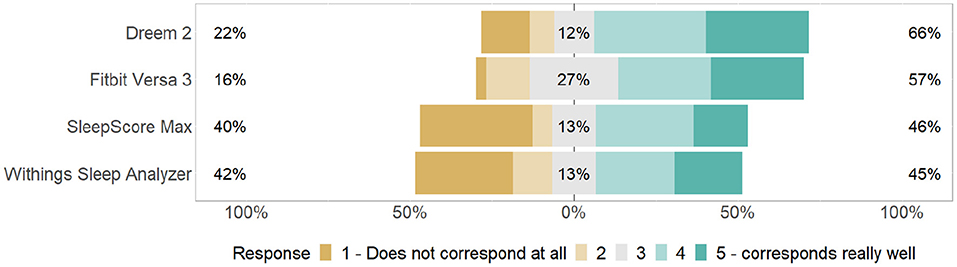
Figure 2. Participants evaluated how well did the provided sleep metrics (e.g., total sleep time, sleep score metrics by the device) correspond to their feeling of alertness and restfulness in the morning.
Finally, participants were asked to rank the devices from best to worst according to their preferences. The result is aligned with the experience of accuracy, see Figure 2. Dreem 2 got the best rank, with half of the participants choosing it as the best device. Fitbit Versa 3 was second best, SleepScore Max third, and Withings Sleep Analyzer fourth. Sleepscore Max and Withings Sleep Analyzer scorings were affected by the fact that some users did not get the devices to work at all, which made the devices useless in their case. SleepScore Max was stylish and easy to use according to P9, but the companion mobile application wasn't good in P4's opinion. Dreem 2 was reported to be somewhat uncomfortable but got a good score because of the accurate data. P4 appreciated the clear companion application of Dreem 2 and the low number of technical problems. In addition, he described the device as “exciting.” P6 ranked Dreem 2 as last because he thought the use was burdensome. P4 had expected Fitbit Versa 3 to be the best device, but after using it, he was not impressed by its sleep stage monitoring.
In the following section we analyse the data exported from the four different sleep trackers, to uncover any significant differences in the data. The metrics that were not comparable between devices were not included in the analysis (e.g., sleep latency was not provided by all devices).
To enable comparison between devices, we performed data cleansing for the sleep data as follows. We removed the SleepScore Max sleep data of P5 night 7, since only awake time was recorded. Withings Sleep Analyzer did not provide awake time for all nights. In such cases, we manually added awake time calculated as total time in bed—total sleep duration. We tried using different methods of detecting outlier devices during nights, e.g., using two standard deviations or fixed values like differences of two or more hours, but it proved challenging to identify behavior where one device differed from all other three, or in cases of two outlier behaviors we did not have solid grounds for determining which device of the two was the outlier, or the inaccurate one? As our analysis is not based on validating these devices (as this has already been conducted in the cited works), but merely to investigate the differences in the tracked data, the lack of a baseline value does not prove problematic in the following analysis.
Due to missing entries from some devices for each night using a typical method of measuring differences with ANOVA was not feasible as we could not reasonably replace any missing values. Instead, we compared the devices pairwise using paired Wilcoxon rank sum test, see Table 4. We compared the nights with data provided from both devices, and outliers were removed with Z-score anomaly detection, and the data points deviating >3 standard deviation were removed. Figure 3 illustrates the variance from each device in sleep phase, total bed time and total sleep duration. From Table 4 we note following statistical differences according to the Wilcoxon rank sum test, supported by Figure 3 where we can observe the direction and relation of differences between devices.
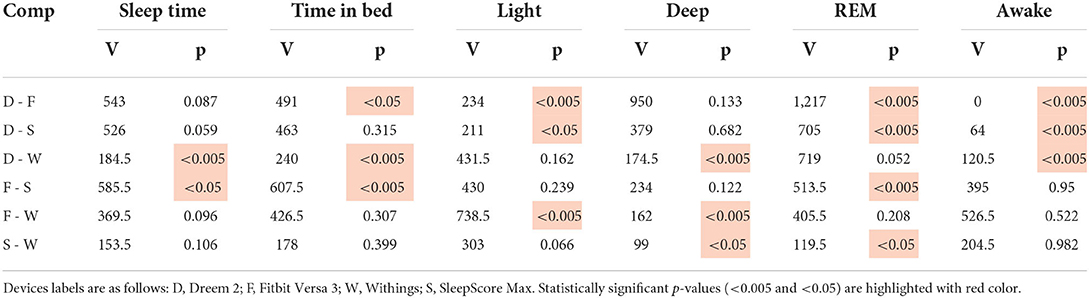
Table 4. Wilcoxon rank sum test results of pairwise comparison.
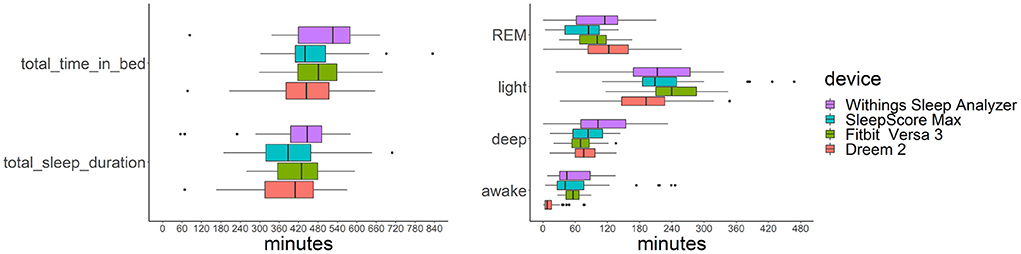
Figure 3. Distribution of sleep data from each of the four devices.
Sleep time: Dreem 2 records shortest sleep duration, and a statistically significant difference was seen between Dreem 2 and Withings Sleep Analyzer (p < 0.005). In addition, Fitbit and SleepScore Max differ significantly (p < 0.05).
Time in bed: For time in bed Dreem 2 had significant differences to Fitbit Versa 3 (p < 0.05) and Withings Sleep Analyzer (p < 0.005), and Fitbit differed from SleepScore Max (p < 0.005).
Light: Dreem 2 gives the lowest amount for light sleep, with significant difference for two highest values, Fitbit Versa 3 and SleepScore Max. Fitbit Versa 3 differed significantly from Withings Sleep Analyzer.
Deep: Withings Sleep Analyzer differs significantly (p < 0.05) from other devices for measuring deep sleep. No other significant differences.
REM: SleepScore Max differs significantly from other devices in REM sleep detection, measuring less REM sleep than others. In addition, Dreem 2 and Fitbit Versa 3 had statistically significant difference (p < 0.005).
Awake: Dreem 2 differs statistically (p < 0.005) from all other devices, it measures lowest numbers for the awake time. This might be explained by the use, the headband might be taken off right after waking up, but the sleeper might stay in bed after that. No significant difference in awake time between other devices.
The share of each sleep stage may vary between individuals, but on average, a healthy adult has 13–23% deep sleep, 20–25% of REM sleep (Altevogt and Colten, 2006). The rest is light sleep (52–67%). Arousals are a normal part of sleep (Halász et al., 2004), and it depends on the sleep tracker how these are taken into account in the metrics. Some trackers specify restless sleep, and some count the arousals as time awake. Deep sleep, REM sleep and light sleep add up to total sleep time. Awake time, including sleep onset period and being awake in bed during the morning, and total sleep time equal to total time in bed. Table 5 provides the mean and standard deviation for the share of each sleep stage across all participants and nights. As we see, the average share of deep sleep exceeds the common average in the metrics by Withings Sleep Analyzer and the share of REM by Dreem 2. The observations of deep sleep by Withings Sleep Analyzer differed also statistically from all other devices. REM sleep differed statistically from SleepScore Max and Fitbit Versa 3.
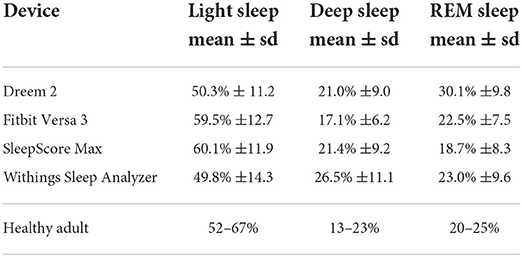
Table 5. The mean share of sleep stages of total sleep time as percentages, standard deviation in brackets.
As mentioned in Section 4.3.1, the participants experienced several device issues. Only one-quarter of nights, there was no reported malfunction in any of the devices. Table 6 shows that our participants were able to successfully collect data with an average of 3.0 devices per night. P3 was able to track his sleep with four devices every night, but P4 faced technical problems ending up with average of 1.7 devices per night with successfully collected sleep data.
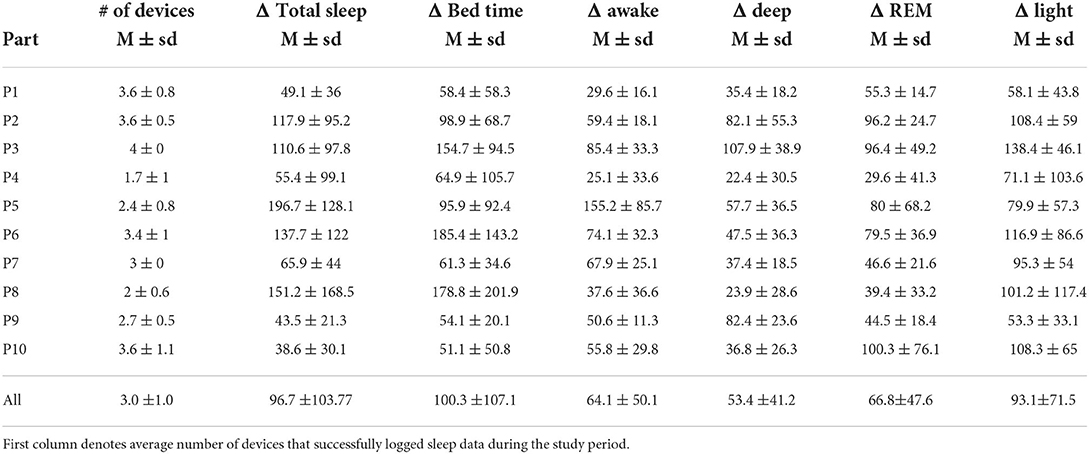
Table 6. Mean difference between the lowest and highest result for each night for all parameters (in minutes).
To characterize the difference in the sleep data provided by different devices, we counted the difference between the highest and lowest observation for each night. For P10, the mean of this difference was only 39 min (SD = 30) for the week and for P9, 44 min (SD = 21), while in P5's sleep data, the average difference between the highest and lowest observation per night is 197 min and for P8 it is 151 min. Figure 4 illustrates the variation in total sleep time for these participants. We see that for P10 and P9, the devices give somewhat similar results, but P5 and P8 have versatile results for each night. The collected data between devices and participants varied highly, as shown in Table 6 which summarizes these differences.
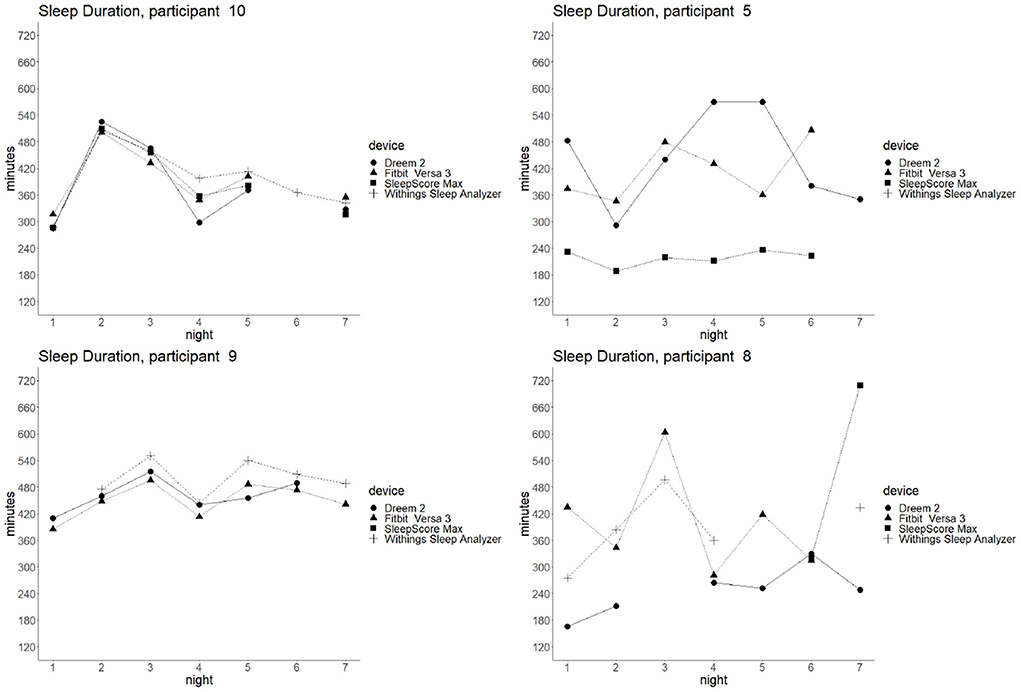
Figure 4. Example of high/low variance in different devices: total sleep time of four participants per each night by different devices. On the left, range of P10 and P9 sleep tracking results is narrow. On the right, the sleep tracking data deviates more for participants P5 and P8.
The daily sleep survey helps reveal some reasons for gaps in the data. For example, P10 was missing data for all devices except Fitbit on night 6, and from the daily survey, we could observe that this was likely due to sleeping alone that night (as opposed to next to someone on all other nights). Although we cannot clearly explain what causes these differences between participants, suboptimal sleeping conditions and non-constant variables related to sleep hygiene most likely influence end-user sleep quality and the quality of data collection in these studies.
As mentioned in Section 4.3.1, the participants experienced several device issues. Only one-quarter of nights, there was no reported malfunction in any of the devices. Table 6 shows that our participants were able to successfully collect data with an average of 3.0 devices per night. P3 was able to track his sleep with four devices every night, but P4 faced technical problems ending up with average of 1.7 devices per night with successfully collected sleep data.
To characterize the difference in the sleep data provided by different devices, we counted the difference between the highest and lowest observation for each night. For P10, the mean of this difference was only 39 min (SD = 30) for the week and for P9, 44 min (SD = 21), while in P5's sleep data, the average difference between the highest and lowest observation per night is 197 min and for P8 it is 151 min. Figure 4 illustrates the variation in total sleep time for these participants. We see that for P10 and P9, the devices give somewhat similar results, but P5 and P8 have versatile results for each night. The collected data between devices and participants varied highly, as shown in Table 6 which summarizes these differences.
The daily sleep survey helps reveal some reasons for gaps in the data. For example, P10 was missing data for all devices except Fitbit on night 6, and from the daily survey, we could observe that this was likely due to sleeping alone that night (as opposed to next to someone on all other nights). Although we cannot clearly explain what causes these differences between participants, suboptimal sleeping conditions and non-constant variables related to sleep hygiene most likely influence end-user sleep quality and the quality of data collection in these studies.
This work describes user expectations and experiences of using four commercially available sleep tracking devices. Further, we analyze the sleep data quality collected in home settings by these devices. We first discuss on the experiences collected via interviews, and then we highlight the takeaways and recommendations on research point of view.
If the user has only one device (expected to be the typical use case), the user compares the sleep metrics to his subjective experience. Previous research has identified different perceptions toward the sleep data, the user may be trusting (agrees with the data), neutral (either agree or disagree) or doubtful (own experiences mismatch with the data) (Kuosmanen et al., 2022). Further, not only does the subjective experience impact the data validity (experienced sleep quality compared to data), the functionality and physical appearance of the device and the user interfaces, and the device's reputation may affect the data credibility (Liang and Ploderer, 2020). We discussed the participants' expectations of the devices before the data collection.
Participants generally expected contactless sensing devices (Withings Sleep Analyzer and SleepScore Max) to be easy to use, and wearables that are put on when going to bed (Dreem 2) require more effort. Some based their expectations on the reputation of the device or familiarity with the device or its sensors, and some of the more exotic tracking methods were initially thought to be unreliable or non-functional. Liang and Ploderer (2020) found out that agreement with the pre-assumptions increases the credibility of collected data. Alternatively, the Expectation Disconfirmation Theory suggests that if negative expectations are not experienced, users experience more satisfaction and trust in the device (Lankton and McKnight, 2012; Lankton et al., 2014). The functionality and reliability of more "exotic" sensors were initially doubted, but ultimately, the participants were convinced of these technologies. It was also reported that using a combination of four sleep trackers impacted the participants' sleep quality and caused more sleep disturbances than, e.g., stress or unusual sleep schedules. So even if sleep trackers are generally obtained to improve sleep quality through a data-driven approach, they can also negatively affect your sleep.
During the tracking, our participants reported multiple challenges similar to challenges that emerged in work by Liu et al. (2015). Some devices cause physical discomfort or stress. The user had to wait until the battery was fully charged before going to sleep, or the battery could run out during the night. Practical issues, such as a partner moving or the device becoming misplaced (Dreem 2), made users doubt the accuracy of the data. Similar issues were also reported by Liang and Ploderer (2020). The automatic detection of sleep was experienced as effortless, but on the other hand, it might misinterpret as lying in bed as sleep. Some took naps during the day, wearable devices may track the nap automatically, but if you just happen to fall into sleep on the couch, the wear-on or in-bedroom trackers miss those. The incorrect sleep detection was also categorized as development immaturity in Liu et al. (2015), along with problems with lost data when updating the smartphone software. Our participants experienced issues with synchronization, and some did not manage to get the devices working at all. Also, data export issues were experienced in both studies. In general, the participants had doubts about tracking reliability. The result congruence also raised questions. The data from one device might differ for some nights without an understandable reason. For some participants, the data provided by the different devices conflicted.
The user reflects the data on his own experience on his sleep quality. Understanding our sleep is sometimes difficult, as we do not remember or feel, e.g., the sleep cycles. Different devices provide the same sleep metrics but might be differently calculated. For example, some devices count micro-arousals as awake time while others report them as restless sleep. Interpreting these differences when comparing the numbers might require understanding the definitions of the provided metrics.
Unique sleep habits pose a challenge for the current sleep tracking technologies; e.g., P5 described that he sometimes goes back to sleep after a cup of coffee in the morning, and told that it is easy to forget to put on the trackers that have to be started for tracking. In such situations, wearables with automatic sleep detection, like Fitbit Versa 3, detect going back to sleep accurately, but many devices might cease sleep tracking. This will unavoidably result in differences in detected sleep duration. Depending on the proprietary algorithm, the device might count the second sleep period as part of the night sleep, as a nap, or not at all. P3 said that when he wakes up to the first alarm on work days, he checks his email and continues sleeping. He noticed that all trackers missed him waking up. These experiences highlight the importance of qualitative data collection in sleep research. The reason for deviating sleep metrics should be captured by daily qualitative data collection.
Future visions exist of using the data collected by self-tracking devices in healthcare. However, the accuracy of the data collected by different devices may not be comparable with the vision. So far, people can use the devices to gain awareness of factors influencing sleep. Even though the accuracy of the consumer sleep tracking device was not perfect, if the bias is static, the trends and changes in sleep can be detected, e.g., due to stress, the amount of overall sleep and the amount of deep sleep have decreased this week. If the measurement cannot be done successfully and repeatedly, e.g., the device is misplaced during the night, then the results are less valuable. These problems and challenges are also evident for research use, which often relies on long-term tracking on digital devices like mobile phones or wearables.
One of the main emerging takeaways from our analysis of both the quantitative and qualitative data is that sleep trackers lack reliability, both regarding the data they provide but also the reliability of the data collection.
In the study by Chinoy et al. (2021), the sleep data was collected in a lab via consumer-grade sleep trackers. Even though the paper describes their practices to ensure successful data collection, there was data loss with all devices on some nights. Hence, we expected to face some challenges in our study, as the data collection is done in real-life independently by participants. Yet, it was surprising how many problems the participants faced in using the devices.
Three of the four devices (Withings Sleep Analyzer, SleepScore Max, Dreem 2) were designed solely for sleep tracking, yet those three devices all ended up being less reliable than the Fitbit Versa 3. The trio also shared a more diverse set of problems regarding reliability than the Fitbit Versa 3, and even though the smartphone fulfilled the technical requirements reported by the manufacturer, the connection did not work at all with Withings Sleep Analyzer and SleepScore Max for some participants. The only mentioned reliability issue with Fitbit Versa 3 was tracking sleep stages (awake time in particular), but these issues were shared across all four devices (and seen in the quantitative analysis).
Another highlight was the high variance in sleep metrics provided by different devices. When comparing sleep statistics between devices across all participants, the differences were aligned with previous studies. For example, we noticed that Dreem 2 gives assesses the shortest awake time, a statistically significant difference from other devices. This is aligned with Arnal et al. (2020); compared to PSG, Dreem 2 underestimated the wake time. Further, we noticed that SleepScore Max measures the shortest time for REM sleep, with a statistically significant difference to Dreem 2 and Fitbit Versa 3, similar to Zaffaroni et al. (2019).
Even though the devices achieve good accuracy in validation studies in a controlled environment, and our combined statistics are aligned with prior research in terms of the accuracy features in each device, in practice, devices often fail to measure sleep accurately. When comparing the sleep statistics between devices participant-wise, we noticed variation between participants in the range of sleep parameters from single night. From the perspective of conducting research with these devices, this can be considered concerning. For instance, some participants got similar results with all devices, e.g., for P10, the difference between the maximum and minimum observation of total sleep time was, on average, 39 min per night. But for some, the differences were much more significant, e.g., P5's data showcased an average difference of 197 min (3h 17min) between a minimum and maximum measurements of a night. The average sleep time for one night across all devices for P5 was 6h 2min.
The following is a set of lessons learned and recommendations for guidelines on studies looking to incorporate sleep tracking as part of the data collection procedure.
To ensure accurate data, a researcher should study the validation studies for each device to pinpoint what metrics are accurately provided by that device; e.g., Dreem 2 underestimates awake time, Fitbit tends to overestimate each sleep phase, SleepScore Max underestimates REM, etc. Unless the sleep metric is validated as accurate, the study dataset could suffer from noise and low quality data.
One option for a study design would be to focus on a specific sleep metric and make the device choice based on its capabilities. If one's study is to measure the effect of yoga on deep sleep or late-night gaming on awake periods, the choice of the device should reflect this choice. A device chosen haphazardly might significantly skew the results if that device does not provide accurate information on the required metric.
However, the variation in sleep duration tracking was dependent on the participant. If the study focuses on generic sleep duration or tracks sleep timing, the choice of the device would be best based on how the technology best fits in the participants' daily life. For example a stationary device like Withings Mattress would not be suitable for a participant who travels or otherwise spends their nights in more than one location if the study's goal is simply to track sleep timing.
Both data losses and data inconsistencies are issues in any field study. Although sleep diaries are likely not as effective measurement methods as digital sleep trackers, the use of daily or weekly diaries, surveys, or other qualitative logging methods can ensure that any inconsistencies or abnormal behaviors in data get captured. These methods can help researchers make sense of otherwise unrecognizable behavior reflected in the datasets. Identifying reasons for potential outliers can help in the decision to discard or hold on to data entries. The unique habits impacting sleep data collection (mentioned in Section 5.2), can be also identified through qualitative data.
In our week-long study setting, the participants experienced surprisingly many technical difficulties or other problems in collecting data about their sleep. Three out of four devices (except for Fitbit) had some form of difficulty on 37%-57% nights during the study. Fitbit was likely the most straightforward device to use - one would wear it throughout the day (and night) and charge it every few days. All other devices required further instructions or set-up to be reliable. Even though the researcher conducting the study visited the participant's home and gave instructions regarding setting up the devices, Wi-Fi connections, how to use the companion applications, etc., many participants, both young adults (20–30) or older (40-) participant groups suffered from data gaps or other problems.
We hypothesize that the sleep routines of a user might impact the accuracy of some devices, e.g., P2 described he tends to sleep on his stomach, which tends to displace the Dreem 2 headband. SleepScore Max user manual describes that the device has to be placed 40–120 cm from the sleeper, the bottom of the device shall be higher than the mattress, and the device should face toward the user's chest with no obstacles (e.g., a glass of water) between the device and the sleeper. We do not know how closely the participants have followed this guidance in practice. Hence, the requirements should be communicated well for the participants.
Many of the devices instruct users to treat initial days of use as calibration periods, and the researchers should leverage a similar approach; not necessarily to ensure more precise data quality but to ensure any initial problems with the device used in a study are sorted out at the beginning of the study. Naturally, we would advocate the researchers themselves to be experts or at least proficient in using the selected device - especially if the device uses any less traditional sleep tracking methods, like the contactless devices used in our study setting.
Lastly, we would advocate for researchers to consider how much data they expect to collect during their study. With most devices, significant data loss or data gaps will occur, or at least there is a high probability of such an event. The study duration should be adapted to ensure a sufficient amount of data will be collected. Other considerations for study duration should also be taken from more generic guidelines regarding, e.g., participant interest declining over the first few weeks of study in any setting where the participant is required to actively participate.
Additionally, researchers should have a risk management plan for cases where significant technical problems occur or if more minor technical problems result in declining participant motivation to continue participation. For example, using the Dreem 2 device can be experienced as burdensome—even though most participants stated that they got used to wearing it relatively quick—and if the participant experiences both sleep disturbances (even minor ones) and technical problems with the devices, this could rapidly lead to ending their participation. Researchers should have a backup plan for such cases.
Sleep tracking devices typically have a calibration period where the device adapts its algorithms to the user, e.g., Dreem 2 algorithm recommends a calibration time of 1 week before adjusting. This could impact the data collected in this study, similarly to the studies cited in our work which largely also neglect such calibration periods. The validation studies for SleepScore Max were performed on an earlier device model (the S+) which uses the same SleepScore algorithm than the SleepScore Max.
The sample size in this study is not large enough to make any statistical conclusions on the accuracy of used devices, this paper presents general problems with using sleep trackers in research. Further, when comparing the sleep data pairwise between devices, multiple data points are collected from each participant, which may violate the independency assumption. Further research is warranted to study the differences between devices.
The raw data supporting the conclusions of this article will be made available by the authors, without undue reservation.
Ethical review and approval was not required for the study on human participants in accordance with the local legislation and institutional requirements. The patients/participants provided their written informed consent to participate in this study.
AV and RR contributed to conception and design of the study. RR conducted the data collection. EK had the main responsibility of the data analysis with contribution of AV and RR. SH supervised the study. All authors contributed to manuscript revision, and approved the submitted version.
This work was funded by the Academy of Finland (project numbers 318930, 335729, and 349637), and with the support of Biocenter Oulu, spearhead project ICON.
We acknowledge the contributions of students who initially participated in piloting this study design; Joonas Niemi, Saku Salo, and Roosa Risto who is also co-authoring this work.
The authors declare that the research was conducted in the absence of any commercial or financial relationships that could be construed as a potential conflict of interest.
All claims expressed in this article are solely those of the authors and do not necessarily represent those of their affiliated organizations, or those of the publisher, the editors and the reviewers. Any product that may be evaluated in this article, or claim that may be made by its manufacturer, is not guaranteed or endorsed by the publisher.
Altevogt, B. M., and Colten, H. R. (2006). Sleep disorders and sleep deprivation: an unmet public health problem. Washington, DC: Institute of Medicine: National Academies Press.
Arnal, P. J., Thorey, V., Debellemaniere, E., Ballard, M. E., Bou Hernandez, A., Guillot, A., et al. (2020). The dreem headband compared to polysomnography for electroencephalographic signal acquisition and sleep staging. Sleep 43, zsaa097. doi: 10.1093/sleep/zsaa097
Bhat, S., Ferraris, A., Gupta, D., Mozafarian, M., DeBari, V. A., Gushway-Henry, N., et al. (2015). Is there a clinical role for smartphone sleep apps? comparison of sleep cycle detection by a smartphone application to polysomnography. J. Clin. Sleep Med. 11, 709–715. doi: 10.5664/jcsm.4840
Bhattacherjee, A., and Premkumar, G. (2004). Understanding changes in belief and attitude toward information technology usage: a theoretical model and longitudinal test. MIS Q. 28, 229–254. doi: 10.2307/25148634
Bonnet, M. H. (1985). Effect of sleep disruption on sleep, performance, and mood. Sleep 8, 11–19. doi: 10.1093/sleep/8.1.11
Bonnet, M. H. (1989). The effect of sleep fragmentation on sleep and performance in younger and older subjects. Neurobiol Aging 10, 21–25. doi: 10.1016/S0197-4580(89)80006-5
Buysse, D. J. (2014). Sleep health: can we define it? does it matter? Sleep 37, 9–17. doi: 10.5665/sleep.3298
Buysse, D. J., Reynolds, I. I. I. C. F, Monk, T. H., Berman, S. R., and Kupfer, D. J. (1989). The pittsburgh sleep quality index: a new instrument for psychiatric practice and research. Psychiatry Res. 28, 193–213. doi: 10.1016/0165-1781(89)90047-4
Chesson, A. L. Jr., Ferber, R. A., Fry, J. M., Grigg-Damberger, M., Hartse, K. M., Hurwitz, T. D., et al. (1997). The indications for polysomnography and related procedures. Sleep 20, 423–487. doi: 10.1093/sleep/20.6.423
Chinoy, E. D., Cuellar, J. A., Huwa, K. E., Jameson, J. T., Watson, C. H., Bessman, S. C., et al. (2021). Performance of seven consumer sleep-tracking devices compared with polysomnography. Sleep 44, zsaa291. doi: 10.1093/sleep/zsaa291
Choi, Y. K., Demiris, G., Lin, S.-Y., Iribarren, S. J., Landis, C. A., Thompson, H. J., et al. (2018). Smartphone applications to support sleep self-management: review and evaluation. J. Clin. Sleep Med. 14, 1783–1790. doi: 10.5664/jcsm.7396
De Zambotti, M., Godino, J. G., Baker, F. C., Cheung, J., Patrick, K., and Colrain, I. M. (2016). The boom in wearable technology: cause for alarm or just what is needed to better understand sleep? Sleep 39, 1761–1762. doi: 10.5665/sleep.6108
Dobmeier, R. J., Hernandez, T. J., Barrell, R. J., Burke, D. J., Hanna, C. J., Luce, D. J., et al. (2011). Student knowledge of signs, risk factors, and resources for depression, anxiety, sleep disorders, and other mental health problems on campus. N. Y. J. Student Affairs 11, 103–122. doi: 10.1111/j.1440-1843.2011.02015.x
Douglas, N. J., Thomas, S., and Jan, M. A. (1992). Clinical value of polysomnography. Lancet 339, 347–350. doi: 10.1016/0140-6736(92)91660-Z
Dunn, J., Runge, R., and Snyder, M. (2018). Wearables and the medical revolution. Per. Med. 15, 429–448. doi: 10.2217/pme-2018-0044
Edouard, P., Campo, D., Bartet, P., Yang, R.-Y., Bruyneel, M., Roisman, G., et al. (2021). Validation of the withings sleep analyzer, an under-the-mattress device for the detection of moderate-severe sleep apnea syndrome. J. Clin. Sleep Med. 17, 1217–1227. doi: 10.5664/jcsm.9168
Evans, S., Alkan, E., Bhangoo, J. K., Tenenbaum, H., and Ng-Knight, T. (2021). Effects of the COVID-19 lockdown on mental health, wellbeing, sleep, and alcohol use in a uk student sample. Psychiatry Res. 298, 113819. doi: 10.1016/j.psychres.2021.113819
Fitbit (2001). Fitbit versa 3 user manual version 1.12. Available online at: https://help.fitbit.com/manuals/manual_versa_3_en_US.pdf (accessed June 16, 2022).
Haghayegh, S., Khoshnevis, S., Smolensky, M. H., Diller, K. R., Castriotta, R. J., et al. (2019). Accuracy of wristband fitbit models in assessing sleep: systematic review and meta-analysis. J. Med. Internet Res. 21, e16273. doi: 10.2196/16273
Halász, P., Terzano, M., Parrino, L., and Bódizs, R. (2004). The nature of arousal in sleep. J. Sleep Res. 13, 1–23. doi: 10.1111/j.1365-2869.2004.00388.x
Ibáñez, V., Silva, J., and Cauli, O. (2018). A survey on sleep assessment methods. PeerJ. 6, e4849. doi: 10.7717/peerj.4849
Ibáñez, V., Silva, J., Navarro, E., and Cauli, O. (2019). Sleep assessment devices: types, market analysis, and a critical view on accuracy and validation. Expert Rev. Med. Devices 16, 1041–1052. doi: 10.1080/17434440.2019.1693890
Jeon, L., and Finkelstein, J. (2015). “Consumer sleep tracking devices: a critical review,” in Digital Healthcare Empowering Europeans: Proceedings of MIE 2015, Vol. 210 (Madrid), 458.
Kuosmanen, E., Visuri, A., Kheirinejad, S., van Berkel, N., Koskimäki, H., Ferreira, D., et al. (2022). “How does sleep tracking influence your life? experiences from a longitudinal field study with a wearable ring,” in Proceedings of the 24th International Conference on Human-Computer Interaction with Mobile Devices and Services.
Lankton, N., McKnight, D. H., and Thatcher, J. B. (2014). Incorporating trust-in-technology into expectation disconfirmation theory. J. Strategic Inf. Syst. 23, 128–145. doi: 10.1016/j.jsis.2013.09.001
Lankton, N. K., and McKnight, H. D. (2012). Examining two expectation disconfirmation theory models: assimilation and asymmetry effects. J. Assoc. Inf. Syst. 13, 1. doi: 10.17705/1jais.00285
Liang, Z., and Chapa-Martell, M. A. (2019). Accuracy of fitbit wristbands in measuring sleep stage transitions and the effect of user-specific factors. JMIR mHealth uHealth 7, e13384. doi: 10.2196/13384
Liang, Z., and Ploderer, B. (2020). How does fitbit measure brainwaves: a qualitative study into the credibility of sleep-tracking technologies. Proc. ACM Interact. Mobile Wearable Ubiquitous Technol. 4, 1–29. doi: 10.1145/3380994
Liu, W., Ploderer, B., and Hoang, T. (2015). “In bed with technology: challenges and opportunities for sleep tracking,” in Proceedings of the Annual Meeting of the Australian Special Interest Group for Computer Human Interaction (Parkville), 142–151.
National Advisory Board on Research Ehics (2019). Ethical principles of research in the humanities and social and behavioural sciences and proposals for ethical review. Available online at: https://tenk.fi/sites/default/files/2021-01/Ethical_review_in_human_sciences_2020.pdf (accessed March 22, 2022).
Olson, J. C., and Dover, P. A. (1979). Disconfirmation of consumer expectations through product trial. J. Appl. Psychol. 64, 179. doi: 10.1037/0021-9010.64.2.179
Ong, A. A., and Gillespie, M. B. (2016). Overview of smartphone applications for sleep analysis. World J. Otorhinolaryngol. Head Neck Surg. 2, 45–49. doi: 10.1016/j.wjorl.2016.02.001
Patel, P., Kim, J. Y., and Brooks, L. J. (2017). Accuracy of a smartphone application in estimating sleep in children. Sleep Breath. 21, 505–511. doi: 10.1007/s11325-016-1425-x
Robbins, R., Seixas, A., Walton Masters, L., Chanko, N., Diaby, F., Vieira, D., et al. (2019). Sleep tracking: a systematic review of the research using commercially available technology. Curr. Sleep Med. Rep. 5, 156–163. doi: 10.1007/s40675-019-00150-1
Sadek, I., Demarasse, A., and Mokhtari, M. (2019). Internet of things for sleep tracking: wearables vs. nonwearables. Health Technol. 10, 333–340. doi: 10.1007/s12553-019-00318-3
Schade, M. M., Bauer, C. E., Murray, B. R., Gahan, L., Doheny, E. P., Kilroy, H., et al. (2019). Sleep validity of a non-contact bedside movement and respiration-sensing device. J. Clin. Sleep Med. 15, 1051–1061. doi: 10.5664/jcsm.7892
Shelgikar, A. V., Anderson, P. F., and Stephens, M. R. (2016). Sleep tracking, wearable technology, and opportunities for research and clinical care. Chest 150, 732–743. doi: 10.1016/j.chest.2016.04.016
Tettamanti, G., Auvinen, A., Åkerstedt, T., Kojo, K., Ahlbom, A., Heinävaara, S., et al. (2020). Long-term effect of mobile phone use on sleep quality: results from the cohort study of mobile phone use and health (cosmos). Environ Int. 140:105687. doi: 10.1016/j.envint.2020.105687
Keywords: sleep tracking, wearables, comparison, field study, consumer sleep trackers
Citation: Kuosmanen E, Visuri A, Risto R and Hosio S (2022) Comparing consumer grade sleep trackers for research purposes: A field study. Front. Comput. Sci. 4:971793. doi: 10.3389/fcomp.2022.971793
Received: 17 June 2022; Accepted: 18 August 2022;
Published: 07 September 2022.
Edited by:
Huy Phan, Queen Mary University of London, United KingdomReviewed by:
Simon Hartmann, University of Adelaide, AustraliaCopyright © 2022 Kuosmanen, Visuri, Risto and Hosio. This is an open-access article distributed under the terms of the Creative Commons Attribution License (CC BY). The use, distribution or reproduction in other forums is permitted, provided the original author(s) and the copyright owner(s) are credited and that the original publication in this journal is cited, in accordance with accepted academic practice. No use, distribution or reproduction is permitted which does not comply with these terms.
*Correspondence: Elina Kuosmanen, ZWxpbmEua3Vvc21hbmVuQG91bHUuZmk=
Disclaimer: All claims expressed in this article are solely those of the authors and do not necessarily represent those of their affiliated organizations, or those of the publisher, the editors and the reviewers. Any product that may be evaluated in this article or claim that may be made by its manufacturer is not guaranteed or endorsed by the publisher.
Research integrity at Frontiers
Learn more about the work of our research integrity team to safeguard the quality of each article we publish.