
95% of researchers rate our articles as excellent or good
Learn more about the work of our research integrity team to safeguard the quality of each article we publish.
Find out more
ORIGINAL RESEARCH article
Front. Comput. Sci. , 04 October 2022
Sec. Human-Media Interaction
Volume 4 - 2022 | https://doi.org/10.3389/fcomp.2022.932342
This article is part of the Research Topic Serious Games, volume II View all 6 articles
 Dimitris Fotopoulos1*
 Ioannis Ladakis1Vassilis Kilintzis1Achilleas Chytas1
 Elisavet Koutsiana1Theodoros Loizidis2
 Ioanna Chouvarda1*
Motor learning is based on the correct repetition of specific movements for their permanent storage in the central nervous system (CNS). Rehabilitation relies heavily on the repetition of specific movements, and game scenarios are ideal environments to build routines of repetitive exercises that have entertaining characteristics. In this respect, the gamification of the rehabilitation program, through the introduction of game-specific techniques and design concepts, has gained attention as a complementary or alternative to routine rehabilitation programs. A gamified rehabilitation program promises to gain the patient's attention, to reduce the monotony of the process and preserve motivation to attend, and to create virtual incentives through the game, toward maintaining compliance to the “prescribed” program. This is often achieved through goal-oriented tasks and real-time feedback in the form of points and other in-game rewards. This paper describes MILORD rehabilitation platform, an affordable technological solution, which aims to support health professionals and enable remote rehabilitation, while maintaining health service characteristics and monitoring. MILORD is an end-to-end platform that consists of an interactive computer game, utilizing a leap motion sensor, a centralized user management system, an analysis platform that processes the data generated by the game, and an analysis dashboard presenting a set of meaningful features that describe upper limb movement. Our solution facilitates the monitoring of the patients' progress and provides an alternative way to analyze hand movement. The system was tested with normal subjects and patients and experts to record user's experience, receive feedback, identify any problems, and understand the system's value in monitoring and support motion defect and progress. This small-scale study indicated the capacity of the analysis to quantify the movement in a meaningful way and express the differences between normal and pathological movement, and the user experience was positive with both patients and normal subjects.
Motor control is a complex process or a set of sub-processes that involves the coordination of muscles and limbs to perform a motor skill either voluntary or as a reflex. From birth, humans are trained in motor control by integrating sensory-motor information, a procedure called motor-learning. First, through observation and following via repetition, movements are consolidated in the central nervous system (CNS). Certain pathologies or injuries affect the CNS resulting in the loss of cognitive functions of the brain. This may impact several motor functions and cause partial or complete loss. Rehabilitation programs aim to detect motor deficits and help patients regain control of their movements through motor learning. The standard rehabilitation procedure entails the repetitive training of the correct form of isolated movements. Although effective, the monotony of the standard procedure often requires expert supervision to ensure compliance with the protocol.
The focus of this paper is to present MILORD, an end-to-end platform for remote upper limb rehabilitation. MILORD consists of a 3D interactive computer game and an analysis platform based on a novel set of movement-related features, which can be used for a detailed upper limb movement characterization. MILORD aims to optimize the motor control and learning processes by providing an engaging way for rehabilitation exercise execution along with a set of statistical tools that quantitatively evaluate the patient's upper limb motion and overall performance. The quantitative analysis establishes a baseline that can distinguish between healthy and pathological movement and additionally quantifies the patient's rehabilitation progress and improvement.
This work presents the complete platform, in terms of a rehabilitation game in virtual 3D CGI environment, a secure data management and automatic analysis system, and an application for the physician to moderate access, configure the game, and explore the results, along with evaluation results.
There has been an increasing number of studies regarding the assistance of physical rehabilitation and conventional treatment methods via technology (Ang and Guan, 2013; Meijer et al., 2018). This interest in technology-based rehabilitation has led to the development of an emerging domain that combines exergames, gamification mechanisms, and traditional rehabilitation methodologies (Smeddinck et al., 2015). These novel treatment methodologies combine software and hardware to facilitate the process of motor learning, by introducing an efficient (Veerbeek et al., 2017) and more rewarding way of performing a series of repetitive and functional movements, which are required for the rehabilitation of patients with motor deficits.
Most of the existing research works on the gamification of conventional treatment methods refer to the development of VR games (3D simulations of the real world) in conjunction with a set of sensors or one sensor that is capable of mapping and capturing the hand motion (Koutsiana et al., 2020). One of the most recent studies (Ma et al., 2018) presents the VR simulation of a bowling game with the use of Kinect and Vicon sensors. The target of this system is to restore hand and wrist motion in people that have previously experienced stroke. Another recent work (Ghassemi et al., 2019) also focused on stroke survivors using an EMG sensor to rehabilitate the fine motor skills of the wrist and fingers. The scenarios of the game were to move on a tiled screen and reveal images or to move inside a maze.
The hand-tracking sensor leap motion has attracted the interest of the research community because of its ability to accurately capture hand motion. Its tracking ability led to its use for the transposition of a subject's hand movement in 3D virtual worlds and serious games that try to imitate conventional treatment methods. Dias et al. (2019) presented a system that used leap motion in combination with Oculus Rift VR Headset focusing on post-stroke hand rehabilitation. In the work of Afyouni et al. (2017), leap motion was used for a system that aimed at the rehabilitation of various hand parts. The game-based system instructed the users to follow various trajectories in a 3D world.
While most of the existing studies proceed in the validation of their system via large- or small-scale experiments and the analysis of the extracted data, few go as far as to develop a complete monitoring and analysis platform accessible at any time by the therapist. Huber et al. (2010) presented a Web-based interface where the therapist could configure the settings of the game and monitor the stored clinical data from patient's sessions in real-time, though no further analysis on acquired data was presented. Halic et al. (2014) implemented a cloud storage and computing service for their hand rehabilitation system. However, the system not only lacked a user interface (UI) for monitoring patients' progress, but also did not include an analysis methodology for the collected clinical data.
MILORD is a multi-component rehabilitation platform that can be used as a tool for the medical treatment of patients with physical impairments of the upper limbs (Chytas et al., 2020) using a leap motion controller. It supports the idea of “gaming as a health service” (GaaHS) and addresses the above gaps via,
• Secure and moderated services that allow users to play personalized games, configured by their physician based on their condition and the intended outcome,
• Data that are safely and automatically collected,
• Support for local (supervised) and remote (unsupervised) execution of the rehabilitation program,
• Automatic, sophisticated, data analysis, and meaningful presentation of the results.
The rationale for developing MILORD as a GaaHS platform stems from the need to support the rehabilitation process of people who suffer physical impairments of the upper limbs, regardless of the cause of their pathology as a remotely provided service that is moderated and monitored by the physician without the need of visit-based rehabilitation sessions. The platform is aimed to be a multifaceted tool that will alleviate some of the physician's workload and provide him/her with an overview and insights about the patient's condition, and provide a gaming interface for the patient to help him/her conduct his/her rehabilitation program less monotonously and more efficiently. Currently, the platform has one main game scenario with configurable variations that allow different gameplays, and one side game that is not a part of the data analysis and serves currently as an enhancement of the patient's gaming experience.
In an iterative procedure, the platform's design requirements were defined engaging domain experts from both the clinical and technological aspects (Figure 1). The main requirements are summarized below:
• Interaction with the game: The main actions in the rehabilitation game should be performed with the motion controller, to have better results for the restoration/improvement of the patient's physical movements.
• The movement associated with rehabilitation protocol and motivation: The game process should be parameterized to cover each patient's rehabilitation needs. The games of the platform should be engaging and provide feedback to the user, to improve his/her therapeutic experience and help them adhere to the medical protocol.
• Support of supervised and unsupervised use: Initial requirements were aimed at deployment in a controlled environment. Revisions of the requirements led to deployment as a GaaHS which allows moderated but unsupervised use in a patient's own environment.
• Low-cost infrastructure: The system should be built and rely on low-cost hardware and software.
• Graphical user interface: The implemented games of the platform should operate through the specified motion controller. The interface should be visually and conceptually clear. Also, the navigation inside the game should be intuitive and should not require specific training to use. Finally, the graphics of the game should be simple to avoid the mental overload of the user, yet elegant to evoke his/her interest.
• Monitoring of patient progress via stored activity data: The platform's service should record, store, and automatically synchronize all game data, so they can be analyzed. Analysis and visualization of the data should be performed automatically and unobtrusively after each patient's therapy session. The analysis should present not only results per session but also combined results and progress after several sessions.

Figure 1. MILORD design approach.
The primary aim of the game platform is to support the patient in a rehabilitation session, by helping him/her to perform a high number of repetitions of the therapy exercises, while making the entire process at the same time more engaging in comparison with the standard procedure. This is feasible by emulating the hand movement in physiotherapy exercises and making them part of a game paradigm. The movement of the hand, across the horizontal and vertical plane, corresponds to these pairs of exercise movements: flexion/extension and adduction/abduction. There is also pronation and supination of the forearm, which is mapped to the rotation of the hand (Figure 2).
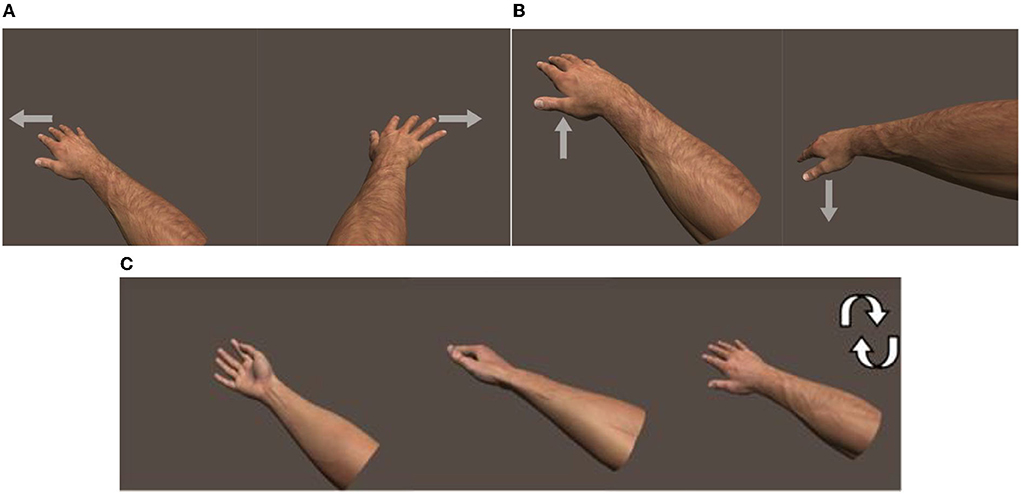
Figure 2. (A) Adduction and abduction of the hand, (B) flexion and extension of the hand, and (C) pronation and supination of the forearm. Arrow shows direction of movement.
The motion controller selected for the interaction of the user with the virtual world of the game is leap motion1. Leap motion is a widely used sensor that captures the movement of the hand accurately, does not need markers to enable tracking, and is non-intrusive. The device performs image analysis of the frames captured by its twi infrared cameras and provides the 3D locations of various elements in the scene (e.g., center of the hand/palm, fingertips, and finger joints) through its API. Its sampling rate is on average 60 frames per second (fps) and can theoretically reach 120 fps, which is adequate for the purposes of this platform.
The software of the game platform was developed on the 3D graphics engine, Unity 3D, and C# was used as the programming language. Unity was selected because of its shallow learning curve and because of leap motion's provided SDK, which allows the connection of the device with the unity platform and facilitates rapid game development.
The user (word user here) denotes a general user that is using/testing the platform, a patient, a healthy individual, or physician performs the rehabilitation exercises inside the main game of the game platform. The scenario is a flying simulation. An airplane-like object is presented at the middle of the screen which mimics or corresponds to the patient's hand movement on the X (left–right) and the Y (up–down) axis of the 3D space [image of 3D system]. The illusion of the airplane's movement is achieved by moving all the presented scene's objects apart from the airplane that stays still in the middle bottom area of the computer screen. Movement on the Z-axis is not considered since the movement is analyzed on the XY plane.
The purpose of the game is to guide the airplane through orthogonal objects, called “gates,” that come toward the user one at a time. The gates are positioned in a preconfigured 3x3 grid, so each one can appear at 1 of the 9 possible positions. This configuration emerged as a necessity to collect consistent data and make the analysis results more reliable. At the center of each gate there is a rotating coin (game object), which can be collected by the user if he collides with it. This feature has multiple purposes: (a) it serves as a mark to the center of the gate, giving the user a sub-target, besides the main one, the gate, (b) can be a primary analysis feature, which indicates how accurate is the user's movement when he aims for the center of the gate, and (c) it acts also as a motivation for the user, thus enhancing engagement (Figure 3).
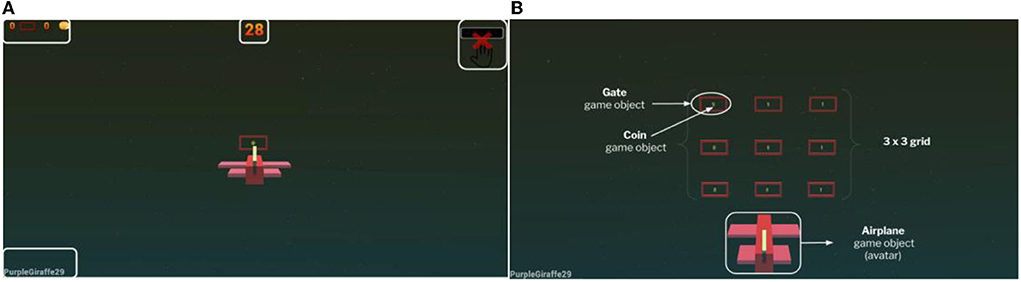
Figure 3. (A) Game scene of the main game version and (B) explanatory scene of the game objects in the main scene.
The order of display of the gates is random and is handled by a pseudo-random algorithm, with a modification introduced in it, which ensures that each gate will emerge at least once in a game session, given that the overall number of gates will be N ≥ 9. Randomness is an important factor in the rehabilitation scenario. It prevents the patient from memorizing the order in which the gates appear on the screen and completing a game session by memory. Therefore, the results we obtain from the analysis are unbiased in this respect.
The termination condition for the game is either a time limit or a limit on the number of gates that are generated in a game session. The termination conditions are a subset of the system's parameters that are configured by the supervising physician. The other parameters include the configuration of the game's difficulty and the selection of gameplay variant. The game difficulty setting has four levels, namely, “easy,” “medium,” “hard,” and “very hard” and is regulated through two variables:
• The speed that the gates move toward the user.
• The distance (perceived as depth) that the gates have in-between them on the Z-axis.
The group of parameters for the gameplay consists of the following:
• Rotation of the hand (pronation–supination).
• Camera view (the point of user's view—first/third person).
• Part of upper limb (hand-wrist/finger) used to control the game.
The resulting game variants are displayed below.
The physician can choose from the game settings to enable the rotation of the hand. This results in including the pronation/supination of the hand and forearm in the set of exercise movements of a therapy protocol. This pair of movements is not standard exercise for all patients, since those who suffer from severe upper limb impairments have a limited range of motion. In the game, a part of the set of gates is rotated, at 45 and −45° to signal the user to add a rotation to his/her hand movement. Although the hand of the user can rotate freely, the result in the virtual world of the game is a fixed rotation of the airplane at 45 and −45°, mimicking that of the gates. It was implemented this way, because some patients exhibited a limited range of rotation that did not add up to the overall game feel (Figure 4).
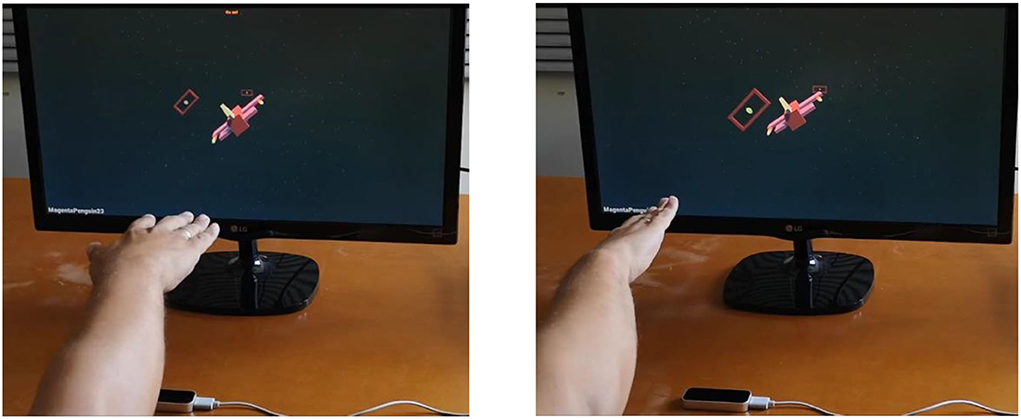
Figure 4. Variant 1 of the game. The user rotates his hand, and the avatar rotates accordingly in the game scene.
Through the settings menu, the user can change the perspective of the camera from which he experiences the game. The game is played from a third-person perspective, meaning that the camera of the scene stands at a short distance behind and above the airplane. The first-person camera option allows the user to play the game from inside the cockpit of the airplane, i.e., he/she will be viewing the scene from the pilot's position, and he/she will not be able to see the airplane's body (Figure 5).
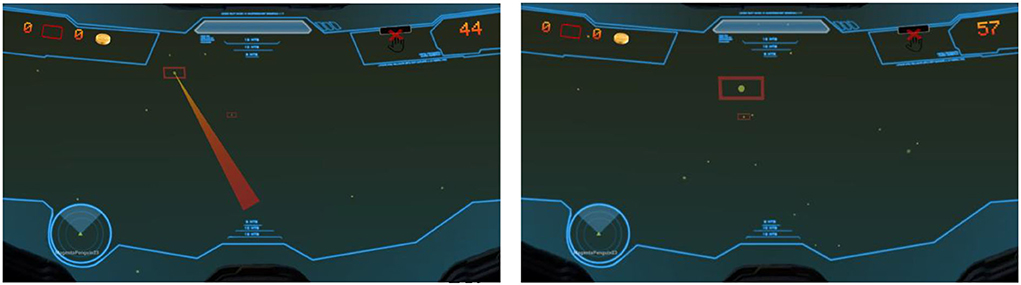
Figure 5. Variant 2 of the game. The user is “transferred” inside the virtual airplane, to immerse the user and make him feel that his hand is the virtual airplane.
Another game modality of the platform allows to perform rehabilitation exercises with the isolated movement of the index finger and the wrist. This modality is suitable for patients with heavy impairments in the upper extremity. Although the game scenario remains the same, the user moves only his/her index and wrist to guide the airplane through the gates (Figure 6).
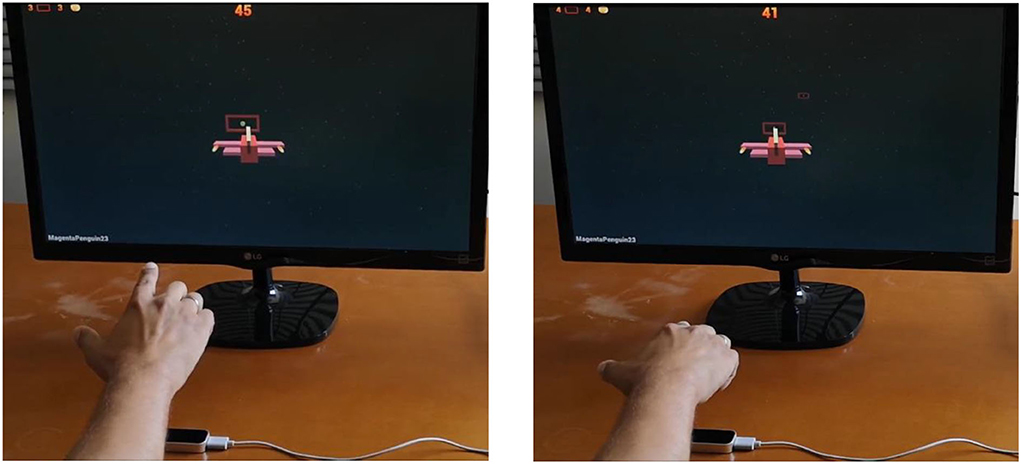
Figure 6. Variant 3 of the game. The user can perform the rehabilitation exercises with the movement of his wrist and finger.
Apart from the main rehabilitation game and its variants, an additional fundamentally different mini-game was developed to motivate the patient and add to the entertainment aspect of the platform. Also, the mini-game may serve in the future as another standalone game scenario that offers various kinds of data such as data from simultaneous movement of both hands.
The scenario of this game is that there are 6 static “stations” in the scene - 3 at the left and 3 at the right. These two groups of stations can be either banana trees or monkeys. In each round, a banana appears on one of the trees and the user must collect it with his/her one hand (the one closest to that side) and bring it to the center of the screen, where his/her other hand will take it and “feed” it to one of the monkeys residing in the opposite side. A complete round is when a banana reaches a monkey. After each round, the stations switch sides, for the user to alternate hands and not get accustomed to a single side. There is no time limit for this game. At this phase, it is a side game for the user to relax from his/her therapy routine and keep him/her engaged, but there are plans to include it in the therapy protocol for patients that need to perform bilateral exercises (Figure 7).
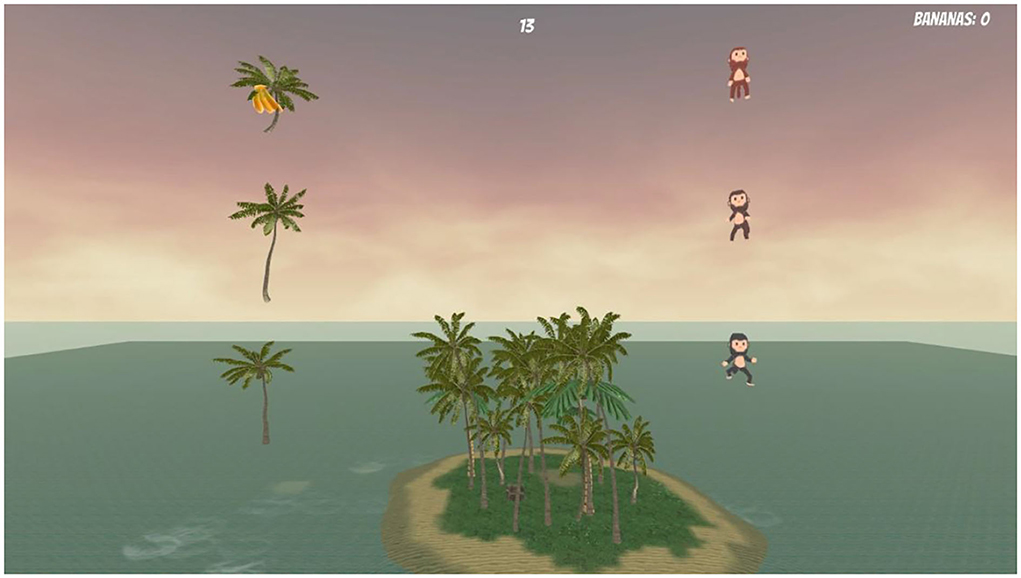
Figure 7. Mini-game. The user collects the banana with his left hand from the top left tree and brings it to the middle, where he passes it on to his right hand to give it to the bottom right monkey that is making a dance. After a successful try, trees and monkeys switch sides.
Initially, the program included supervised treatment during the hospitalization of the patients diagnosed with a stroke. After this period, the physician judged and selected some of the patients that were able to perform some sessions at home based on their ability to follow the therapy guidelines. The therapist contacted the patients by phone on a regular basis, to be informed about the patient's progress regarding these treatments. In addition, quantitative data about the treatments were recorded on the server and the physician could monitor the patient's progress using the dashboard component of the Milord platform. Moreover, an assistant carer was frequently visiting to check whether the guidelines were followed or any problems occurred. Finally, if necessary, the informal carers (family members) of the patients were also trained to use the program to help the patients.
Regarding user training, therapy guidelines included the description of the game's objectives and instructions on how to play. All recruited patients were instructed on how to put their hand over the sensor to capture each move. The hand should have specific posture defined by the physician. The game scenario and objectives were explained. After that, the patients were instructed to navigate the airplane from gate to gate with the movement of their hand, trying to pass through as many gates as they can and collect the coins that appear in the center of each gate if possible. The hand movement should be smooth and as steady as possible to align with the scope of the therapy.
The diagram in Figure 8 shows the architecture of MILORD system as well as the flow of the data. Specifically, the parts of MILORD's system are as follows:
• The patient's computer on which the game is installed. A leap motion controller is connected to this computer and the patient can complete the assigned gaming sessions. The platform is responsible not only for the data collection, but also for the definition of the user's alias, the activation of the profile, the verification of the personal identification key of the specific user, and the data synchronization on the secure storage server using the personal identification key.
• The therapist's computer: The therapist, using just a web browser, gains access to the analysis service after its accreditation via the authentication and authorization server. Moreover, via a user management interface, the therapist can register new users, personalize the game setting for each user remotely, and examine the analysis results and the patient's progress.
• The authentication and authorization server manages the issuance and validation of personal identification keys and thus moderates access to the game and the analysis service.
• The secure storage server stores the raw data files from the game and provides them (securely and upon request) to the analysis service. The communication in both cases is not only encrypted (via HTTPS protocol), but also certified as a valid personal identification key is required.
• The therapist's analysis and user management dashboards server: The server hosts the analysis and user management dashboards and communicates with both the authentication and authorization server to obtain the appropriate JWT and the storage server to receive the files to be analyzed.
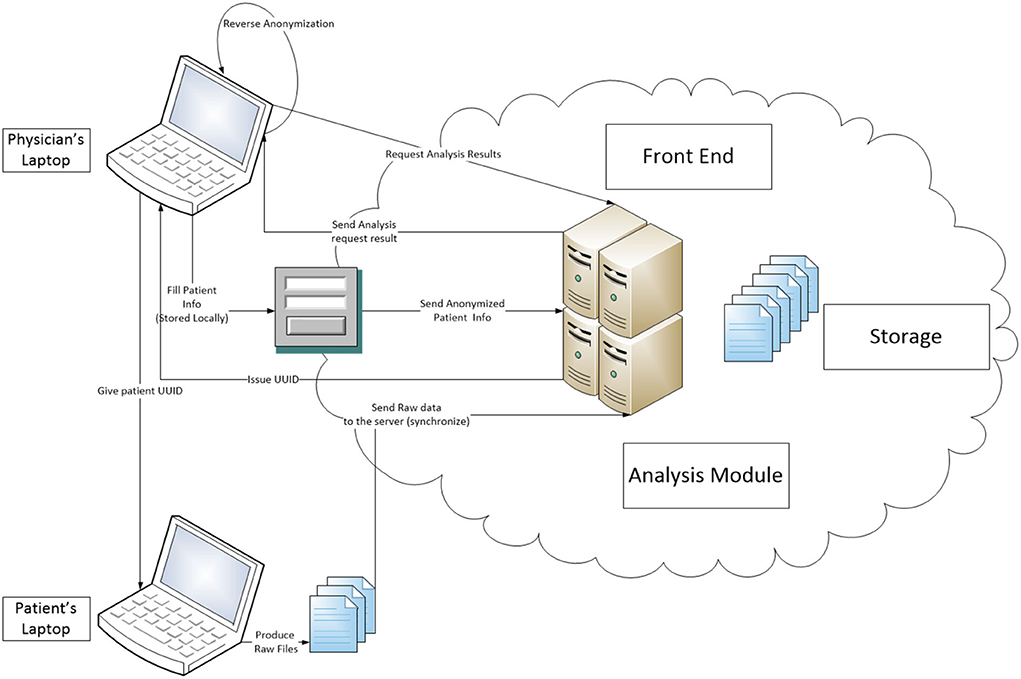
Figure 8. System's overall architecture diagram.
All communications presented are encrypted via HTTPS protocol, whereas for some connections, user authentication is also required. Only certified and authorized users of the system can complete these connections successfully. The sessions' data are uploaded to the server and analyzed at regular intervals.
The data collected by the rehabilitation game are divided into motion and game data. The motion data consist of the 3D position vectors of the hand palm and their respective timestamps and at what angle is the hand rotated. The game data consist of the position and rotation of the gates in the grid system, the time signature that the airplane passed it (either from inside or outside), and if the coin inside them was collected. Both kinds are used during the analysis phase and are stored in csv format.
Data analysis is performed periodically, when new data are available in the storage, and the calculated features are stored in a structured manner in an SQL database, to be available for selection and presentation, as well as further use. The database consists of three interconnected tables:
• Subjects: stores the nicknames of the patients.
• Games: stores each game's id, properties, and settings.
• Analysis results: stores the features extracted from the analysis procedure for each game.
More details on the data analysis part are presented in the next section.
Among the features that strengthen the value of MILORD as a GaaHS is the analysis of the data produced by the game sessions for decision support. This is an automated analysis that aims to provide the physicians with a quantified view of patient's game response, including not only game usage and scores, but also motion analysis features, as described in detail in Subsection Motion features.
The physician can monitor the patient's progress via the data analysis dashboard. The main components of the data analysis dashboard are as follows:
• The presentation of feature tables for all the users that have analyzed data.
• The visualization and descriptive analysis of the motion features.
• Interactive interface provided to the physician to adjust the data presentation and descriptive analysis to various monitoring time windows.
The raw data point acquisition rate is tied to the frame rate at which the game runs. Although the frame rate for the game was capped at 60 fps, it can occasionally drop below 60, an occurrence more common in systems with low computational capabilities.
Another issue was the artifacts that occurred when the leap sensor failed momentarily to correctly identify the subject's hand, typically other objects interrupting the sensor's field of view or nearby light sources causing interferences. The abrupt changes in the hand trajectory were identified using a high pass filter, followed by an evaluation of the neighboring area to determine which part of the movement was the artifact (if any). The data points that were deemed as artifacts were subsequently removed. Firstly, time windows that had more than 25% of the expected samples missing were removed during the analysis.
As a next step, to address both the above issues and to facilitate an analysis that supports exploration in the frequency domain, the time series of the hand coordinates was interpolated at a steady rate equivalent to 60 fps.
The gameplay can be distinguished into parts. Each part corresponds to the period between two consecutive gates (time window Wi). The gates (Gi) are moving toward the avatar at a controlled pace. Therefore, all the time windows have the same duration, except for the first gate, which appears a few moments after the start, to provide the user ample time to get accustomed to the game.
Each time window (Wi) is further distinguished into three different sub-periods (Figure 9). Those periods were detected by examining the velocity on X and Y axes, considering the direction and the proximity to the target gate.
1. Response (DT1: t0-t1): it refers to the time period starting when the user has reached the Gi gate until they become aware of the upcoming gate Gi+1, and they begin to move toward it. This is characterized as a steady state (orange).
2. Movement (DT2: t1-t2): it refers to the time period during which the user is moving from Gi toward the upcoming gate Gi+1. This is a movement state (green).
3. Stabilization (DT3: t2-t3): it refers to the time period from the time point that the user has arrived at the X, Y coordinates that correspond to the Gi+1 gate and is waiting to reach it (plane pass through the gate) until the time the avatar crosses the gate. This is a steady state (red).
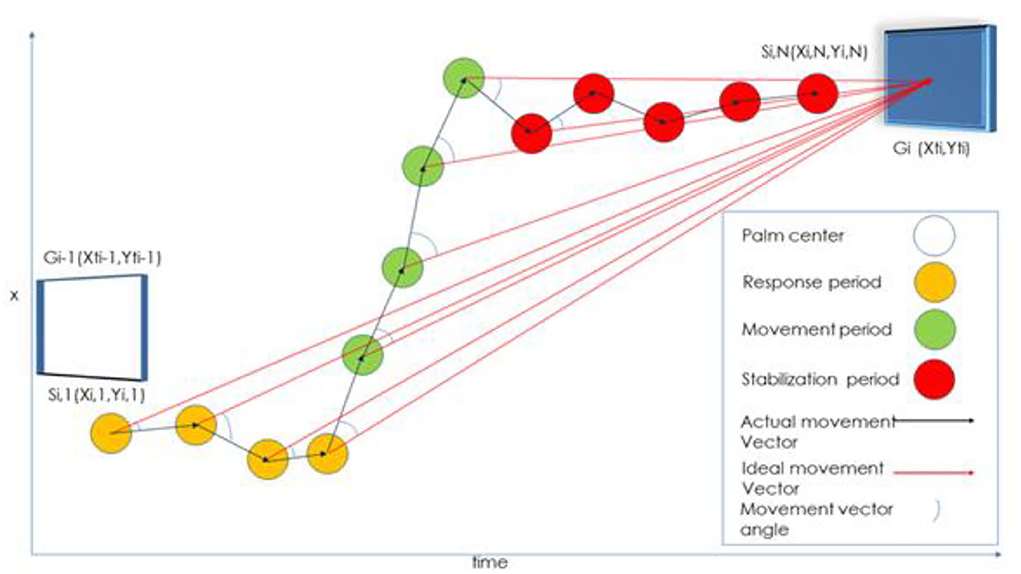
Figure 9. Movement from gate Gi-1 to Gi. The Si,j represents the hand position on each j frame for every i window (Wi). Ideal movement vector is defined as the minimum distance between two consecutive gates (or points). This distance is used for analysis purposes as a benchmark (to observe the extent of hand movement deviations in comparison to an objective reference). It is not defined as the desired movement pattern (Chytas et al., 2021).
Specifically, t0, t1, t2, and t3 are defined as follows:
• t0: the time there was contact with the previous window (or went through a corresponding z in case it did not catch up).
• t1: the time that we observe a continuous movement toward the target in a period of 170 ms.
• t2: the time (>t1) at which we observe the shortest total movement length in a period of 350 ms.
• t3: the time when there was contact with the current window (or went through a corresponding z in case it did not catch up.
t0 and t3 are recorded in the file of results generated. For the first window, t0 is considered the start of the game (t0 = 0).
The algorithm for the calculation of t1 is as follows:
Define the periods in which the hand moves.
1) Calculate the instantaneous speed Vi,j (the speed in the frame j of the Wi window).
2) Calculate the moving average (length of 15 samples) of the instantaneous speed.
3) Calculate the distribution of the instantaneous speeds in the Wi window.
4) The hand is considered to move if the moving average of the momentary speed is above the 75th percentile.
Define when the hand moves toward the upcoming Gi target,
1) Calculate the Si,j position vector between two consecutive points (Si1 to Si2, Si2 to Si3, etc.).
2) Compare each vector Si,j in the vector defined with starting point of Si1 (Xi1, Yi1) and end point of Gi1+1 (Xi1+1, Yi1+1) and calculate the angle difference < Si1Gi1+1.
3) Calculate the moving average of the cyclic phase difference.
4) t1 is defined as the first point at which the circular angle difference was found below a certain limit (10°) or as the first time it was found below the 5th percentile.
The time t2 is defined as the first time after t1 when the instantaneous speed is greatly reduced while at the same time, the plane location has X, Y coordinates with values close to the coordinates of the next Gi gate (in case the user has achieved the upcoming gate).
The validity of the times t1, t2, and t3 calculation was tested against data experts that were presented with motion trajectories diagram and were given the instruction to annotate the above times on the diagram.
The features currently examined involve the description of the movement in the time domain (velocity, acceleration, trajectory, jitter, etc.) The distance and the metrics that derive from it (velocity and acceleration) are measured in in-game units.
• Durations of DT1/DT2/DT3 in milliseconds.
• Mean/SD Velocity DT1/DT2/DT3 X/Y/both: Mean/Standard deviation of the hand velocity on parts on respective axis X/Y or both.
• Mean Velocity DT2 starts calculated during the first 0.25 s of the DT2 part.
• Mean/SD Acceleration DT1/DT2/DT3 X/Y/both: Mean/Standard deviation of the hand acceleration on respective time segments on axis X/Y/ both axes.
• Distances total traveled per time window and total, ratio of minimum movement required to actual.
• Total Distance/ Total Distance DT1/DT2/DT3: actual distance traveled during the whole Wi, on parts DT1/DT2/DT3, respectively.
• Minimum distance (final): minimum distance from the center of the gate during the whole Wi movement/ during the final 0.5 s of the Wi movement. This amounted to a total of 28 features that were subsequently examined.
The granularity of analysis goes down to gate-to-gate movement, which inherently includes the direction/angle of movement, namely, horizontal, vertical, and diagonal. Features are calculated in each gate-to-gate movement. In terms of descriptive analysis, the physician can apply various filters on gates to observe deviations or burdens on specific directions. In terms of extended features and classification, the features are related to velocities, accelerations, distances, and time durations. We also analyze and extract features for the movement on X and Y planes. The X/Y mean velocities and accelerations and their standard deviations are just numbers that refer to one specific gate-to-gate transition. However, the combined information provided by these features formulates a complete picture of the patient's actual movement and difficulties.
The trajectory of hand movement is highlighted by distance features such as totalDistanceT1, totalDistanceT2, totalDistanceT3, distance From Previous H and, etc. by calculating their relation to the reference distance, i.e., the minimum distance from gate to gate (distanceFromWindow2Window feature or ideal movement vector). The aforementioned features help the physician to identify deviations and investigate their cause (indifference to guidelines or actual difficulties during the navigation).
The analysis results are stored in files on the same server on which the analysis service is located. The analysis service is scheduled to be executed every 5 min. It is responsible for the synchronization and the analysis of the stored data that are located on the server. The service checks for unanalyzed data and then executes the analysis pipeline for them. The SQL-based analysis database is updated with the analysis results, which are the motion features of the analyzed data.
In this section, the analysis dashboard is presented. The dashboard was developed to facilitate healthcare professionals in monitoring the progress of their patients during rehabilitation therapy. It consists of three basic levels of information display. The healthcare professionals have access to this information (regarding their patients) via a dedicated username and password. The displayed information at each dashboard screen can be downloaded in csv format.
The first level of information display is presented in Figure 10. Here, the therapist can see brief statistics and movement characteristics for all patients for each game type (hand-wrist/finger), such as number of games, duration of treatment, number of gates, etc.
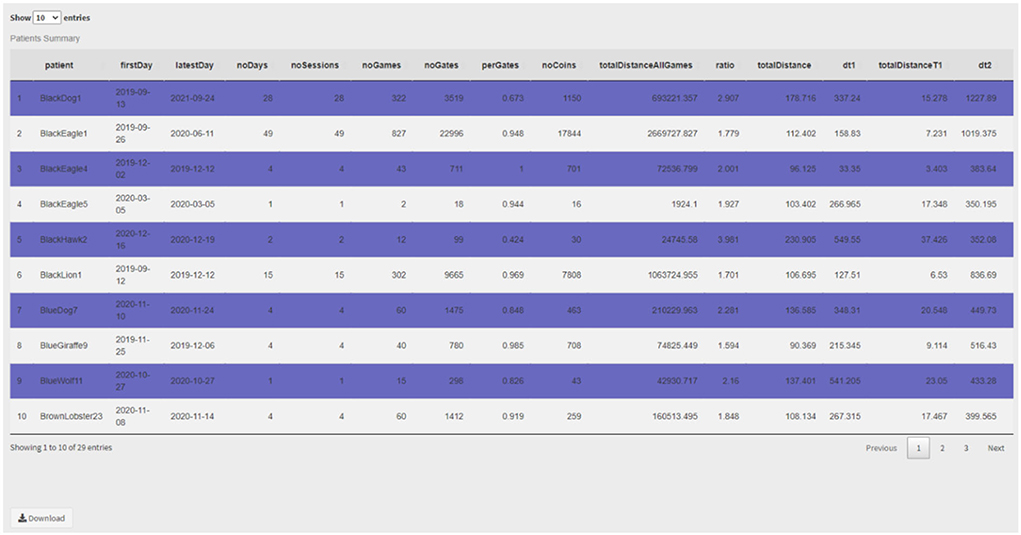
Figure 10. Brief statistics table for the complete set of monitored patients.
At the second level (Figure 11), the therapist can observe information about the successful or failed attempts per game/session or for multiple sessions. The 3x3 table where each element corresponds to each one of the 9-gates grid of the game shows how many gates appeared per position and how many were those that were passed successfully by the patient. The adjacent Sankey diagram depicts the start gates on the left and the end gates on the right. The thickness of the lines joining them is proportional to the number of failed attempts. The therapist can adjust the time period for the displayed information to inspect the patient's progress.
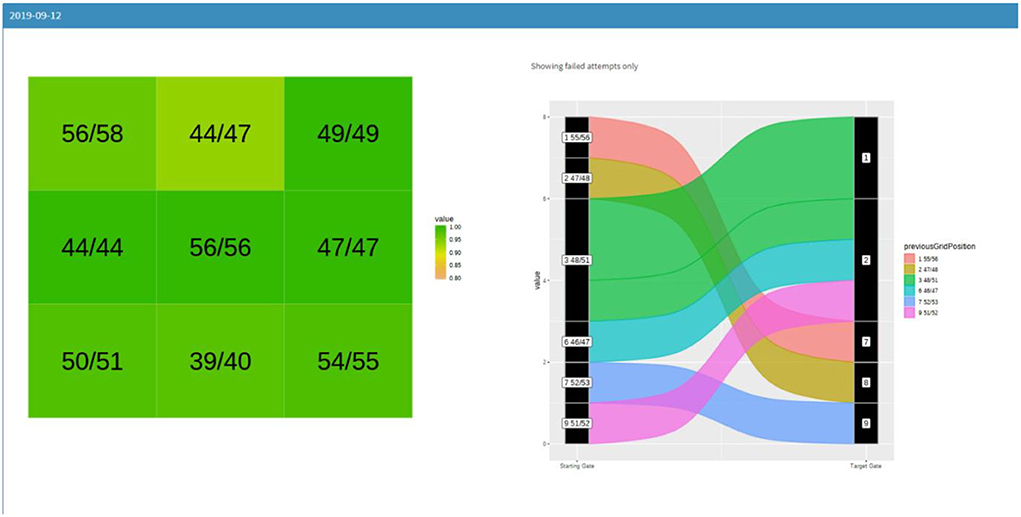
Figure 11. Success rate per gate and Sankey diagram.
At the third and final level (Figures 12, 13), the therapist can examine the motion characteristics that have emerged through the analysis. The user of the platform selects 1 or 2 movement characteristics and the desired time window. Then, he/she can observe the progress of the features vs. time. Moreover, the platform provides the option to select a second time period to compare the characteristics e.g., at the beginning and at the end of the patient's sessions. Through the menu at the top of the screen, the user can also select the combinations of gates to be depicted. Finally, there is a comparison window that presents the results of the Kruskal–Wallis rank sum test and some basic statistical visualizations of the compared variables.
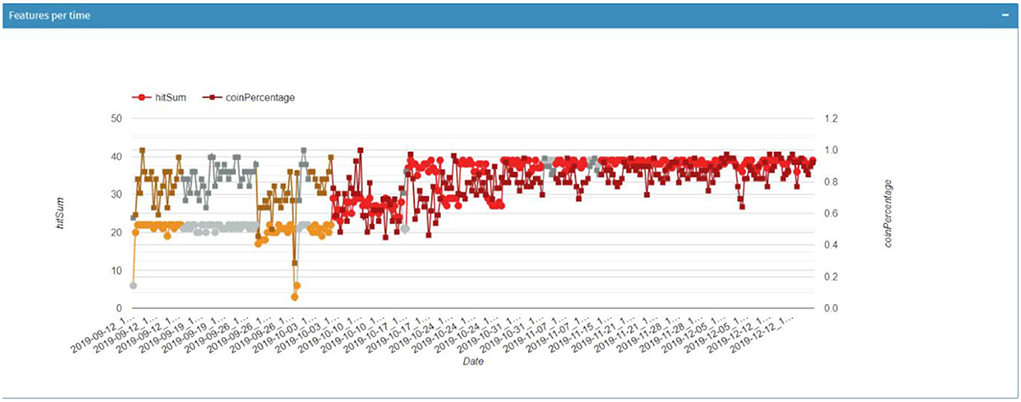
Figure 12. Progress of variables vs. time.
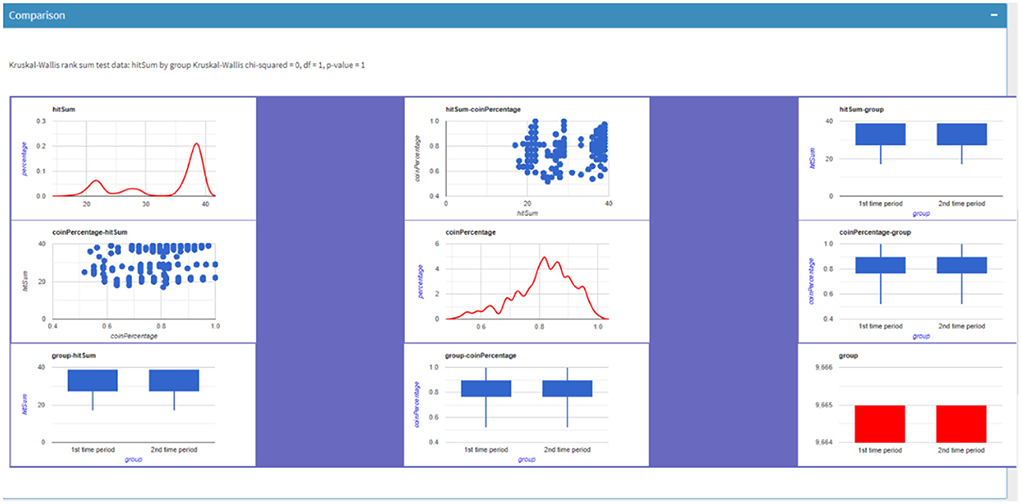
Figure 13. Comparison statistics for the two variables.
To assess the value of the proposed features and how informative they are with regard to patient upper limb motion state, a quantitative methodology was developed. The primary target was to show which features distinguish healthy motion.
The focus of the analysis was to explore whether the proposed movement features differ among healthy subjects and patients, and whether it reflects the changes over time during patient rehabilitation. Regarding the classification of movement as healthy or pathologic, a two-phase procedure was followed. In Phase 1, we examined whether the creation of such classifiers is feasible using a dataset consisting of healthy subjects and patients. In Phase 2, we used external data to verify the results.
For this analysis, we collected data from 13 subjects, either healthy individuals or patients undergoing rehabilitation. The data acquisition protocol was approved by the Bioethics Committee at the Aristotle University of Thessaloniki (AUTH).
Data were collected from 10 (H1-10) healthy individuals not diagnosed with a related motor control/central neural system disorder. Healthy subjects were of ages 25–38 with five of them being women (50%). The healthy subjects were using their dominant hand (10% were left-handed). Half of them (H1–5) were collected during the first phase of data collection and the rest (H6–10) during the second phase. The data acquisition for the healthy subjects lasted 2 weeks. The healthy subjects performed two sessions per week for 2 weeks (four sessions total). The first week's sessions were performed in “normal” difficulty settings whereas the second week's, in “very hard.” During the first phase of data acquisition (H1-5), each session consisted of 10 games and each game had a duration of 90 s, while during the second phase (H6-10), each session consisted of 15 games and each game had a duration of 90 s. The difficulty settings affect the avatar's constant movement rate on the Z-axis, substantially reducing the time required for the avatar to move from one gate to another. Of note, according to all healthy subjects' feedback, the normal settings were more bothersome than the “very hard” ones since the subjects had already positioned the avatar where it would pass through a gate, and they had to hold their hand steady for a longer period until the gate arrived.
During the first phase of data acquisition, each healthy subject (H1–5) had four gaming sessions, 40 games, and 800 gates. The percentages of gates the subjects H1–5 successfully navigated through were 1, 0.942, 0.985, 0.995, and 1, respectively. During the second phase of data acquisition, each healthy subject (H6–10) had four gaming sessions, 80 games, and 1,700 gates. In total, 20 out of 80 games refer to the latest version of the game. The percentages of gates the subjects H6–10 successfully navigated through were 0.910, 0.917, 0.918, 0.902, and 0.848, respectively, for the initial version of the game and 0.885, 0.873, 0.861, 0.828, and 0.841, respectively.
Data were collected from 3 (P1–3) patients undergoing rehabilitation. The patients performed the games using the hand in need of physiotherapy (right hand in both cases). The gaming sessions were in addition to the routinely prescribed physiotherapy treatment the patients were receiving at that time. The physician modifies the settings of the game and the intervals in which the therapy should take place based on the patients' condition and their overall progress.
Their data have been collected in a span of 9 (P1) and 6 months (P2 and P3) accordingly. Specifically, P1 had 39 gaming sessions, 652 games played, and went through 19,033 gates, P2 had 24 gaming sessions, 378 games, and 10,300 gates, and P3 corresponding statistics are 16 gaming sessions, 184 games, and 2,107 gates. The difficulty settings were gradually changed from “normal” to “hard,” and eventually to “very hard” in the span of their treatment for P1 and P2. For P3, the difficulty settings remained normal. The percentages of successful gates for the patients P1–3 were 0.946, 0.969, and 0.718, respectively.
The gates were grouped based on the type of movement, vertical, horizontal, diagonal, and direction. Right to Left (r2l) Left to Right (l2r), Up to Bottom (u2d), Bottom to Up (d2u) Top Left to Bottom Right (dg1) Top Right to Bottom Left (dg2), Bottom Left to Top Right (dg3), and Bottom Right to Top Left (dg4).
The analysis was focused on the subject's performance during the traversal from one gate to another. For each subject, all the calculated movement features were grouped together without the distinction of individual games or sessions. The order in which each gate was traversed was kept intact and as such, we were able to examine the subject's progress through time. In more detail, the analysis consists of the following steps:
1. In each cross-validation round, split the dataset into two parts: (a) Train: one patient (19,033 or 10,300 gates), four healthy subjects (3,200 gates), (b) Test: one patient (19,033 or 10,300 gates), one healthy subject (800 gates).
2. Use one direction at a time (this reduces the number of gates used for the training and testing, e.g., out of the 19,033 gates P1 has, 2,203 belong in the u2d category).
3. On the training dataset, for each feature, detect the values that are outside the range of four times the standard deviation. A single out-of-bound value would cause that gate to be excluded. This further addresses the artifact problem during data acquisition.
4. Test the features for normality using the Shapiro–Wilk test (Shapiro and Wilk, 2015).
5. If the variables were normally distributed, the analysis of variation (AOV) was used; otherwise, the Kruskal–Wallis H-test was preferred (Kruskal and Wallis, 1952).
6. Adjust the p-values derived from the above tests using the Bonferroni correction (Alt, 2006).
7. Select the statistically significant (p < 0.05) features.
8. Check those features for correlation using the Pearson formula (Chen and Popovich, 2011).
9. Features that had a high degree of correlation (0.8) were further examined and the worst performing features were removed.
10. Utilize the training dataset with the remaining features and train a neural network model (Kalchbrenner et al., 2014; these models yielded the best results in the type of data that were used) using internal k-fold cross-validation with one hidden layer and an adjustable size (range 3–15).
11. Extract the final classifiers per movement after having checked the hypothesis that the movement patterns with the calculated characteristics can successfully distinguish a movement as pathological or not.
The programming language R 3.6.3 and R-shiny package was used for the development of the analysis platform, in conjunction with HTML5, Javascript, and CSS. The analysis server is running on Ubuntu 18.04 software whereas the analysis database was implemented in SQL 5.7. The automated scheduled tasks are carried out via the implementation of Cron software.
In this section, results extracted during the system's evaluation procedure are summarized.
With regards to the overall system deployment, it was tested in real-life settings with healthcare professionals and patients, for a period of 18 months. Synchronization of data took place without problems. The synchronization procedure requires an internet connection and is completed after the end of the game. In case of a lost internet connection or no internet connection, the synchronization takes place right when the connection is restored. The system was stable, without reporting problems regarding the interconnection and communication between its components. For software debugging or updating purposes, a standard procedure for modifying and updating the platform was followed to keep up with the physician's and patient's needs. With regards to the analysis features, the recalculation of features was possible since raw data were permanently stored.
The offline predictive analysis was conducted based on the methodology presented in Subsection Description of analysis steps. First, the validation of features for disease characterization is presented (Figure 14). The purpose of the validation was to explore whether patients' and healthy subjects' pattern movements can be distinguished. After the validation, classification models are extracted and presented underlining the value of the motion features in a physician's decision-making.
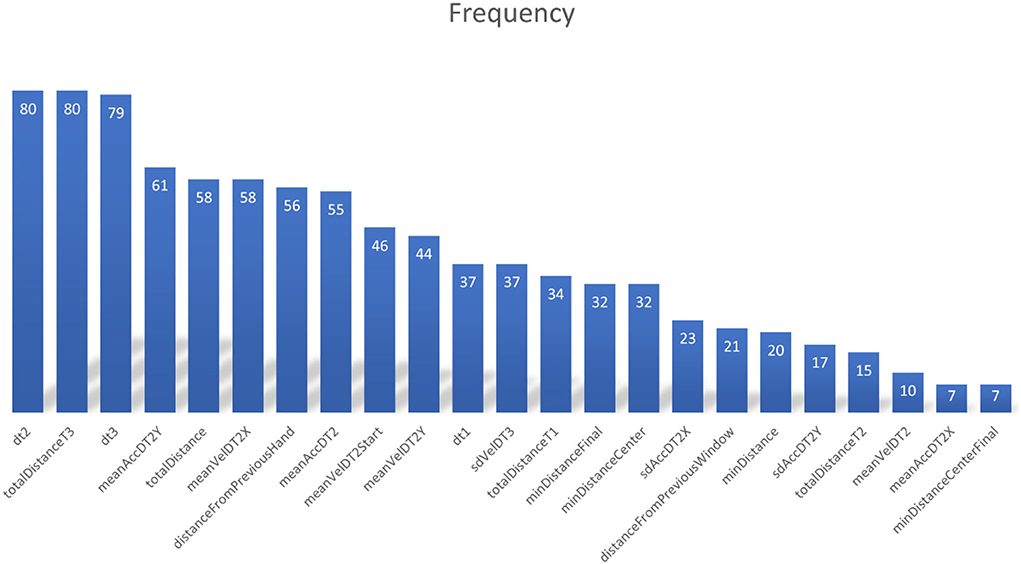
Figure 14. Feature selection rate, defined as the number of times each feature is selected in the model, during the training phase with different training sets.
Moreover, hands-on user experience on the analysis dashboard was explored via questionnaires. Finally, a preliminary clinical evaluation is presented, based on the observations made during clinical practice in conjunction with the use of the MILORD platform.
The model that was created using data from five subjects (four healthy subjects, one patient) was tested using the remaining two subjects (one healthy subject, one patient). The leave-one-out (a healthy subject and a patient) cross-validation approach was preferred over the k-fold cross-validation with train and test samples mixed from all using those seven subjects, as this method is less biased, i.e., the hypothesis that patients and healthy subjects differ in their movement patterns can be examined without any bias that is inserted by utilizing the same subjects for testing and training.
After testing the validity of our hypothesis that the movement patterns differ among healthy subjects and that pathological patterns can be identified using classifiers, we created a final set of eight models, one for each direction. These models were trained with the dataset initially used in Phase 1 (P1, P2, and H1–5). These classifiers were afterward used in Phase 2 on H6–10's and P3's data as external validation. To observe the patients' progress during their treatment, the data points of each feature were aligned in chronological order. Following, they were filtered using a simple moving average window as a low-pass filter to present the underlying trend.
Having checked our hypothesis that the movement patterns with the calculated characteristics can successfully distinguish a movement as pathological or not, we used the data of the seven participants (P1, P2, and H1–5) to retrain our final classifiers (Table 1). These models were then applied to H6–10 and P3 who were not involved in the development of the model as an external dataset. The final classifiers reached high accuracy (over 90%) when characterizing the gates that P3 had passed as pathological for six out of eight directions while in the remaining two, their performance was just under 90% (Table 2).
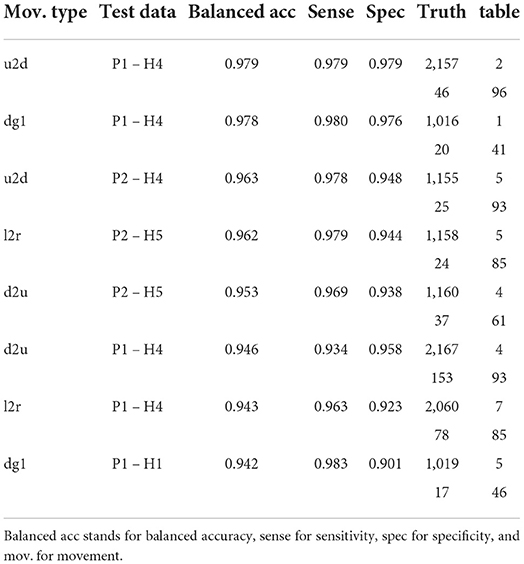
Table 1. The details of the best performing models.
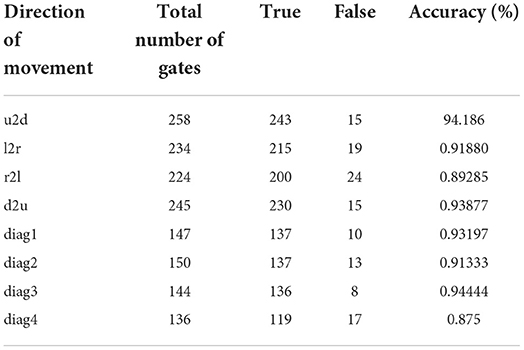
Table 2. Implementation of the classifiers on the external control dataset of P3.
Similar results were also obtained during the characterization of the gates passed by H6–10 as non-pathological, where the final classifiers also reached high accuracy (over 90%) in seven out of eight directions while in the remaining one, the accuracy was about 85% (Table 3).
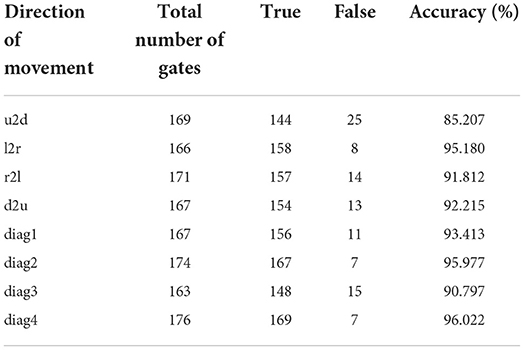
Table 3. Implementation of the classifiers on the external control dataset of H6–10.
User evaluation of the analysis platform was performed through a user experience questionnaire (UEQ), which is a popular method for web-based application evaluation. An online workshop with 17 participants with various scientific backgrounds and a study conducted in the Department of Physical Education and Sport sciences with undergraduate students were organized to gather feedback based on how the platform was perceived by inexperienced—with the platform—individuals. A small set of questions and a use case scenario were prepared and given to the participants to test the understandability of the various developed functionalities. The participants were asked to complete the scenario by using/interacting with the platforms' functions and answer the questions. The evaluation of data visualization showed the following (Figure 15):
• The understanding of graphical representations is not self-evident, and it may need a level of education, both in terms of the “problematic” movements and the evolution of characteristics over time. Participants encountered great difficulty (20% success) in interpreting the combined diagram of failed attempts (Sankey—like) which contained a large amount of information, but it turned out to be tricky without detailed training.
• For the needs of the user in everyday clinical practice, some simple graphical representations should be chosen—possibly meeting different needs from those of the doctor/researcher.
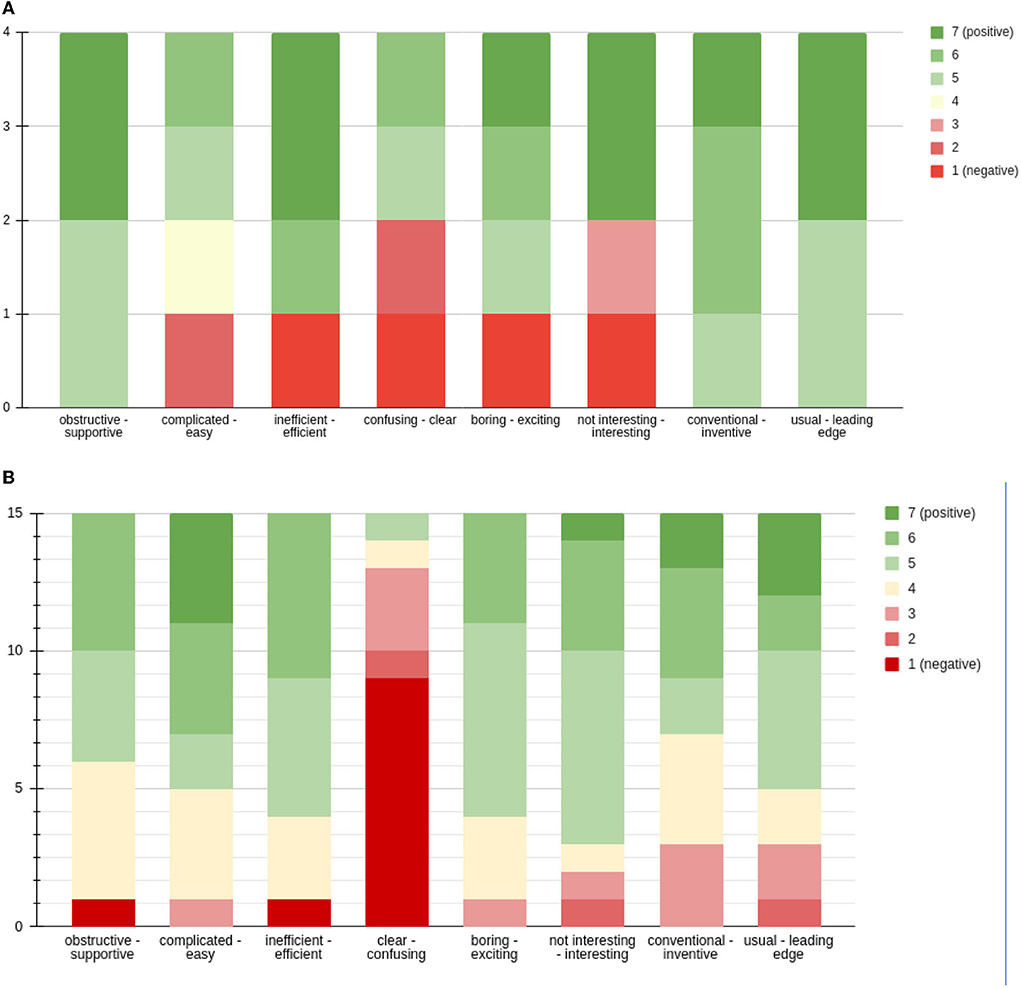
Figure 15. (A) UEQ regarding MILORD analysis platform (four participants). (B) UEQ regarding MILORD analysis platform (15 participants).
The questions had to be answered on a scale of 1–7. Further written comments were given. The questionnaire was answered by a total of 19 people, the majority of whom are students in the Department of Physical Education and Sport Science. In total, four people replied to the short version of the UEQ, whereas the remaining 15 replied to its full version. Both short and long forms refer to the same user experience questionnaire. The short version was used during a webinar with experts, where the whole concept was presented and discussed, and users interacted more with the physician side of the platform. The long version was used in a short study with normal subjects engaged with the game conducted in the Department of Physical Education and Sport Science at the Aristotle University of Thessaloniki.
From the collected responses, it is concluded that the platform of analysis should be more understandable and easier to use. The small sample of responses does not allow conclusions to be drawn by quantitative research. However, a brief analysis of the answers shows us the following:
• The analysis platform is treated as an inventive, innovative, and interesting tool.
• The analysis platform has the lowest score on the question of clarity and ease of use. These scores could be explained by the total time spent on the presentation of the analysis platform, which was limited both in the webinar and during the study. In the time allotted, there could be no extensive presentation of the analysis platform and its capabilities.
Finally, it should be noted that the development of the platform analysis was focused on the thorough analysis of the hand movement (trajectory), and for this reason, it is not expected to be fully understandable during the first contact of a user with it as it is difficult to familiarize himself/herself with all its functions.
An extensive clinical evaluation of the rehabilitation platform was not feasible, but an informal validation test (preliminary study) was performed on a small number of patients and the initial results were encouraging. The patients were divided into control and intervention groups. The clinical status was evaluated by the physician with the help of FIM and MESUPES upper limb scales (Johansson and Hager, 2012; Granger, 2020).
A preliminary study was conducted in cooperation with a physician to investigate the potential of the MILORD platform. In total, 10 patients participated in the study. All patients were diagnosed with stroke and began training 2 weeks after the episode in the subacute state. Depending on the severity of the stroke, patients continued their treatment from a few weeks to 3 months. The physician divided them into two groups: the treatment group, consisting of six patients, that included the MILORD platform in their rehabilitation program, and the control group, consisting of four patients, that followed a standard rehabilitation program. The average age of the patients was 52.43 ± 23.63. They participated in the program from 37 to 193 days.
The average age of the patients between intervention and control groups did not show statistically significant differences as well as the FIM and MESUPES scores for the upper limb. After the end of the study, statistical analysis was performed on the clinical outcomes to investigate the impact of MILORD in comparison with standard rehabilitation procedures. All patients had an improvement regarding the functional independence measure (FIM) and the Johansson and Hager (2012) measures, assessing their functionality and quality of movement performance, respectively. The average changes in the two metrics were −12.032 (FIM) and −0.951 (Johansson and Hager, 2012), with a non-statistically significant higher improvement of the milord treatment group in functionality, as well as in MESUPES arm-related categories.
The medical personnel reported that the requirements of the game were easily understood, and patients got used to it immediately. There were some who were looking forward to repeating the session. Moreover, some reported that their hands were tired during the process. As observed, most of the patients showed increased engagement during the therapy because of their increased pleasure. Both the medical personnel and the patients thought that the MILORD platform fulfilled the expectation of facilitating the recovery process.
This paper presents a complete gamified rehabilitation platform that utilizes the ability of the leap motion sensor to detect the upper limbs with great accuracy with the aim of functionally restoring their motion. To fully utilize a rehabilitation platform and reach the level of a GaaHS, in-depth research should be done in the field of gaming. The MILORD platform contributes toward the establishment of a GaaHS, including the gamification design, and data analysis and management for the remote service execution. The platform was tested in terms of the overall system and user experience, as well as the value of analysis, and the initial results are encouraging.
Among the challenges with respect to the user interaction and performance, it is to ensure that the game does not incorporate any bias in relation to gender, age, dominant hand, or other condition that has not been recognized in advance as a limitation. The user's vision level is a limitation that should be considered. Familiarity with VR games may also introduce a variable performance due to the game handling learning curve, which is smoothed out after a brief period of practicing. Introducing a training phase is deemed necessary for such services.
One of the challenges we had to face was the customization of the game's scenario which would be correctly transferred to a wide range of kinetic control exercises. In this respect, the main problem in terms of analysis was that the use of many variables would introduce a high degree of complexity and make data comparability more difficult. The selection and correct combination of game parameters to present all the necessary movement combinations (e.g., right-to-left, diagonally, etc.) and to escalate the difficulty in specific and meaningful steps needs careful tuning.
The number of distinct movements including a combination of gross/fine movements represented in the game for best results in the virtual and real world is an open challenge. A gamified “monotherapy” might not be optimal, whereas multiple games or mini-games could be included in a rehabilitation service and a combination of coarse and fine movements. In this case, one would need to specify what combination and dosage of games can lead to better motor learning transferred to everyday life. In addition, another challenge was to reduce the characteristics of the game to generalized concepts that can be applied to other scenarios.
The approach presented stands out from the rest as it attempts to propose and evaluate metrics that correspond not only with the patient's performance within the virtual environment of the platform but also with the characteristics of hand movement which have some relation with the underlying pathology. Observing the score-based characterization and categorization based on movement characteristics, patients P1 and P2 managed to catch scores comparable to those of healthy users, whereas P3 had significantly lower scores than everyone else. The values of the motor characteristics of P3 were quite far from those of other healthy and patient users. This suggests that a score indicating only success or failure in completing a goal is not always enough for proper categorization in the field of serious gaming. On the other hand, the proposed classifiers who make use of motion features were able to distinguish healthy and pathological movements.
Although classifiers (horizontal, vertical, and diagonal) are useful in terms of detailed characterization, their integration could support clinical practice, providing a complete picture of the patient in terms of the mobility of his/her hand in all directions. The above analysis has shown encouraging results. More data would help to establish a better benchmark and ensure the reproducibility of the results. As a general observation, patients had longer reaction times and a greater distance from the center of the gate compared to healthy ones. Among our future goals, the most important is the quantification of patient progress and much of the future development will be channeled into the effort to match the progress shown by patients—and captured by our metrics—with the widely used scales and tests to assess upper limb movement (e.g., FIM/Hamilton et al., 1994 and FMA-UE/Singer and Garcia-Vega, 2017).
Overall, MILORD investigated a number of game design and data analysis challenges toward characterizing the progress of the patient and the differences between normal and pathological motion, such as (a) Do the game movement features express the actual motion deficits of the patient? (b) Do game performance measures reflect the real-life progress (or decline) and characteristics of clinical value? (c) How can we move beyond the motion heterogeneity among people and establish normative values? (d) How can we introduce the game parameters, like difficulty in such an analysis? and (e) How to map the game-specific features to generic constructs and abstractions, enabling analysis from multiple game and motion variations?
While these issues were addressed, a more extended investigation including an extended data collection or validation is required to further progress these issues. Given the limitations of this study, the number of patients and healthy subjects who participated is small, although the total number of gates is quite high. Future work should collect data from more participants to provide evidence and correlations of patients' data with the progress they have as recorded by the therapist. In the next steps, the analysis will include the possible effect of the different game's difficulty levels on the result. Moreover, as far as the performance of the user is concerned, his/her familiarity with the specific game and with video games, in general, should be examined.
Of note, the VR or gamification evaluation in the literature is sparse, with only a part (1/3) of the systems evaluated with tests or clinical trials with patients to test their implementation (Koutsiana et al., 2020), or tests with a small number of subjects or in short time, and frequently with no health-related evaluation process. In this work, evaluation is provided (a) questionnaires or interviews, or in combination, about the game and the experience in general, (b) medical standard tests examining the improvement of the motion, (c) extracted game features about motion analysis or game performance, (d) user experience.
Revisiting the concept of GaaHS, in terms of Platform and Health Service Challenges, one must acknowledge that for the introduction of a gamified—data-driven approach in the daily routine of rehabilitation services, the applicability, and acceptability relates to both the efficiency of such methods and to several human factors: ICT literacy issues, familiarity with VR games bias, and data literacy for clinicians.
Finally, MILORD proposes that patients should be able to perform their rehabilitation exercise in their own environments. Future work will capitalize on the MILORD experience and investigate the safety of gamified approached in unsupervised environments, along with the incorporation of safety measures inside the implementation of the platform to prevent further injuries or any deterioration of their impairments.
The MILORD project is an important aid to patients who have a mobility deficit in the upper extremity. Its basic use is extremely simple and easy. The virtual environment translates rehabilitation practice into a pleasant experience, aiming to increase patients' engagement. It is an important solution to increase the operational movements that should be performed in a rehabilitation program. Nevertheless, this is not a tool to be used alone. When integrated into the rehabilitation program and complements the patient's progress, the results are quite significant. We have not been able to identify significant statistical differences in upper extremity training between users of the program and patients who did not use it (control group). This was due to we did not have a large sample of users and, although patients reported an improvement in the use of the upper extremity, this was not depicted in the numbers. It would be necessary to continue research with more patients to get reliable results on its effect on the functionality of the upper extremity. MILORD contributes toward a framework for quantifiable gamified therapy that puts together the above-mentioned aspects, standardizes them, and enables the integration of evidence and the comparability of approaches.
Following the encouraging results of the preliminary study, an extensive clinical evaluation, although not feasible so far due to the unprecedented conditions created by the COVID-19 pandemic, will provide evidence in terms of additional motion improvements, user compliance, and cost-effectiveness in home care settings. More efforts are needed for the creation of this framework, to provide solid evidence about the efficiency of the rehabilitation scheme, and to personalize clinical practice. Future work also needs to be done toward the extension of the rehabilitation game's functionalities regarding the patients' engagement level. Such an idea is the deployment of a reward system inside the game, where the user could spend the collected coins for in-game benefits (e.g., artistic or functional).
The analysed data supporting the conclusions of this article will be made available by the authors upon request. The raw datasets presented in this article are restricted, based on the ethical approval taken. Requests to access the datasets should be directed to IC, aW9hbm5hY2hAYXV0aC5ncg==.
The studies involving human participants were reviewed and approved by Committee for Bioethics and Ethics, School of Medicine, Aristotle University of Thessaloniki. The patients/participants provided their written informed consent to participate in this study.
DF, IL, AC, EK, VK, and IC contributed to the design, implementation of the research, analysis of the results, and writing of the manuscript. TL contributed to the main conceptual ideas and performed the experiments. All authors contributed to the article and approved the submitted version.
This research has been co-financed by the European Union and Greek National Funds through the Operational Program Competitiveness, Entrepreneurship, and Innovation Program, under the call RESEARCH—CREATE—INNOVATE (project code: T1EDK-02488).
Author TL was employed by Theodoros Loizidis Apokatastasi LTM, Thessaloniki, Greece.
The remaining authors declare that the research was conducted in the absence of any commercial or financial relationships that could be construed as a potential conflict of interest.
All claims expressed in this article are solely those of the authors and do not necessarily represent those of their affiliated organizations, or those of the publisher, the editors and the reviewers. Any product that may be evaluated in this article, or claim that may be made by its manufacturer, is not guaranteed or endorsed by the publisher.
Afyouni, I., Rehman, F. U., Qamar, A. M., Ghani, S., Hussain, S. O., Sadiq, B., et al. (2017). A therapy-driven gamification framework for hand rehabilitation. User Model. User Adapt. Interact. 27, 215–265. doi: 10.1007/s11257-017-9191-4
Alt, B. F. (2006). Bonferroni inequalities and intervals. Encycl. Statist. Sci. 2006:ess0163.pub2. doi: 10.1002/0471667196.ess0163.pub2
Ang, K. K., and Guan, C. (2013). Brain-computer interface in stroke rehabilitation. J. Comput. Sci. Eng. 7, 139–146. doi: 10.5626/JCSE.2013.7.2.139
Chen, P. Y., and Popovich, P. M. (2011). Corellation: Parametric and Nonparametric Measures (California, CA: SAGE Publications).
Chytas, A., Fotopoulos, D., Kilintzis, V., Koutsiana, E., Ladakis, I., Kiana, E., et al. (2021). “Characterization of upper limb functionality caused by neuromuscular disorders using novel motion features from a specialized gaming platform,” in Proceedings of the 14th International Joint Conference on Biomedical Engineering Systems and Technologies, Vol. 4 (SciTePress), 60–68. doi: 10.5220/0010244400600068
Chytas, A., Fotopoulos, D., Kilintzis, V., Loizidis, T., and Chouvarda, I. (2020). “Upper limp movement analysis of patients with neuromuscular disorders using data from a novel rehabilitation gaming platform,” in IFMBE Proceedings (Cham: Springer International Publishing), 661–668. doi: 10.1007/978-3-030-31635-8_79
Dias, P., Silva, R., Amorim, P., Lains, J., Roque, E., Pereira, I. S. F., et al. (2019). Using virtual reality to increase motivation in poststroke rehabilitation. IEEE Comput. Graph. Appl. 39, 64–70. doi: 10.1109/MCG.2018.2875630
Ghassemi, M., Triandafilou, K., Barry, A., Stoykov, M. E., Roth, E., Mussa-Ivaldi, F. A., et al. (2019). Development of an EMG-controlled serious game for rehabilitation. IEEE Trans. Neural Syst. Rehabil. Eng. 27, 283–292. doi: 10.1109/TNSRE.2019.2894102
Granger, A. (2020). “Functional independence measure (FIM),” in A Compendium of Tests, Scales and Questionnaires, ed R. L. Tate (London: Psychology Press), 434–438. doi: 10.4324/9781003076391-126
Halic, T., Kockara, S., Demirel, D., Willey, M., and Eichelberger, K. (2014). “MoMiReS: mobile mixed reality system for physical & occupational therapies for hand and wrist ailments,” in 2014 IEEE Innovations in Technology Conference (Piscataway, NJ: IEEE), 1–6. doi: 10.1109/InnoTek.2014.6877376
Hamilton, B. B., Laughlin, J. A., Fiedler, R. C., and Granger, C. V. (1994). Interrater reliability of the 7-level Functional Independence Measure (FIM). Scand. J. Rehabil. Med. 26, 115–9.
Huber, M., Rabin, B., Docan, C., Burdea, G. C., AbdelBaky, M., and Golomb, M. R. (2010). Feasibility of modified remotely monitored in-home gaming technology for improving hand function in adolescents with cerebral palsy. IEEE Trans. Inform. Technol. Biomed. 14, 526–534. doi: 10.1109/TITB.2009.2038995
Johansson, G. M., and Hager, C. K. (2012). Measurement properties of the motor evaluation scale for upper extremity in stroke patients (MESUPES). Disabil. Rehabil. 34, 288–294. doi: 10.3109/09638288.2011.606343
Kalchbrenner, N., Grefenstette, E., and Blunsom, P. (2014). “A convolutional neural network for modelling sentences,” in Proceedings of the 52nd Annual Meeting of the Association for Computational Linguistics (Volume 1: Long Papers) (Baltimore, MD). doi: 10.3115/v1/P14-1062
Koutsiana, E., Ladakis, I., Fotopoulos, D., Chytas, A., Kilintzis, V., and Chouvarda, I. (2020). Serious gaming technology in upper extremity rehabilitation: scoping review. JMIR Serious Games 8, e19071. doi: 10.2196/19071
Kruskal, W. H., and Wallis, W. A. (1952). Use of ranks in one-criterion variance analysis. J. Am. Statist. Assoc. 47, 583. doi: 10.1080/01621459.1952.10483441
Ma, M., Proffitt, R., and Skubic, M. (2018). Validation of a Kinect V2 based rehabilitation game. PLoS ONE 13, e0202338. doi: 10.1371/journal.pone.0202338
Meijer, H. A., Graafland, M., Goslings, J. C., and Schijven, M. P. (2018). Systematic review on the effects of serious games and wearable technology used in rehabilitation of patients with traumatic bone and soft tissue injuries. Archiv. Phys. Med. Rehabil. 99, 1890–1899. doi: 10.1016/j.apmr.2017.10.018
Shapiro, A., and Wilk, M. B. (2015). The Shapiro-Wilk and Related Tests for Normality. Statistics (Ber).
Singer, B., and Garcia-Vega, J. (2017). The Fugl-Meyer upper extremity scale. J. Physiother. 63, 53. doi: 10.1016/j.jphys.2016.08.010
Smeddinck, J. D., Herrlich, M., and Malaka, R. (2015). “Exergames for physiotherapy and rehabilitation,” in Proceedings of the 33rd Annual ACM Conference on Human Factors in Computing Systems (New York, NY). doi: 10.1145/2702123.2702598
Keywords: gamification, rehabilitation, signal-analysis, neuromuscular disorders, healthcare service
Citation: Fotopoulos D, Ladakis I, Kilintzis V, Chytas A, Koutsiana E, Loizidis T and Chouvarda I (2022) Gamifying rehabilitation: MILORD platform as an upper limb motion rehabilitation service. Front. Comput. Sci. 4:932342. doi: 10.3389/fcomp.2022.932342
Received: 29 April 2022; Accepted: 25 August 2022;
Published: 04 October 2022.
Edited by:
Elvira Popescu, University of Craiova, RomaniaReviewed by:
Nuno Pombo, University of Beira Interior, PortugalCopyright © 2022 Fotopoulos, Ladakis, Kilintzis, Chytas, Koutsiana, Loizidis and Chouvarda. This is an open-access article distributed under the terms of the Creative Commons Attribution License (CC BY). The use, distribution or reproduction in other forums is permitted, provided the original author(s) and the copyright owner(s) are credited and that the original publication in this journal is cited, in accordance with accepted academic practice. No use, distribution or reproduction is permitted which does not comply with these terms.
*Correspondence: Dimitris Fotopoulos, ZGlmb3RvQGF1dGguZ3I=; Ioanna Chouvarda, aW9hbm5hY2hAYXV0aC5ncg==
Disclaimer: All claims expressed in this article are solely those of the authors and do not necessarily represent those of their affiliated organizations, or those of the publisher, the editors and the reviewers. Any product that may be evaluated in this article or claim that may be made by its manufacturer is not guaranteed or endorsed by the publisher.
Research integrity at Frontiers
Learn more about the work of our research integrity team to safeguard the quality of each article we publish.