 Maurita T. Harris
- 1Kinesiology & Community Health Department, University of Illinois Urbana-Champaign, Champaign, IL, United States
- 2Department of Educational Psychology, University of Illinois Urbana-Champaign, Champaign, IL, United States
Smart technologies (e.g., smartphones, smart security technologies, digital home assistants) have advanced over the years and will continue to do so. There are various benefits to using these technologies in one's life, such as an increase in productivity through automation and self-monitoring one's health. Older adults particularly may benefit from smart technologies to support their everyday activities and compensate for age related changes. In this study, we explored the experiences and attitudes of eighty older adults including those who had prior experience and those who had never used (or perhaps never heard of) smart technologies through an online survey. We assessed their general opinions toward using smart technology and explored what facilitated or hindered their use. Older adults rated the facilitators to use for each smart technology differently, with few commonalities between the order of the most agreed upon facilitators. However, older adults' opinions were consistent across each technology about their ignorance of technological features and cost of the smart technology, which could be potential barriers to use. Among those who had never used one of the smart technologies, privacy was the most commonly endorsed concern. The results from this study support the understanding of key considerations when developing and deploying smart technologies for older adults.
Introduction
Technological advancements in recent decades across a variety of areas have led to widespread increases in both the quantity and quality of support. From smartphones to digital home assistants (e.g., Amazon Echo), these technologies have broadly contributed to increased efficiency in completing daily tasks; improved awareness of health and wellness status; and provided additional opportunities for social engagement, among many other benefits. Moreover, smart technologies—which are internet-connected devices that can interact with other smart technologies to provide additional capabilities—allow for support, automation, and environmental control within the home. However, despite the potential advantages of integrating smart technologies into one's life, there remains a digital divide between younger and older generations, with the latter generally adopting current and emerging technologies at a slower pace (Faverio, 2022). This is problematic as this population may have the most to gain from these technologies.
Age-related changes across a variety of domains (e.g., cognitive, emotional, physical, social) can impact an older adult's quality of life and ability to age as—and where—they desire (Park, 2002; Charles and Carstensen, 2010; Rogers et al., 2020). As interindividual variability tends to increase with age (e.g., Nelson and Dannefer, 1992), the amount of support necessary to counter these changes varies from person to person, and access to quality care support may not be an option for many older adults who are socially isolated or unable to afford these services. Additionally, a common sentiment among older adults is their desire to age-in-place, or age within their personal home and community instead of moving to an assisted living or other such facility; nearly 80% of adults over the age of 50 desire to do so (Binette and Vasold, 2018). Thus, current and emerging technologies may play an important role in not only reducing the impact of many of the daily challenges older adults face, but also may be more accessible to address the individual needs of each older adult as they age.
Despite the generational digital divide, older adults have consistently been shown to not only use a variety of contemporary technologies (e.g., computers, cell phones, email; Anderson and Perrin, 2017), but also hold numerous positive opinions about these products that counter existing stereotypes (Czaja et al., 2006; Mitzner et al., 2010, 2019). Nevertheless, there is a lack of understanding of what specific smart technologies older adults are currently using, as well as the factors and opinions that contribute to this use (or non-use).
Understanding the factors that influence technology acceptance has been a primary focus of human-technology interaction research in recent decades. The Technology Acceptance Model (TAM; Davis et al., 1989) was one of the more influential attempts to understand computer technology acceptance specifically and was based upon previous work done by Azjen (1980) regarding their Theory of Reasoned Action (TRA). In brief, the TRA posits that one's actual behavior is strongly influenced by one's behavioral intention to perform a behavior, and that intention is in turn influenced by attitudes toward the behavior as well as subjective norms, defined as “the perceived social pressure to perform or not to perform the behavior” (Ajzen, 1991, p. 188). Davis's et al. (1989) TAM adapted the idea of the importance of behavioral intentions and applied it toward technology use, but differed from TRA in that they presumed these intentions were influenced by one's attitude toward using the technology and the perceived usefulness of the technology, dropping the subjective norm component of the model due to it being the least understood component of TRA at that time (e.g., Fishbein and Ajzen, 1975, p. 304). Additionally, TAM introduced a contributing factor that would play a large role in future technology acceptance models, namely, perceived ease of use, defined as “the degree to which the prospective user expects the target system to be free of effort” (Davis et al., 1989, p. 985).
To consolidate the numerous other technology models with the iterations of TAM (e.g., TAM2, TAM3; Venkatesh and Davis, 2000; Venkatesh et al., 2003; Venkatesh and Bala, 2008), proposed the aptly named Unified Theory of the Acceptance and Use of Technology (UTAUT). Currently in its second iteration (UTAUT2; Venkatesh et al., 2012), the unified model makes the case that seven primary factors influence an individual's behavioral intention to use a technology: (1) performance expectancy; (2) effort expectancy; (3) social influence; (4) facilitating conditions; (5) hedonic motivation; (6) price value; and (7) habit. Actual use behavior is then said to be influenced by behavioral intention, as well as facilitating conditions and habit. Additionally, age, gender, and experience were found to moderate some of these relationships.
Building upon the work of the previous general technology acceptance models, initial steps have been taken to understand older adults' technology acceptance specifically. Two such models include the Senior Technology Acceptance and Adoption Model (STAAM; Renaud and van Biljon, 2008) and the Senior Technology Acceptance Model (STAM; Chen and Chan, 2014). STAAM postulated three key phases of acceptance and adoption: objectification in which behavioral intention is molded by social influence and perceived usefulness, incorporation in which an older adult gradually incorporates the technology into their life to better understand how useful it is, and acceptance (or lack thereof) due to the attitudes they have gained during this process. In the STAM, which was influenced by the original TAM, the use of gerontechnology was influenced by personal characteristics (e.g., age, gender, socio-economic status), self-efficacy, anxiety, facilitating conditions, as well as health and cognitive status. Of note, in comparison to previous models, STAM found less of an importance of perceived usefulness and perceived ease of use, with most technology use being explained by the prior-listed variables. However, these results are constrained by the types of technology being evaluated and a limited participant sample.
As evident by the numerous factors that comprise these technology acceptance models, both generally and within those specifically relevant to older adults, technology acceptance is a complex and continuously evolving process. It involves understanding not only what facilitates the use of technologies, but also what barriers may impede people from wholly accepting a technology and integrating it firmly within their lives and routines to maximize the potential benefits. As the technologies themselves evolve—both in form-factor and capability—it is crucial that these acceptance factors and the models they comprise are revisited and updated to reflect contemporary acceptance contributors. Moreover, now that smart technologies are becoming more commonplace and may be used by older adults to improve or maintain their ability to perform important everyday activities, there needs to be more focus on the determinants of acceptance for these devices. This has especially been evident during the social isolation many older adults experienced during the COVID-19 global pandemic, in which social communication technologies had the potential to provide social support while maintaining safety from the virus. Thus, improving this overall understanding will only contribute to a more effective and accessible technology usage environment among this population, but also to more successful delivery of the potential benefits.
To explore the uptake of smart technologies by older adults, we developed a survey to assess the smart technologies older adults are using; the facilitators and barriers that impact their use of these technologies; and their opinions and preferences regarding the integration of these technologies into their daily lives (e.g., initial learning, overall usability). Our sample includes both current users of these technologies as well as current non-users to identify differences in their perspectives. By using a survey to explore use and non-use of smart technologies, we are gaining in-depth information on a personal and technological level.
Materials and Methods
Participants
We recruited participants via email through local and community organizations in both Champaign and Cook County, Illinois. These included the Illinois Health and Engagement through the Lifespan Project (I-HELP) participant registry and the TechSAge Rehabilitation Engineering Research Center (TechSAge RERC) participant registry. To participate in the study, individuals must have been 65 years or older as well as residing in the state of Illinois. We received 80 completed surveys; the mean age of our participants was 71.5 (SD = 11.77; range 65–90). For details of the participant demographics, see Table 1.
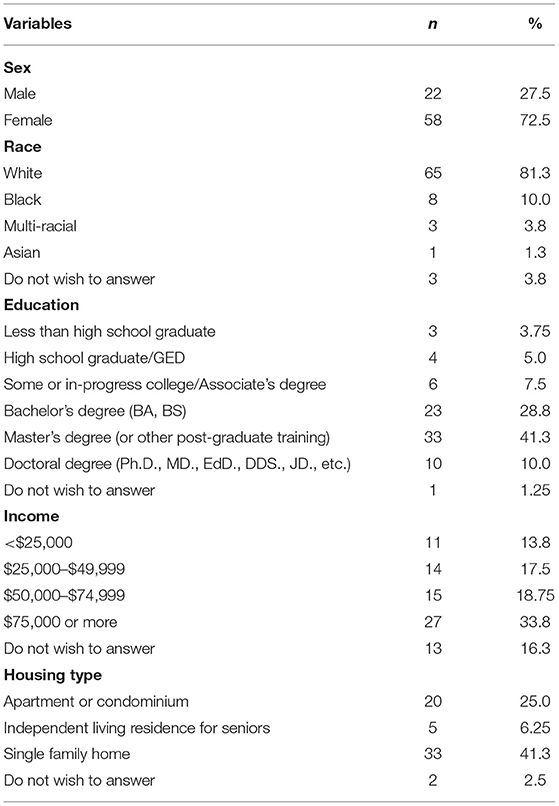
Table 1. Participant demographics.
Materials
To effectively understand older adults' current usage, experiences, opinions, and preferences regarding smart technology, we developed the Smart Technology Survey, which is available from the authors. Before participants rated their usage, they completed the Attitudes toward Computers questionnaire (Jay and Willis, 1992) to understand their opinions toward technology. Next, the survey consisted of two related sections for the eight technologies assessed: smartphones; digital home assistants; smart health tracking; smart thermostats; smart security; smart lighting and dimmer controls; smart plugs; and environmental sensors. The goal was to include categories that captured the broad space of available smart technologies.
The first section assessed frequency of technology use and contained an adapted version of the Technology Experience Profile (TEP; Barg-Walkow et al., 2014; see Figure 1 for an example question).
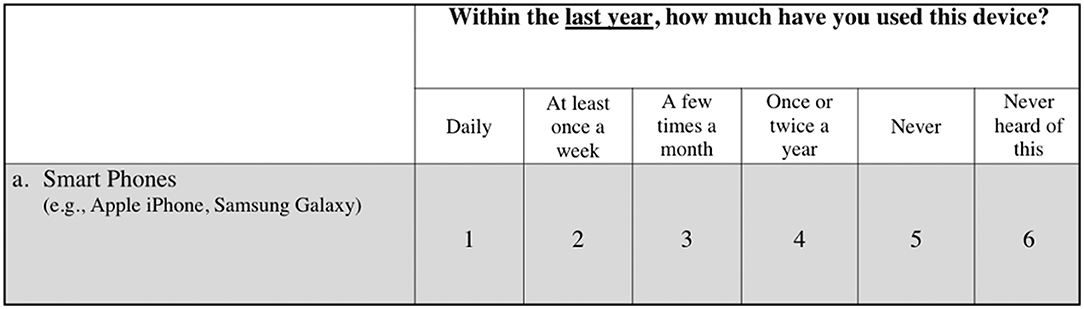
Figure 1. Exemplary question from the survey to illustrate assessment of smart technology use.
Follow up questions were dependent on how participants answered the use question for each technology. If they reported they had experience using the smart technology they were asked to respond to 24 follow-up statements relevant to their experiences, opinions, and preferences regarding their adoption and learning of each endorsed technology (see Figure 2). These statements were developed by adapting the Attitudes Toward Computers questionnaire (Jay and Willis, 1992) to be relevant to each presented smart technology rather than just computers, as well as adapted questions from the Self-Report Behavioral Automaticity Index to understand their smart technology habits (Gardner et al., 2012) and those relevant to components of the Unified Theory of Acceptance and Use of Technology 2 (e.g., price value, perceived ease of use; UTAUT2; Venkatesh et al., 2012). Additionally, statements were included regarding participants' learning environment and the support the utilized in gaining competency with the technology. If participants stated they never used the smart technology they were asked to respond to 10 follow-up statements that generally matched the statements the users responded to (see Figure 3). Lastly, if participants stated they never heard of the smart technology, they did not receive any follow-up statements, but rather just progressed to the next smart technology in the survey.
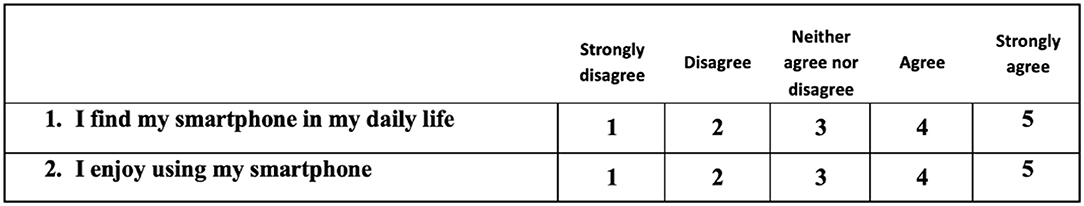
Figure 2. Exemplary follow-up questions for smart technology users.
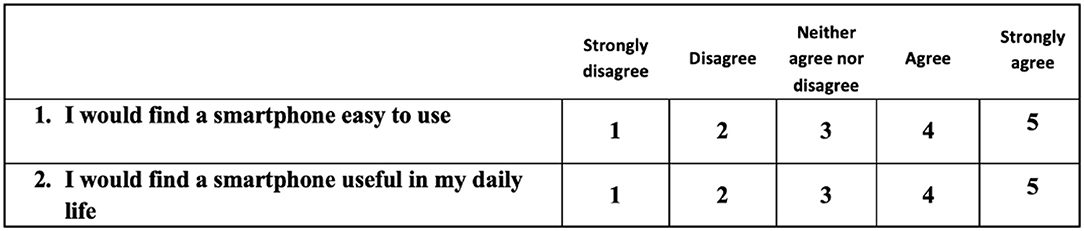
Figure 3. Exemplary follow-up questions for smart technology non-users.
Procedure
We sent potential participants an email containing a link to the survey, which was hosted on the Research Electronic Data Capture (REDCap) online data collection platform (Patridge and Bardyn, 2018). Once they consented to participate digitally, they rated their frequency of use for each technology category. Depending on their answer, they then received follow-up questions.
Following completion of the survey, we provided participants a debriefing form that explained the purpose of the research. Participants who provided their email were then entered into a raffle in which 10% were compensated with a $25 Amazon gift card.
Data Collection and Analysis
Data were collected over a 6-month period, from September 2020 to February 2021. The survey was administered via REDCap, necessary because due to the global COVID-19 pandemic and subsequent in-person data collection restrictions. To understand the sample's technology use, opinions, and preferences extracted in the survey, we used descriptive statistics (e.g., frequencies, means, standard deviations). Older adults who used their smart technology daily or sometimes (i.e., at least once a week, a few times a month, or once or twice a year) were considered “users” of that specific smart technology. Older adults who either never used or never heard of that smart technology were considered “non-users.”
One sample independent t-tests were used to assess significance. Ratings that were significantly greater than the neutral value (three) were considered to indicate interest in the statement. Ratings that were <3 were indicative of disagreement. The values that were not statistically different from three suggested a neutral stance.
Results
General Technology Opinions
Figure 4 shows the participants' agreement with statements about technology in general. All of the mean scores were significantly different from the neutral point (see Figure 4), indicating the participants had clear opinions and they were primarily positive. The positive statements that received the most agreement were related to their perceived ability to use technology with training [t(79) = 36.91, p < 0.001] and their capability to learn how to use the technology [t(79) = 36.91, p < 0.001], with similarly high agreement for the idea that learnings technology is worthwhile. The negatively worded statement that received the most agreement focused on learning how to use the technology being a waste of time [t(79) = 28.98, p < 0.001]. Thus, overall, the respondents had generally positive attitudes toward technology.
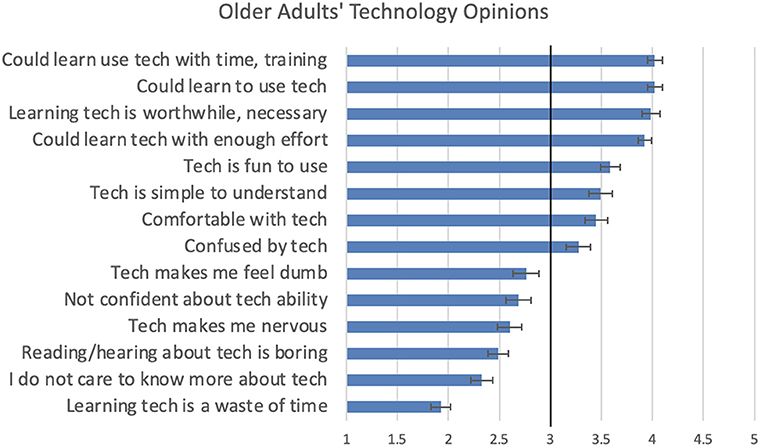
Figure 4. Older adults' technology opinions. Ratings ranged from 1 (strongly disagree) to 5 (strongly agree). The error bars represent standard error of the mean. The term “Tech” was spelled out as “Technology” in the survey.
Overall Use Patterns
To understand the overall use patterns for the eight smart technologies, we identified three groups: (1) Daily users; (2) Sometimes users (reportedly used the technology at least once a week, a few times a month, or once or twice a year); and (3) Never users (i.e., non-users). Figure 5 presents the distribution across technologies. The top three most frequently used were smartphones, environmental sensors, and smart health trackers. The least frequently used were smart plugs, smart security, and smart lighting and dimmer controls. Lastly, the smart technologies the older adults used sometimes were digital home assistants and smart thermostats.
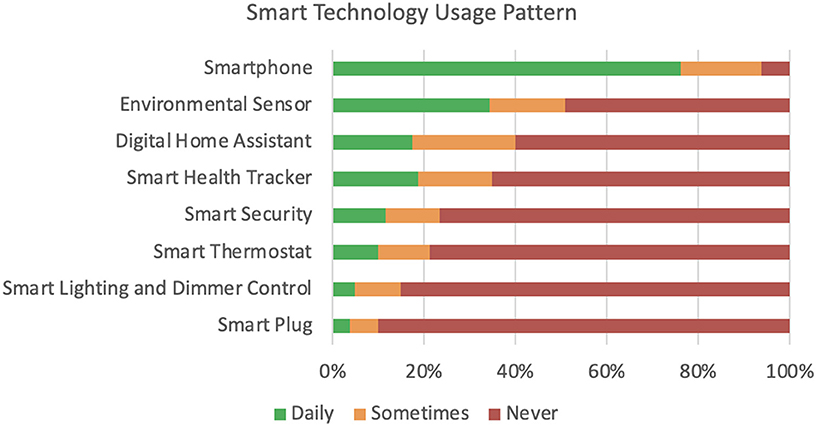
Figure 5. Smart technologies usage patterns.
These data illustrate the diversity of use patterns, across people and across technology types. To explore the individual perceptions of these different groups, the detailed data for three technologies were analyzed in more depth and presented herein: one used by the majority of participants (i.e., smartphone, used at least sometimes 94%); one used by only a minority of participants (i.e., smart security, used at least sometimes by 23%); and one with a mixed pattern of use (i.e., digital home assistant, used at least sometimes by 40%). For each technology, we provide the perceptions from both the users and the non-users to explore the factors that might be influencing technology acceptance (or lack thereof).
Smartphone
Of the 80 older adults in this study, 75 self-reported using a smartphone at least sometimes and only 5 were considered non-users. The examples provided when responding to the smartphone experience question were Apple iPhone and Samsung Galaxy. Figure 6 presents the users' perceptions of statements that could be considered either facilitators or barriers to use. We discuss each category in turn.
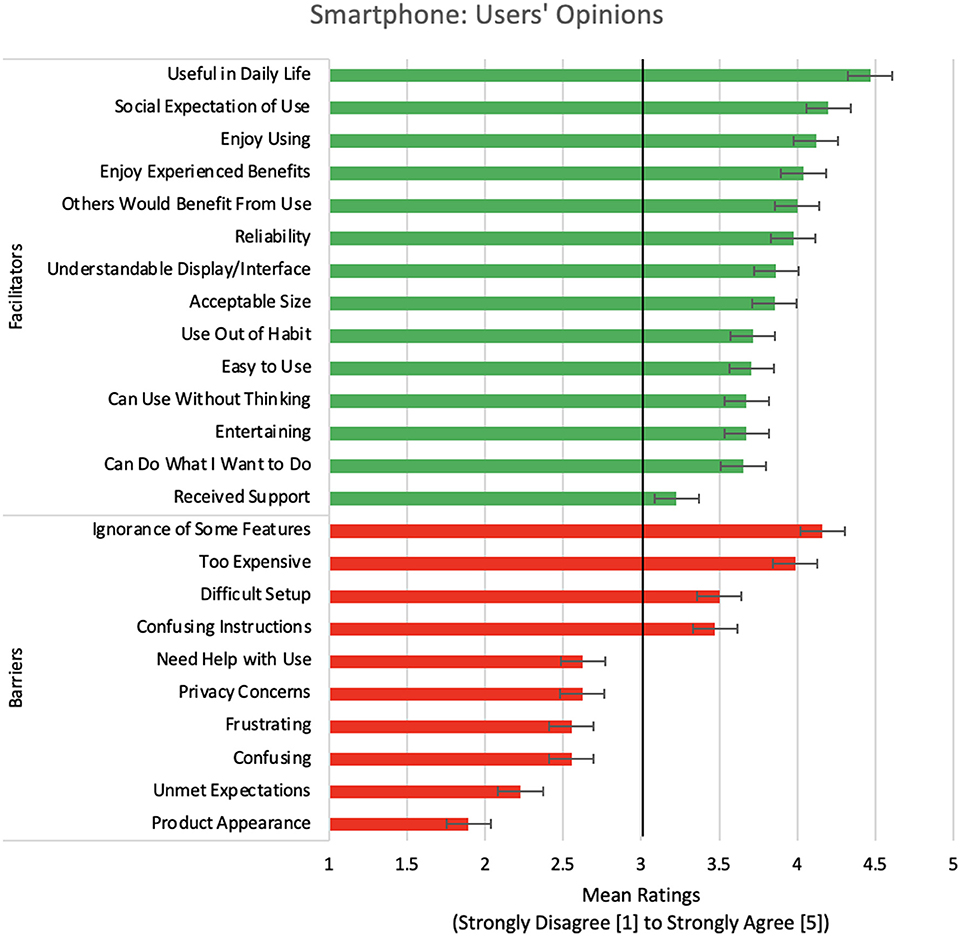
Figure 6. Users' opinions toward smartphones. Error bars represents standard error of the mean.
Smartphone: Facilitators of Use
The highest rated significant facilitator among older adult users was useful in daily life [i.e., perceived usefulness; t(74) = 2.32, p < 0.01]. Additional significant facilitators, in descending order from most agreed upon to less agreed upon were social expectation of use [i.e., social influence; t(74) = 3.43, p < 0.001], general enjoyment [i.e., hedonic motivation; t(74) = 3.97, p < 0.001], beneficial for others [t(74) = 3.91, p < 0.001], understandable display/interface [t(74) = 1.82, p < 0.04], and acceptable size [t(73) = 1.98, p < 0.03].
The remaining facilitators were not highly rated, but they were still above the neutral point. Those facilitators were easy to use [t(73) = 2.96, p < 0.001] and the smartphone having the ability to do what they want it to do [t(74) = 2.47, p < 0.008].
Smartphone: Barriers to Use
Repondents highly agreed with two perceived barriers in comparison to other presented options, which was related to their ignorance of the features [t(74) = 3.54, p < 0.001] and smartphones being too expensive [t(73) = 2.22, p < 0.01].
The remaining significant barriers for smartphone in descending order were difficult setup [t(73) = 2.34, p < 0.01], confusing instructions [t(74) = 1.9, p < 0.02], needing help from others [i.e., facilitating conditions; t(73) = 2.00, p < 0.02], privacy concerns [t(73) = 1.82, p < 0.04], being frustrated [t(73) = 1.91, p < 0.03], not meeting expectations [t(74) = 2.34, p < 0.01], and the appearance [t(74) = 2.37, p < 0.02].
Smartphone: Opinions of Nonusers
The opinions of nonusers of smartphone devices were also collected (see Figure 7). Of the five older adults who did not use a smartphone, the top-rated opinion was the belief that smartphones would affect their privacy [t(4) = 8.85, p < 0.001].
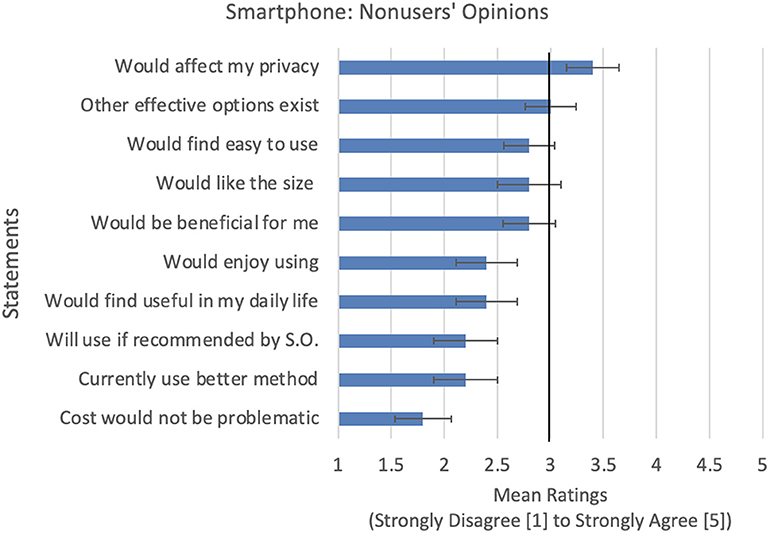
Figure 7. Non-users' opinions toward smartphones. Error bars represents standard error of the mean (S.O. is significant other).
Opinions that were most disagreed with included the belief that the cost would not be problematic [t(4) = 6.23, p < 0.002]. Other disagreed with statements, leading to the neutral point, were they currently use a better method [t(4) = 5.82, p < 0.002] and would use if a significant other recommended a smartphone [t(4) = 2.94, p < 0.02], and would find it easy to use [t(4) = 3.32, p < 0.01].
Smart Security Technology
Of the 80 older adults in the study, 18 older adults responded that they owned and used a smart security device at least sometimes, 5 stated they never used such technology, and 3 did not wish to answer. Examples provided were smart doorbells and entrance monitors (e.g., Ring Video Doorbell), smart door locks (e.g., August Smart Lock), and smart interior and exterior Cameras (e.g., Nest Hello Doorbell Camera). For an overview of responses to these statements, see Figure 8.
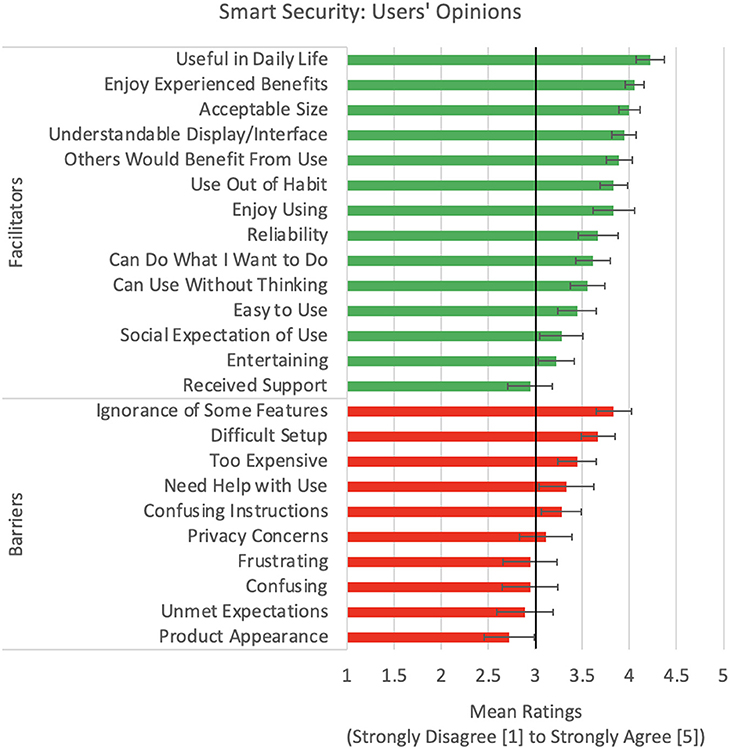
Figure 8. Users' opinions toward smart security technologies. Error bars represents standard error of the mean.
Smart Security Technology: Facilitators of Use
The highest rated facilitator was that older adults using their smart technology found it to be useful in their daily life [t(17) = 8.01, p < 0.002]. Following this perceived usefulness, the factors that were rated highly, in descending order of rating, were enjoyment of the experienced benefits [t(17) = 10.76, p < 0.001], acceptable size of device [t(17) = 8.75, p < 0.001], understandable display/interface [t(17) = 7.43, p < 0.001], other would benefit from use of this technology [t(17) = 7.47, p < 0.001], habit forming [t(17) = 5.72, p < 0.001], and general enjoyment of using the technology [t(17) = 3.83, p < 0.001]. Other facilitative statements that the older adult users agreed with, although less so than the aforementioned factors, included that they found the device to be reliable [t(17) = 3.12, p < 0.003], the device does what is desired of it [t(17) = 3.33, p < 0.002], the device can be used without thinking [t(17) = 3.01, p < 0.004], and it is easy to use [t(17) = 2.2, p < 0.02].
Smart Security Technology: Barriers to Use
The barrier that was agreed with most highly was that the older adults knew of features or capabilities that their smart technology had but were ignorant of how to use or access them [t(17) = 4.49, p < 0.001). Following this perceived barrier, other barrier-related factors that older adult smart security technology users rated as agreeing to were that setting up the technology was difficult [t(17) = 3.69, p < 0.001] and the technology is too expensive [t(17) = 2.2, p < 0.02].
Smart Security Technology: Opinions of Nonusers
Of the 59 older adults who did not use smart security technology, the top-rated opinion was the belief that smartphones would affect their privacy [t(55) = 17.8, p < 0.001; see Figure 9]. This was followed by knowing there are other effective options that exist in the space [t(55) = 29.34, p < 0.001].
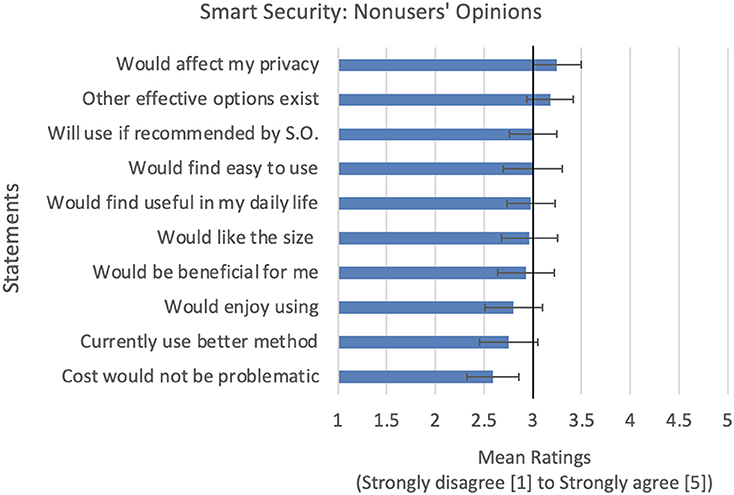
Figure 9. Non-users' opinions toward smart security technologies. Error bars represents standard error of the mean.
Opinions that were most disagreed upon was the belief that the cost would not be problematic [t(55) = 30.35, p < 0.001]. Other disagreed upon opinions in ascending order were that they currently use a better method [t(55) = 23.41, p < 0.001], would enjoy using smart security technology [t(55) = 23.25, p < 0.001], would find it beneficial for them [t(55) = 24.93, p < 0.001], would like the size of the smart security technology [t(55) = 36.36, p < 0.001], would find it useful in their daily life [t(55) = 22.41, p < 0.001], would find smart security technologies easy to use [t(55) = 26.43, p < 0.001], and they would use it if a significant other recommended it for them [t(55) = 20.1, p < 0.001].
Digital Home Assistants
The technology that showed a pattern of mixed use by older adults was digital home assistant. The examples provided were Amazon Echo and Google Home. Of the 80 respondents, 30 reportedly used a digital home assistant at least sometimes and 46 responded that they have never used a digital home assistant. For an overview of responses to the facilitator and barrier statements, see Figure 10.
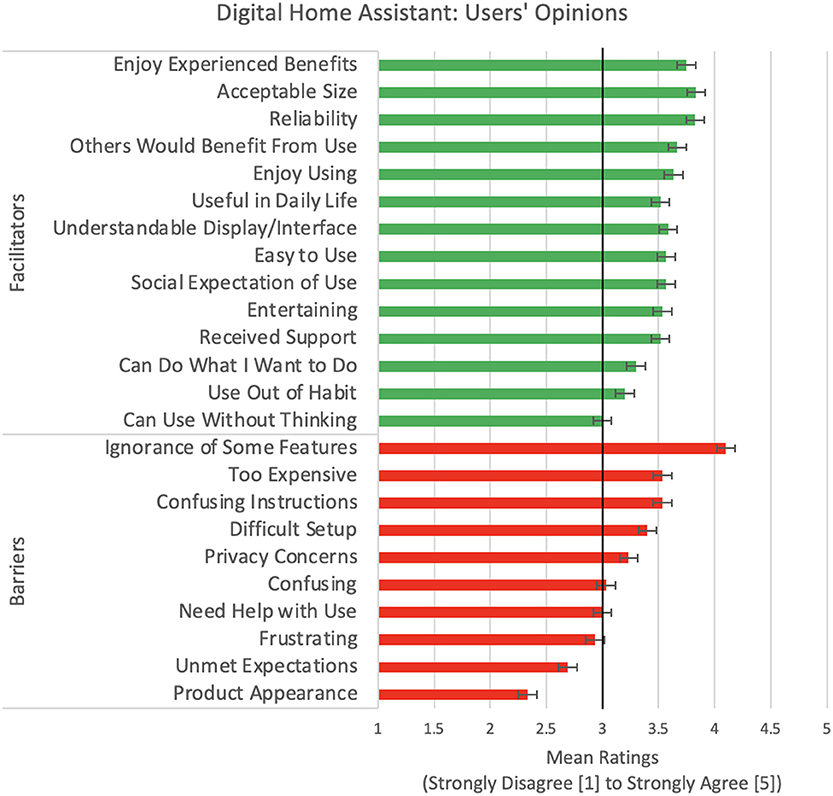
Figure 10. Users' opinions toward digital home assistants. The error bars represent standard error of the mean.
Digital Home Assistant: Facilitators of Use
Across the 32 digital home assistant users, the highest rated perceived facilitator was that older adults enjoyed the benefits experienced through use of the devices [t(29) = 5.45, p < 0.001]. Other perceived barriers in descending order were the digital home assistant was an acceptable size [t(29) = 4.06, p < 0.001], reliable [t(28) = 4.43, p < 0.001], beneficial for others [t(29) = 4.17, p < 0.001], enjoyable [t(29) = 3.81, p < 0.001], useful in daily life [t(29) = 4.13, p < 0.001], include a understandable display/interface [t(29) = 4.55, p < 0.001], easy to use [t(29) = 4.01, p < 0.001], involve social expectation of use [t(29) = 4.41, p < 0.001], entertaining [t(29) = 3.45, p < 0.001], encompass receiving support [t(29) = 3.78, p < 0.001], can do the desired task [t(29) = 3.53, p < 0.001], habit forming [t(29) = 4.01, p < 0.001], and contain the ability to use a digital home assistant without thinking [t(29) = 3.4, p < 0.001].
Digital Home Assistant: Barriers to Use
The perceived barrier that participants agreed with the most was knowing the digital home assistant had capabilities and features, but being ignorant of how to use them [t(29) = 4.53, p < 0.001]. Other barriers agreed upon by older adults were that the digital home assistants are too expensive [t(29) = 3.34, p < 0.001], include confusing instructions [t(29) = 3.58, p < 0.001], consist of a difficult setup [t(29) = 4.03, p < 0.001), and lead to privacy concerns [t(29) = 3.27, p < 0.001].
There were five potential barriers that the older adults did not perceive as having a negative impact on use. The barrier that was most disagreed with as having impacted use was the appearance of digital home assistants [t(29) = 4.97, p < 0.001]. Continuing in an ascending order to the neutral point, other such barriers were digital home assistants not meeting expectations [t(29) = 4.53, p < 0.001], being frustrating [t(29) = 3.72, p < 0.001], needing help to use [t(29) = 4.08, p < 0.001], and being confusing [t(29) = 3.66, p < 0.001]. Thus, older adults consistently expressed that these potential barriers had little to no impact on use.
Digital Home Assistant: Opinions of Nonusers
The most agreed with statement was the belief that digital home assistants would affect their privacy [t(23) = 7.34, p < 0.001] followed by knowing that other effective options exist [t(23) = 15.72, p < 0.001; see Figure 11].
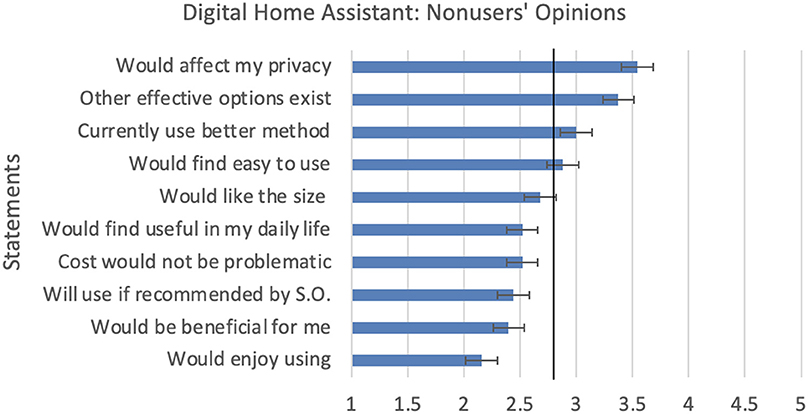
Figure 11. Non-users' opinions toward digital home assistants. Error bars represents standard error of the mean.
The most disagreed with statement was they would enjoy using the digital home assistant [t(24) = 13.74, p < 0.001]. Other opinions were finding the digital home assistant to be beneficial for them [t(24) = 14.03, p < 0.001], using a digital home assistant due to recommendation from a significant other [t(24) = 11.93, p < 0.001], cost would not be problematic [t(24) = 16.95, p < 0.001], finding it to be useful in daily life [t(24) = 14.69, p < 0.001], liking the size [t(24) = 19.05, p < 0.001], finding it easy to use [t(24) = 14.14, p < 0.001], and using a better method [t(23) = 15.84, p < 0.001].
Discussion
Positivity of Opinions Facilitators of Use
Our exploration of older adults' opinions surrounding the use and non-use of smart technologies portrays the current landscape of adoption for a sample of older adults. A benefit of knowing these opinions allow designers to understand the focused areas that older adults take into consideration. This study explored the experiences and opinions of older adults who use and do not use smart technologies.
The opinions of the older adults in this sample were predominately positive, contradicting the common stereotype that older adults are unwilling to use technology. This coincides with other findings (e.g., Mitzner et al., 2010), wherein older adults reported more positive than negative sentiments toward technology use. One reason for this could be that older adults are increasingly using technology, such as smartphones PEW, and the internet more (Anderson and Perrin, 2017), leading them to see the benefits of us.
The generally positive attitudes we observed might be reflective of a sample bias for our survey. The participants were recruited via email and the survey was administered online as the data were collected during the COVID-19 global pandemic. This likely led to a sample of older adults who had relatively high technology proficiency. Moreover, our sample consisted of mostly older adults who identified as female and White with high levels of education (i.e., Bachelor's degree or higher). Future studies should incorporate diverse recruitment strategies to include participants who may not be included in registries associated with universities and those without access to computers. For example, sending surveys to external registries; placing flyers in the communities; and inputting responses in the survey with participants present (e.g., in-person or via the phone). Additionally, conducting interviews with the older adults who completed the surveys would allow for a more detailed, qualitative understanding of why they used or did not use smart technologies. Thus, a mixed-method study would allow for a more holistic perspective on the usage.
Although our sample was restricted in scope, we still had a range of users and non-users for the specific smart technologies we explored. As such, our findings provide insights, at the level of the individual and at the level of specific technologies, about the factors that contribute to adoption (or lack thereof) of smart technologies for a sample of older adults.
Facilitators of Use
Numerous facilitators influence intentions and actual usage of technology. However, the core facilitators found across models of technology acceptance are perceived usefulness, perceived ease of use, facilitating conditions, and some type of social aspect (Venkatesh et al., 2012; Chen and Chan, 2014). For example, perceived usefulness and perceived ease of use are influence intentions to use (Venkatesh et al., 2012) and actual use (Chen and Chan, 2014). Facilitating conditions (e.g., instructional support) and some type of social aspect influences intentions to use. Additionally, there are factors that influence the core facilitators, intentions, and actual usage, such as anxiety (Chen and Chan, 2014), attitudes (Chen and Chan, 2014), hedonic motivation (Venkatesh et al., 2012), perceived benefit (Harris and Rogers, 2021), price value (Venkatesh et al., 2012; Harris and Rogers, 2021), and self-efficacy (Chen and Chan, 2014). In this study, participants mostly agreed upon different facilitators across three different smart technologies.
Those who had used a smartphone agreed upon perceived usefulness, social influence, and hedonic motivation as facilitators that supported usage. Social influence, the perception that important others believe a technology should be used, was found to be a strong predictor of smartphone usage in a study by Busch et al. (2021). In fact, over half of their participants had a strong social influence toward smartphone use. The commonalities exemplify that social influence may impact actual usage of smart phones by older adults. However, Busch and colleagues also found another strong predictor of smartphone usage, which was habit. In UTAUT2, habit was a facilitator added to extend the original UTAUT and demonstrated that it can predict continued use of technology. In both studies, they used the definition of habit as automaticity due to learning (Limayem et al., 2007). In the present study, the technology users did have positive agreement with statments about the importance of habit. Lastly, hedonic motivation was another facilitator incorporated into UTAUT2, which was found to also predict continued use. With the option of adding different mobile apps, such as games and social media, the focus on fun and pleasure from use is not surprising.
For smart security technologies, the most agreed upon facilitators were perceived usefulness, enjoyable benefits, and aesthetics. No analogous research examining these facilitators in the smart security domain are available for reference, in comparison to the other two technology categories (smartphones, digital home assistants). Thus, our findings show the generality of technology acceptance facilitators.
Lastly, the most agreed upon facilitators for digital home assistants, were reliability, aesthetics, and enjoyable benefits. In recent research conducted by Koon et al. (2020), perceptions that current users, who were 55+, had toward digital home assistants from initial use to continued use were investigated through semi-structured interviews. For initial use, purchase, setup, and social influence were mentioned an important; however, contributors to continued use were perceived usefulness, perceived ease of use, hedonic motivation, and facilitating conditions. The differences between these findings and our data may be that Koon et al. focused on the more limited factors in the original UTAUT model. Our finding that reliability and aesthetics were positively endorsed is an extension of the literature because these two facilitators do not appear in modern technology acceptance models.
Digital home assistants can support older adults in receiving real-time information about their environment and society through phrases that are activated through voice. These features may be seen as beneficial but can also make older adults feel technologically inadequate if the digital home assistant does not pick up their phrase (Duque et al., 2021). After learning how to use a digital home assistant, it can improve one's wellbeing and support everyday activities. Furthermore, aesthetics may play a more significant role than perceived ease of use regarding intentions to use a technology (Parra et al., 2012) and its importance is understudied in the technology acceptance literature (Parra et al., 2012; Malik et al., 2017).
Barriers to Use
With respect to barriers, the two statements that were most agreed with across all three smart technologies were ignorance of technological features (Vaportzis et al., 2017) and too expensive (price value; Vaportzis et al., 2017). The statement that was agreed with across at least two smart technologies was confusing instructions (i.e., absence of facilitating conditions). Many technologies that are designed to be multifunctional or have additional features on top of the main purpose. Thus, it is not surprising that some older adults did not know all their smart technology's features. The price of smart technology is also important to older adults. In 2020, the median income for older adults was $27,398 and $70,254 for families headed by someone who was 65 or older (Administration on Aging, 2021). Thus, in terms of consumer purchases, smart technologies may not be as important as more dire needs. The third most agreed upon barriers for smartphones and smart security technologies was the setup of the technology. Although not third for digital home assistants, difficult setup was fourth and followed confusing instructions. Clear instructions can support older adults in setting up and using their smart technology. This is especially important for new users who are first learning about their smart technology (Koon et al., 2020).
Lastly, the most agreed upon barrier for non-users across the three technologies was privacy concerns. With the ever-growing possibility of personal data being accessed without permission or awareness, privacy concerns are becoming an increasingly common barrier among older adults (Technology Use Among Seniors, 2017; Fox and Connolly, 2018; Harris and Rogers, 2021). For widespread adoption of smart technologies to occur it will be important to address these privacy concerns of older consumers.
Conclusion
The overarching goal of this survey was to explore smart technology usage patterns for older adults. The survey approach provided a general snapshot of the use and non-use of smart technology on the individual and technology level, and a broad understanding of the facilitators, barriers, and opinions related to smart technology usage. Our findings depicted topics that should be considered when developing smart technologies for older adults based on their opinions and preferences. Specifically, this could be done by investing more into illustrating for the older adult population how smart technologies are useful, fun, beneficial, and aesthetically pleasing. Additionally, providing more comprehensive onboarding instructional support for the device by older adults could be beneficial. Such facilitating conditions can ensure they understand the various features of the smart technology and ensure effective support for setting it up and getting acclimated to using it for everyday activities. Lastly, if possible, decreasing the cost of smart technologies to ensure it is more affordable and accessible to a wider range of older adults with varying socioeconomic status would allow these potential benefits to be experienced by a larger percentage of the older population. Incorporating these different facilitators to use as a prime focus in the development of the technology may support the understanding of how to engage non-users and support continued usage by those with prior experience.
Data Availability Statement
The raw data supporting the conclusions of this article will be made available by the authors, without undue reservation.
Ethics Statement
This study involving human participants was reviewed and approved by the Office for the Protection of Research Subjects at the University of Illinois Urbana-Champaign. The Ethics Committee waived the requirement of written informed consent for participation.
Author Contributions
MH, KB, and WR contributed to the conception and design of the study. MH organized the database. MH and KB performed the statistical analysis and wrote sections of the manuscript. All authors contributed to manuscript revision, read, and approved the submitted version.
Funding
This research was supported in part by the National Institutes of Health (National Institute on Aging) Grant P01 AG17211 under the auspices of the Center for Research and Education on Aging and Technology Enhancement (CREATE; www.create-center.org).
Conflict of Interest
The authors declare that the research was conducted in the absence of any Commercial or financial relationships that could be construed as a potential conflict of interest.
Publisher's Note
All claims expressed in this article are solely those of the authors and do not necessarily represent those of their affiliated organizations, or those of the publisher, the editors and the reviewers. Any product that may be evaluated in this article, or claim that may be made by its manufacturer, is not guaranteed or endorsed by the publisher.
Acknowledgments
The authors would like to thank Megan Sebahar and Shaunik Kapoor for their assistance with this study.
References
Administration on Aging (2021). 2020 Profile of Older Americans. Administration on Aging, 1–21. Available online at: https://acl.gov/sites/default/files/Profile%20of%20OA/2020ProfileOlderAmericans_RevisedFinal.pdf
Ajzen, I (1991). The theory of planned behavior. Organ. Behav. Hum. Dec. Proc. 50, 179–211. doi: 10.1016/0749-5978(91)90020-T
Anderson, M., and Perrin, A. (2017). Tech Adoption Climbs Among Older Americans. Pew Research Center: Internet, Science & Tech. Available online at: https://www.pewresearch.org/internet/2017/05/17/tech-adoption-climbs-among-older-adults/
Azjen, I (1980). Understanding Attitudes and Predicting Social Behavior. Englewood Cliffs, NJ: Prentice Hall.
Barg-Walkow, L. H., Mitzner, T. L., and Rogers, W. A. (2014). The Technology Experience Profile (TEP): Assessment and Scoring Guide (HFA-TR-1402). Atlanta, GA: Georgia Institute of Technology, School of Psychology, Human Factors and Aging Laboratory.
Binette, J., and Vasold, K. (2018). Home and Community Preferences: A National Survey of Adults Age 18-Plus. Washington, DC: AARP Research. doi: 10.26419/res.00231.011
Busch, P. A., Hausvik, G. I., Ropstad, O. K., and Pettersen, D. (2021). Smartphone usage among older adults. Comput. Hum. Behav. 121, 106783. doi: 10.1016/j.chb.2021.106783
Charles, S. T., and Carstensen, L. L. (2010). Social and emotional aging. Ann. Rev. Psychol. 61, 383–409. doi: 10.1146/annurev.psych.093008.100448
Chen, K., and Chan, A. H. S. (2014). Gerontechnology acceptance by elderly Hong Kong Chinese: a senior technology acceptance model (STAM). Ergonomics 57, 635–652. doi: 10.1080/00140139.2014.895855
Czaja, S. J., Charness, N., Fisk, A. D., Hertzog, C., Nair, S. N., Rogers, W. A., et al. (2006). Factors predicting the use of technology: findings from the center for research and education on aging and technology enhancement (CREATE). Psychol. Aging 21, 333–352. doi: 10.1037/0882-7974.21.2.333
Davis, F. D., Bagozzi, R. P., and Warshaw, P. R. (1989). User acceptance of computer technology: a comparison of two theoretical models. Manage. Sci. 35, 982–1003. doi: 10.1287/mnsc.35.8.982
Duque, M., Pink, S., Strengers, Y., Martin, R., and Nicholls, L. (2021). Automation, wellbeing and digital voice assistants: Older people and google devices. Convergence 27, 1189–1206. doi: 10.1177/13548565211038537
Faverio, M (2022). Share of Those 65 and Older Who Are Tech Users has Grown in the Past Decade. Pew Research Center. Available online at: https://www.pewresearch.org/fact-tank/2022/01/13/share-of-those-65-and-older-who-are-tech-users-has-grown-in-the-past-decade/
Fishbein, M., and Ajzen, I. (1975). Belief, Attitude, Intention and Behavior: An Introduction to Theory and Research. Reading, MA: Addison-Wesley.
Fox, G., and Connolly, R. (2018). Mobile health technology adoption across generations: narrowing the digital divide. Inform. Syst. J. 28, 995–1019. doi: 10.1111/isj.12179
Gardner, B., Abraham, C., Lally, P., and de Bruijn, G.-J. (2012). Towards parsimony in habit measurement: testing the convergent and predictive validity of an automaticity subscale of the self-report habit index. Int. J. Behav. Nutr. Phys. Act. 9, 102. doi: 10.1186/1479-5868-9-102
Harris, M. T., and Rogers, W. A. (2021). Developing a healthcare technology acceptance model (H-TAM) for older adults with hypertension. Ageing Soc. 1–21. doi: 10.1017/S0144686X21001069
Jay, G. M., and Willis, S. L. (1992). Influence of direct computer experience on older adults' attitudes toward computers. J. Gerontol. 47, P250–P257. doi: 10.1093/geronj/47.4.P250
Koon, L. M., McGlynn, S. A., Blocker, K. A., and Rogers, W. A. (2020). Perceptions of digital assistants from early adopters aged 55+. Ergonom. Design. 28, 16–23. doi: 10.1177/1064804619842501
Limayem, M., Hirt, S. G., and Cheung, C. M. K. (2007). How habit limits the predictive power of intention: The case of information systems continuance. MIS Q. 31, 705. doi: 10.2307/25148817
Malik, A., Suresh, S., and Sharma, S. (2017). Factors influencing consumers' attitude towards adoption and continuous use of mobile applications: a conceptual model. Proc. Comp. Sci. 122, 106–113. doi: 10.1016/j.procs.2017.11.348
Mitzner, T. L., Boron, J. B., Fausset, C. B., Adams, A. E., Charness, N., Czaja, S. J., et al. (2010). Older adults talk technology: technology usage and attitudes. Comp. Hum. Behav. 26, 1710–1721. doi: 10.1016/j.chb.2010.06.020
Mitzner, T. L., Savla, J., Boot, W. R., Sharit, J., Charness, N., Czaja, S. J., et al. (2019). Technology adoption by older adults: findings from the prism trial. Gerontologist 59, 34–44. doi: 10.1093/geront/gny113
Nelson, E. A., and Dannefer, D. (1992). Aged heterogeneity: fact or fiction? The fate of diversity in gerontological research. Gerontologist 32, 17–23. doi: 10.1093/geront/32.1.17
Park, D. C (2002). Aging, cognition, and culture: a neuroscientific perspective. Neurosci. Biobehav. Rev. 26, 859–867. doi: 10.1016/S0149-7634(02)00072-6
Parra, F., Abdelfattah, B., and Bagchi, K. (2012). Aesthetics in the adoption of information and communication technology. AMCIS 2012 Proc. Available online at: https://aisel.aisnet.org/amcis2012/proceedings/AdoptionDiffusionIT/25
Patridge, E. F., and Bardyn, T. P. (2018). Research electronic data capture (REDCap). J. Med. Lib. Assoc. 106, 142–144. doi: 10.5195/jmla.2018.319
Renaud, K., and van Biljon, J. (2008). Predicting technology acceptance and adoption by the elderly: A qualitative study. In: Proceedings of the 2008 Annual Research Conference of the South African institute of Computer Scientists and information Technologists on IT Research in Developing Countries: Riding the Wave of Technology, Vol. 338. (New York, NY: ACM), 210–219.
Rogers, W. A., Ramadhani, W. A., and Harris, M. T. (2020). Defining aging in place: the intersectionality of space, person, and time. Innov. Aging 4, igaa036. doi: 10.1093/geroni/igaa036
Technology Use Among Seniors. (2017). Pew Research Center: Internet, Science & Tech. Available online at: https://www.pewresearch.org/internet/2017/05/17/technology-use-among-seniors/
Vaportzis, E., Giatsi Clausen, M., and Gow, A. J. (2017). Older adults' perceptions of technology and barriers to interacting with tablet computers: a focus group study. Front. Psychol. 8, 1687. doi: 10.3389/fpsyg.2017.01687
Venkatesh, V., and Bala, H. (2008). Technology acceptance model 3 and a research agenda on interventions. Dec. Sci. 39, 273–315. doi: 10.1111/j.1540-5915.2008.00192.x
Venkatesh, V., and Davis, F. D. (2000). A theoretical extension of the technology acceptance model: four longitudinal field studies. Manag. Sci. 46, 186–204. doi: 10.1287/mnsc.46.2.186.11926
Venkatesh, V., Morris, M. G., Davis, G. B., and Davis, F. D. (2003). User acceptance of information technology: Toward a unified view. MIS Q. 27, 425–478. doi: 10.2307/30036540
Keywords: older adults, smart technology, technology adoption, technology usage, technology non-use
Citation: Harris MT, Blocker KA and Rogers WA (2022) Older Adults and Smart Technology: Facilitators and Barriers to Use. Front. Comput. Sci. 4:835927. doi: 10.3389/fcomp.2022.835927
Received: 15 December 2021; Accepted: 04 March 2022;
Published: 04 May 2022.
Edited by:
Alex Chaparro, Embry–Riddle Aeronautical University, United StatesReviewed by:
Styliani Kleanthous, Open University of Cyprus, CyprusAdamantios Koumpis, RWTH Aachen University, Germany
Copyright © 2022 Harris, Blocker and Rogers. This is an open-access article distributed under the terms of the Creative Commons Attribution License (CC BY). The use, distribution or reproduction in other forums is permitted, provided the original author(s) and the copyright owner(s) are credited and that the original publication in this journal is cited, in accordance with accepted academic practice. No use, distribution or reproduction is permitted which does not comply with these terms.
*Correspondence: Wendy A. Rogers, wendyr@illinois.edu
†These authors have contributed equally to this work and share first authorship