 Lukas Stappen
 Alice Baird
 Michelle Lienhart
 Annalena Bätz
 Björn Schuller
95% of researchers rate our articles as excellent or good
Learn more about the work of our research integrity team to safeguard the quality of each article we publish.
Find out more
ORIGINAL RESEARCH article
Front. Comput. Sci. , 23 March 2022
Sec. Human-Media Interaction
Volume 4 - 2022 | https://doi.org/10.3389/fcomp.2022.773154
This article is part of the Research Topic Bridging the Gap between Machine Learning and Affective Computing View all 13 articles
Portraying emotion and trustworthiness is known to increase the appeal of video content. However, the causal relationship between these signals and online user engagement is not well understood. This limited understanding is partly due to a scarcity in emotionally annotated data and the varied modalities which express user engagement online. In this contribution, we utilize a large dataset of YouTube review videos which includes ca. 600 h of dimensional arousal, valence and trustworthiness annotations. We investigate features extracted from these signals against various user engagement indicators including views, like/dislike ratio, as well as the sentiment of comments. In doing so, we identify the positive and negative influences which single features have, as well as interpretable patterns in each dimension which relate to user engagement. Our results demonstrate that smaller boundary ranges and fluctuations for arousal lead to an increase in user engagement. Furthermore, the extracted time-series features reveal significant (p < 0.05) correlations for each dimension, such as, count below signal mean (arousal), number of peaks (valence), and absolute energy (trustworthiness). From this, an effective combination of features is outlined for approaches aiming to automatically predict several user engagement indicators. In a user engagement prediction paradigm we compare all features against semi-automatic (cross-task), and automatic (task-specific) feature selection methods. These selected feature sets appear to outperform the usage of all features, e.g., using all features achieves 1.55 likes per day (Lp/d) mean absolute error from valence; this improves through semi-automatic and automatic selection to 1.33 and 1.23 Lp/d, respectively (data mean 9.72 Lp/d with a std. 28.75 Lp/d).
Online video content hosted by platforms such as YouTube is now gaining more daily views than traditional television networks (Battaglio, 2016). There are more than 2 billion registered users on YouTube, and a single visitor will remain on the site for at least 10 min (Cooper, 2019). Viewers rate of retention for a single video is between 70–80%, and such retention times may be due to (cross-) social network effects (Roy et al., 2013; Yan et al., 2015; Tan and Zhang, 2019) and the overall improvement in content and connection quality in recent years (Dobrian et al., 2011; Lebreton and Yamagishi, 2020), but arguably caused by intelligent mechanisms (Cheng et al., 2013), e.g., 70% of videos watched on YouTube are recommended from the previous video (Cooper, 2019). To this end, gaining a better understanding of what aspects of a video a user engages with has numerous real-life applications (Dobrian et al., 2011). For example, videos such as misinformation, fake messages, and hate speech are strongly emotionally charged (Knuutila et al., 2020) and detection using conventional methods such as natural language processing is to date a tremendous challenge (Stappen et al., 2020b). Another application is the use by creators who adapt their content to have a greater prospect of the video becoming viral (Trzciński and Rokita, 2017) and thus improve advertising opportunities.
Positive emotion (Berger and Milkman, 2012) and trust of the individuals in videos (Nikolinakou and King, 2018) have shown to affect user (i.e., content) engagement (Shehu et al., 2016; Kujur and Singh, 2018). In traditional forms of entertainment (i.e., film) portraying emotion captivates the audiences improving their ability to remember details (Subramanian et al., 2014) and similar persuasion appeals are applied within shorter-form YouTube videos (English et al., 2011). When emotion is recognized computationally, research has shown that the emotion (arousal and valence) of a video can be an indicator of popularity, particularly prominent when observing audio features (Sagha et al., 2017).
The frequency of comments by users is also a strong indicator of how engaged or not users are with a video (Yang et al., 2016). Furthermore, understanding the sentiment of comments (i.e., positive, neutral, or negative) can offer further insights on the type of view engagement, e.g., more positive sentiment correlates to longer audience retention (Yang et al., 2016). In a similar way to the use of emotions, developing trust between the viewer (trustor) and the presenter (trustee) has also shown to improve user engagement. It is a common strategy by content creators to facilitate what is known as a parasocial relationship. A parasocial relationship develops when the viewer begins to consider the presenter as a friend without having ever met them (Chapple and Cownie, 2017).
With this in mind, we unite multiple emotional signals for an explicit engagement analysis and prediction in this current contribution. Thereby, we focus on the utilization of the emotional dimensions of arousal and valence and extend the typical Russel circumplex model for emotion, by adding trustworthiness as a continuous signal. Hereby, we follow a two-step approach: First, we aim to understand better continuous factors which improve metadata-related (i.e., views, likes, etc.) and comment-related (i.e., sentiment of comments, positive-negative ratios, likes of comments etc.) user engagement across modes (i.e., emotional signals to text-based indicators). To do this, we collect the metadata as well as more than 75 k comments from the videos. We annotate a portion of these comments to be used in combination with other data sets for training a YouTube comment sentiment predictor for the automatic assessment of the unlabeled comments. Furthermore, we utilize a richly annotated data set of ca. 600 h of continuous annotations (Stappen et al., 2021), and derive cross-task features from this initial correlation analysis. Second, we compare these engineered, lean features, to a computationally intensive feature selection approach and to all features when predicting selected engagement indicators (i.e., views, likes, number of comments, likes of the comments). We predict these indicators as a regression task, and train interpretable (linear kernel) Support Vector Regressors (SVR). The main contributions to the research community are two-fold:
1. To the best of the authors' knowledge, there has been no research which analyses YouTube video user engagement against trustability time-series features.
2. Furthermore, we are the first to predict cross-modal user popularity indicators as a regression task—purely based on emotional signal features without using typical text, audio, or images/video features as input.
This article is organized as follows; firstly, in Section 2, we provide a brief background on the core concepts which relate to emotions and user-generated content. We then introduce the data that is used within the experiments in cf. Section 3. This is followed by the experimental methodology, in Section 4, including feature extraction from signals and sentiment extraction from text, and the machine learning pipeline overall. The results are then extensively analyzed and discussed in Section 5, with a mention of study limitations in Section 6. Finally, we offer concluding remarks and future outlook in Section 7. The newly designed and extended datasets, code, and the best models will be made publicly available on in our project repository.
Within our contribution, the concept of emotions for user-generated content is extended from the conventional Russel concept of emotion dimensions, valence, and arousal (Russell, 1980), to include a continuous measure for trustworthiness. In the following, we introduce these core concepts and related studies.
There are two predominant views in the field of affective science: the first assumes that emotions are discrete constructs, each acting as an independent emotional system of the human brain, and hence, can be expressed by discrete categories (Ekman, 1992). The second assumes an underlying interconnected dimensional signal system represented by continuous affective states.
For emotion recognition using continuous audio-video signals, the circumplex model of emotion developed by Russel is the most prominent (Russell, 1980) and applied (Busso et al., 2008; Kossaifi et al., 2019; Stappen et al., 2021) approach of the latter idea. This representation of affect typically consists of continuous valence (the positiveness/ negativity of the emotion) and arousal dimensions (the strength of the activation of the emotion), as well as an optional third focus dimension (Posner et al., 2005).
In the past, both approaches to classify emotions in user-generated content (Chen et al., 2017) rely on Ekmann's model to predict six emotional classes in YouTube videos. Similarly, Zadeh et al. (2018) annotated YouTube videos with labels for subjectivity and sentiment intensity (Wöllmer et al., 2013) was the first to transfer the dimensional concept to YouTube videos. Recently, Kollias et al. (2019) annotated 300 videos (ca. 15 h) of “in-the-wild” data, predominantly YouTube videos under the creative commons license.
However, none of the mentioned datasets allows the bridging of annotated or predicted emotional signals with user engagement data from videos. We fill this research gap utilizing continuous emotional signals and corresponding data, as well as providing insights into the novel dimension of trustworthiness, entirely without relying on word-based, audio, or video feature extraction.
Although general literature lacks in providing a consistent concept of trustworthiness (Horsburgh, 1961; Moturu and Liu, 2011; Cox et al., 2016), in this work, we define trust as the ability, benevolence, and integrity of a trustee analogous to Colquitt et al. (2007). In the context of user-generated reviews, the viewers assess from their perspective if and to what extent the reviewer communicates unbiased information. In other words, how truthful and knowledgeable does the viewer feel a review is at every moment? As we mentioned, building this trust is part of developing a parasocial relationship with the audience, and in doing so, likely increases repeated viewing (Lim et al., 2020).
Sentiment Analysis studies the extraction of opinions, sentiments, and emotions (e.g., “positive,” “negative,” or “neutral”) of user-generated content. The analyzed content usually consists of text (Boiy et al., 2007; Gilbert and Hutto, 2014), such as in movie and product reviews, as well as comments (Singh et al., 2013; Siersdorfer et al., 2014). In recent years, the methods for text classification have developed rapidly. Earlier work using rule-based and classical word embedding approaches is now being replaced by what is known as transformer networks, predicting context-based word embeddings (Devlin et al., 2019). State-of-the-art accuracy results on sentiment benchmark datasets using these methods (Cui et al., 2019) range from 77.3 for the 3-classes twitter (Nakov et al., 2013) and between 72.4 and 75.0 on a 2-classes YouTube comment data sets (Uryupina et al., 2014).
In contrast to the literature, our approach utilizes the predicted sentiment of a fine-tuned Word Embedding Transformer ALBERT (Lan et al., 2020) to automatically classify comments on a large scale to investigate the cross-modal relationship to the continuous emotion and trustworthiness signals.
YouTube meta and engagement data are well researched (Yan et al., 2015) with contributions exploring across domains (Roy et al., 2013; Tan and Zhang, 2019), and focusing on both long (Biel and Gatica-Perez, 2013) and short form video sharing (Cheng et al., 2013; Garroppo et al., 2018).
Most previous work analyse view patterns, users' opinions (comments) and users' perceptions (likes/dislikes), and their mutual influence (Bhuiyan et al., 2017). Khan and Vong (2014) correlated these reaction data, while (Rangaswamy et al., 2016) connects them to the popularity of a video.
An extended comment analysis has been conducted by Severyn et al. (2016) predicting the type and popularity toward the product and video. The comment ratings, thus the community acceptance, was predicted by Siersdorfer et al. (2010) using the comment language and discrete emotions. Moreover, in Wu and Ito (2014) the authors correlated popularity measures and the sentiment of the comments. Data of other social networking platforms combine sentiment analysis and social media reactions (Ceron et al., 2014; Gilbert and Hutto, 2014), and (Preoţiuc-Pietro et al., 2016) attempted to map Facebook posts to the circumplex model to predict the sentiment of new messages.
To the best of our knowledge, no work has so far attempt to investigate the relationship to sophisticated continuous emotional and trustworthiness signals and based on these, predict user engagement as regression tasks.
The base for our experimental work is the MUSE-CAR data set1(Stappen et al., 2021). MUSE-CAR is a multi-media dataset originally crafted to improve machine understanding of multi-modal sentiment analysis in real-life media. For the first time, it was used for the MUSE 2020 Challenge, which aimed to improve emotion recognition systems, focusing on the prediction of arousal and valence emotion signals (Stappen et al., 2020c). For a detailed description of typical audio-visual feature sets and baseline systems that are not directly related to this work, we point the reader to Stappen et al. (2020a).
The dataset contains over 300 user-generated vehicle review videos, equal to almost 40 h of material that cover a broad spectrum of topics within the domain. The videos were collected from YouTube2 and have an average duration of 8 min. The reviews are primarily produced by semi—(“influencers”) or professional reviewers with an estimated age range of the mid-20 s until the late-50 s. The speech of the videos is English. We refer the reader to Stappen et al. (2021) for further in-depth explanation about the collection, the annotator training, and the context of the experiments. Utilizing the YouTube ID, we extend the data set by user engagement data. The explicit user engagement indicators are calculated on a per-day basis (p/d) as the videos were uploaded on different days resulting in views (Vp/d), likes (Lp/d), dislikes (Dp/d), comments (Cp/d), and likes of comments (LCp/d). Per video the user engagement criteria is distributed (μ mean, σ standard deviation) as; Vp/d: μ = 863.88, σ = 2048.43; Lp/d: μ = 9.73, σ = 28.75, Dp/d: μ = 0.4125, σ = 1.11; Cp/d: μ = 0.91, σ = 3.00; and LCp/d: μ = 5.28, σ = 16.84.
As with emotions in general, a certain level of disagreement due to subjectivity can be expected (Russell, 1980). For this reason, nine annotators were trained (Stappen et al., 2021) to have a common understanding of the arousal, valence, and trustworthiness concepts as discussed in Section 2.1. As well established (Busso et al., 2008; Kossaifi et al., 2019), the annotator moves the hand up and down using a Logitech Extreme 3D Pro Joystick to annotate one of three dimensions, while watching the videos. The movements are recorded over the entire duration of the video sequence and sampled with a bin size of 0.25 Hz on an axis magnitude between -1 000 and 1 000. Every annotation was checked by an auditor using quantitative and qualitative measures to ensure a high quality (Baird and Schuller, 2020). The time required for annotation alone stands for more than 600 working hours (40 h video * 3 dimensions * 5 annotators per dimension).
The annotation of five independent annotators for each video and signal type are fused to obtain a more objective gold-standard signal as depicted in Figure 1. For the fusion of the individual continuous signals, the widely established Evaluator Weighted Estimator (EWE) was computed (Schuller, 2013; Ringeval et al., 2017). It is an estimator of inter-rater agreement, hence, the personal reliability, in which the weighted mean corresponds to the calculated weights for each rater based on the cross-dependency of all other annotators. The EWE can be formulated as
where y is a discrete point of the signal n and ra is the reliability of the ath rater, consequently, A represents the whole population of raters. To use the data for later stages, we z-standardize them.
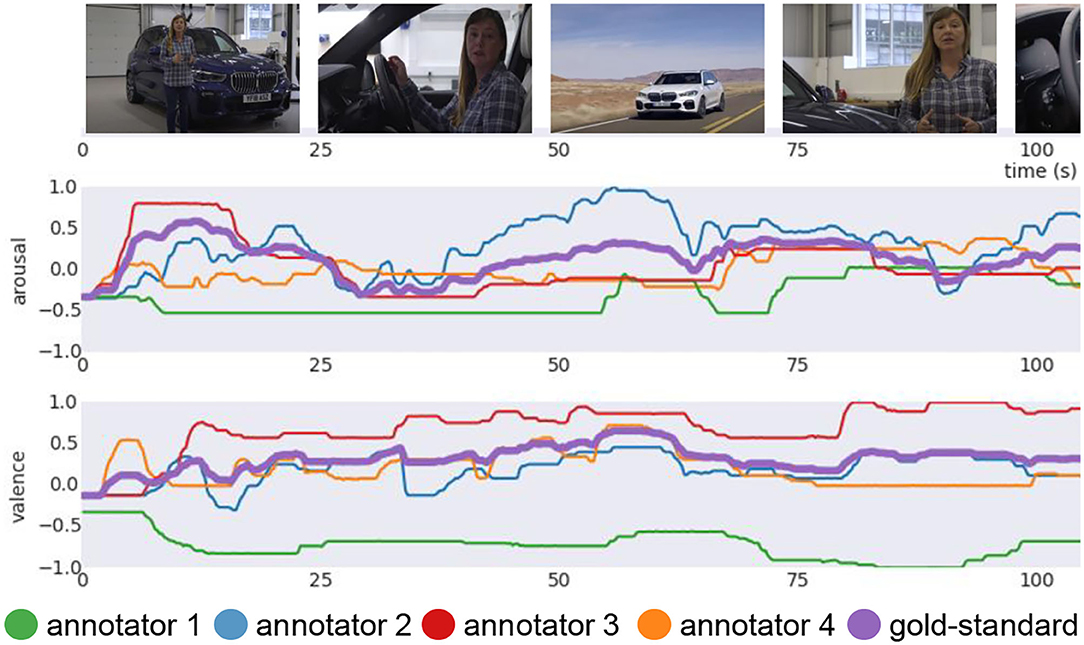
Figure 1. Example video (video ID 5): Four annotation signals for arousal and valence in addition to the fused EWE “gold-standard” signal (bold purple). The annotator 1 (green) has a negative correlation to the others on valence. The weight (r1) is set to 0, not considered for the fused gold-standard by EWE.
Based on the video IDs of the corpus, we collected more than 79 k YouTube comments and comment-related like counts excluding any other user information, such as the username. We focus exclusively on the parent comments, ignoring reaction from the child comments. The count of comment likes reflect the number of people sharing the same opinion and those who “liked” the comment. We randomly select 1 100 comments for labeling, which is used as a quantitative estimator of how accurate our prediction of the other unlabeled comments are. Three annotators labeled each of them as positive, neutral, negative, and not applicable. The average inter-rater joint probability is 0.47. We use a majority fusion to create a single ground truth, excluding texts where no majority is reached.
Figure 2 gives an overview of our approach. As a cornerstone of our analysis (cf. Section 4.1), annotation of arousal, valence, and trustworthiness are annotated by five independent annotators. These signals are then fused (cf. Section 3.2) to a gold standard label, and meaningful features are extracted (purple). In addition, YouTube user engagement-related data (yellow) and the comments are scraped (blue) from each video. Several sentiment data sets are collected and merged in order to train a robust sentiment classifier using a Transformer network ALBERT to predict unlabeled YouTube comments after fine-tuning on several datasets and our labeled comments. Then, we first investigate correlations between the predicted sentiment of the YouTube comments, the YouTube metadata, and the statistics derived from the continuous signals (arousal, valence, and trustworthiness). Additionally, we use derived features to predict user engagement (Vp/d, Lp/d, Cp/d, and CLp/d) directly.
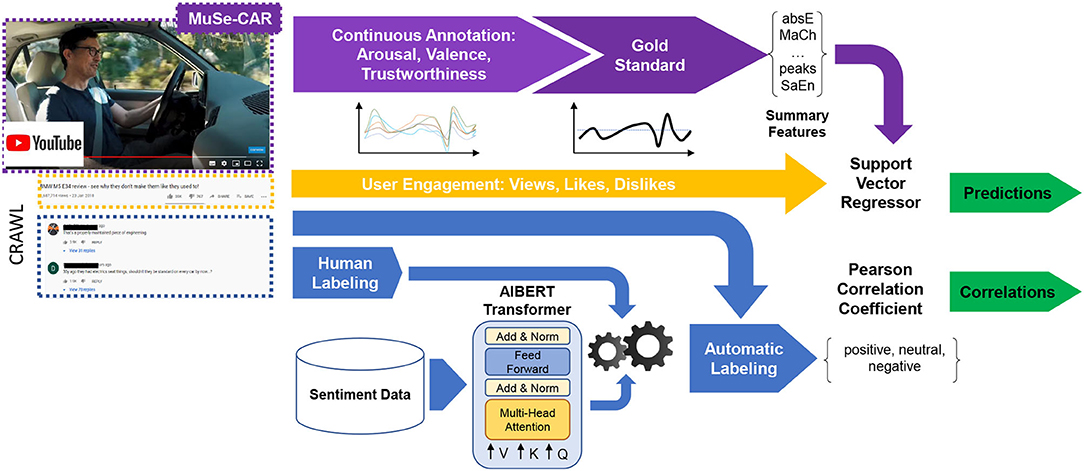
Figure 2. A comprehensive overview of the approach, as explained in Section 4. Statistics derived from continuous emotion and trustworthiness (purple), automatic sentiment labeling of YouTube comments (blue), and user engagement data (orange) are preprocessed to investigate correlations and predict engagement from features. The development of our signal feature extraction as a cornerstone of our analysis is described in detail in Section 4.1. With its help, we aim to uncover relationships to engagement data (cf. Section 4.3) and the sentiment of the comments predicted by our trained network (cf. Section 4.2). They also serve as input to our regression experiments to predict user engagement (cf. Section 4.5).
A signal is usually sampled to fine-grained, discrete points of regular intervals, which can be interpreted as a sequential set of successive data points over time (Adhikari and Agrawal, 2013). Audio, video, and psychological signals are widely used for computational analysis (Schuller, 2013; Schuller et al., 2020). Simple statistics and advanced feature extraction can be applied in order to condense these signals to meaningful summary representations and make them more workable (Christ et al., 2018). In this work, we use common statistical measures such as the standard deviation (std), and 5-, 25-, 50-, 75-, and 95%-quantiles (q5, q25, q50, q75, andq95) as they are less complex to interpret, and have been applied in related works (Sagha et al., 2017). Furthermore, to make better use of the changes over time, we manually select and calculate a wide range of time-series statistics following previous work in similar fields (Geurts, 2001; Schuller et al., 2002). For example, in computational audition (e.g., speech emotion recognition), energy-related features of the audio signals are used to predict emotions (Schuller et al., 2002).
We calculate the dynamic sample skewness (skew) of a signal using the adjusted Fisher-Pearson standardized moment coefficient, to have a descriptor for the asymmetry of the series (Ekman, 1992; Doane and Seward, 2011). Similarly, the kurtosis (kurt) measures the “flatness” of the distribution by utilizing the fourth moment (Westfall, 2014). Of the energy-related ones, the absolute energy (absE) of a signal can be determined by the sum over the squared values (Christ et al., 2018).
where x is the signal at point i. Also well known for physiological time-series signals is the sample entropy (SaEn), a variation of the approximate entropy, to measure the complexity independently of the series length (Richman and Moorman, 2000; Yentes et al., 2013). Several change-related features might be valuable to reflect the compressed signal (Christ et al., 2018): First, the sum over the absolute value of consecutive changes expresses the absolute sum of changes (ASOC):
Second, the mean absolute change (MACh) over the absolute difference between subsequent data points is defined as:
where n is the number of time-series points. Third, the general difference between consecutive points over time is called the mean change (MCh):
Fourth, the mean value of a central approximation of the second derivatives (MSDC) is defined as:
Finally, the length of the normalized consecutive sub-sequence is named strike above (LSAMe) and below (LSBMe) the mean. To summarize the distribution similarity, the normalized percentage of reoccurring datapoints (PreDa) of non-unique single points can be calculated by taking the number of data points occurring more than once divided by the number of total points. Also early or late high and low points of the signal are of descriptive value. Four single points describe these: the first and last location of the minimum and maximum (FLMi, LLMi, FLMa, and FLMa) relatively to the length of the series. The last two count a) the number of crossings of a point m (here: m=0) (CrM), where for two successive time series steps are first lower (or higher) than m followed by two higher (or lower) ones (Christ et al., 2018) and b) the peaks of the least support n. A peak of support n is described as a subsequence of a series where a value occurs, bigger than its n neighbors to the left and the right (Palshikar, 2009; Christ et al., 2018). In total, we extract 24 features from one signal (cf. Table 1).
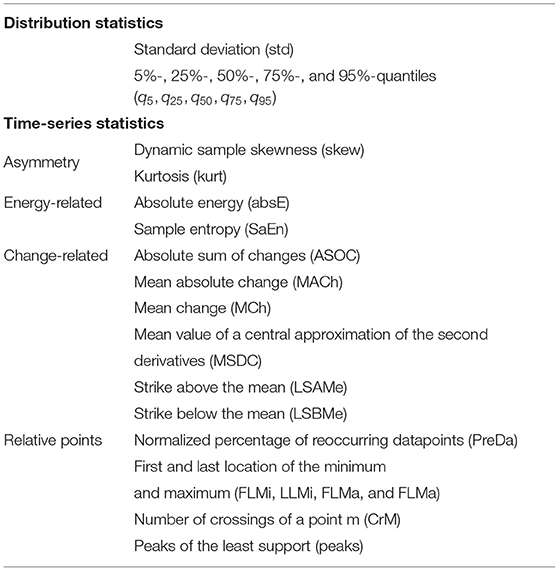
Table 1. List of simple statistics and more complex time-series statistic features extracted by our framework.
Given the vast amount of comments, we decided to carry out the labeling of the sentiment automatically and label only a small share of them by hand to quantify the prediction quality (cf. Section 3.3). For this reason, we built a robust classifier for automatic YouTube sentiment prediction using PyTorch. We opted to use ALBERT as our competitive Transformer architecture (Lan et al., 2020). Compared to other architectures, ALBERT introduces two novel parameter reduction methods: First, the embedding matrix is separated into two more compact matrices, and second, layers are grouped and used repeatedly. Furthermore, it applies a new self-supervised loss function that improves training for downstream fine-tuning tasks. These changes have several advantages, such as reducing the memory footprint, accelerating the converge of the network, and leading to state-of-the-art results in several benchmarks (Devlin et al., 2019).
Before training, we remove all words starting with a “#,” “@,” or “http” from all text sources and replace emotions' unicode by the name. We train ALBERT in a two-step procedure. First, we fine-tune the model for the down-stream task of general sentiment analysis. No extensive YouTube comment data set is available, which would span the wide range of writing styles and expressed opinions. Therefore, we aggregate several datasets which aim to classify whether a text is positive, negative, or neutral as our initial training data: all data sets from SemEval (the Semantic Evaluation challenge), a series of challenges for computer-based text classification systems with changing domains (Nakov et al., 2013) e.g., Twitter, SMS, sarcasm, from 2013 to 2017 consisting of more than 76 k data points; the popular US Airline Sentiment data set (Air, 2015) (14.5 k tweets), and finally, 35 k positive and 35 k negative text snippets are selected from Sentiment140 (Go et al., 2009). The 60 k positive, 32 k neutral, and 56 k negative text snippets are equally stratified and partitioned into 80-10-10 splits for training. We provide this selection for reproducibility in our code.
Following the authors' recommendation, ALBERT is trained using a learning rate of 1e-5, a warmup ratio of 0.06, ϵ set to 1e-8, and gradient clipping set at 1.0. In addition, we use half-precision training and a batch size of 12 to fit the GPU memory restrictions (32 GBs). Counteracting adverse effects of class imbalance, we further inject the class weight to each data point. The model converges after three epochs. Next, we use our own YouTube comment data set to validate the results and further fine-tune the model. This version is then further trained in a second fine-tuning step using the 60% of the YouTube comments and a reduced learning rate of 1e-6 for one epoch.
The relative distribution of the classified sentiment of the YouTube comments is given in Table 2. The model achieves an f1 score on the development of 81.13 and 78.09% on the test partitions, as well as 75.41% on the sample of our crawled and manually labeled YouTube test set.
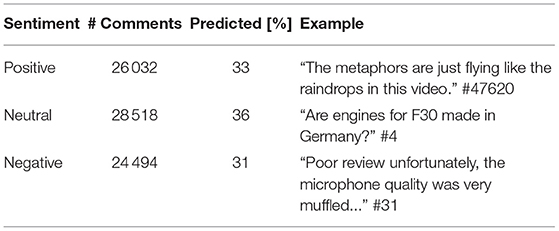
Table 2. Example comments and sentiment distribution within the YouTube comments predicted by our developed sentiment model.
The Pearson correlation (r) explores the relationship between two continuous variables (Ahlgren et al., 2003). Thereby, the relationship has to be linear, meaning that when one variable changes, the other also changes proportionally. r is defined by
where cov(x, z) is the co-variance, a measure of the joint variability, of the variables X, Z, and σx, σz – the standard deviations of both variables (Surhone et al., 2010). The resulting correlation coefficient lies between −1 and +1. If the value is positive, the two variables are positively correlated. A value of ±1 signifies a perfect positive or negative correlation. A coefficient equal to zero implies that there is no linear dependency between the variables.
For significance testing, we first compute the t-statistic, and then twice the survival function for the resulting t-value to receive a two-tailed p-value, in which the null hypothesis (two variables are uncorrelated) is rejected at levels of α = {0.01, 0.05, 0.1} (Sham and Purcell, 2014). Since, we intend to give the reader as much transparency as possible with regard to the robustness of the results obtained given the size of the data set, we report the results on three common significance levels (see Appendix). Therefore, results significant at an alpha level of 0.01 are also significant at 0.05 and 0.1.
To the best of our knowledge, we are the first extracting advanced features directly from emotional signals. Usually, not all engineered features are equally relevant. Since no previous research can guide us to a reliable selection, we propose two ways for feature selection for our task of predicting user engagement. The first is a correlation-based, cross-task semi-automatic selection that uses the correlation between the feature and the target variables. Only those features whose mean value over all prediction tasks is between −0.2 > rmean > +0.2 (minimum low positive/negative correlation) are selected.
The other concept is a regression-based, task-specific automatic selection with three steps. First, univariate linear regression (f) tests act as a scoring function and run successively to measure the individual effect of many regressors:
where ki is the feature index. The score is converted to an F-test estimate and then to a p-value. Second, the highest k number of features are selected based on the p-value. Finally, this procedure runs brute-force for all number of feature combinations, where 5 < k < kmax−1. Brute-force implies an exhaustive search, which systematically checks all possible combinations until the best one is found based on the provided estimate.
For our regression experiments, we use a Support Vector Regression (SVR) with a linear kernel as implemented by the open-source machine learning toolkit Scikit-Learn (Pedregosa et al., 2011). The linear kernel allows us to interpret the weights from our various feature selections and has, among other applications, found wide acceptance in the selection of relevant genes from micro-array data (Guyon et al., 2002). Since the coefficients are orthogonal to the hyper-plane, a feature is useful to separate the data when the hyper-plane is orthogonal to the feature axis. The absolute size of the coefficient concerning the other features indicates the importance.
The training is executed on the 60-20-20 training/development/test partition split partitions, pre-defined in the MUSE-CAR emotion recognition sub-task (Stappen et al., 2020c) (cf. Section 3.1). During the training phase, we train a series of models on the training set with different parameters C ∈ {10−7, 10−6, 10−5, 10−4, 10−3, 10−2, 10−1, 1 } up to 10 000 iterations and validate the performance on the development set. The best performing C value is then used to re-train the model on an enlarged, concatenated training and development set, to estimate the generalization performance on the hold-out test set. This method is repeated for each input signal (combination) on each target (%). Due to the various scales of the input features, we apply standardization to the data but leave the targets, as they allow interpretability of the results. The prediction results are evaluated using the Mean Absolute Error (MAE).
Figure 3 depicts the Pearson correlations for the user engagement indicators, and we see that the number of Vp/d, Lp/d, Dp/d, and Cp/d are highly correlated. The correlations are based on both, absolute values and ratios. When a correlation to one of the variables occurs, it is likely to be accompanied by correlations to others. We would like to note that all absolute values correlate positively with each other, as all metrics have a positive correlation to the absolute popularity of the video. Therefore, a stronger distribution of the video also increases the absolute number of likes, dislikes, comments, etc., albeit to different magnitudes. For example, the average relationship between likes and dislikes in our crawled videos is not as antagonistic as one might expect, which means that as the number of Lp/d increases; so too does the Dp/d. Another example are the number of likes of the comments which increases with the number of dislikes of the video since the number of comments and of dislikes are interdependent. This may relate to the topic of the dataset, being that it is review videos, and the like or dislike may be more objective than other video themes. The correlation in terms of ratios gives a more definite picture in this context.
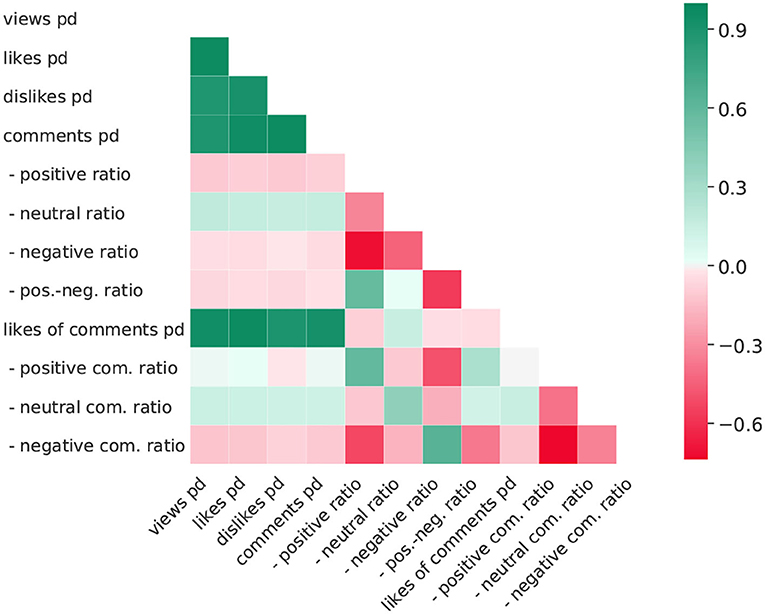
Figure 3. Pearson correlation matrix of metadata. All results are considered to be significant at a 0.01 level. Com, comment; pos, positive; neg, negative; pd, per day.
Within this section, we discuss the correlation results for each emotional dimension separately. We report Pearson correlation coefficients, as depicted in Figure 4. Detailed results (r and significance level) can be found in Figure 4.
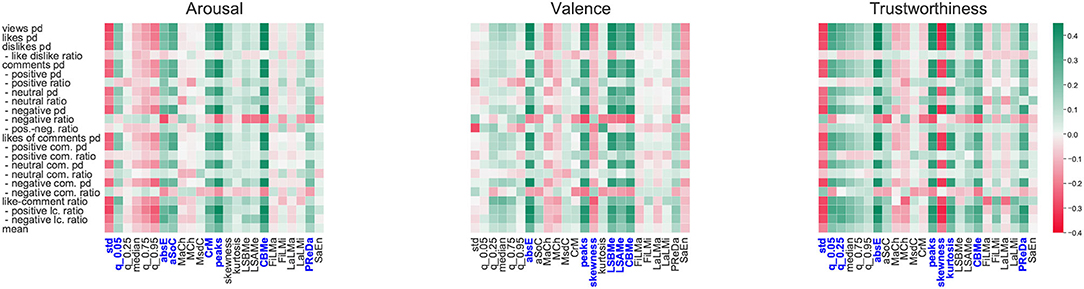
Figure 4. Pearson correlation matrix of user engagement indicators and the statistics/ features extracted from each dimension. The latter are standard deviation (std), quantile (qx), absolute energy (absE), mean absolute change (MACh), mean change (MCh), mean central approximation of the second derivatives (MSDC), crossings of a point m (CrM), peaks, skewness, kurtosis, strike above the mean (LSAMe), strike below the mean (LSBMe), count below mean (CBMe), absolute sum of changes (ASOC), first and last location of the minimum and maximum (FLMi, LLMi, FLMa, FLMa), perc. of reoccurring datapoints (PreDa), and sample entropy (SaEn). Features in blue are utilized as cross-task, semi-automatic features for user engagement prediction.
Arousal: The statistics extracted from the arousal signal indicate several correlations to the engagement data. When the standard deviation or the level of the quantile0.95 increases, the number of Vp/d, Lp/d, Cp/d, and CLp/d slightly decreases (e.g., r(views, std) = −0.293, r(views,q95) = −0.212) with direct effect on the comment-like ratio (clr), e.g., rstd = −0.271. In contrast, the level of the quantile.05 has the opposite effect on all these metrics (e.g., r(views,q0.05) = 0.231, r(clr,q0.05) = −0.248. Of the more complex time-series statistics, the peaks as well as the CBM have the strongest correlations across most indicators. These indicates a moderate positive linear relationship, for instance, to Vp/d and Lp/d r(views, peaks) = 0.440, r(likes, CBMe) = 0.456 as well as Cp/d rpeaks = 0.409. Further, when these features increase, the share of neutral comments increases much less than the share of positive and negative comments. The next strongest correlated features, CrM, aSoc, abE, and PreDa, also represent upward correlation slopes to the user-engagement criteria. Although these features reflect the general change in engagement, no conclusions can be drawn regarding sentiment of the engagement, as there is no significant correlation of any feature to the ratios (e.g., like-dislike, and positive-negative comments).
Valence: Most statistics of the signal distribution are below r = 0.2, suggesting that there are only very weak linear dependencies with the engagement indicators. The only exceptions is the positive-negative ratio for the comments (r = −0.276) – a lower standard deviation leads to an increase in the proportion of positive comments. Furthermore, higher values around the centre of the distribution (kurtosis – r = −0.313) to more likes per comment. The strongest positively correlated feature is absE e.g., rviews = 0.467, rlikes = 0.422, rdislikes = 0.355, rcomments = 0.350, followed by the peaks, CBME and LSBMe, which suggest the greater the value of these features, the greater the user engagement In contrast, the MaCh and the SaEn have significant slight negative correlations, which implies that when the valence signal of a video has a high complexity, the video has a higher tendency to receive fewer user engagement.
Trustworthiness: The higher the level of quantile0.05, quantile0.25, median, and quantile0.75 (all slightly positively correlated, with decreasing relevance e.g., r(views,q0.05) = 0.356, r(likes,q0.75) = 0.175), the higher the Vp/d, Lp/d, Dp/d, Cp/d, and CLp/d. Similar to the valence dimension, we see that there is a negative effect on these engagement indicators when the standard deviation in the trustworthiness signal is higher e.g., r(views, std) = −0.304, r(likes, std) = −0.287. As for the other features, the absE and the number of peaks have a moderate positive correlation. The skewness shows a significant negative correlation above r < −0.3 for most indicators. In other words, a negative skew of the trustworthiness signal, when the mass of the distribution is concentrated to the right (left-skewed), has a positive influence on user engagement. Regarding the positiveness/negativeness sentiment ratios (like-dislike, comments positive-negative ratio), none of the features show significant associations.
Result Discussion: When observing the results from the above sections, we see several patterns between the emotion (including trust) signal statistics and user engagement. While the standard statistics of arousal show that bounded arousal (higher lower quantiles and lower high quantiles) and higher trustworthiness scores (all quantiles are positively correlated, with lower quantiles at a higher level) leads to more user engagement, the sentiment of a video seems less influential contrary to the findings of (Sagha et al., 2017). Regarding the time-series features, the number of peaks with support n = 10 seems a stable indicator across all signals. The energy-related features of valence and trustworthiness (valence = r(views, absE) = 0.467, trustworthiness = r(views, absE) = 0.497) seem to have a medium-strong relationship and most likely a valuable predictive feature.
Regarding the comments, independently of the type of signal and statistic, the negative comments seem to be higher correlated consistently, followed by the number of likes and positive comments. Overall, mostly slight to modest correlations are found. However, significant correlations, especially to the more complex time-series features, between valence, arousal, and trustworthiness levels in a video to the user engagement (number of users who watch it, like it, dislike it, or leave a comment) is evident.
Table 3 shows the results of the prediction tasks Vp/d, Lp/d, Cp/d, and CLp/D. It is worth noting that the scores vary according to the underlying scale of the target variables (cf. Section 3).
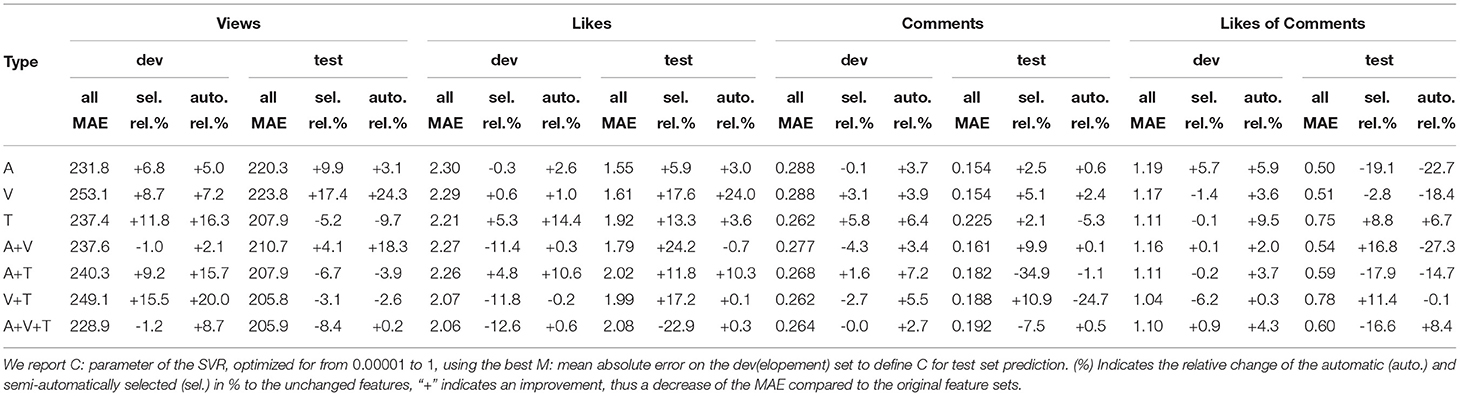
Table 3. Prediction of views, likes, comments, and likes of comments aggregated per day utilizing features extracted and crafted from Arousal (A), Valence (V), and Trustworthiness (T).
The features utilized from the cross-task semi-automatic feature selection method are highlighted (in blue) in Figure 4 for each feature type. Across the seven experiments the automatic selection process selected on average the following number of features per each criteria; 7.6 Vp/d, 23.3 Cp/d, 29.3 Lp/d, and 20.1 LCp/d. For each dimension, an average of 9.3 for arousal, 9.5 for valence, and 6.0 for trustworthiness was selected. Figure 5 illustrates an example of both selection methods for predicting CLp/d from a fusion of all three feature types. The p-values of the automatic (univariate) selection and the corresponding weights of all resulting SVMs are shown, indicating the relevance of each feature for the prediction. The interested reader is pointed to Chang and Lin (2008) for an in-depth methodical explanation. The most informative features (largest p-values) also receive most weight from the corresponding SVM, indicating that the automatic selection is sensible. In this particular case, the hand selected features have almost identical weights as the automatic ones, whereby the missing features are enough to make the results worse than in the case of the other two (cf. Table 3), indicating a high sensitivity if certain features are left out.
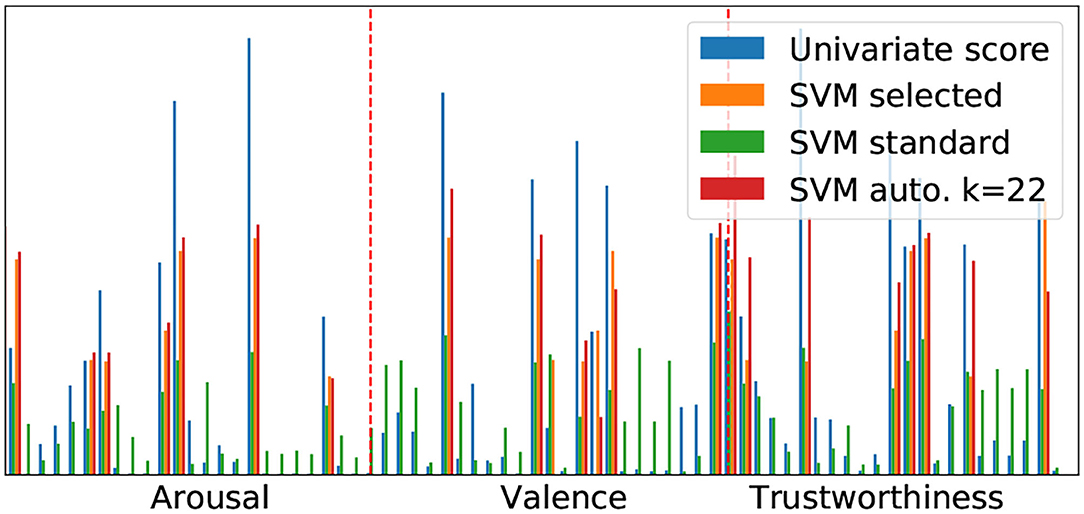
Figure 5. SVM weights of arousal, valence, and trustworthiness features predicting the likes of comments comparing the use of all features, manually selected (24), and automatically selected k = 22 features. To receive a real output and fit the p-values of the automatic selection in scale, we apply a base 10 logarithm and divide the result by 10 (−Log(pvalue)/10).
Views Per day: When observing the Vp/d prediction from all features, we obtain the best result when performing an early fusion of the valence and trustworthiness signals, and with the addition of arousal, there is a minor decrease (205.8 and 205.8 MAE respectively); this demonstrates the predictive potential of all signals. However, when applying our semi-automatic cross-task feature selection, there is a more substantial improvement particularly for arousal and valence as mono signals, obtaining 198.5, and 184.8 MAE, respectively. This improvement is increased further for valence through automatic feature selection, with our best results for Vp/d of 169.5 MAE. Feature selection appears in all cases to not be beneficial for fused features, with arousal and valence improving slightly but no more than if the signal was alone. Without any feature selection trustworthiness is our strongest signal, for further investigation exploring why trustworthiness does not improve at all with either of the feature selection methods (218.7 and 228.0, for sel. and auto., respectively) would be of interest.
Likes per day: As with Vp/d, we see that arousal and valence are strong as singular signals when utilizing all summary features; however, in this case, there is no improvement found through the fusion of multiple feature types. Further to this, the cross-task selection method appears to improve results across all types, aside from the fusion of arousal, valence, and trustworthiness. As with Vp/d, valence again obtains our best result, improved even further by the automatic selection, up to 1.23 MAE Vp/d. Although the automatic selection appears valid for valence, this was not consistent across all the feature type variations. Trustworthiness appears much weaker than all other features types in this case, although when observing scores on the development set; we see that trustworthiness is our strongest singular signal (2.21), even showing promise when fused with the other feature types and from the automatic feature selection.
Comments per day: Results obtained from Cp/d continue to show the trend of valence being a meaningful signal. Again for all features, as singular signal both arousal and valence show the best score (0.154 MAE for both). Valence improves by the auto-selection process, and performs better with the cross-task method. Fusion in this case generally does not show much benefit assigned from the combination of arousal and valence, in which our best Cp/d score is obtained from cross-task selection of 0.145 MAE. As previously, trustworthiness is again not the strongest signal on test, however, we see a similar strength on development set.
Likes of comments per day: Arousal achieves the strongest result from all features for CLp/d. Unlike the other user engagement criteria, we see a large decrease across most results from the both selection methods. The best improvement comes from the fusion of arousal and valence with the task specific selection method. However, from automatic selection, there is a large decrease. As in other criteria, trustworthiness again performs better than other signals on development, and poorly on test, although the cross-task selection does show improvement for trustworthiness on test, but the absolute value still does not beat that of the arousal and valence.
Result Discussion: When evaluating all results across each user-engagement criteria, it appears that our cross-task feature selection approach obtains the best results more consistently than either automatic selection or all features indicating that a more general selection stabilizes generalization. Through these feature selection approaches valence appears to be a more meaningful signal for most criteria, which can be expected given the positive:negative relationship that is inherent to all the criteria. Furthermore, without any selection, arousal is clearly a strong signal for prediction: with fusion of arousal and valence for Vp/d there is also an improvement. To this end, fusion in general does in no case obtain sustainable better results. With this in mind, further fusion strategies incorporating multiple modes at various stages in the network may be beneficial for further study.
Trustworthiness is consistently behind arousal and valence for all criteria. A somewhat unexpected result, although this may be caused by generalizability issues on the testing set, further shown by the strong results during development. Interestingly, as a single signal trustworthiness performs better than arousal and valence without feature selection for Vp/d. This result is promising, as it shows a tendency that trust is generally valuable for viewership, a finding which is supported by the literature in regard to building a parasocial relationship (Lim et al., 2020).
When observing the literature concerning user engagement and the potential advantage of performing this automatically—we see that one essential aspect is the ability for a content creator to develop the parasocial relationship with their viewers (Chapple and Cownie, 2017). In this regard, we see that the features from each emotional dimension (arousal, valence and trustworthiness) can predict core user engagement criteria. Most notably, as we mention previously short-term fluctuations in arousal appear to increase user engagement, and therefore it could be assumed such emotional understanding of video content will lead to higher user-engagement (i.e., an improved parasocial relationship).
Furthermore, the YouTube algorithm itself is known to bias content which has higher user engagement criterion, e.g., comments and likes per day. With this in mind, integration of the emotional features identified herein (which could be utilized for predicting forthcoming user engagement, cf. Section 6) may result in higher user engagement in other areas, e.g., views per days, resulting in better financial outcomes for the creator. The correlations between these aspects, i.e., the increase of comments per day, vs views per day should be further researched concerning these emotional dimensions.
We had expected trustworthiness to be useful for predicting user-engagement, given the aforementioned parasocial relationship theory. The results are promising for the prediction of trustworthiness. However, this does not appear to be as successful as the more conventional arousal valence emotional dimensions. The current study implements an arguably conventional method for prediction task and is limited by the data domain. Applying the trustworthiness dimension to other datasets of different domains (perhaps more popular topics, such as comedy or infotainment) where similar metadata is available may show to be more fruitful for exploring the link of trust and improved user engagement.
In this section, we would like to point out some aspects of our work that need further exploration, given the novelty of the proposed idea to use continuous emotion signals for modeling explicit user engagement.
As with MUSE-CAR, some previously collected datasets harvested YouTube as their primary source (Wöllmer et al., 2013; Zadeh et al., 2018). However, they either do not provide continuous emotion signals or the video metadata (e.g., unique video identifiers) of these datasets. Therefore, MUSE-CAR is currently the only dataset that allows studies similar to this, limits extensive exploration in other domains. We want to encourage future dataset creators using social media to provide such identifiers.
When choosing the prediction method, we had to make the difficult choice between interpretability and accuracy. For this study, we opted to use SVMs because we believe that initially, conceivable interactions matter more than a highly optimized outcome. This way, we can reason about relationships between influencing variables and the output predictions and compare them to ones, extracted from potential other datasets in the future. We are fully aware that state-of-the-art black-box methods, e.g., deep learning, may achieve better results but lack in clarity around inner workings and may rely on spurious and non-causal correlations that are less generalisable. However, this does not mean there are no other high non-linearity interactions between inputs, which we want to explore in future work.
Another point for future exploration is the emotional spectrum. Although MUSE-CAR provides arousal and valence, which are the most consistently used dimensions in previous research, also other third focus dimensions, for example, dominance (Grimm et al., 2008) and likeability (Kossaifi et al., 2019) have previously been annotated. Another interesting aspect might be categorical ratings which summarize an entire video. However, we expect much lower predictive value because of the highly compressed representation of such categories summarizing the emotional content (one value instead of several dynamically extracted features based on a video-length signal).
So far, no link existed between the use of emotional signals and user engagement. That is why, the aim of our paper was to provide a proof of concept that it is valuable to leverage such signals. However, utilizing human annotations can only be the first step since they are very limited in scalability. The annotations are usually the prediction target for developing robust emotion recognition models. Our final process is intended to be twofold: (i) using audio-visual features to learn to predict the human emotional signals (ii) using the predicted emotional signals on unseen, unlabeled videos to extract our feature set and predict user-engagement. (i) is very well researched in the field achieving CCCs of more than 0.7 (high correlation between predicted and human emotional annotations) on similar data sets (Huang et al., 2020). Recent advances aim at understanding contextual factors affecting multi-modal emotion recognition, such as the gender of the speaker and the duration of the emotional episode (Bhattacharya et al., 2021) and the use of non-intrusive on-body electromyography (EMG) sensors as additional input signals (Tamulis et al., 2021). For a broad overview of various (mutlimodal) emotion recognition research, we refer the interested reader to the surveys by Soleymani et al. (2017) and Tian et al. (2022). By using human annotations, we aimed to demonstrate the relationship in a vanilla way (using the targets) to avoid wrong conclusions based on any introduced prediction error bias. We also plan to explore (ii) in-depth in the near future. Another exciting research direction is to incorporate the uncertainty of multi-modal emotion recognition systems (Han et al., 2017), hence, how sure is the system in its prediction based on the availability of (or missing) audio, video, and text data, into the prediction of popularity. Thus, in parallel to the emotion, a measure of uncertainty could be given, which is then factored in the popularity prediction.
Through a bridge of emotion recognition and user engagement, we see novel applications. The link between emotional and user engagement provides information about what and when (e.g., a part of a video with many arousal peaks) exactly causes a user to feel e.g., aversion, interest or frustration (Picard, 1999). Two parties may particularly benefit from these findings: (a) Social media network providers: the relationships discovered are directly related to the user retention (e.g., user churn rate) (Lebreton and Yamagishi, 2020) and activity (e.g., recommender systems) (Zhou et al., 2016). These are the most common and important tasks of these platforms and are still extremely difficult to model to this day (Lin et al., 2018; Yang et al., 2018; Liu et al., 2019). Maybe more importantly, critical, emotionally charged videos (e.g., misinformation, fake messages, hate speech) can be recognized and recommendation systems adapted accordingly. (b) Content creators (marketing, advertising): companies act as (video) creators to interact with customers. In our work, we focused to show a connection between generalizable emotional characteristics and user engagement. However, we believe that there are various weaker/stronger influenced subgroups. A company can identify and target such groups or even explicitly fine-tune their content.
For the first time, we have empirically (and on a large-scale) presented in this contribution that there are both, intuitive and complex relationships between user engagement indicators and continuously annotated emotion, as well as trustworthiness signals in user-generated data. Of prominence, our contribution finds that emotion increases engagement when arousal is consistently bounded. In other words, the more consistent the portrayed arousal throughout a video, the better the engagement with it. This finding contradicted previous emotion literature (Sagha et al., 2017). Arousal shows consistently more robust prediction results, although valence innately (given the link of positive and negative) appears to be more valuable for prediction of video likes.
Further to this, we introduce trustworthiness as a continuous “emotion” dimension for engagement, and find when utilizing this for prediction, there is an overall value for monitoring user-engagement in social-media content. However, when fusing the signals, their appears to be little benefit from the current recognition paradigm. Furthermore, we assume that too strict feature selection causes generalization issues since often promising results on the development set seem non-transferable to the test set.
From the strong correlation of the results for trustworthiness, we consider that the addition of this dimension is of use for user engagement; however, further investigation in other domains would be valuable. When applying these metrics in a cross-modal sentiment paradigm, there may also be benefits for the prediction of audio-visual hate speech likelihood, as well as fake news.
The datasets presented in this study can be found in online repositories. The names of the repository/repositories and accession number(s) can be found at: https://doi.org/10.5281/zenodo.4651164.
LS: literature analysis, data acquisition, data preparation, experimental design, computational analysis, and manuscript drafting and preparation. ABa: data acquisition, experimental design, and manuscript drafting and preparation. ML and ABä: data acquisition, data preparation, and computational analysis. BS: technical guidance and manuscript editing. All authors revised, developed, read, and approved the final manuscript.
BS was employed by audEERING GmbH.
The remaining authors declare that the research was conducted in the absence of any commercial or financial relationships that could be construed as a potential conflict of interest.
All claims expressed in this article are solely those of the authors and do not necessarily represent those of their affiliated organizations, or those of the publisher, the editors and the reviewers. Any product that may be evaluated in this article, or claim that may be made by its manufacturer, is not guaranteed or endorsed by the publisher.
The Supplementary Material for this article can be found online at: https://www.frontiersin.org/articles/10.3389/fcomp.2022.773154/full#supplementary-material
1. ^The raw videos and YouTube IDs are available for download: https://zenodo.org/record/4651164.
2. ^All owners of the data collected for use within the MUSE-CAR data set were contacted in advance for the consent of use for research purposes.
(2015). Twitter Us Airline Sentiment. Available online at: https://www.kaggle.com/crowdflower/twitter-airline-sentiment
Adhikari, R., and Agrawal, R. K. (2013). An Introductory Study on Time Series Modeling and Forecasting. LAP LAMBERT Academic Publishing.
Ahlgren, P., Jarneving, B., and Rousseau, R. (2003). Requirements for a cocitation similarity measure, with special reference to pearson's correlation coefficient. J. Am. Soc. Inf. Sci. Technol. 54, 550–560. doi: 10.1002/asi.10242
Baird, A., and Schuller, B. (2020). Considerations for a more ethical approach to data in ai: on data representation and infrastructure. Front. Big Data 3, 25. doi: 10.3389/fdata.2020.00025
Battaglio, S. (2016). Youtube Now Bigger Than TV Among Advertisers' Target Audience. Available online at: https://www.latimes.com/entertainment/envelope/cotown/la-et-ct-you-tube-ad-spending-20160506-snap-story.html (October 15, 2020).
Berger, J., and Milkman, K. L. (2012). What makes online content viral? J. Market. Res. 49, 192–205. doi: 10.1509/jmr.10.0353
Bhattacharya, P., Gupta, R. K., and Yang, Y. (2021). Exploring the contextual factors affecting multimodal emotion recognition in videos. IEEE Trans. Affect. Comput..
Bhuiyan, H., Ara, J., Bardhan, R., and Islam, M. R. (2017). “Retrieving youtube video by sentiment analysis on user comment,” in 2017 IEEE International Conference on Signal and Image Processing Applications (Kuching: IEEE), 474–478.
Biel, J., and Gatica-Perez, D. (2013). The youtube lens: Crowdsourced personality impressions and audiovisual analysis of vlogs. IEEE Trans. Multimedia 15, 41–55. doi: 10.1109/TMM.2012.2225032
Boiy, E., Hens, P., Deschacht, K., and Moens, M.-F. (2007). “Automatic sentiment analysis in on-line text,” in Proceedings of the 11th International Conference on Electronic Publishing (Vienna), 349–360.
Busso, C., Bulut, M., Lee, C.-C., Kazemzadeh, A., Mower, E., Kim, S., et al. (2008). Iemocap: interactive emotional dyadic motion capture database. Lang. Resour. Eval. 42, 335. doi: 10.1007/s10579-008-9076-6
Ceron, A., Curini, L., Iacus, S. M., and Porro, G. (2014). Every tweet counts? how sentiment analysis of social media can improve our knowledge of citizens' political preferences with an application to italy and france. New Media Soc. 16, 340–358.
Chang, Y.-W., and Lin, C.-J. (2008). “Feature ranking using linear svm,” in Causation and Prediction Challenge (PMLR), 53–64.
Chapple, C., and Cownie, F. (2017). An investigation into viewers' trust in and response towards disclosed paid-for-endorsements by youtube lifestyle vloggers. J. Promotional Commun. 5, 19–28.
Chen, Y.-L., Chang, C.-L., and Yeh, C.-S. (2017). Emotion classification of youtube videos. Decis. Support Syst. 101, 40–50. doi: 10.1016/j.dss.2017.05.014
Cheng, X., Liu, J., and Dale, C. (2013). Understanding the characteristics of internet short video sharing: a youtube-based measurement study. IEEE Trans. Multimedia 15, 1184–1194. doi: 10.1109/TMM.2013.2265531
Christ, M., Braun, N., Neuffer, J., and Kempa-Liehr, A. W. (2018). Time series feature extraction on basis of scalable hypothesis tests (tsfresh–a python package). Neurocomputing 307, 72–77. doi: 10.1016/j.neucom.2018.03.067
Colquitt, J. A., Scott, B. A., and LePine, J. A. (2007). Trust, trustworthiness, and trust propensity: a meta-analytic test of their unique relationships with risk taking and job performance. J. Appl. Psychol. 92, 909. doi: 10.1037/0021-9010.92.4.909
Cox, J. C., Kerschbamer, R., and Neururer, D. (2016). What is trustworthiness and what drives it? Games Econ. Behav. 98, 197–218. doi: 10.1016/j.geb.2016.05.008
Cui, B., Li, Y., Chen, M., and Zhang, Z. (2019). “Fine-tune BERT with sparse self-attention mechanism,” in Proceedings of the 2019 Conference on Empirical Methods in Natural Language Processing and the 9th International Joint Conference on Natural Language Processing (Hong Kong: ACL), 3548–3553.
Devlin, J., Chang, M.-W., Lee, K., and Toutanova, K. (2019). “BERT: pre-training of deep bidirectional transformers for language understanding,” in Proceedings of the 2019 Conference of the North American Chapter of the Association for Computational Linguistics (ACL), 4171–4186.
Doane, D. P., and Seward, L. E. (2011). Measuring skewness: a forgotten statistic? J. Stat. Educ. 19, 1–18 doi: 10.1080/10691898.2011.11889611
Dobrian, F., Sekar, V., Awan, A., Stoica, I., Joseph, D., Ganjam, A., et al. (2011). Understanding the impact of video quality on user engagement. ACM SIGCOMM Comput. Commun. Rev. 41, 362–373. doi: 10.1145/2043164.2018478
English, K., Sweetser, K. D., and Ancu, M. (2011). Youtube-ification of political talk: an examination of persuasion appeals in viral video. Am. Behav. Sci. 55, 733–748. doi: 10.1177/0002764211398090
Garroppo, R. G., Ahmed, M., Niccolini, S., and Dusi, M. (2018). A vocabulary for growth: topic modeling of content popularity evolution. IEEE Trans. Multimedia 20, 2683–2692. doi: 10.1109/TMM.2018.2811625
Geurts, P. (2001). “Pattern extraction for time series classification,” in European Conference on Principles of Data Mining and Knowledge Discovery (Freiburg im Breisgau: Springer), 115–127.
Gilbert, C., and Hutto, E. (2014). “Vader: a parsimonious rule-based model for sentiment analysis of social media text,” in Eighth International Conference on Weblogs and Social Media, vol. 81 (Ann Arbor, MI), 82.
Go, A., Bhayani, R., and Huang, L. (2009). Twitter sentiment classification using distant supervision. CS224N Project Rep. Stanford 1, 2009.
Grimm, M., Kroschel, K., and Narayanan, S. (2008). “The vera am mittag german audio-visual emotional speech database,” in 2008 IEEE International Conference on Multimedia & Expo (ICME) (Hannover: IEEE), 865–868.
Guyon, I., Weston, J., Barnhill, S., and Vapnik, V. (2002). Gene selection for cancer classification using support vector machines. J. Mach. Learn. 46, 389–422. doi: 10.1023/A:1012487302797
Han, J., Zhang, Z., Schmitt, M., Pantic, M., and Schuller, B. (2017). “From hard to soft: Towards more human-like emotion recognition by modelling the perception uncertainty,” in Proceedings of the 25th ACM International Conference on Multimedia (New York, NY), 890–897.
Huang, J., Tao, J., Liu, B., Lian, Z., and Niu, M. (2020). “Multimodal transformer fusion for continuous emotion recognition,” in IEEE International Conference on Acoustics, Speech and Signal Processing (ICASSP) (Barcelona: IEEE), 3507–3511.
Khan, G. F., and Vong, S. (2014). Virality over youtube: an empirical analysis. Internet Res. 24, 19. doi: 10.1108/INTR-05-2013-0085
Knuutila, A., Herasimenka, A., Au, H., Bright, J., and Howard, P. N. (2020). Covid-related misinformation on youtube. Oxford Memos: The Spread of Misinformation Videos on Social Media and the Effectiveness of Platform Policies. (Oxford).
Kollias, D., Tzirakis, P., Nicolaou, M. A., Papaioannou, A., Zhao, G., Schuller, B., et al. (2019). Deep affect prediction in-the-wild: aff-wild database and challenge, deep architectures, and beyond. Int. J. Comput. Vis. 127, 1–23. doi: 10.1007/s11263-019-01158-4
Kossaifi, J., Walecki, R., Panagakis, Y., Shen, J., Schmitt, M., Ringeval, F., Han, J., Pandit, V., Toisoul, A., Schuller, B. W., et al. (2019). Sewa db: a rich database for audio-visual emotion and sentiment research in the wild. IEEE Trans. Pattern Anal. Mach. Intell. 43, 1022–1040. doi: 10.1109/TPAMI.2019.2944808
Kujur, F., and Singh, S. (2018). Emotions as predictor for consumer engagement in youtube advertisement. J. Adv. Manag. Res. 15, 184–197. doi: 10.1108/JAMR-05-2017-0065
Lan, Z., Chen, M., Goodman, S., Gimpel, K., Sharma, P., and Soricut, R. (2020). “Albert: a lite bert for self-supervised learning of language representations,” in 2020 International Conference on Learning Representations (Addis Ababa).
Lebreton, P., and Yamagishi, K. (2020). Predicting user quitting ratio in adaptive bitrate video streaming. IEEE Trans. Multimedia 23, 4526–4540. doi: 10.1109/TMM.2020.3044452
Lim, J. S., Choe, M.-J., Zhang, J., and Noh, G.-Y. (2020). The role of wishful identification, emotional engagement, and parasocial relationships in repeated viewing of live-streaming games: a social cognitive theory perspective. Comput. Hum. Behav. 108, 106327. doi: 10.1016/j.chb.2020.106327
Lin, Z., Althoff, T., and Leskovec, J. (2018). “I'll be back: on the multiple lives of users of a mobile activity tracking application,” in Proceedings of the 2018 World Wide Web Conference (WWW) (Geneva), 1501–1511.
Liu, Y., Shi, X., Pierce, L., and Ren, X. (2019). “Characterizing and forecasting user engagement with in-app action graph: a case study of snapchat,” in Proceedings of the 25th ACM SIGKDD International Conference on Knowledge Discovery & Data Mining (KDD) (Anchorage, AK), 2023–2031.
Moturu, S. T., and Liu, H. (2011). Quantifying the trustworthiness of social media content. Distrib. Parallel Databases 29, 239–260. doi: 10.1007/s10619-010-7077-0
Nakov, P., Rosenthal, S., Kozareva, Z., Stoyanov, V., Ritter, A., and Wilson, T. (2013). “SemEval-2013 task 2: sentiment analysis in Twitter,” in Second Joint Conference on Lexical and Computational Semantics, Proceedings of the Seventh International Workshop on Semantic Evaluation (Atlanta, GA, ACL), 312–320.
Nikolinakou, A., and King, K. W. (2018). Viral video ads: emotional triggers and social media virality. Psychol. Market. 35, 715–726. doi: 10.1002/mar.21129
Palshikar, G. (2009). “Simple algorithms for peak detection in time-series,” in Proceedings of the 1st International Conference on Advanced Data Analysis, Business Analytics and Intelligence. (Ahmedabad), vol. 122.
Pedregosa, F., Varoquaux, G., Gramfort, A., Michel, V., Thirion, B., Grisel, O., et al. (2011). Scikit-learn: machine learning in python. J. Mach. Learn. Res. 12, 2825–2830.
Picard, R. W. (1999). “Affective computing for hci,” in Human Computer Interaction (Citeseer), 829–833.
Posner, J., Russell, J. A., and Peterson, B. S. (2005). The circumplex model of affect: an integrative approach to affective neuroscience, cognitive development, and psychopathology. Develop. Psychopathol. 17, 715. doi: 10.1017/S0954579405050340
Preoţiuc-Pietro, D., Schwartz, H. A., Park, G., Eichstaedt, J., Kern, M., Ungar, L., et al. (2016). “Modelling valence and arousal in facebook posts,” in Proceedings of the 7th Workshop on Computational Approaches to Subjectivity, Sentiment and Social Media Analysis co-located to Association for Computer Lingustics (San Diego, CA: ACM), 9–15.
Rangaswamy, S., Ghosh, S., Jha, S., and Ramalingam, S. (2016). “Metadata extraction and classification of youtube videos using sentiment analysis,” in 2016 IEEE International Carnahan Conference on Security Technology (Orlando, FL: IEEE), 1–2.
Richman, J. S., and Moorman, J. R. (2000). Physiological time-series analysis using approximate entropy and sample entropy. Am. J. Physiol. Heart Circul. Physiol. 278, 2039–2049. doi: 10.1152/ajpheart.2000.278.6.H2039
Ringeval, F., Schuller, B., Valstar, M., Gratch, J., Cowie, R., Scherer, S., et al. (2017). “Avec 2017: real-life depression, and affect recognition workshop and challenge,” in Proceedings of the 7th Annual Workshop on Audio/Visual Emotion Challenge (Mountain View, CA), 3–9.
Roy, S. D., Mei, T., Zeng, W., and Li, S. (2013). Towards cross-domain learning for social video popularity prediction. IEEE Trans. Multimedia 15, 1255–1267. doi: 10.1109/TMM.2013.2265079
Sagha, H., Schmitt, M., Povolny, F., Giefer, A., and Schuller, B. (2017). “Predicting the popularity of a talk-show based on its emotional speech content before publication,” in Proceedings 3rd International Workshop on Affective Social Multimedia Computing, Conference of the International Speech Communication Association (INTERSPEECH) Satellite Workshop (Stockholm, ISCA).
Schuller, B., Lang, M., and Rigoll, G. (2002). “Automatic emotion recognition by the speech signal,” in Proccedings of SCI 2002, 6th World Multiconference on Systemics, Cybernetics and Informatics. (Orlando).
Schuller, B. W., Batliner, A., Bergler, C., Messner, E.-M., Hamilton, A., Amiriparian, S., et al. (2020). “The interspeech 2020 computational paralinguistics challenge: elderly emotion, breathing & masks,” in Proceedings Conference of the International Speech Communication Association (INTERSPEECH) (Shanghai).
Severyn, A., Moschitti, A., Uryupina, O., Plank, B., and Filippova, K. (2016). Multi-lingual opinion mining on youtube. Inf. Process. Manag. 52, 46–60. doi: 10.1016/j.ipm.2015.03.002
Sham, P. C., and Purcell, S. M. (2014). Statistical power and significance testing in large-scale genetic studies. Nat. Rev. Genet. 15, 335–346. doi: 10.1038/nrg3706
Shehu, E., Bijmolt, T. H., and Clement, M. (2016). Effects of likeability dynamics on consumers' intention to share online video advertisements. J. Interact. Market. 35, 27–43. doi: 10.1016/j.intmar.2016.01.001
Siersdorfer, S., Chelaru, S., Nejdl, W., and San Pedro, J. (2010). “How useful are your comments? analyzing and predicting youtube comments and comment ratings,” in Proceedings of the 19th International Conference on World Wide Web (WWW) (Raleigh, NC), 891–900.
Siersdorfer, S., Chelaru, S., Pedro, J. S., Altingovde, I. S., and Nejdl, W. (2014). Analyzing and mining comments and comment ratings on the social web. ACM Trans. Web 8, 1–39. doi: 10.1145/2628441
Singh, V. K., Piryani, R., Uddin, A., and Waila, P. (2013). “Sentiment analysis of movie reviews: a new feature-based heuristic for aspect-level sentiment classification,” in 2013 International Mutli-Conference on Automation, Computing, Communication, Control and Compressed Sensing (Kottayam: IEEE), 712–717.
Soleymani, M., Garcia, D., Jou, B., Schuller, B., Chang, S.-F., and Pantic, M. (2017). A survey of multimodal sentiment analysis. Image Vis. Comput. 65, 3–14. doi: 10.1016/j.imavis.2017.08.003
Stappen, L., Baird, A., Rizos, G., Tzirakis, P., Du, X., Hafner, F., et al. (2020a). “Muse 2020 challenge and workshop: Multimodal sentiment analysis, emotion-target engagement and trustworthiness detection in real-life media,” in 1st International Multimodal Sentiment Analysis in Real-life Media Challenge and Workshop, co-located to ACM International Conference on Multimedia. (Seattle, WA: ACM).
Stappen, L., Baird, A., Schumann, L., and Schuller, B. (2021). The multimodal sentiment analysis in car reviews (muse-car) dataset: collection, insights and improvements. arXiv preprint arXiv:2101.06053.
Stappen, L., Brunn, F., and Schuller, B. (2020b). Cross-lingual zero-and few-shot hate speech detection utilizing frozen transformer language models and axel. arXiv preprint arXiv:2004.13850.
Stappen, L., Schuller, B. W., Lefter, I., Cambria, E., and Kompatsiaris, I. (2020c). “Summary of muse 2020: Multimodal sentiment analysis, emotion-target engagement and trustworthiness detection in real-life media,” in 28th ACM International Conference on Multimedia. (Seattle, WA: ACM).
Subramanian, R., Shankar, D., Sebe, N., and Melcher, D. (2014). Emotion modulates eye movement patterns and subsequent memory for the gist and details of movie scenes. J. Vis. 14, 31–31. doi: 10.1167/14.3.31
Surhone, L., Timpledon, M., and Marseken, S. (2010). Spearman's Rank Correlation Coefficient: Statistics, Non-Parametric Statistics, Raw Score, Null Hypothesis, Fisher Transformation, Statistical Hypothesis Testing, Confidence Interval, Correspondence Analysis. Betascript Publishing.
Tamulis, Ž., Vasiljevas, M., Damaševicius, R., Maskeliunas, R., and Misra, S. (2021). “Affective computing for ehealth using low-cost remote internet of things-based emg platform,” in Intelligent Internet of Things for Healthcare and Industry, vol. 67. (Springer).
Tan, Z., and Zhang, Y. (2019). Predicting the top-n popular videos via a cross-domain hybrid model. IEEE Trans. Multimedia 21, 147–156. doi: 10.1109/TMM.2018.2845688
Tian, L., Oviatt, S., Muszynski, M., Chamberlain, B., Healey, J., and Sano, A. (2022). Applied Affective Computing. (Morgan & Claypool).
Trzciński, T., and Rokita, P. (2017). Predicting popularity of online videos using support vector regression. IEEE Trans. Multimedia 19, 2561–2570. doi: 10.1109/TMM.2017.2695439
Uryupina, O., Plank, B., Severyn, A., Rotondi, A., and Moschitti, A. (2014). “SenTube: a corpus for1 sentiment analysis on YouTube social media,” in Proceedings of the Ninth International Conference on Language Resources and Evaluation (Reykjavik, ELRA), 4244–4249.
Westfall, P. H. (2014). Kurtosis as peakedness. Am. Stat. 68, 191–195. doi: 10.1080/00031305.2014.917055
Wöllmer, M., Weninger, F., Knaup, T., Schuller, B., Sun, C., Sagae, K., et al. (2013). Youtube movie reviews: sentiment analysis in an audio-visual context. IEEE Intell. Syst. 28, 46–53. doi: 10.1109/MIS.2013.34
Wu, Z., and Ito, E. (2014). “Correlation analysis between user's emotional comments and popularity measures,” in 2014 3rd International Conference on Advanced Applied Informatics (Kokura: IEEE), 280–283.
Yan, M., Sang, J., Xu, C., and Hossain, M. S. (2015). Youtube video promotion by cross-network association:@ britney to advertise gangnam style. IEEE Trans. Multimedia 17, 1248–1261. doi: 10.1109/TMM.2015.2446949
Yang, C., Shi, X., Jie, L., and Han, J. (2018). “I know you'll be back: Interpretable new user clustering and churn prediction on a mobile social application,” in Proceedings of the 24th ACM SIGKDD International Conference on Knowledge Discovery & Data Mining (KDD) (London), 914–922.
Yang, R., Singh, S., Cao, P., Chi, E., and Fu, B. (2016). “Video watch time and comment sentiment: experiences from youtube,” in 2016 Fourth IEEE Workshop on Hot Topics in Web Systems and Technologies (HotWeb) (Washington, DC: IEEE), 26–28.
Yentes, J. M., Hunt, N., Schmid, K. K., Kaipust, J. P., McGrath, D., and Stergiou, N. (2013). The appropriate use of approximate entropy and sample entropy with short data sets. Ann. Biomed. Eng. 41, 349–365. doi: 10.1007/s10439-012-0668-3
Zadeh, A., Liang, P. P., Poria, S., Cambria, E., and Morency, L.-P. (2018). “Multimodal language analysis in the wild: Cmu-mosei dataset and interpretable dynamic fusion graph,” in Proceedings of the 56th Annual Meeting of the Association for Computational Linguistics (Melbourne, VIC), 2236–2246.
Keywords: user engagement, explainable machine learning, popularity of videos, affective computing, YouTube, continuous emotion annotation
Citation: Stappen L, Baird A, Lienhart M, Bätz A and Schuller B (2022) An Estimation of Online Video User Engagement From Features of Time- and Value-Continuous, Dimensional Emotions. Front. Comput. Sci. 4:773154. doi: 10.3389/fcomp.2022.773154
Received: 09 September 2021; Accepted: 24 February 2022;
Published: 23 March 2022.
Edited by:
Zhen Cui, Nanjing University of Science and Technology, ChinaReviewed by:
Robertas Damasevicius, Silesian University of Technology, PolandCopyright © 2022 Stappen, Baird, Lienhart, Bätz and Schuller. This is an open-access article distributed under the terms of the Creative Commons Attribution License (CC BY). The use, distribution or reproduction in other forums is permitted, provided the original author(s) and the copyright owner(s) are credited and that the original publication in this journal is cited, in accordance with accepted academic practice. No use, distribution or reproduction is permitted which does not comply with these terms.
*Correspondence: Lukas Stappen, c3RhcHBlbkBpZWVlLm9yZw==
Disclaimer: All claims expressed in this article are solely those of the authors and do not necessarily represent those of their affiliated organizations, or those of the publisher, the editors and the reviewers. Any product that may be evaluated in this article or claim that may be made by its manufacturer is not guaranteed or endorsed by the publisher.
Research integrity at Frontiers
Learn more about the work of our research integrity team to safeguard the quality of each article we publish.