
95% of researchers rate our articles as excellent or good
Learn more about the work of our research integrity team to safeguard the quality of each article we publish.
Find out more
ORIGINAL RESEARCH article
Front. Comput. Sci. , 14 January 2022
Sec. Mobile and Ubiquitous Computing
Volume 3 - 2021 | https://doi.org/10.3389/fcomp.2021.775282
This article is part of the Research Topic Recognizing the State of Emotion, Cognition and Action from Physiological and Behavioural Signals View all 11 articles
 Quentin Meteier1*
 Emmanuel De Salis2
 Marine Capallera1
 Marino Widmer3
 Leonardo Angelini1
 Omar Abou Khaled1
 Andreas Sonderegger4
 Elena Mugellini1
In future conditionally automated driving, drivers may be asked to take over control of the car while it is driving autonomously. Performing a non-driving-related task could degrade their takeover performance, which could be detected by continuous assessment of drivers' mental load. In this regard, three physiological signals from 80 subjects were collected during 1 h of conditionally automated driving in a simulator. Participants were asked to perform a non-driving cognitive task (N-back) for 90 s, 15 times during driving. The modality and difficulty of the task were experimentally manipulated. The experiment yielded a dataset of drivers' physiological indicators during the task sequences, which was used to predict drivers' workload. This was done by classifying task difficulty (three classes) and regressing participants' reported level of subjective workload after each task (on a 0–20 scale). Classification of task modality was also studied. For each task, the effect of sensor fusion and task performance were studied. The implemented pipeline consisted of a repeated cross validation approach with grid search applied to three machine learning algorithms. The results showed that three different levels of mental load could be classified with a f1-score of 0.713 using the skin conductance and respiration signals as inputs of a random forest classifier. The best regression model predicted the subjective level of workload with a mean absolute error of 3.195 using the three signals. The accuracy of the model increased with participants' task performance. However, classification of task modality (visual or auditory) was not successful. Some physiological indicators such as estimates of respiratory sinus arrhythmia, respiratory amplitude, and temporal indices of heart rate variability were found to be relevant measures of mental workload. Their use should be preferred for ongoing assessment of driver workload in automated driving.
A recent study of critical reasons for traffic crashes found that the driver was at fault in 94% of the cases (Singh, 2015). It includes recognition errors (including driver inattention and distractions), decision errors (driving too fast, misjudging the gap), performance errors, and non-performance errors (such as sleeping). To address this issue, car manufacturers are automating several functions of the driving task to assist the driver. In 2021, the last cars sold on the market are defined as partially automated vehicles and classified as Level 2 in the Society of Automotive Engineers (SAE) taxonomy (Society of Automotive Engineers, 2018). These vehicles automate certain functions such as maintaining speed, keeping distance from the car in front, or keeping the vehicle in the lane laterally. However, automotive manufacturers are already preparing for the next step by developing conditionally automated cars (Level 3), but also highly and fully automated cars (Levels 4 and 5) (Society of Automotive Engineers, 2018). At higher levels of automation, the car will be responsible for performing the dynamic driving task and monitoring the driving environment. It frees drivers from the primary task of driving and allows them to engage in a non-driving related task (NDRT). However, performing a NDRT may distract them and increase their mental workload (MWL; Mehler et al., 2009). Previous research has shown that an underloaded or overloaded state impacts the performance of a user interacting with automation (Wickens et al., 2014). The increase in automation in cars should therefore prompt solutions to intelligently and non-intrusively measure the mental load of drivers. The use of machine learning techniques coupled with the increasing amount of available data allows the development of intelligent models that can accurately predict the level of workload (Mehler et al., 2009). Depending on the level of driver workload, the driver-vehicle interaction must be continuously adapted to ensure safe use of the automation and improve the user experience.
The tasks performed by drivers will change as cars increase in automation. Some secondary tasks may lead to an increase in MWL, which needs to be evaluated in this context. MWL is defined as a balance between the exigencies of a situation and the resources available to the operator to deal with that situation. (Wickens, 2008). Multiple dimensions play a role in this complex construct such as operator characteristics (skills and attentional resources), task characteristics difficulty and modality) and environmental context (Young et al., 2015).
In the driving context, MWL is of great importance because a suboptimal level of MWL (mental underload or overload) can lead the driver to errors in attention, which can result in accidents (Brookhuis and De Waard, 2001). Three categories of measures are effective for assessing MWL: task performance measures (primary and secondary task), subjective questionnaire-based assessments and psychophysiological measures (Paxion et al., 2014; Gawron, 2019).
The primary-secondary task paradigm has proven to be a good indicator of MWL in experimental research, specifically in the context of driving (Engstrm et al., 2005; Mehler et al., 2009). In general, the assessment of task performance is done on the primary task (dynamic driving task) and the secondary task (NDRT). An acceptable level of performance can be maintained in the primary task under high workload conditions. It is typically measured by longitudinal (speed and distance from the car in front) and lateral (direction and position in the lane) parameters computed from driving data collected in simulators or road experiments (Engstrm et al., 2005; Mehler et al., 2009). The secondary task performance is highly correlated with MWL since it is associated with a spare capacity not used for completion of the primary task (Young et al., 2015). Thus, secondary task performance (e.g., NDRT) is an indicator of MWL in the context of driving (Engstrm et al., 2005; Mehler et al., 2009). However, measuring MWL by task performance presents some downsides, including control of the task scenarios, monitoring of task performance and artificial configuration of the test environment (Fisk et al., 1986).
Operators' can also report the perceived MWL with subjective ratings. There are several standardized questionnaires for subjectively measuring MWL such as the NASA Task Load Index (NASA-TLX; Hart and Staveland, 1988), the Subjective Workload Assessment Technique (SWAT; Reid and Nygren, 1988) or the Workload Profile (WP; Tsang and Velazquez, 1996). Two other questionnaires can evaluate, respectively, the mental effort and the mental workload generated by the dynamic driving task : the Rating Scale Mental Effort (RSME; Zijlstra and Doorn, 1985) and the Driving Activity Load Index (DALI; Pauzié, 2008). These questionnaires are easy to apply and implement (Rubio et al., 2004) but present some methodological drawbacks. The subjective nature of the measure, as well as the recall bias due to post-task assessment can lead to a discrepancy between the subjective report and the actual level of MWL (Bulmer et al., 2004; Paxion et al., 2014). In addition, a subjective post-task assessment of the MWL does not capture the MWL variation during the task, which could be of great interest (Paxion et al., 2014).
Another approach to measure MWL is the use of psychophysiological indicators. It includes indicators of the central and autonomic nervous system s, such as measures of cardiac activity (heart rate and heart rate variability), electrodermal activity (tonic and phasic skin conductivity), and brain activity through electroencephalography (EEG). Previous research showed that they are reliable indicators of MWL (De Waard, 1997; Dornhege et al., 2007; Haapalainen et al., 2010; Ferreira et al., 2014; Hogervorst et al., 2014; Paxion et al., 2014). Recently, near-infrared spectroscopy (NIRS) has shown great potential as source of data for evaluating driver's MWL (Le et al., 2018). However, EEG and NIRS might not be used in real-world driving conditions, as many drivers may be reluctant to wear a headset while driving. There are some disadvantages to assessing MWL using physiological indicators, such as tedious and delicate placement of electrodes on the user's body, noise in the signal and the spurious influence of physical activity (Huigen et al., 2002). Recent advances in smart wearable devices and clothing (Baek et al., 2009) may help democratize the use of physiological signals to measure MWL in real-world driving conditions. Physiological signals could thus be collected in a continuous, non-intrusive manner to provide a robust assessment of driver's MWL.
Similarly, as indicators of Electrodermal activity (EDA) (Boucsein, 2012), indices of cardiac activity computed from an electrocardiogram (ECG), such as heart rate (HR) and heart rate variability (HRV), are widely used to assess changes in the autonomic nervous system. Previous research has shown that EDA and HRV indicators are sensitive to increases in MWL (Brookhuis et al., 2004; Engstrm et al., 2005; Collet et al., 2009; Mehler et al., 2009, 2012; Brookhuis and de Waard, 2010). Indicators can be temporal measures (SDNN, RMSSD..), or frequency measures such as the ratio of power in the low and high frequency bands of the HRV (Malik and Terrace, 1996). Recent studies have shown that 10–60 s may be sufficient to obtain reliable time-based measurements of HRV, whereas 20–90 s may be sufficient to capture changes in the autonomic nervous system using frequency-based measures (Salahuddin et al., 2007; Baek et al., 2015). Besides, the respiratory system can influence both EDA and cardiac activity. The close coupling of ECG and respiration (RESP) signals is no longer in question (Cacioppo et al., 2007). This phenomenon is referred to as Respiratory Sinus Arrhythmia (RSA) and describes how the respiratory pattern modulates the heart rate (Hirsch and Bishop, 1981). Several methods can be used to quantify this phenomenon, but its assessment by the Porges-Bohrer method may be the most appropriate measure of RSA according to Lewis et al. (2012).
Task difficulty has been shown to have an effect on mental workload measured by physiological indicators. Whether in a simulation environment or a real-world driving environment, MWL has been shown to increase with task difficulty (Engstrm et al., 2005; Mehler et al., 2009, 2012). Physiological indicators that were found to be sensitive to increased workload were mean skin conductance level (Engstrm et al., 2005; Mehler et al., 2009, 2012), heart rate (Collet et al., 2009; Mehler et al., 2009), some HRV indicators such as beat-to-beat intervals (Engstrm et al., 2005) or frequency-based measures (Brookhuis et al., 2004; Brookhuis and de Waard, 2010), and respiratory rate (Mehler et al., 2009). An increase in MWL is accompanied by an increase in heart rate, skin conductance, and respiratory rate (Mehler et al., 2009, 2012). Among these previous studies, only a non-significant effect was found for the task difficulty on skin conductance during an auditory task in the work of Engstrm et al. (2005). This could be due to low driver engagement in the non-driving task, as suggested later by Mehler et al. (2012). Therefore, task performance should be carefully recorded if the workload is measured using physiological indicators. This ensures that the participants are engaged in the non-driving-related task, and possibly uses performance as a control variable in statistical analysis. The effect of task modality on workload was not analyzed. Yet, results of increased workload due to task difficulty have been shown using different tasks involving various modalities such as visual (Engstrm et al., 2005), auditory (Engstrm et al., 2005; Collet et al., 2009; Mehler et al., 2009, 2012) or verbal (Engstrm et al., 2005; Collet et al., 2009; Mehler et al., 2009, 2012) tasks. In other words, regardless of task modality, the same increase in workload is observed as task difficulty increases, based on different physiological measures. This suggests that it might be more difficult to predict task modality with this source of data. This hypothesis will be tested in this work.
One of the objectives of this paper is to predict drivers' MWL using physiological indicators and artificial intelligence (AI) techniques. Previous studies that predicted subjects' MWL using physiological signals and machine learning were reviewed. Only studies that used at least 2 signals among ECG, EDA, and RESP as inputs of machine learning models were reviewed. The studies considered are presented in Table 1. They are compared and discussed on several parameters that can affect the accuracy of a model trained with machine learning techniques, including the environmental settings, the task used to induce MWL, the time intervals used for calculating physiological indicators, the number of classes, and the evaluation approach. Previous studies were conducted in different environments, such as laboratories (Haapalainen et al., 2010; Ferreira et al., 2014; Hogervorst et al., 2014), driving simulators (Son et al., 2013; Darzi et al., 2018; Meteier et al., 2021) or on roads (Solovey et al., 2014). For the driving studies, participants were required to drive manually and perform an additional NDRT to manipulate the level of MWL, except for Meteier et al. (2021) study in which the car drove in conditional automation, and participants were required to count backward orally. Different cognitive tasks were used to manipulate MWL, such as the Pursuit test, the Scattered X (Ferreira et al., 2014), or the N-back task. The latter can involve visual resources with letters displayed on a screen (Hogervorst et al., 2014) or auditory and verbal when the letters are auditory stimuli and participants have to respond verbally (Son et al., 2013; Solovey et al., 2014). Also, the difficulty of the task has an impact on the workload, suggesting that the task used to manipulate the MWL experimentally should be chosen carefully (Mehler et al., 2009, 2012).
The time window used to calculate features can also influence the models' performance in time-series classification tasks. The length of time windows differed between studies, ranging from 30 to 240 s. Solovey et al. (2014) and Meteier et al. (2021) investigated the influence of time window length on model accuracy. For windows shorter than 30 s, Solovey et al. (2014) showed that model accuracy increases with time window size. For longer time windows (30 s–20 min), Meteier et al. (2021) showed that model accuracy increases up to a size of 4 min but decreases if it is longer.
As shown in Table 1, previous studies only classified the user's MWL at two levels. Model performance were evaluated using the mean accuracy as a metric. Accuracy scores range from 75 to 95%, either using between-subject or within-subject evaluation. A three-level workload classification was done with EEG signals (Plechawska-Wojcik et al., 2019), but not using only physiological signals.
Complex and recent approaches of time series classification can be used in order to classify continuously the user's state (Bagnall et al., 2016). The recent emergence of deep learning offers new possibilities to build even more efficient models for time series classification (Ismail Fawaz et al., 2019). The ResNet model (He et al., 2016) showed to outperform other models on different categories of datasets, but not on ECG datasets (Ismail Fawaz et al., 2019). A fully convolutional network (FCN) might be a best option for classification with physiological signals (Wang et al., 2017; Ismail Fawaz et al., 2019). However, these types of deep architectures require to have a large dataset to achieve good accuracy. Other recent models such as XGBoost are also efficient for predicting cognitive workload with physiological signals (Momeni et al., 2019).
The present study aims to classify drivers' MWL at three different levels (low vs. medium vs. high) based on physiological indicators. These different levels of MWL are induced by NDRTs performed by the drivers during conditionally automated driving. To obtain a more refined assessment of MWL, post-task subjective reports are used to regress drivers' MWL (on a 0–20 scale). Task modality is also classified at two levels (visual vs. auditory task). For these classification and regression tasks, the effect of sensor fusion and task performance are investigated, because some drivers might disengage from the tasks (mental fatigue or task too difficult) and thus result in lower physiological activation (Mehler et al., 2012).
The main novelty of this work is to perform a finer evaluation of drivers' MWL than in previous studies, by doing three-class classification and regression tasks only with physiological signals. This work uses ECG, EDA, and RESP for assessing drivers' workload as EEG or NIRS may be considered less suitable for real-world condition. Also, the effect of drivers' task performance on models' accuracy has not been done in previous research. Finally, using a data-driven approach with an explainable AI (xAI) technique to find the most relevant indicators of MWL has not been done so far. To summarize, the following are the contributions made in this manuscript:
• Statistical analysis of the effect of task difficulty, modality, measurement time and interaction of them on three physiological measures (one for each signal).
• Analysis of task performance and sensor fusion on the performance of classification and regression models to predict MWL.
• Use of an xAI approach to find the most relevant indicators of MWL in the context of conditionally automated driving.
Drivers' MWL prediction is done in the specific context of automated driving, while most of previous studies focused on assessing MWL in manual driving scenarios. Only one recent study focused on the evaluation of MWL in conditionally automated driving (Meteier et al., 2021), but authors used a verbal task to induce MWL and suggested that it might have induced a bias in the classification of the driver's state. For this reason, the manipulation of drivers' MWL was done at three different levels, with participants performing a succession of short non-verbal tasks (90 s each). Previous research showed that indicators of skin conductance and heart rate variability are reliable measures of MWL (Engstrm et al., 2005; Collet et al., 2009; Mehler et al., 2009, 2012), so we expect to see higher performance when EDA and ECG signals are used to train the models.
For this study, 80 participants were recruited. 67.5% consider themselves as female (N = 54) and 32,5% as male (N = 26). The sample of drivers was rather young (M = 23,9 years old, SD = 8.2), ranging from 19 to 66 years old. They reported holding their driving license for 5.42 years (SD = 8.08 years) and driving 6312 kilometers per year on average (SD = 14 415 km). 76.3% of participants did not have an accident in the last 3 years and 36% indicated that they have already used an automated car. 25% of them reported that they drove in a simulator before. Most of the participants were students at the university. They were recruited by e-mail and advertising flyers. The participants needed a driving license and adequate knowledge of German, French, or Italian to participate in the study. Thirty-eight were German native speakers, 18 were French native speakers, 21 were Italian native speakers, and 2 had another mother tongue. As compensation for participating in the experiment, the participants received 2 experimental hours counting for their study program. Before taking part in the study, all participants were informed in detail about the automated driving systems, the purpose of the study and the procedure. They agreed to our consent form based on the ethics committee of the university and the federal law on data protection. Participants were randomly assigned to the experimental groups.
The study consisted of an experimental mixed design with four independent variables. Two of were within-subject variables: the task difficulty (low vs. medium vs. high cognitive task) and the task modality (no task vs. auditory vs. visual task). To manipulate these two factors, the N-back task was chosen (Kirchner, 1958). It is a continuous performance task that has been widely used in research as a tool to induce various levels of MWL to participants, through different modalities (either visual or auditory). “N” is the factor that can be varied to make the task more or less difficult. The participant has to press a button if the current letter is the same as the one presented N-steps before, as shown in Figure 1. In this study, the 1-back and 3-back tasks, respectively, correspond to the condition of the medium and high cognitive tasks. For the task modality, the sequence was either presented visually on a screen or played through audio files. Both modalities were done on the same tablet. Audio files were recorded before the experiment and played in the participant's native language. Additionally, a control variable was used and common to both variables. It is a condition in which participants did not perform the N-back task. During these periods, they were only asked to monitor the driving environment while the car was driving in conditional automation. The order of the non-driving related task sequences was randomized throughout the experiment but controlled before the takeover situations by following a Latin Square design (Kirk, 2013).
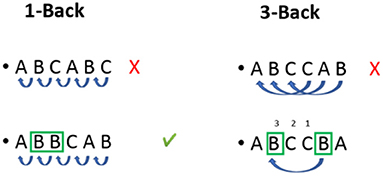
Figure 1. Illustration of the N-back task operation according to the difficulty modality (1-back vs. 3-back).
There were two other between-subject factors in the experimental design: the information on automated cars limitations before the experiment (information vs. no information) and the presence of a mobile application giving context-related information of the driving situation on the tablet (application vs. no application). Also, participants had to react to five different takeover situations. The effect of these two between-subject factors and takeover situations are not presented in this work, see the work of Meteier et al. (2020) for more details.
The experiment was carried out in a fixed-base driving simulator. It was a semi-enclosed cabin with low luminosity, with two car seats, a steering wheel (Logitech G27), and the pedals (throttle and brake). The orientation and position of the seats were adjustable. The scenario was a 2-lane road passing through a national park (Yosemite National Park, USA) without traffic. The car used conditionally automated driving features. The driving simulation was projected on a large screen (62 x 83 inch) using a beamer (Epsilon EH-TW3200). Two speakers behind the seats played sounds of the driving environment to immerse the driver in the simulation. The drivers could steer the wheel (more than 26 degrees), brake, or press a button on the steering to turn off the autopilot and regain full control of the vehicle. The dashboard (speed, engine rotations per minute, and autopilot mode) was run on a laptop and was displayed to the participant on a screen behind the steering wheel (cf. Figure 2).
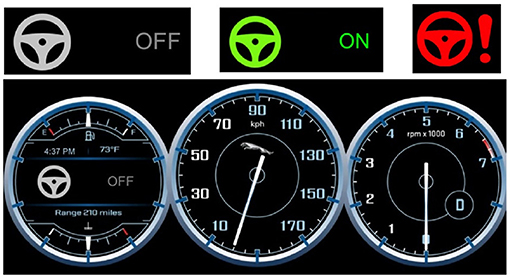
Figure 2. Top: The icons showing the state of the automation. Gray icon: Autopilot OFF, Green icon: Autopilot ON, Red icon: Takeover Request (TOR). Bottom: The display of the dashboard, showing the state of automation mode, the speed and the number of engine's revolutions per minute of the car.
Besides, a data acquisition unit (Biopac MP36) recorded the physiological signals of drivers at a sample rate of 1,000 Hz. A digital low pass filter (cut-off frequency: 66.5Hz, Q-factor: 0.5) removed the noise from the signals. The filters had a respective gain of 2,000 and 1,000 gain for EDA and RESP signals. Disposable Ag/AgCl pre-gelled electrodes (EL507 and EL503, Biopac) plugged on lead sets (SS57LA and SS2LB, Biopac) collected the EDA and ECG signals. Three electrodes were attached to record the ECG, two above both ankles and one at the right wrist. Two electrodes for recording EDA were attached to the non-dominant hand (one on the ring finger and one on the little finger) to ensure easy use of the tablet and the steering wheel during the experiment. The SS5LB respiratory effort transducer (Biopac) was attached to the participants' chest to collect the respiration signal. The Biopac Student Lab 3.7.7 software recorded the signals on a computer with a 17-inch display for a visual check of signals before starting the experiment.
Participants performed the successive sequences of non-driving-related tasks and answered midterm questionnaires on a tablet (10). An Android mobile application was developed to administer the N-back task and collect data on task performance. The N-back task was constructed using the design from Jaeggi et al. (2007). They used the letters “C,” “G,” “H,” “K,” “P,” “Q,” “T,” and “W.” In this study, the letters “G” and “W” were replaced by “N” and “F” due to the translations into French, German and Italian letters, to ensure that all letters were pronounced as differently as possible from the other letters in all three languages. It was important for the correct comprehension and recall of letters during sequences of auditory n-back. Each sequence lasted 90 s and contained 28 letters, with four letters considered as correct answers (targets) on which the participant had to press a button located on the middle of the screen. Each letter was displayed/played for 2.5 s, with an inter-stimulus of 500 ms. In the visual condition, the letter was displayed in the middle of the screen, above the red button, while in the auditory condition, the letter was only announced orally through the audio file and no letter was displayed.
Physiological signals (EDA, ECG, RESP) of participants were recorded continuously during the experiment. Based on these raw signals, physiological indicators could be calculated during the baseline phase (rest) and during each N-back task sequence. The tonic level of skin conductance, heart rate, and respiration rate during task epochs (with baseline correction) were used to evaluate the effect of task difficulty and modality on drivers' MWL (Mehler et al., 2009).
After each N-back task sequence, the participants reported their level of MWL through the mental demand item of the NASA-TLX questionnaire (Hart and Staveland, 1988). Participants rated it on a Likert scale from 0 (low) to 20 (high). Also, the performance on the N-back task was recorded by the mobile application. For each participant and each task sequence, the number of correct, wrong, and missed answers as well as the mean reaction time was saved. Each task sequence contained 28 items, but the participants could achieve a maximum of 27 correct answers for the 1-back task and 25 for the 3-back task. To take that into account, an indicator of performance was computed according to this formula:
with WrongAnswers the number of wrong answers, MissedTargets the number of missed targets, and TotalAnswers the total number of letters that could be a target in a sequence. This aggregated score was computed to allow a fair comparison of performance between 1- and 3-back tasks. Each measure was computed 15 times because every five types of tasks (medium/high and visual/auditory + no task) was performed three times. Other dependent variables such as trust in automation, situation awareness, takeover quality, and user experience about the mobile application and the driving simulator were measured but the results are not presented in this work.
Figure 3 shows the experimental procedure of the study. After initial instructions about the experiment, participants answered a questionnaire containing socio-demographic questions. Electrodes and respiration belt were then attached on the participant's body.
The experiment consisted of three main periods, which took place in the same environment: baseline, training and main driving session. During the baseline (5 min), participants were only asked to monitor the environment of the car while it was driving in conditional automation for 5 min. No takeover could be requested by the car during this period. Indicators computed during this period corresponded to the physiological baseline of each participant.
During the training period, (5 min) participants had to familiarize themselves with the driving functions (steering wheel and pedals) and the takeover process. The experimenter reminded that the car was a conditionally automated vehicle and explained the meaning of icons on the dashboard (cf. Figure 3). When a takeover was requested, the car displayed a red icon on the dashboard and played an audio chime in the speakers. Participants also received instructions on different ways for taking over control. In this practice session, three false alarms (e.g., no stimuli on the road) were triggered. The experimenter made sure that participants understood the takeover process and then they could drive manually until the end of the 5 min. The classification and regression tasks did not consider data from that training phase.
The main driving session lasted about an hour. The participants were given a tablet. The mobile application led them through the whole driving session and presented sequentially the instructions, the N-back tasks, and the questionnaires. Participants were asked to focus on completing the N-back task while the car was driving. No specific instruction regarding visual attention was provided for the auditory task. Participants were instructed to react accordingly to takeover requests and drive the car manually until the critical situation was handled. They were instructed to activate the automation again when they estimated that the situation was safe after a takeover situation. Figure 4 shows an overview of the procedure during the main session. It consisted of five blocks, each composed of a takeover situation. During each block, the participant had to perform three N-back task sequences. The same Figure 4 shows the procedure in one block. Each N-back task sequence was followed by a questionnaire and 60 s of rest. After the NDRT sequence in which the takeover occurred, participants had to answer the questionnaire on the tablet. At the end of the session, participants were asked to stop the car and leave the simulator to fill in the last part of the questionnaire. Electrodes were removed and participants were thanked and discharged.
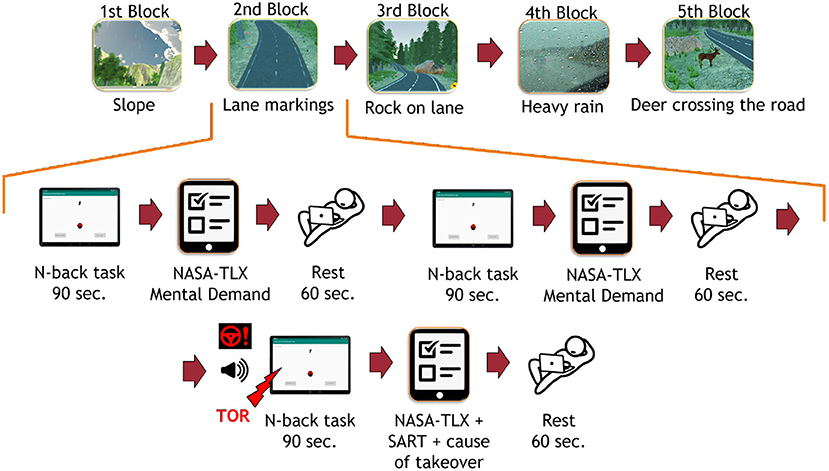
Figure 4. Top: The experimental procedure during the whole driving session. Captions below images correspond to the cause of takeover request sent by the car in each block. Bottom: The experimental procedure in one block of the main driving session. TOR, Take-Over Request; SART, Situation Awareness Rating Technique. The TOR did not appear in the same position in each block.
To check for the success of MWL manipulation, repeated measures analyses of variances (ANOVAs) were calculated using mental demand ratings and task performance for each task sequence. For both dependant variables, instructions before driving and mobile application while driving were included as between-subject factors, while task difficulty, task modality, and measurement time (2 measures) were included as within-subject factors in the statistical analysis. For the task performance, two levels were used for the task difficulty as a between-subject factor (1- vs. 3-back). For the mental demand and physiological indicators (corrected with baseline), three levels were used for the task difficulty as a between-subject factor (no task vs. 1-vs. 3-back). The Bonferroni method was used for adjusting the significance level (p < 0.05) in pairwise comparisons. The analyses were done on IBM SPSS Statistics 25.
This section describes the methodology used to predict the task difficulty (no task vs. low cognitive task vs. high cognitive task) and the task modality (visual cognitive task vs. auditory cognitive task), based on physiological indicators. In that regard, classification and regression tasks were both performed using machine learning techniques. As mentioned before, the effect of sensor fusion and task performance on the model's performance was also explored. The tasks performed in this study are summarized below:
• Task 1: Classification of task difficulty: effect of task performance
• Task 2: Classification of task difficulty: effect of sensor fusion
• Task 3: Regression of task difficulty: effect of task performance
• Task 4: Regression of task difficulty: effect of sensor fusion
• Task 5: Classification of task modality: effect of task performance
• Task 6: Classification of task modality: effect of sensor fusion.
For each task, the procedure employed is shown in Figure 5, which is similar to the one employed by Meteier et al. (2021). The following subsections explain in more detail each step of that procedure. For the classification, the model had to predict the conditions manipulated experimentally, while for the regression, the model had to predict the level of MWL on a scale between 0 and 20 (using subjective ratings as ground truth). An additional goal is to find out what are the most important features in the classification and regression processes, using an xAI technique. This might help researchers to select the most relevant physiological indicators to evaluate MWL.

Figure 5. Procedure employed for the classification and regression tasks. RF, Random Forest; NN, Neural Network; KNN, k-Nearest Neighbors.
The process of raw physiological signals collected during the experiment was automated using the Neurokit library (Makowski et al., 2021) in a pipeline coded in Python. Raw signals from the baseline and each N-back task sequence were processed separately. Physiological data corresponding to takeover situations was used to provide the model with more training samples and potentially increase the performance. EDA, ECG, and RESP signals were all filtered with either low-pass (EDA) or band-pass (ECG and RESP) filters with adequate cut-off frequencies. The EDA signal was downsampled to 50 Hz and processed using a recent convex optimization method (Greco et al., 2016). Heartbeats were extracted from the ECG signal using a QRS-detector algorithm (Hamilton, 2002). Additional RSA features were calculated from the RESP and ECG processed signals, using the peak-to-trough (P2T) and the Porges-Bohrer methods (Lewis et al., 2012).
At the end of the processing step, a large range of physiological features described in Table 2 were computed with Neurokit (Makowski et al., 2021). For each indicator, two features were created:
• the value of the indicator while performing the N-back task (for instance, the heart rate during a task sequence)
• the difference between the value while performing the N-back task and the value during baseline (for instance, heart rate during N-back subtracted by heart rate during baseline).
The purpose of this process was to remove the physiological individual differences between drivers. Overall, 162 features from 81 indicators (10 from EDA, 48 from ECG, 16 from RESP, 7 from RSA) were calculated, for the all N-back task sequences. The size of the dataset was 162 features * 15 sequences * 80 participants = 162 x 1,400.
To test the sensor fusion, the classification with features computed from each signal alone (ECG, EDA, RESP), each possible pair of signals (EDA + ECG, EDA + RESP, ECG + RESP) and all signals combined (EDA + ECG + RESP). To investigate the effect of task performance, features from the three signals were used (EDA + ECG + RESP) and a varying threshold (from 70 to 100 by steps of 5) was applied to each task epoch. A sample (e.g., row in the dataset) was considered for training the model if the performance corresponding to that task sequence was at least higher than the chosen threshold (e.g., TaskScore in Equation 1, section 4.1.3). The number of samples considered for training the models was hence different for each threshold value. Also, there was not an equal number of samples in each class for classifying task difficulty, because the No Task condition had twice fewer samples than the other classes. To address this imbalanced dataset issue, the minority classes were oversampled using the Synthetic Minority Oversampling Technique (Chawla et al., 2002). To summarize, the number of samples used for each threshold value can be found in Table 3.

Table 3. Number of samples in each class used for training the algorithms at each threshold value of task performance.
A feature normalization process has been applied to feature scale sensitive models, using the RobustScaler function of the scikit learn machine-learning framework (Pedregosa et al., 2011). For each feature, the median was subtracted to all samples, which were scaled according to the interquartile range (between the first quartile and the third quartile of data distribution for each feature). For all models, a univariate feature selection process reduced the dimension of the feature space and so the computation time. The main goal of this process was also to optimize models' performance by selecting only the most relevant features. The 20 best features were selected based on univariate statistical tests, using the SelectKBest method of the scikit learn framework.
The selected features are used as input of machine learning algorithms for training these models and then validating their performance. Three algorithms were selected because they can be used for both classification and regression tasks. They were implemented in Python using the scikit learn machine learning framework (Pedregosa et al., 2011). The selected algorithms were Random Forest (RF), Neural Network (NN), k-Nearest Neighbors (KNN).
For each task performance threshold or combination of physiological signals, a repeated k-fold procedure was employed. The training and evaluation procedure was run 5 times, to report accurate results over several iterations. For each iteration, the dataset was randomly split into a training set (80%) and a test set (20%). To optimize the performance of models, the grid search approach was employed during the training phase. The goal was to find the set of hyperparameters that maximizes the performance of each algorithm (Claesen and De Moor, 2015). A k-fold cross-validation approach was selected to train the models. The training set was split into k = 4 folds, each fold acting as the validation set once. Each set of hyperparameters shown in Table 4 was tested for each split of the dataset. The best model (e.g., the one that gave the best score over the 4 folds) was then evaluated on the test set. For the classification tasks, the weighted f1-score was used as an evaluation metric, since Task 1 and Task 2 are multi-label classification tasks (3 classes). For the regression tasks (Task 3 and 4), the mean absolute error (MAE) was computed to evaluate the performance of models. To compare the models' performance to a reference, the following baseline metrics were calculated:
• Random : a random value between 0 and 20
• MeanScale : mean value of NASA-TLX scale (10)
• MeanParticipants : the mean of mental demand score reported by participants for NASA-TLX (M = 8.625)
• MeanGroup : Mean of participants in each condition (no task vs. 1- vs. 3-back); the mean of mental demand score reported by participants in each condition (Mnotask = 3.247, M1−back = 5.852, M3−back = 14.099).

Table 4. Hyperparameters values tested during the grid search procedure, with chosen ranges and step values for each parameter.
Results are reported in graphs and tables, which are the best mean weighted f1-score or MAE achieved by each algorithm on the test set over the 5 iterations. The effect of sensor fusion was tested with a threshold value of 100, while the effect of task performance was tested using the three signals (EDA + ECG + RESP). To find the most relevant indicators of MWL, the most important features (e.g., physiological indicators) in the classification/regression process had to be extracted using the SHAP (SHapley Additive exPlanations) library in Python (Lundberg and Lee, 2017). By assigning an importance value to each feature for a particular prediction, it helps visualize the values of the most important features depending on the predicted class. After the training and evaluation procedure for classifying task difficulty, the best model was saved and used for generating SHAP values. The 10 most significant features were extracted, in descending order (ordered by absolute mean of SHAP value).
The correct implication of participants in the non-driving related task was assessed using the aggregated score of task performance. Data analysis revealed only a significant effect of task difficulty on task performance [F(1,76) = 228.83, p < 0.001, ]. Participants performed better at doing the 1-back task (M = 97.6, SD = 0.5%) than the 3-back task (M = 86.2, SD = 0.6%). Otherwise, there was no significant effect of task modality [F(1,76) = 2.90, p > 0.05, ] and measurement time [F(1,76) = 1.14, p > 0.05, ]. The double and triple interaction effects were not significant (Fs < 1).
The success of the MWL manipulation was evaluated using subjective ratings of workload from the mental demand item of thr NASA-TLX questionnaire. Figure 6 shows the ratings of participants, depending on the modality and difficulty of the task. Data analysis revealed a significant effect of task difficulty on MWL of drivers [F(2,152) = 338.39, p < 0.001, ]. Pairwise comparisons showed that participants found the 3-back task significantly more demanding (M = 14.26, SE = 0.40) than the 1-back task (p < 0.001; M = 5.18, SE = 0.38) or when performing no secondary task (p < 0.001; M = 2.46, SE = 0.39). Interestingly, the effect of measurement time (first vs. second task epoch) was significant on subjective reports of MWL from the drivers [F(1,76) = 4.57, p < 0.05, ]. Participants reported that the first epoch of each task was significantly more demanding (M = 7.53, SE = 0.33) than the second one (M = 7.07, SE = 0.27). Otherwise, there was no significant effect of task modality [F(1,76) = 2.56, p > 0.05, ] alone. Also, there was a significant interaction effect of task difficulty and modality [F(2,152) = 4.15, p < 0.05, ]. Pairwise comparisons showed that participants reported that the visual 1-back task (M = 5.52, SE = 0.40) was significantly more demanding (p < 0.01) than the auditory 1-back task (M = 4.84, SE = 0.40), while the visual 3-back task (M = 14.24, SE = 0.41) was not significantly more demanding (p < 0.05) than the auditory 3-back task (M = 14.28, SE = 0.44). A significant interaction effect of task difficulty and measurement time on MWL [F(2,152) = 3.70, p < 0.05, ] was also found. Pairwise comparisons showed that participants reported higher mental demand the first time they did not perform any secondary task (M = 3.05, SE = 0.54) than the second time (p < 0.05; M = 1.86, SE = 0.38), while it was not the case for 1-back and 3-back tasks (p > 0.05). Besides, the interaction effect of measurement time and modality, as well as the triple interaction effect were not significant (Fs < 1).
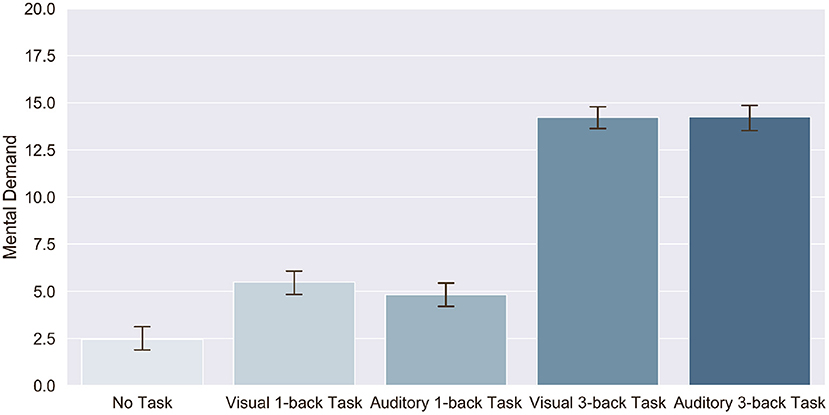
Figure 6. Effect of task modality and difficulty on subjective ratings of mental demand reported after each sequence of N-back task.
Figure 7 shows the change in EDA tonic level, heart rate and respiratory rate of participants, depending on the task difficulty and modality. Data analysis revealed a significant effect of task modality [F(1,73) = 7.23, p < 0.01, ] and measurement time [F(1,73) = 4.83, p < 0.05, ] on EDA tonic level of drivers, but no significant effect of task difficulty [F(2,146) = 0.869, p > 0.05, ]. Drivers had a higher change in EDA tonic level when performing the auditory tasks (M = 2.78, SE = 0.22) compared to the visual tasks (M = 2.65, SE = 0.20). They also showed a higher change in the second epoch of each type of task (M = 2.82, SE = 0.22) compared to the first one (M = 2.61, SE = 0.20). The double and triple interaction effects were not significant (p < 0.05).
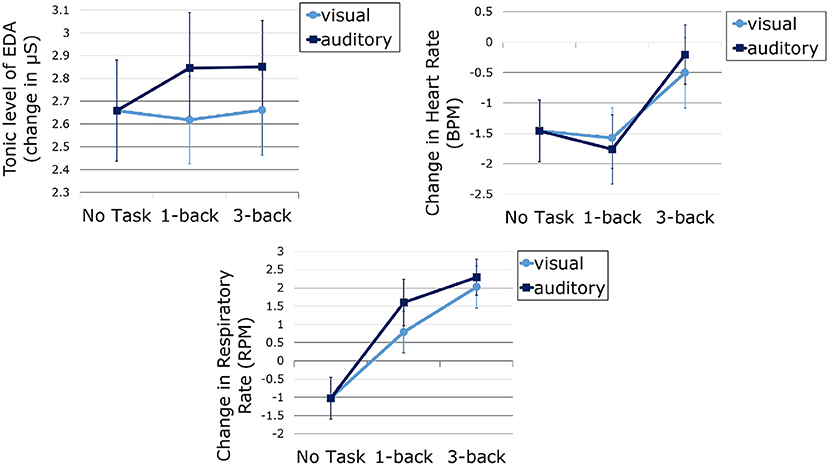
Figure 7. EDA tonic level (top left), heart rate (top right) and respiratory rate (bottom) measured during the tasks and corrected with baseline, as a function of task difficulty and modality. Error bars represent standard error.
Data analysis revealed a significant effect of task difficulty [F(2,146) = 8.82, p < 0.001, ] and measurement time [F(1,73) = 37.96, p < 0.001, ] on heart rate of drivers, but no significant effect of task modality (F < 1). Pairwise comparisons showed that participants that the change in drivers' heart rate was significantly higher when performing the 3-back task (M = –0.35, SE = 0.51) than when performing the 1-back task (p < 0.001; M = –1.67, SE = 0.50) or no task (e.g., monitoring the driving environment; p < 0.05; M = –1.46, SE = 0.51). They also had a higher heart rate in the first epoch of each type of task (M = –0.34, SE = 0.42) compared to the second one (M = –1.97, SE = 0.54). The double and triple interaction effects were not significant (p < 0.05).
Identically to heart rate, results show a significant effect of task difficulty [F(2,146) = 37.72, p < 0.001, ] and measurement time [F(1,73) = 8.22, p < 0.001, ] on respiratory rate of drivers, but no significant effect of task modality [F(1,73) = 2.30, p > 0.05, ]. Pairwise comparisons showed that participants that the change in drivers' respiratory rate was significantly different between one condition to another (p < 0.001). Figure 7 show that the change was the highest during the 3-back task, followed, respectively, by 1-back task and no task conditions. Also, participants had a higher respiratory rate in the first epoch of each type of task (M = 1.23, SE = 0.56) compared to the second one (M = 0.32, SE = 0.48. The double and triple interaction effects were not significant (p < 0.05).
As mentioned earlier, task performance may decrease with increasing task difficulty, either because of drivers' skills or because some drivers may be tempted to abandon the task if it becomes too complicated. In this case, the physiological activation induced by the task would be reduced. For this reason, the influence of task performance on the model's accuracy for predicting task difficulty was investigated. Table 3 (Task difficulty row) summarizes the number of samples contained in all classes for training the model at each threshold value. Figure 8 shows the average f1-score (with standard deviation) on the test set over the 5 iterations, as a function of classifier and threshold value used for the task performance. Features were considered if the participant performed at least above the performance threshold during the task. Table 5 summarizes the best score achieved by each classifier for each threshold value. To better understand the predictions of the best model (a Random Forest classifier with the three signals and a task performance threshold of 100), a confusion matrix is proposed in Figure 9. Figures 10, 11 show the features that had the most impact on the model predictions for predicting the MWL of drivers between the three levels. They show the SHAP values calculated with the best model for all samples of the test set.
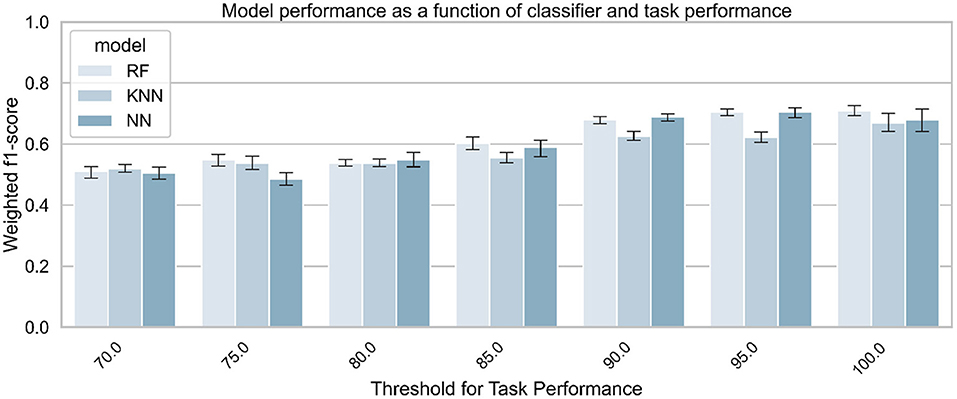
Figure 8. Classifiers' performance for predicting task difficulty (no task vs. 1- vs. 3-back), as a function of classifier and task performance. The three signals (EDA + ECG + RESP) were used to train the classifiers.
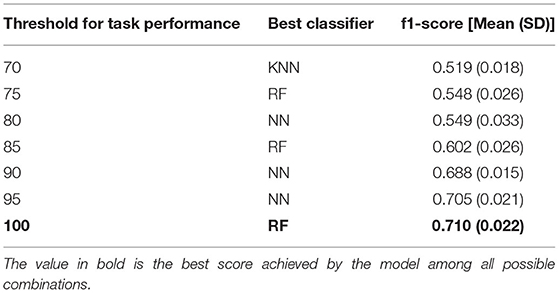
Table 5. Best score achieved by the model to predict task difficulty at each threshold of task performance.
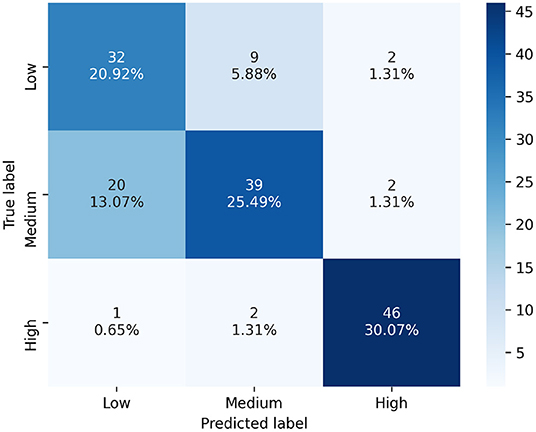
Figure 9. Confusion matrix of the best model's predictions for classifying task difficulty, using the three signals (EDA + ECG + RESP) and a task performance threshold of 100. Labels : Low = No task; Medium = 1-back task; High = 3-back task.
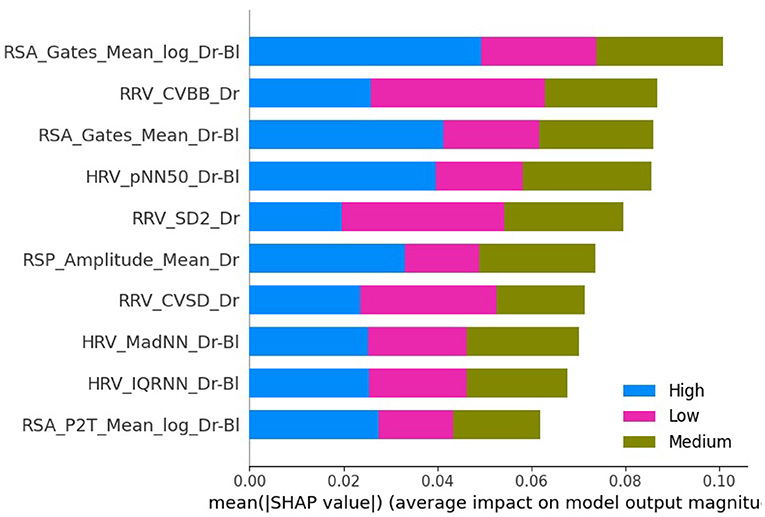
Figure 10. Plot bar graph of the 10 most impacting features to predict drivers' condition based on mean absolute SHAP values, arranged in descending order. The three signals (EDA + ECG + RESP) and a threshold for task performance of 100 were used. The meaning/description of each feature can be found in Table 2. RRV, Respiratory rate variability; HRV, Heart Rate Variability; RSA, Respiratory Sinus Arrhythmia.
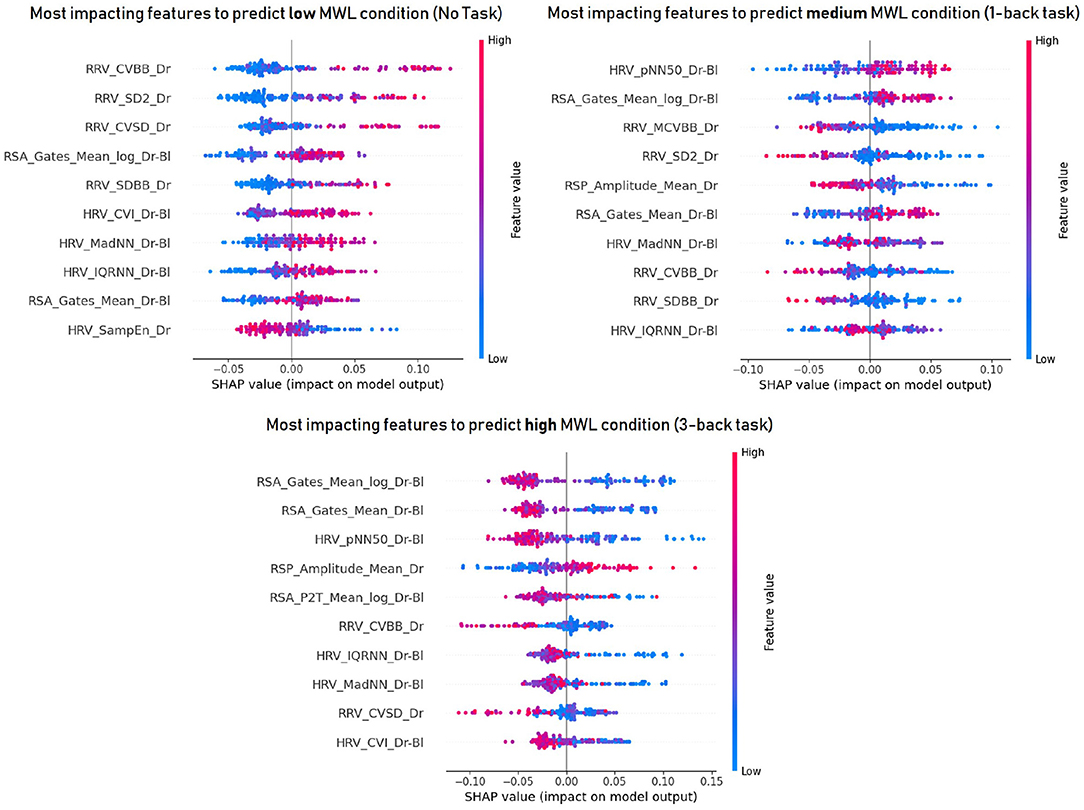
Figure 11. The 10 most important features to predict drivers' mental workload at each level : low (top left), medium (top right) and high (bottom) mental workload. The three signals (EDA + ECG + RESP) and a threshold for task performance of 100 were used. A high SHAP value (to the right on the x-axis) indicates that this feature influenced positively the model to predict that class. The meaning/description of each feature can be found in Table 2. RRV, Respiratory rate variability; HRV, Heart Rate Variability; RSA, Respiratory Sinus Arrhythmia.
As shown in Figure 8, the task performance affects the physiological activation of the drivers and thus the accuracy of the models. Therefore, the effect of sensor fusion was analyzed. The performance of the models in classifying drivers' MWL as a function of task difficulty (no task, 1-back task, 3-back task) is presented in Figure 12. It shows the weighted average f1-score (with standard deviation) of each classifier and each signal combination on the test set over the 5 iterations. Table 6 summarizes the best score obtained for each combination of input signals.
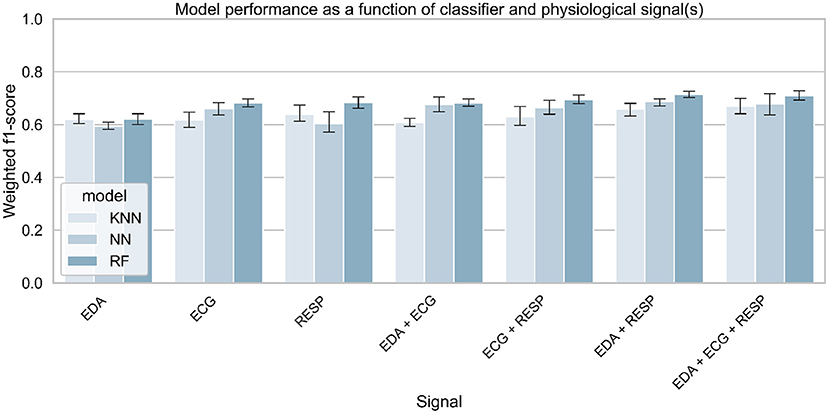
Figure 12. Classifiers' performance for predicting task difficulty (no task vs. 1- vs. 3-back), as a function of classifier and selected physiological signals. A threshold for task performance of 100 was selected.
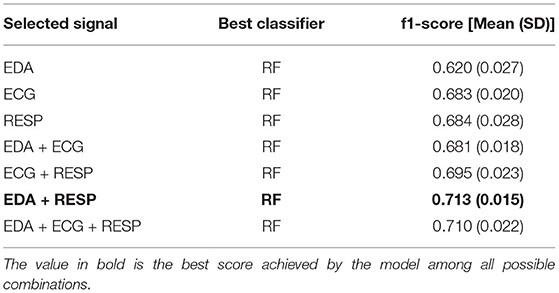
Table 6. Best score achieved by the model to predict task difficulty for each combination of physiological signals.
Regression tasks were performed to obtain a finer assessment of MWL. The goal was to study whether a machine learning model can assess the self-reported MWL with low error (on a scale of 0–20). First, the effect of task performance on the regression error was tested. Figure 13 shows the model error for the MWL regression, depending on the algorithm and the threshold value used for the task performance. It shows the average MAE on the test set over the 5 iterations. As the MAE is used as a metric, this means that the lower the score, the better the model (closer to the ground truth). Table 7 summarizes the best scores obtained by the algorithm for each threshold value, compared to various baseline metrics (defined in section 4.2.5).
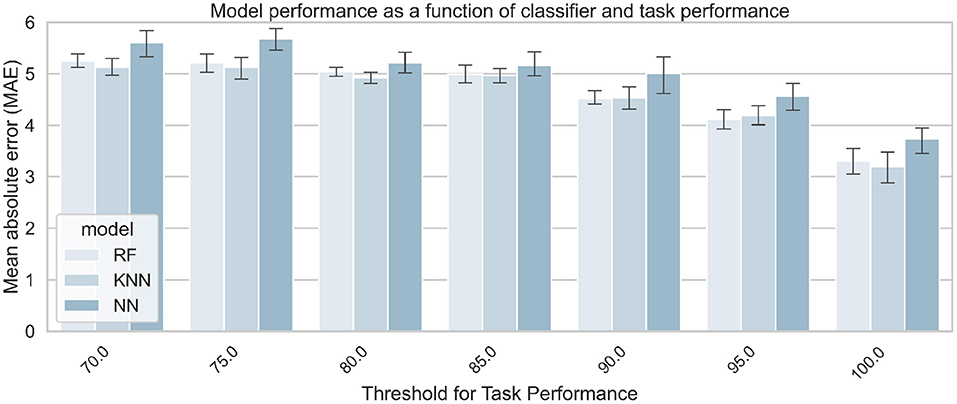
Figure 13. Models' performance for predicting MWL on a 0–20 scale, as a function of algorithm and task performance. The three signals (EDA + ECG + RESP) were used to train the classifiers.

Table 7. Best score achieved by the model to predict task difficulty at each threshold of task performance.
As with the classification tasks, the effect of sensor fusion was also investigated to see if the model performs better with a certain combination of signals. Figure 14 shows the model error for MWL regression, as a function of the algorithm and the combination of signals used for training the algorithm. It shows the average error on the test set over the 5 iterations after the quadruple cross-validation training procedure. Table 8 summarizes the best score obtained by the corresponding algorithm for each combination of signals, compared to various baseline metrics (defined in section 4.2.5).
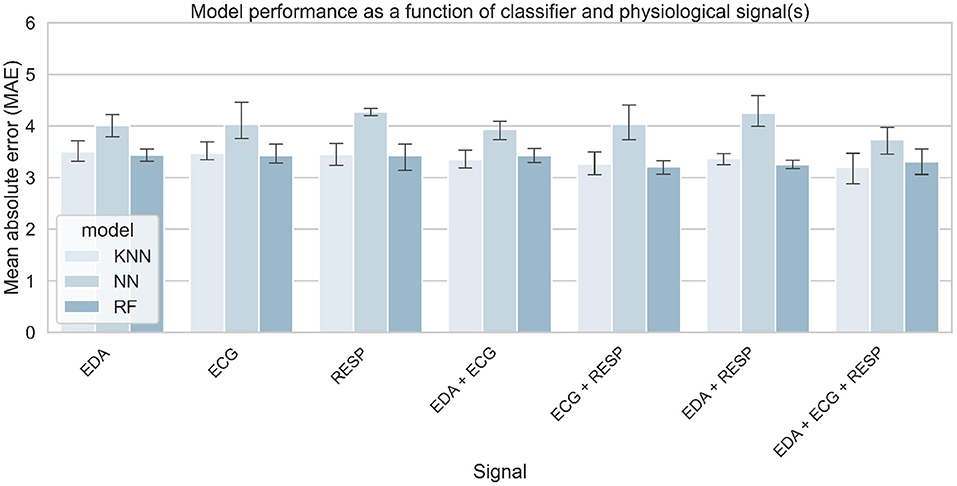
Figure 14. Models' performance for predicting MWL on a 0–20 scale, as a function of selected physiological signals and algorithm. A threshold for task performance of 100 was selected.

Table 8. Best score achieved by the model to predict task modality for each combination of physiological signals.
Table 3 (Task Modality rows) summarizes the number of samples from each class that was considered for training the model at each threshold value. Figure 15 shows the average performance of the model over 5 iterations, as a function of the classifier and the threshold value used for the task performance. Table 9 summarizes the best score obtained by the corresponding classifier for each threshold value.
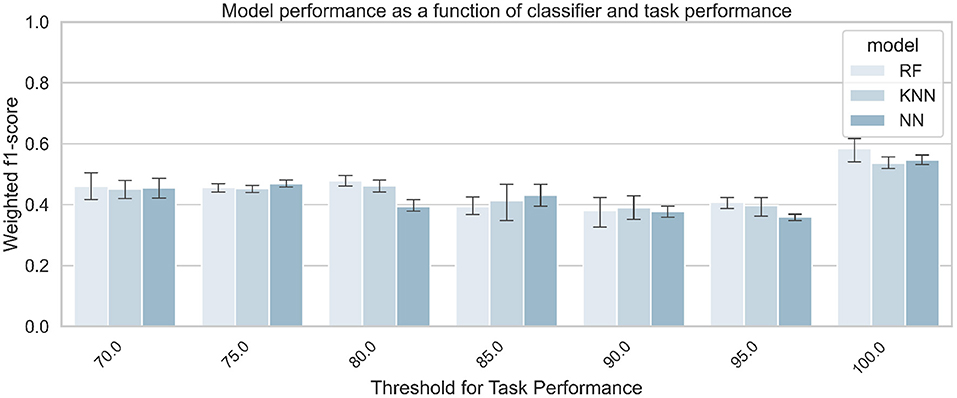
Figure 15. Classification accuracy for predicting task modality (visual vs. auditory), as a function of classifier and task performance. The three signals (EDA + ECG + RESP) were used to train the classifiers.
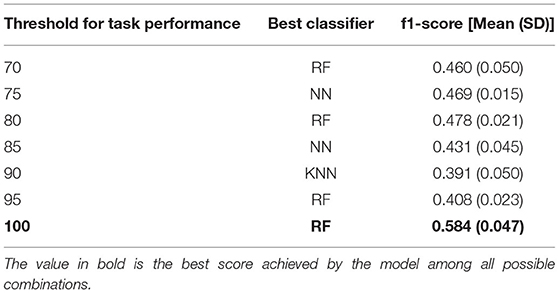
Table 9. Best score achieved by the model to predict task modality at each threshold of task performance.
The accuracy of the model for the classification of the task modality (visual vs. auditory task) is presented in Figure 16. It shows the averages (and standard deviations) of the weighted f1 score obtained by the model for each classifier and each signal combination on the test set over the 5 iterations. Table 10 summarizes the best result obtained for each signal combination.
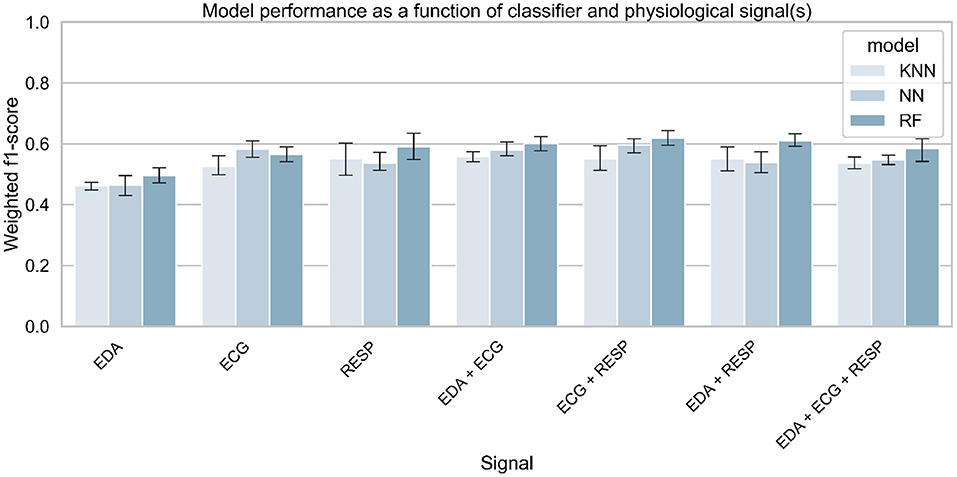
Figure 16. Classification accuracy for predicting task modality (visual vs. auditory), as a function of selected physiological signals and classifier. A threshold for task performance of 100 was selected.
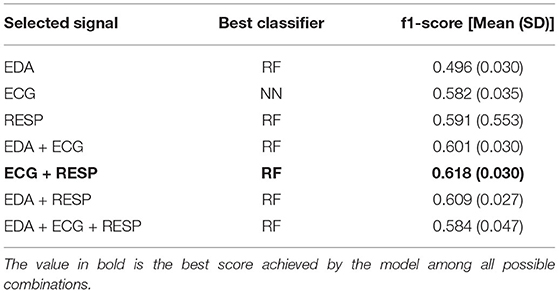
Table 10. Best score achieved by the model to predict task modality for each combination of physiological signals.
Data analysis revealed only a significant effect of task difficulty on task performance, which is consistent with previous studies (Mehler et al., 2009, 2012). Participants were correctly implicated in the 1-back task (task score of 97.6/100), and performed worse at the 3-back task (task score of 86.2/100), which is coherent with the increase in task difficulty. Results obtained on task performance are in line with subjective reports of mental demand after the tasks. because the task difficulty had a significant effect on MWL. Figure 6 shows that the subjective mental demand increases with task difficulty. This result also means that according to participants, performing a 1-back task is more demanding than only monitoring the environment of the car.
Besides, there was a significant effect of measurement time (first vs. second epochs) on subjective reports of MWL. The significant interaction effect of measurement time and task difficulty suggests that it was only the case while monitoring the driving environment (no task condition). Participants reported that the first sequence of No Task was more demanding than the second one. They might have been used to monitor the environment of the car and hence it required less mental resources throughout the experiment. Also, they might have compared with sequences of 1-back and 3-back tasks, so they have probably lowered the score associated with mental demand after the second sequence of No Task. Nevertheless, this may only be a subjective feeling.
Task modality did not show any significant effect on task performance, meaning that participants performed equally in auditory and visual tasks. It also did not show an effect on subjective reports of MWL. However, an interaction effect of task modality and difficulty was found. Participants felt that at the 1-back level, the visual task was significantly more demanding than the auditory task. However, this result was not consistent at the 3-back level, so it is hard to conclude this significant effect.
Since the effect of task difficulty on measures of task performance and workload was significant, we can say that the manipulation of workload at three levels was successful. Based on that, the no task, 1-back, and 3-back conditions can be considered, respectively to states of a low, medium, and high MWL in the remaining part of the manuscript.
Data analysis revealed a significant effect of task difficulty on the mean heart rate and respiration rate but not on EDA. Heart rate was higher in periods of high MWL (3-back) compared to medium and low MWL, while respiration rate was different between each level of MWL. These results are in line with previous findings (Collet et al., 2009; Mehler et al., 2009, 2012), since heart and respiration rates increase with task demand (e.g., increasing workload). However, there was no difference in drivers' heart rate while monitoring the environment and performing the 1-back task. However, it is unexpected to find no significant effect of task difficulty of EDA tonic level like in previous findings (Engstrm et al., 2005; Mehler et al., 2009, 2012). This was most probably due to the low engagement of some drivers in the NDRTs, as suggested by Mehler et al. (2012) after the non-significant effect found for task difficulty on EDA in the work of Engstrm et al. (2005). This unexpected result is consistent with the claim made in the related work section that it is important to control task performance when manipulating the MWL. The non-significant difference of physiological values between No Task and 1-back task is further discussed below. In addition, the tonic level of EDA was also higher on the second occurrence of each type of task, probably due to the repetition of the cognitive tasks to be performed and the demands for car pickup throughout the experiment. However, the opposite effect was found for heart and respiratory rates, which were higher in the first measurement. This could suggest a habituation effect to the task, or that heart and respiratory rates do not increase significantly with a long period of conditionally automated driving (1 h) and repeated takeover requests (5) to manage. EDA is also likely to be more sensitive to takeover requests (an audio sound was played for each request) and the tonic level of EDA may take longer to return to a “normal” state of physiological activation (Boucsein, 2012).
To further investigate the effect of sensor fusion and task performance on the physiological state of automated vehicle drivers, classification and regression tasks were performed using machine learning techniques. For the 3-level classification task, the results show that MWL can be predicted with 71% accuracy (with f1-score as the measure) using the EDA and RESP signals as input of a random forest classifier and a task performance threshold of 100. The results are close to those obtained in some previous studies that classified MWL at only two levels (Hogervorst et al., 2014), which is encouraging for the future. The results for the regression task are consistent with those obtained for the classification. The regression showed that the level of subjective mental load reported by the participants can be predicted to plus or minus 3.195 error (on a scale of 0–20), using the 3 input signals and a task performance threshold of 100. All models tested outperformed the baseline measures, which means that the implemented model can be considered intelligent and more effective than a random prediction of mental load.
Results for both types of tasks are consistent since they show an effect of task performance on model performance. Indeed, model performance increased with better performance on the cognitive tasks. This result suggests that participants' physiological activation is higher when they are properly involved in a cognitive task Mehler et al. (2012). This also suggests that task performance must be controlled during experimental manipulation of the workload in order to obtain consistent results. The effect of sensor fusion was also similar for classification and regression. Model performance increases slightly with signal fusion, although the difference is small between the models using 2 or 3 signals. From the results, it is difficult to conclude that one signal is more effective in predicting mental load than another. Still, the effect of sensor fusion on models' performance are in line with a previous recent study also conducted in conditionally automated driving Meteier et al. (2021). In both studies, EDA is the input signal that performed the worst, which is also in line with the results obtained in the statistical analysis. This unexpected result can be explained by the fact that the participants were holding a tablet to perform the task, which may have induced some noise in the signal. In addition, the repetition of the takeover requests may have attenuated the increase in skin conductance due to the increase in cognitive load during the tasks. The fusion of the three signals (EDA + ECG + RESP) was always among the best results. This shows the importance of multi-modality, allowing to combine features from different signals and thus ensuring a robust evaluation of the mental load.
In this work, the f1-score obtained by the models remains relatively low. This can be explained by the difficulty of the model to distinguish between phases of low cognitive task (1-back) and phases of observation of the vehicle environment (no task). This is illustrated by the confusion matrix in Figure 9. This suggests that observing the vehicle environment or performing a mildly cognitive task on a digital device could induce the same level of cognitive load to the driver. Thus, this implies that drivers might be allowed to engage in mildly cognitive NDRTs in conditional automated driving, with respect to physiological activation.
In order to go even further in the explainability of the machine learning models, an explainable AI technique was applied to the best classifier to find the most relevant indicators to measure MWL. Figure 11 shows that among the 10 indicators with the highest impact in predicting mental load, 4 are respiratory sinus arrhythmia indicators, 3 are respiratory rate variability indicators and 3 are cardiac variability indicators, which is consistent with the literature (Boyce, 1974; Muth et al., 2012; Hidalgo-Muoz et al., 2019). In particular, respiratory sinus arrhythmia (corrected to baseline) according to the Gates method (Gates et al., 2015) seems to be the most relevant indicator, especially for high mental load states. According to the results obtained in this experiment, RSA estimates decrease with increasing mental load (low values toward the right of the x-axis in Figure 11), which is consistent with previous studies (Boyce, 1974; Muth et al., 2012). This is associated with a decrease in cardiac variability and an increase in respiratory amplitude. Whereas, a previous study indicated that respiratory amplitude appears to remain stable with increasing MWL (Grassmann et al., 2016), the results obtained in this study suggest that participants breathed more heavily in a high mental load condition. This should be further investigated.
An additional goal of this work was to test whether the task modality performed by the driver could be recognized using physiological signals and machine learning. The results show that the model was only able to predict the task modality with an accuracy of 61.8% measured by the f1-score, using ECG and RESP as input signals and a threshold of 100 for the task performance. Most models tested with various combinations of thresholds for task performance and input signals have often achieved a performance of around 50%-accuracy. Hence, the effect of task performance on model performance to predict task modality is unclear. Only the threshold of 100 significantly increased model performance. These results suggest that it is difficult to predict the modality of the task performed by the driver from physiological signals alone. With the results obtained in our study, we suggest using other data sources such as cameras to predict the modality of the task performed by drivers and support them accordingly. Previous studies have shown that certain task modalities can negatively impact the driver's ability to take control of automated driving (Wandtner et al., 2018; Roche et al., 2019) and the driver's awareness of his or her environment (Meteier et al., 2020). Thus, knowing the type of task the driver is performing would optimally convey contextual information about the driving environment and thus increase situational awareness.
This study was conducted with young drivers (average age 24) in a simulator. This may have influenced the results obtained, as the mental workload induced in real driving conditions or with drivers of different ages is certainly not the same. Also, the scenario did not include traffic, which could have influenced the drivers' MWL. Other factors were experimentally manipulated in this experiment but were not presented in this work. These may have influenced the participants' physiological and mental state. For example, the presence of a split-screen mobile application on the tablet for half of the participants throughout the experiment may have induced additional mental load (Meteier et al., 2020). In addition, some participants commented on the repetitive and monotonous nature of the non-driving-related task. They may have lost motivation during the experiment, which was reflected in the effect of task performance on the results. To mitigate this problem, a question could have been administered to them to subjectively measure their engagement in the NDRT.
For the non-significant effect found for task difficulty on EDA, one solution would be to take task performance into account in the statistical analysis. Another possibility would be not to take into account the periods after each takeover request, as this could have induced a large increase in EDA and thus biased the results for the non-driving-related task periods.
Regarding the classification results, we are still far from an accuracy of 100%. On the other hand, the results obtained for the regression are encouraging since the model can be considered as intelligent. However, the results obtained must be interpreted with caution. Indeed, the label used as ground truth was a subjective value. Even if this score was reported just after the task to limit recall problems, the score predicted by the model during the regression was perhaps sometimes closer to reality. A solution to this problem would be to use the performance during the task to regress the mental load instead, to assess the mental load more accurately.
To improve the results obtained for the classification and regression of mental load from physiological indicators, more complex and recent models could be used, such as deep neural network architecture (Bagnall et al., 2016; Ismail Fawaz et al., 2019) or gradient boosted decision trees like XGB (Momeni et al., 2019). Data augmentation would hence be required to train models with deep architectures. This can be done using sliding windows to generate more training samples, or recent techniques of data augmentation such as Gaussian Mixture Models (GMMs) and Generative Adversarial Networks (GANs) (Hatamian et al., 2020). However, data augmentation using overlapping windows does not improve drastically models' performance to predict cognitive workload (Solovey et al., 2014; Momeni et al., 2019). This raises other research questions, such as the length of time windows used to generate the physiological indicators. Ninety second may not be the optimal time window for measuring mental load. The work of Meteier et al. (2021) shows that 4–5 min were optimal for measuring the mental load induced by a verbal task, while Solovey et al. (2014) found that 30 s gave the best results. This should be explored in future studies. The ultimate goal is to find the best trade-off between model accuracy and the time window used to predict mental load in a dynamic context such as automated driving. Another way to improve the results obtained would be to manipulate the MWL in the laboratory to limit the influence of external factors. However, the trained model would then be very efficient but less close to reality, which is less relevant for the concrete use of these intelligent models in our future cars.
This work studied the assessment of mental workload through physiological data in the specific context of automated driving. Three physiological signals (EDA, ECG, and respiration) from 80 subjects were collected during 1 h of conditionally automated driving in a simulator. The difficulty and modality of the task were experimentally manipulated with the N-back task. A wide range of physiological indicators was calculated from the signals collected during 15 task sequences (90 s each). Statistical analysis showed an effect of task difficulty on drivers' heart and respiratory rates, but not on the tonic level of the EDA. This could be explained by the low engagement of the drivers in the task or by the repeated requests to take over control during the experiment. A machine learning pipeline was set up, using a repeated 4-fold cross-validation approach with grid search on three algorithms. A random forest classified three different levels of mental workload with a f1-score of 0.713, using skin conductance and respiration as input signals. The drivers' subjective level of mental workload could be predicted with a mean absolute error of around 3 (on a scale of 0–20) using the three signals. In both the classification and regression tasks, the models' performance increased with task performance. This suggests the importance of controlling for task performance when using the dual-task paradigm to experimentally manipulate workload. High engagement in the secondary task resulted in greater physiological activation and therefore helped the model to better classify or regress driver workload. In addition, the model had difficulty predicting the driver's state between monitoring the environment (no task) and performing a mild cognitive task (1-back task). The results suggest that these two tasks might induce a similar amount of physiological activation in drivers. As expected, classification of the task modality (visual or auditory) using physiological signals was not successful. Finally, the most important features in the classification process were extracted using a technique of explainable artificial intelligence. Physiological measures such as estimates of respiratory sinus arrhythmia and indicators of respiratory and heart rate variability were among the most relevant measures of mental workload, according to the results obtained in this study. This is consistent with previous literature and we suggest that these indicators should be used to assess the MWL of drivers in automated driving.
The raw data supporting the conclusions of this article will be made available by the authors upon request.
The studies involving human participants were reviewed and approved by Internal Review Board of the Department of Psychology of the University of Fribourg. The patients/participants provided their written informed consent to participate in this study.
AS, OA, EM, LA, and MW generated the idea to do this study. QM and AS created the experimental design and procedure. They also managed data collection. MC designed the driving scenario. QM and ED implemented the code to compute the indicators from the raw signals, and the classification and regression pipelines. All authors participated to the writing and revising processes.
This work has been supported and funded by the Hasler Foundation (Switzerland), in the framework of the AdVitam project.
The authors declare that the research was conducted in the absence of any commercial or financial relationships that could be construed as a potential conflict of interest.
All claims expressed in this article are solely those of the authors and do not necessarily represent those of their affiliated organizations, or those of the publisher, the editors and the reviewers. Any product that may be evaluated in this article, or claim that may be made by its manufacturer, is not guaranteed or endorsed by the publisher.
The authors would like to thank all the persons who contributed to this manuscript, especially Katharina Aigenbauer, Anika Dannemann, Sharon Guardini, and Aurelia Loser who helped authors for the experimental design and the data collection.
Baek, H., Cho, C.-H., Cho, J., and Woo, J. (2015). Reliability of ultra-short-term analysis as a surrogate of standard 5-min analysis of heart rate variability. Telemed. J. E-Health 21, 404–14. doi: 10.1089/tmj.2014.0104
Baek, H., Lee, H. B., Kim, J. S., Choi, J., Kim, K. K., and Park, K. (2009). Nonintrusive biological signal monitoring in a car to evaluate a driver's stress and health state. Telemed. J. E-Health 15, 182–9. doi: 10.1089/tmj.2008.0090
Bagnall, A., Bostrom, A., Large, J., and Lines, J. (2016). The great time series classification bake off: an experimental evaluation of recently proposed algorithms. Extended Version. ArXiv, abs/1602.01711. doi: 10.1007/s10618-016-0483-9
Boyce, P. R. (1974). Sinus arrhythmia as a measure of mental load. Ergonomics 17, 177–183. doi: 10.1080/00140137408931336
Brookhuis, K., and De Waard, D. (2001). “Assessment of drivers' workload: performance, subjective and physiological indices,” in Stress, Workload and Fatigue, eds P. Hancock and P. Desmond (Mahwah, NJ: Lawrence Erlbaum Associates), 321–333.
Brookhuis, K., Waard, D., and Samyn, N. (2004). Effects of mdma (ecstasy), and multiple drugs use on (simulated) driving performance and traffic safety. Psychopharmacology 173, 440–445. doi: 10.1007/s00213-003-1714-5
Brookhuis, K. A., and de Waard, D. (2010). Monitoring drivers mental workload in driving simulators using physiological measures. Accident Anal. Prevent. 42, 898–903. doi: 10.1016/j.aap.2009.06.001
Bulmer, M., De Vaus, D. A., and Fielding, N. (2004). Questionnaires. London; Thousand Oaks, CA: Sage Publications. OCLC: 762283215.
Cacioppo, J., Tassinary, L., and Berntson, G. (2007). Handbook of Psychophysiology, 3rd Edn. Cambridge: Cambridge University Press.
Chawla, N. V., Bowyer, K. W., Hall, L. O., and Kegelmeyer, W. P. (2002). Smote: Synthetic minority over-sampling technique. J. Artif. Intell. Res. 16, 321–357. doi: 10.1613/jair.953
Claesen, M., and De Moor, B. (2015). Hyperparameter search in machine learning. arXiv:1502.02127 [cs, stat]. arXiv: 1502.02127.
Collet, C., Clarion, A., Morel, M., Chapon, A., and Petit, C. (2009). Physiological and behavioural changes associated to the management of secondary tasks while driving. Appl. Ergon. 40, 1041–1046. doi: 10.1016/j.apergo.2009.01.007
Darzi, A., Gaweesh, S. M., Ahmed, M. M., and Novak, D. (2018). Identifying the Causes of drivers hazardous states using driver characteristics, vehicle kinematics, and physiological measurements. Front. Neurosci. 12:568. doi: 10.3389/fnins.2018.00568
De Waard, D. (1997). The Measurement of Drivers Mental Workload (Ph.D.) Thesis. Traffic Research Centre, University of Groningen, Haren, The Netherlands.
Dornhege, G., Millán, J. R., Hinterberger, T., McFarland, D. J., and Müller, K-R. (2007). Improving Human Performance in a Real Operating Environment through Real-Time Mental Workload Detection in Toward Brain-Computer Interfacing. (Cambridge, MA: MIT Press), 409–422.
Engstrm, J., Johansson, E., and stlund, J. (2005). Effects of visual and cognitive load in real and simulated motorway driving. Trans. Res. F Traffic Psychol. Behav. 8, 97–120. doi: 10.1016/j.trf.2005.04.012
Ferreira, E., Ferreira, D., Kim, S., Siirtola, P., Roning, J., Forlizzi, J. F., and Dey, A. K. (2014). “Assessing real-time cognitive load based on psycho-physiological measures for younger and older adults,” in 2014 IEEE Symposium on Computational Intelligence, Cognitive Algorithms, Mind, and Brain (CCMB) (Orlando, FL: IEEE), 39–48.
Fisk, A. D., Derrick, W. L., and Schneider, W. (1986). A methodological assessment and evaluation of dual-task paradigms. Curr. Psychol. Res. Rev. 5, 315–327. doi: 10.1007/BF02686599
Gates, K. M., Gatzke-Kopp, L. M., Sandsten, M., and Blandon, A. Y. (2015). Estimating time-varying rsa to examine psychophysiological linkage of marital dyads. Psychophysiology 52, 1059–1065. doi: 10.1111/psyp.12428
Gawron, V. J. (2019). Human Performance, Workload, and Situational Awareness Measures Handbook, 2-Volume Set. Boca Raton, FL: CRC Press.
Grassmann, M., Vlemincx, E., von Leupoldt, A., Mittelstädt, J., and den Bergh, O. V. (2016). Respiratory changes in response to cognitive load: a systematic review. Neural Plast. 2016:8146809. doi: 10.1155/2016/8146809
Greco, A., Valenza, G., Lanata, A., Scilingo, E. P., and Citi, L. (2016). cvxEDA: a convex optimization approach to electrodermal activity processing. IEEE Trans. Biomed. Eng. 63, 797–804. doi: 10.1109/TBME.2015.2474131
Haapalainen, E., Kim, S., Forlizzi, J. F., and Dey, A. K. (2010). “Psycho-physiological measures for assessing cognitive load,” in Proceedings of the 12th ACM International Conference on Ubiquitous Computing-Ubicomp '10 (Copenhagen: ACM Press).
Hamilton, P. (2002). “Open source ECG analysis,” in Computers in Cardiology, (Memphis, TN: IEEE), 101–104. doi: 10.1109/CIC.2002.1166717
Hart, S. G., and Staveland, L. E. (1988). “Development of NASA-TLX (Task Load Index): results of empirical and theoretical research,” in Advances in Psychology, volume 52 of Human Mental Workload, eds P. A. Hancock and N. Meshkati (North-Holland), 139–183.
Hatamian, F. N., Ravikumar, N., Vesal, S., Kemeth, F. P., Struck, M., and Maier, A. K. (2020). “The effect of data augmentation on classification of atrial fibrillation in short single-lead ecg signals using deep neural networks,” in ICASSP 2020 - 2020 IEEE International Conference on Acoustics, Speech and Signal Processing (ICASSP) (Barcelona,: IEEE), 1264–1268.
He, K., Zhang, X., Ren, S., and Sun, J. (2016). “Deep Residual Learning for Image Recognition,” in 2016 IEEE Conference on Computer Vision and Pattern Recognition (CVPR) (New York, NY: IEEE), 770–778. doi: 10.1109/CVPR.2016.90
Hidalgo-Muoz, A. R., Bquet, A. J., Astier-Juvenon, M., Ppin, G., Fort, A., Jallais, C., et al. (2019). Respiration and heart rate modulation due to competing cognitive tasks while driving. Front. Hum. Neurosci. 12:525. doi: 10.3389/fnhum.2018.00525
Hirsch, J., and Bishop, B. (1981). Respiratory sinus arrhythmia in humans: how breathing pattern modulates heart rate. Am. J. Physiol. 241, H620–9. doi: 10.1152/ajpheart.1981.241.4.H620
Hogervorst, M. A., Brouwer, A.-M., and van Erp, J. B. F. (2014). Combining and comparing EEG, peripheral physiology and eye-related measures for the assessment of mental workload. Front. Neurosci. 8:322. doi: 10.3389/fnins.2014.00322
Huigen, E., Peper, A., and Grimbergen, C. A. (2002). Investigation into the origin of the noise of surface electrodes. Med. Biol. Eng. Comput. 40, 332–338. doi: 10.1007/BF02344216
Ismail Fawaz, H., Forestier, G., Weber, J., Idoumghar, L., and Muller, P.-A. (2019). Deep learning for time series classification: a review. Data Min Knowl Discov. 33, 917–963. doi: 10.1007/s10618-019-00619-1
Jaeggi, S. M., Buschkuehl, M., Etienne, A., Ozdoba, C., Perrig, W. J., and Nirkko, A. C. (2007). On how high performers keep cool brains in situations of cognitive overload. Cogn. Affect. Behav. Neurosci. 7, 75–89. doi: 10.3758/CABN.7.2.75
Kirchner, W. (1958). Age differences in short-term retention of rapidly changing information. J. Exp. Psychol. 55, 52–8. doi: 10.1037/h0043688
Kirk, R. (2013). “Latin square and related designs,” in Experimental Design: Procedures for the Behavioral Sciences, 4th Edn (Thousand Oaks, CA: SAGE Publications, Inc.,).
Le, A. S., Aoki, H., Murase, F., and Ishida, K. (2018). A novel method for classifying driver mental workload under naturalistic conditions with information from near-infrared spectroscopy. Front. Hum. Neurosci. 12:431. doi: 10.3389/fnhum.2018.00431
Lewis, G. F., Furman, S. A., McCool, M. F., and Porges, S. W. (2012). Statistical strategies to quantify respiratory sinus arrhythmia: Are commonly used metrics equivalent? Biol. Psychol. 89, 349–364. doi: 10.1016/j.biopsycho.2011.11.009
Lundberg, S. M., and Lee, S.-I. (2017). “A unified approach to interpreting model predictions,” in Advances in Neural Information Processing Systems, Vol. 30, eds I. Guyon, U. V. Luxburg, S. Bengio, H. Wallach, R. Fergus, S. Vishwanathan, and R. Garnett (Long Beach, CA: Curran Associates, Inc.).
Makowski, D., Pham, T., Lau, Z. J., Brammer, J. C., Lespinasse, F., Pham, H., et al. (2021). NeuroKit2: A Python toolbox for neurophysiological signal processing. Behav. Res. Methods. 53, 1689–1696. doi: 10.3758/s13428-020-01516-y
Malik, M., and Terrace, C. (1996). Heart rate variability. Standards of measurement, physiological interpretation, and clinical use. Eur. Heart J. 17, 354–381. doi: 10.1093/oxfordjournals.eurheartj.a014868
Mehler, B., Reimer, B., and Coughlin, J. (2012). Sensitivity of physiological measures for detecting systematic variations in cognitive demand from a working memory task. Hum. Factors 54, 396–412. doi: 10.1177/0018720812442086
Mehler, B., Reimer, B., Coughlin, J., and Dusek, J. (2009). The impact of incremental increases in cognitive workload on physiological arousal and performance in young adult drivers. Trans. Res. Record 2138, 6–12. doi: 10.3141/2138-02
Meteier, Q., Capallera, M., de Salis, E., Sonderegger, A., Angelini, L., Carrino, S., et al. (2020). “The effect of instructions and context-related information about limitations of conditionally automated vehicles on situation awareness,” in 12th International Conference on Automotive User Interfaces and Interactive Vehicular Applications, AutomotiveUI '20 (New York, NY: Association for Computing Machinery), 241–251.
Meteier, Q., Capallera, M., Ruffieux, S., Angelini, L., Abou Khaled, O., Mugellini, E., et al. (2021). Classification of drivers' workload using physiological signals in conditional automation. Front. Psychol. 12:268. doi: 10.3389/fpsyg.2021.596038
Momeni, N., Dell'Agnola, F., Arza, A., and Alonso, D. A. (2019). “Real-time cognitive workload monitoring based on machine learning using physiological signals in rescue missions,” in 2019 41st Annual International Conference of the IEEE Engineering in Medicine and Biology Society (EMBC) (Berlin: IEEE), 3779-3785.
Muth, E. R., Moss, J. D., Rosopa, P. J., Salley, J. N., and Walker, A. D. (2012). Respiratory sinus arrhythmia as a measure of cognitive workload. Int. J. Psychophysiol. 83, 96–101. doi: 10.1016/j.ijpsycho.2011.10.011
Pauzié, A. (2008). A method to assess the driver mental workload: The driving activity load index (dali). IET Intell. Trans. Syst. 2, 315–322. doi: 10.1049/iet-its:20080023
Paxion, J., Galy, E., and Berthelon, C. (2014). Mental workload and driving. Front. Psychol. 5:1344. doi: 10.3389/fpsyg.2014.01344
Pedregosa, F., Varoquaux, G., Gramfort, A., Michel, V., Thirion, B., Grisel, O., et al. (2011). Scikit-learn: machine learning in python. J. Mach. Learn. Res. 12, 2825–2830. Available online at: https://www.jmlr.org/papers/volume12/pedregosa11a/pedregosa11a.pdf
Plechawska-Wojcik, M., Tokovarov, M., Kaczorowska, M., and Zapa, D. (2019). A three-class classification of cognitive workload based on eeg spectral data. Appl. Sci. 9:5340. doi: 10.3390/app9245340
Reid, G., and Nygren, T. (1988). The subjective workload assessment technique: a scaling procedure for measuring mental workload. Adv. Psychol. 52, 185–218. doi: 10.1016/S0166-4115(08)62387-0
Roche, F., Somieski, A., and Brandenburg, S. (2019). Behavioral changes to repeated takeovers in highly automated driving: effects of the takeover-request design and the nondriving-related task modality. Hum. Factors 61, 839–849. doi: 10.1177/0018720818814963
Rubio, S., Diaz, E. M. C., Martin, J., and Puente, J. M. (2004). Evaluation of subjective mental workload: a comparison of swat, nasatlx, and workload profile methods. Appl. Psychol. 53, 61–86. doi: 10.1111/j.1464-0597.2004.00161.x
Salahuddin, L., Cho, J., Jeong, M. G., and Kim, D. (2007). “Ultra short term analysis of heart rate variability for monitoring mental stress in mobile settings,” 2007 29th Annual International Conference of the IEEE Engineering in Medicine and Biology Society (Lyon: IEEE), 4656–4659.
Singh, S. (2015). Critical reasons for crashes investigated in the National Motor Vehicle Crash Causation Survey. (Traffic Safety Facts CrashoStats. Report No. DOT HS 812 115). Washington, DC: National Highway Traffic Safety Administration. Available Online at: https://crashstats.nhtsa.dot.gov/Api/Public/ViewPublication/812115
Society of Automotive Engineers. (2018). Taxonomy and Definitions for Terms Related to Driving Automation Systems for On-Road Motor Vehicles. Version J3016_201806. Washington, DC: SAE International. Available Online at: https://www.sae.org/standards/content/j3016_201806/
Solovey, E. T., Zec, M., Garcia Perez, E. A., Reimer, B., and Mehler, B. (2014). “Classifying driver workload using physiological and driving performance data: two field studies,” in Proceedings of the 32nd Annual ACM Conference on Human Factors in Computing Systems - CHI '14 (Toronto, ON: ACM Press), 4057–4066.
Son, J., Oh, H., and Park, M. (2013). Identification of driver cognitive workload using support vector machines with driving performance, physiology and eye movement in a driving simulator. Int. J. Precision Eng. Manufact. 14, 1321–1327. doi: 10.1007/s12541-013-0179-7
Tsang, P., and Velazquez, V. L. (1996). Diagnosticity and multidimensional subjective workload ratings. Ergonomics 39, 358–81. doi: 10.1080/00140139608964470
Wandtner, B., Schmig, N., and Schmidt, G. (2018). Effects of non-driving related task modalities on takeover performance in highly automated driving. Hum. Factors 60, 870–881. doi: 10.1177/0018720818768199
Wang, Z., Yan, W., and Oates, T. (2017). “Time series classification from scratch with deep neural networks: a strong baseline,” in 2017 International Joint Conference on Neural Networks (IJCNN), Budapest, 1578–1585.
Wickens, C. D. (2008). Multiple resources and mental workload. Hum. Factors 50, 449–455. doi: 10.1518/001872008X288394
Wickens, C. D., Laux, L., Hutchins, S., and Sebok, A. (2014). Effects of sleep restriction, sleep inertia, and overload on complex cognitive performance before and after workload transition: a meta analysis and two models. Proc. Hum. Factors Ergon. 58, 839–843. doi: 10.1177/1541931214581177
Young, M. S., Brookhuis, K. A., Wickens, C. D., and Hancock, P. A. (2015). State of science: mental workload in ergonomics. Ergonomics 58, 1–17. doi: 10.1080/00140139.2014.956151
Keywords: automated driving, classification, driver, indicators, physiology, regression, workload, non-driving related task
Citation: Meteier Q, De Salis E, Capallera M, Widmer M, Angelini L, Abou Khaled O, Sonderegger A and Mugellini E (2022) Relevant Physiological Indicators for Assessing Workload in Conditionally Automated Driving, Through Three-Class Classification and Regression. Front. Comput. Sci. 3:775282. doi: 10.3389/fcomp.2021.775282
Received: 13 September 2021; Accepted: 13 December 2021;
Published: 14 January 2022.
Edited by:
Youngjun Cho, University College London, United KingdomReviewed by:
Jun Shen, University of Wollongong, AustraliaCopyright © 2022 Meteier, De Salis, Capallera, Widmer, Angelini, Abou Khaled, Sonderegger and Mugellini. This is an open-access article distributed under the terms of the Creative Commons Attribution License (CC BY). The use, distribution or reproduction in other forums is permitted, provided the original author(s) and the copyright owner(s) are credited and that the original publication in this journal is cited, in accordance with accepted academic practice. No use, distribution or reproduction is permitted which does not comply with these terms.
*Correspondence: Quentin Meteier, cXVlbnRpbi5tZXRlaWVyQGhlcy1zby5jaA==
Disclaimer: All claims expressed in this article are solely those of the authors and do not necessarily represent those of their affiliated organizations, or those of the publisher, the editors and the reviewers. Any product that may be evaluated in this article or claim that may be made by its manufacturer is not guaranteed or endorsed by the publisher.
Research integrity at Frontiers

Learn more about the work of our research integrity team to safeguard the quality of each article we publish.