 Sushovan Chanda
 Kedar Fitwe
 Gauri Deshpande
 Björn W. Schuller3,4*
 Sachin Patel
94% of researchers rate our articles as excellent or good
Learn more about the work of our research integrity team to safeguard the quality of each article we publish.
Find out more
ORIGINAL RESEARCH article
Front. Comput. Sci., 13 October 2021
Sec. Human-Media Interaction
Volume 3 - 2021 | https://doi.org/10.3389/fcomp.2021.674533
This article is part of the Research TopicMultimodal Behavioural AI for WellbeingView all 4 articles
Research on self-efficacy and confidence has spread across several subfields of psychology and neuroscience. The role of one’s confidence is very crucial in the formation of attitude and communication skills. The importance of differentiating the levels of confidence is quite visible in this domain. With the recent advances in extracting behavioral insight from a signal in multiple applications, detecting confidence is found to have great importance. One such prominent application is detecting confidence in interview conversations. We have collected an audiovisual data set of interview conversations with 34 candidates. Every response (from each of the candidate) of this data set is labeled with three levels of confidence: high, medium, and low. Furthermore, we have also developed algorithms to efficiently compute such behavioral confidence from speech and video. A deep learning architecture is proposed for detecting confidence levels (high, medium, and low) from an audiovisual clip recorded during an interview. The achieved unweighted average recall (UAR) reaches 85.9% on audio data and 73.6% on video data captured from an interview session.
As defined by Bennett and Harrell (1975), an assertive feeling of a person and his or her abilities in a realistic, secure way can be termed as confidence. It is not about feeling superior to others; rather, it is the inner knowledge that you are capable of in specific respects. As explained by Cech et al. (2011), behavior theory postulates a positive relationship between overall confidence on a topic and the intention to communicate with others on that topic. Studies conducted by Bennett and Harrell (1975) intend to measure the behavior parameters which will be indicative of self-esteem and reliability in the form of confidence. A well-documented study was conducted by Meyniel et al. (2015) on self-confidence with the help of psychometric properties and relationships with other personality attributes.
As stated by Proskurnikov and Tempo (2017), an individual’s self-confidence changes while participating in a group discussion as it is affected by the reflected appraisal. As explained by the work of Ye and Anderson (2019), everyone’s self-confidence asymptotically converges to a steady state value which depends only on the limit of topic sequence which triggers other’s appraisals for an individual’s confidence. As stated by Pajares and Schunk (2001), the metaphor of the self is a mirror which is used to showcase the idea of an individual’s sense of its self. On this note, the appraisals of others act as mirror reflections which provide the information that individuals use to define their own sense of self. These studies have explored behavioral correlation of one’s self-confidence with other’s appraisals for their confidence. The importance of differentiating the confidence level is quite visible in this domain. As stated by Bennett and Harrell (1975), implicitly measured self-esteem has a weak correlation with explicitly measured self-esteem. But the studies conducted by Black (2007) have shown that implicit self-esteem does not tap into the unconscious, rather people consciously overreport their levels of self-confidence.
From the study of Meyniel et al. (2015), it is also evident that low confidence makes a person more likely to disengage themselves from their own action as they doubt about their ability. It is studied by Meyniel et al. (2015) that even with skill and motivation, goals are not likely to be fulfilled without confidence. On the same note, professional role confidence is introduced in a study conducted by Cech et al. (2011) where it is mentioned as an ability of an individual to successfully fulfill the roles, competencies, and goals.
We would like to mention that the work presented in this study is about perceptual confidence of an individual by an interviewer. Lately we see that for any job, interviews are the most important part for the selection process, similarly in schools and colleges, viva voce plays an important role. In both the cases, the confidence level of a person is directly correlated with their probability of outperforming. As discussed by Anderson and Holloway-Libell (2014), due to inherent biases that manual evaluation induces, it is difficult for the interviewer to evaluate the behavioral attributes of the candidate. With the help of deep learning, we describe a model to determine the confidence level of a candidate by their audiovisual cues. Despite of the immense growth in the deep learning field there is not much work done in confidence detection using speech and video as the modalities. To detect confidence levels, we have considered parameters such as facial cues and acoustic features in video and audio analysis, respectively.
In an overview of self-report measures of confidence given by Meyniel et al. (2015), confidence can be divided into two parts—cognitive and physical confidence. The way to measure these two types of confidence is described by Stankov and Lee (2008). Mathematical self-efficacy scales are introduced by Walker and Cheng (2007) and Spegman and Herrin (2007) to measure self-efficacy, and online performance–based measures such as the “proverbs matching test” and the “future life events” scale are used to measure confidence in a questionnaire set up by Saidin et al. (2012), Black (2007). A stroke specific measure of confidence (CaSM) was proposed by Horne et al. (2017) to measure confidence in stroke survivors. It is found that when stroke survivors are more confident, they can progress better, whereas low confidence often prevents them from achieving what they want to do. Low confidence leads to worse well-being and worse long-term outcomes which were observed by Judd et al. (2019). In an experiment conducted by Horta et al. (2012), by a human resource management team of a multinational company, it is observed that there is a strong correlation between high confidence and high mental well-being in the employees of the company. They have concluded that high confidence strengthens the mental well-being of a person. It was also seen by Kouali and Hall (2018) that there is a strong correlation between reducing anxiety and gaining confidence and mental well-being. As per observations of a well-being–related study conducted by Mellalieu et al. (2009), cognitive state anxiety and somatic state anxiety of a person decreases while self-confidence and well-being increases during mindful activities. On the same note, another finding was also highlighted by Avni-Babad (2011) that routine behavior has helped individuals to increase self-confidence and mental well-being.
There is scarce research done in detecting the human confidence level from different modalities. However, there is work done using acoustic-facial features for detecting other behavioral parameters, such as emotions and stress. Metallinou et al. (2008) have used the face points like forehead, eyebrows, cheeks, and chin for emotion detection and trained a Gaussian mixture model (GMM) with these features. In another such study conducted by Nguyen et al. (2017), the authors have used an approach of Kazemi and Sullivan that can extract 68 key points in human faces effectively for emotion detection. These features are used for training support vector machine (SVM) and random forest and decision tree models. The study introduced by Rao and Koolagudi (2015) specifically interests us, as it considers only eye and mouth features for emotion detection in an artificial neural network (ANN) model. The authors have also tried to prove that without mouth and eye features, it is difficult to predict emotions for humans. Tripathi et al. (2018) have used head movements and hand movements along with the facial features for emotion detection. Approaches based on holistic affine warping and local descriptors were used for facial features extraction for stress detection by Gao et al. (2014).
The Viola–Jones technique is used as a face tracker by Vukadinovic and Pantic (2005) and Chanda and Acharya (2016) for detecting initial face points using a supervised regression method. The authors have used these markers for training a linear SVM model. The classification of stress is done using AdaBoost with a random forest and decision tree by Mozos et al. (2017). Eye pupils and body temperature are used as the features for stress detection. Eye-related features along with eye blinks are extracted using an active appearance model (AAM) by Rao and Koolagudi (2015). Along with the eye features, the authors have extracted head movements and mouth features for stress detection. The utility of eye fixations and confidence judgments for detecting concealed recognition of faces, scenes, and objects is showcased by Millen et al. (2020).
Relevant studies have shown that stress is a major evolutionary pressure that can affect an individual’s confidence. An economic-choice experiment is presented by Heereman and Walla (2011) to assess competitive self-confidence in human subjects. It is found that whereas competitive self-confidence is unaffected by an individual’s anxiety level in control conditions, exposure to the Trier Social Stress Test (TSST) for groups drives the behavior of individuals apart; low-anxiety individuals become overconfident, and high-anxiety individuals become under-confident. Also, cortisol responses to stress are found to be related to self-confidence.
Self-Efficacy Questionnaire (SSEQ) and Daily living Self-Efficacy Scale (DLSES) were used to measure confidence by Goette et al. (2015). To investigate the effects and psychological mechanisms of vocal qualities on persuasion, Guyer et al. (2019) designed experiments where they found that vocal speed and vocal intonation influenced global perceptions of speaker confidence. In order to find a confidence detection model, we have come across a few models for stress detection. As we have discussed the connectivity between stress and confidence, we go through stress models as well. A GMM-based framework was built by Reynolds et al. (2000) for physical stress detection. AdaBoost was applied by Horne et al. (2017) and Guyer et al. (2019) to combine the Mel-scale cepstral coefficients and the Teager energy operator to achieve a 73% classification precision with the stress model. StressSense is proposed to identify stress from the human voice using smartphones by Scherer (1986). It achieves 81 and 76% UAR for indoor and outdoor environments, respectively. For ground truth, galvanic skin response (GSR) sensors are used by Scherer (1986) to collect skin conductance data (skin conductance increases in stress situations) to build the universal model which gets adapted to each individual user for better performance (supervised adaption and unsupervised adaption). From this, we find that there is a need for an audiovisual model for confidence classification in a real-time scenario. Therefore, we have designed an experiment to build a classifier for audio and video separately to identify high, medium, and low confidence from human voice and facial movement.
It is essential to have labeled data to train a machine learning model, so that the model when exposed to unseen data can predict the confidence levels. Since there exist no labeled audiovisual repository for such an analysis, we collected the data following a designed protocol.
As discussed by Irvine et al. (2013), the participants focus more on facial expressions as compared to vocals such for conveying emotion efficiently during a face-to-face interview. Craig et al. (2021) state that the audio-only Skype interview has helped them in studying the vocal cues of individuals in measuring their confidence. This motivated us to capture audio-only data for analyzing confidence levels along with an audiovisual data set. The audio data set is collected using Skype video calls and telephonic interviews having inherently different noise profiles, making the model robust towards contextual variations. The audiovisual data set is collected using Skype calls.
Two independent experiments following the same protocol are executed to collect audio and video data. Individuals from the age group 18–40 years participated in this data collection procedure. We have a balanced set of samples from both male (17) and female (17) participants. For both data collection experiments, the participants have no prior idea about the experiment. We have received a total of 430 high confidence, 415 medium confidence, and 397 low confidence responses from audio experiments and a total of 8 892 high confidence, 8 779 medium confidence, and 9 021 low confidence images from the video experiments.
As per the protocol shown in Figure 1, it starts with a consent taken from the participant for the audiovisual recording of the conversation. If the participant agrees to share the data, the further process continues. All the conversations are recorded in English language. The uniformity in the questions, interactions, and interviewer’s responses are maintained throughout. This ensures that for each subject, the questions are the same and the interaction with each subject is in the same way. Initially, the participants are unaware of the reason behind the data collection to assure the unbiased effect on their responses. When the process ends, the necessity of the experiment is discussed with the participants. The same protocol is followed throughout.
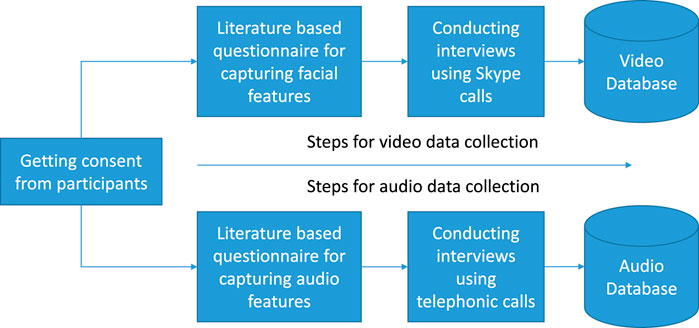
FIGURE 1. Steps of the data collection process for the video and audio modalities.
For the video data collection, 34 college students are invited to participate. The interviewer asks for a convenient time of the participant and makes a Skype call. The participants are asked a set of six questions, with an option to opt out at any point in time. As proposed by Bridger et al. (2013), a cognitive ignition questionnaire is used to measure behavioral problems associated with stress and confidence. Following this approach, a self-administered questionnaire is created comprising of six questions. It is developed in such a format that the initial questions help in obtaining the medium confidence level of the participants. These questions are meant to make the candidate comfortable with the process. The next set of questions is made up of general questions with no specific right or wrong answer, but it requires a deep spontaneous thinking. One of the example questions is: “How will you sell ice cream in the local park on a rainy day?” To answer this question, participants require a special amount of cognitive thinking in a short time. Responses to these questions have helped us to capture the participants’ facial and verbal expressions. The expressions while thinking and answering both are captured for obtaining the cues on low and high confidence levels. All the videos are captured with a framing rate of 30 fps.
For audio-only analysis-–based experiments, the same protocol as explained above is followed, in which 34 office employees participated. The participants belong to the age group of 26–40 years. In this experiment, each participant is asked seven questions by the interviewer in a telephonic conversation. Again, the conversations are recorded only if the participants agreed to give their consent for further usage of their recorded audio data for research purpose. As it is known from the work done by Adler and Ma (2018), humans can report confidence on the basis of decision-making capability. The confidence score reflects on the probability of considering whether the taken decision is accurate or not. The questionnaire is prepared by taking all the inputs from the proposal of Franklin et al. (2014). The data collection for audio is also having a similar structure like the video experiment. At the beginning, a few general questions are asked. An example of a general question is: “What is your qualification?” Such questions are followed by a set of questions for which the responses are known to the participants and it requires a small amount of memory work out, such as “How long have you been living in your current city?” and “How many days are remaining for your birthday celebration?” As explained by Moritz et al. (2006), confidence can be measured as both a result and a cause of memory responses for an individual. So, the answer of the previous set of questions will provide us how well confidence in memory relates to the confidence in the behavior of the person. The last set of questions intends to place the participants in a specific decision-making situation where their choices with valid reasons are captured. The choices can be from any of the following category: ideal, acceptable, possibly acceptable, and unacceptable. An example of such questions is “If zombie apocalypse happens today, what will be your first reaction to it?” The same protocol is maintained throughout the audio data collection. The reason behind the audio data collection is explained to each participant after the interview. All the audio conversations are recorded with a sampling rate of 8 kHz, single channel, 16 bit sample size.
Once the video data from 34 participants and the audio data from 34 participants is captured, the audio and video files are segmented, such that the interview segments where the interviewer is asking questions is removed and only that of the participants responses is kept. It is further analyzed manually to label the data with one of the three confidence levels: high, low, and medium. This annotation mechanism is followed differently for audio and video modalities.
To start with, the audio part of the collected videos is separated and the audio files are preprocessed as mentioned in Section 3.2. These audio clips are used as a test set for the model built using audio data collected separately using telephonic conversations.
Extracting images or frames is the primary step for the confidence classification. The videos of each subject are converted into respective images using OpenCV which is released by Bradski (2000). The images with a similarity index more than 97% are removed using the open-source python library imagecleaner 0.4.4, where the similarity index implies that the images are having similarity among themselves. This is to avoid redundancy in the data set and to identify the frames of interest in the context of confidence classification. These distinct images are labeled with a confidence level by the interviewer using the GUI toolkit Tinkter which is released by Lundh (1999).
These extracted images are annotated using GUI Toolkit Tinkter where a user-friendly interface is developed for annotation. In this interface, the images are displayed in a sequence one after the other when the user clicks on the “next” button. As shown in Figure 2, each image has three options for being labeled as high, low, or a medium confidence level. The cues for determining the confidence level are selected based on the multiple aspects proposed by Ngo et al. (2006). The authors mentioned cues such as the eye contact of the candidate with the camera, eye–eyebrow movement, lips movement, chin movement, and opening and closing of mouth as relevant for identifying confidence of an individual. Hence, all these parameters are considered while annotating the video part of the interview data as high, low, or a medium confidence level. For example, if the candidate is not looking at the camera for a long duration of time while answering, which is in multiple consecutive frames, it is considered as expressing low confidence. Similarly, if the candidates look at the camera while answering the question, it is considered as expressing high confidence. The frames where the candidate partially looks at the camera are considered as the expression of medium confidence. As explained by Tessler and Sushelsky (1978), making eye contact is the key aspect in determining the confidence level of the person and we have followed the same protocol for the annotation. As shown by Yin et al. (2006), the next important factors for data annotating are chin movement, lips movement, and the ratio of open and close portion of the mouth. As proposed by Calder et al. (2003), individuals may not have much confidence to complete a given activity if some awkwardness is visible on their face specifically the mouth region. If the subject is continuously biting lips and same portion of mouth opening repeatedly in consecutive frames during thinking or answering that is marked as a low confidence level. While taking the interviews, the interviewer monitors the candidate to capture these facial expression cues manually. The interviewer uses these cues for annotating the image-wise confidence level of the candidate. The data is labeled with three classes of confidence levels: high, low, and medium, as per the interviewer’s observations during the interaction. Each image of the video is annotated by a social scientist as well. The images having the same label assigned by both the interviewer and the social scientist are retained for further analysis. The images with contradictory labels are rejected from the data set. From the total data set, 77.4% of the images had same labels given by both the annotators.
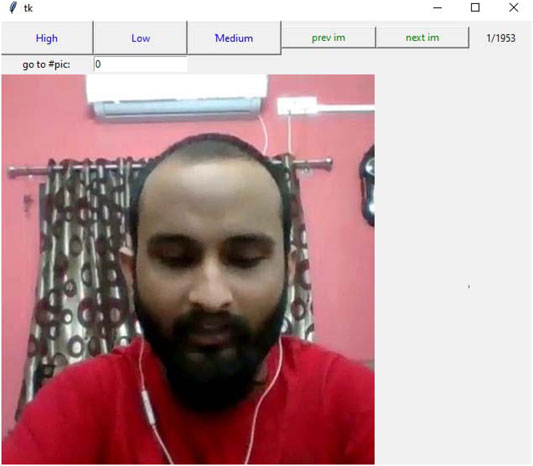
FIGURE 2. Data annotation: GUI toolkit Tinkter: a high/low/medium button for annotating the displayed image, a previm button for moving to the previous image, and a nextim button for moving to the next image.
The entire set of images are divided into three nonoverlapping data sets (train, test, and development) with an approximate proportion of 55, 25, and 20% of the total data set, respectively. As shown in Figure 3, around 4.6k images from each class (high/low/medium) are considered in training data set. For the development set 2.5K images and for a test set around 1.5k images are considered from each class, respectively. The number of subjects in the train, development, and the test set are 10, 10, and 14, respectively. None of the subjects’ data appear in all three partitions to make the analysis subject independent. The features extracted from the images include eye blinks, eyebrow movements, and the mouth movement. A multi-task cascaded convolutional neural network (MT-CNN) (Xiang and Zhu (2017)) is used to detect faces from the images. On detecting a face from the image, the face coordinates are converted into dlib (King, 2009) coordinates and are fed to the dlib predictor. As per our observation, dlib exhibits lower accuracy in detecting faces as compared to MT-CNN, specifically in complex scenarios; hence, MT-CNN is preferred over it for detecting face. On the other hand, although the execution time of dlib for detecting facial key points is higher as compared to MT-CNN; MT-CNN cannot detect all those facial key points which dlib can detect. MT-CNN can only detect up to five facial key points whereas dlib can detect up to 68 facial key points which proves beneficial for further analysis. Hence, we merged the two approaches of detecting face using MT-CNN and facial key points using dlib to get the best of both the libraries. Using face coordinates given by MT-CNN, dlib extracts 68 facial key points. Using these, the eye aspect ratio (EAR) parameter is calculated, which is an index to indicate the percentage of eyes being in open or closed position. The Euclidean distance between the eye key points is calculated to get the value EAR. The EAR is a constant value when the eye is open, but rapidly decreases to 0 when the eye becomes closed. An algorithm can determine if a person’s eyes are closed and if the EAR falls below a certain threshold. This EAR parameter, by applying a threshold value gives the status of blink in an image. Using this EAR parameter, further eye gesture and mouth movement–based features are extracted and are fed to the neural network for further analysis.
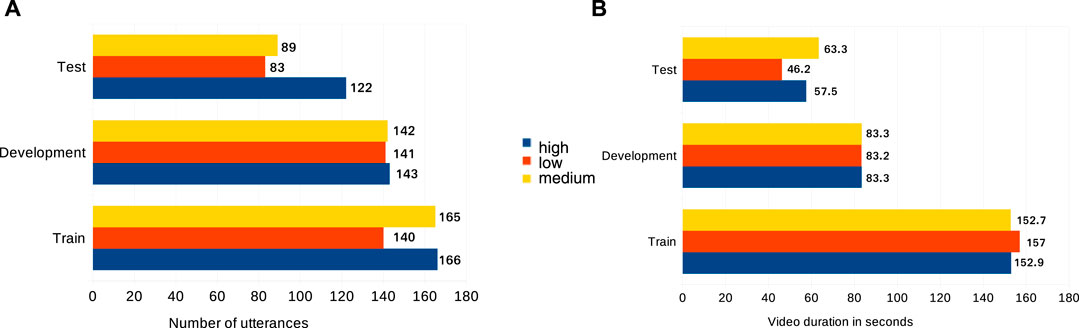
FIGURE 3. (A) Number of utterances in the train, development, and test partitions of the audio data set; (B) Duration in seconds of train, development and test partition of the video data set.
As stated by Hall (1980), the tone is preferred over pauses and stammering for audio part to find one’s trustworthiness. Tone, in acoustics, is the sound that can be recognized by its regularity of vibration. If a simple tone is considered, then there will be one frequency, but its intensity may vary time to time. It is also shared by Cook (2002) that in a verbal communication, the confidence of a person can be identified as positive by listening to the voice tone of that person. In an experiment, it is showcased by Pallier et al. (2002) that the tonal quality of a person determines the level of confidence which generally varies in different topics but remains same in a specific context until the contextual knowledge proved to be wrong. Based on the interviewer’s perception of the tonal quality, the audio part is labeled in three different levels of confidence (high, medium, and low). We have separated the utterances into three data sets. As shown in Figure 3, around 170 utterances for training, 150 utterances for development and around 90 utterances for test set are considered from each class (high, low, and medium) respectively.
Speech signals are processed for a duration of 20 ms as a frame. The sampling rate of the audio is 8 kHz. It is observed that while conducting the interviews, room acoustics and the channel noise interference has happened leading to inducing noise in the speech signal. This noise profile is close to the Brownian noise, defined by Mao et al. (2002). Brownian noise is the random change in sound signal having a spectral density, which is inversely proportional to its frequency squared.
As a result, it has a lot more energy at lower frequencies than it does at higher frequencies. Hence, a band pass filter is implemented to cut out the excess noises by mentioning low pass and high pass threshold values.
After cleaning the data, several distinct features can be extracted from an audio signal, where some of them are found to be prominent in showcasing the changing nature of the signal with the changes in confidence levels. As explained by Gangamohan et al. (2016), a speech signal not only carries the contextual information but also helps in discovering more about the speaker’s behavioral parameters. Generally, the shape of the waveform envelope is used to differentiate the different types of descriptive properties like fluctuations and pauses. Temporal and spatial features from each 20 ms frame are calculated. The feature sets include low-level audio signal properties, mel-frequency spectral coefficient (MFCC), and psychoacoustic features. A low level signal feature set includes root-mean-square (RMS) of the amplitude of a waveform over its cycle, a zero crossing rate (ZCR) to check how many times a signal changes from positive to zero to negative or from negative to zero to positive, a pitch to find the frequency value of the sound, and spectral spread to find the average deviation of the wave around its centroid and spectral entropy to measure the signal’s irregularity. As described by Muda et al. (2010), MFCC is a well-known feature which concisely describes the overall shape of a spectral envelope. In psychoacoustic feature set, average sharpness and roughness are considered by Panda (2014) to judge certainty of speaker’s statement. We have also used those features in our confidence classification. Together they form the feature vector of size 20. As observed by Jiang and Pell (2017), the persuasiveness expressions are the highest in the range of fundamental frequency variance, mean amplitude, and amplitude range, whereas uncertain expressions are the highest in the range of mean fundamental frequency and lowest in speaking rate for both the female and male speakers. The authors have mentioned that the dynamic analysis of the fundamental frequency variance and intensity changes across the utterance uncover distinctive patterns in expression as a function of persuasiveness level at different positions of the utterance. To study the pattern of confidence level at different positions of the utterance, these features are included in our feature set. The Audacity software, published by Audacity Team (2017), is used to segment the speech signal at 8 kHz in a mono format. For human confidence classification from audio, bidirectional long short-term memory (Bi-LSTM) recurrent neural networks (RNNs) are used with cross-entropy as the loss function. The details of the network are explained in Section 4.
Data augmentation techniques to increase the diversity in data are applied after annotation. Position augmentation which comprises of flipping, padding, and rotation is used to induce variations in the size of video data for training the model. Gaussian noise and time-stretching techniques from the Audiomentation1 is used for augmenting audio data. The Gaussian noise with a maximum amplitude of 5% of the original audio signal and with a probability factor of 0.5 is applied. Motivated by the findings of Schlüter and Grill (2015) in applying time stretch augmentation for building a robust neural network model, we applied ±25% of time stretch to the segmented audio recordings having a duration of 9 s on an average.
With the remarkable success of deep learning, the different types of architectures are exploited by Mellouk and Handouzi (2020) to detect another behavioral parameter, “emotions.” Motivated by the use of deep architectures for detection of several use cases of identifying different behavioral parameters such as stress & emotions, we tried to exploit this area of deep learning–based architectures to get enhanced results. We tried three architectures, CNN on the raw images input, CNN + LSTM using raw images as input, and Bi-LSTM using the features described in Section 3.1 as input. With a comparative analysis, it was found that the Bi-LSTM model performs better which is showcased in Figure 4.
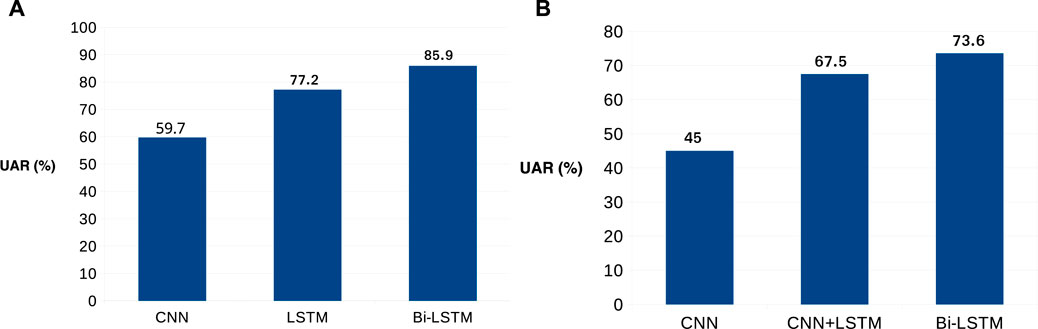
FIGURE 4. (A) Performance graph of three different audio models. Bi-LSTM–based model gives the highest UAR; (B) Performance graph of three different video models. Bi-LSTM–based model gives the highest UAR.
For the CNN model, raw images are fed to the input Conv2D layer with size 27 × 27, which are passed sequentially. This is followed by a MaxPooling Layer with stride length 2. After this, another Conv2D layer with size 12 × 12 is appended. The dense layer of 128 nodes and anther dense layer with three nodes are further appended. Similarly, for the CNN + LSTM model, the input format and the first three input layers remain the same. The last two dense layers are replaced by max pooling, followed by the Conv2D layer with size 6 × 6.
The architecture of the Bi-LSTM network is as described below. Our end-to-end deep neural network consists of two bidirectional LSTM layers followed by two dense layers. This architecture of bidirectional LSTM model with dense layers can be seen in Figure 5. For both bidirectional LSTM layers, 16 hidden nodes and Leaky ReLU activation function is used. The next two fully connected dense layers are having eight nodes and ReLU activation function. One dropout layer is placed after the abovementioned structure where the dropout value is 0.2. This layer is used to remove the over-fitting issue. One simple RNN layer is used at the bottom of the structure where four nodes and ReLU activation are parameterized. In the output layer, we are having the softmax activation function which will give the output as probability distribution among three classes (high/low/medium).
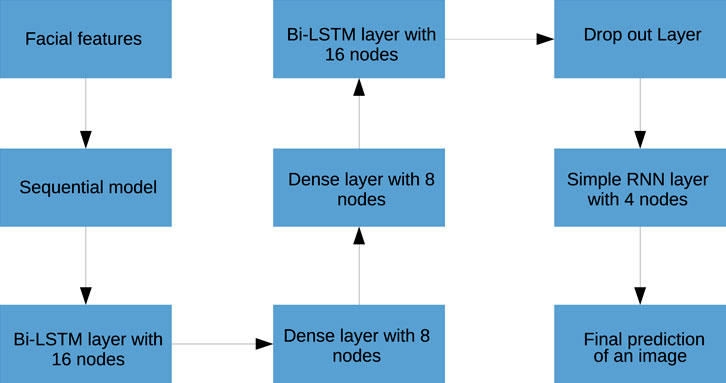
FIGURE 5. Deep architecture for the video model for classification into three classes of confidence: high, low, and medium.
As stated by Chanda and Chandra (2016), deep learning–based algorithms have shown the capability to produce more accurate results in real life problems. As stated by Medsker and Jain (2001), recurrent neural networks can leverage previous sequential information for an unspecified long sequence. In practical cases, it is observed by Kong et al. (2017) that due to the limitation in RNNs’ memory, the length of the sequential information is very limited to only a few steps back. It is proved by Siami-Namini et al. (2018) that the RNN with memory blocks are superior compared to other deep learning techniques with a big margin in the case of time series data. The term “gate” which is introduced in LSTM-based models has made it different from other existing architecture. The longer sequence of input data may require attention or some parts of it can be ignored. As explained by Yao et al. (2015), this decision is taken by the gate depending upon the activation function. But the flow of information is one way which has proved to be a drawback of unidirectional LSTM. As stated by Joo and Choi (2018), using bidirectional LSTM input data can be run in two ways, one from past to future and another from future to past. The major advantage of it over unidirectional is that it runs backward where information can be preserved from the future and using couple of hidden states information from both that past and future can be stored in any point of time.
While exploring convolutional neural network (CNN) architecture, audio spectrograms of 28 ∗ 28 shape are fed as input feature vectors to the convolution layer. This is followed by the max pooling layer and two dense layers with 32 hidden nodes, and softmax as the output layer. For LSTM and Bi-LSTM, the feature set mentioned in Section 3.2 are the input vectors.
The input to the Bi-LSTM neural network is a feature vector as explained in Section 3.1, with a window of 1 s duration. As shown in Figure 6, the Bi-LSTM neural network is trained with 2 Bi-LSTM layers, followed by four fully connected layers having eight hidden nodes and rectified linear unit (ReLU) activation function. A residual block where the activation of the first dense layer is fast-forwarded to the fourth dense layer is chosen. The softmax activation function is used to compute the probability score among three different levels of confidence, where the batch size is 99, and the time-step is five. It is observed that the MFCC as well as spectral features outperform the other time-domain features.
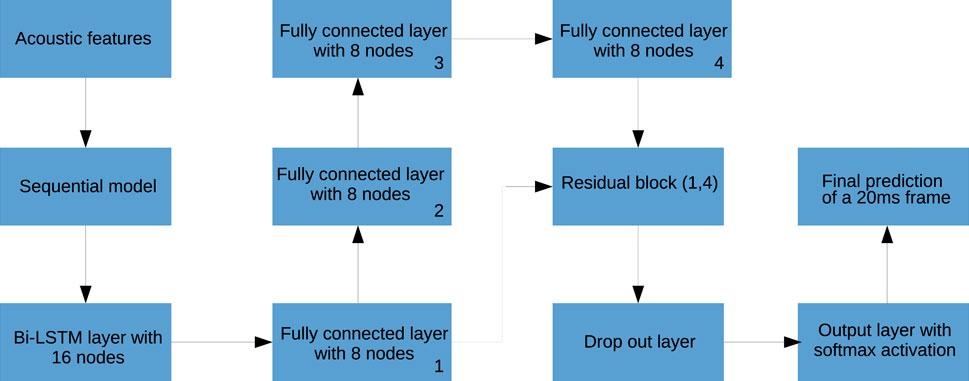
FIGURE 6. Deep architecture of the audio model for classification into three classes of confidence: high, low, and medium.
As explained in Section 3.1, 3.2, the independent models consume features extracted from an image (Video model: Section 3.1) and from 20 ms audio frame (Audio Model: Section 3.2), respectively. The video model outputs a prediction for every image, thereby giving 30 predictions for a duration of 1 s. Similarly, the audio model provides a prediction for every 20 ms audio frame, thereby giving 50 predictions for 1 s. In all, for each second of audiovisual data 80 concatenated predictions are available. These predictions are analyzed together using a neural network shown in Figure 7.
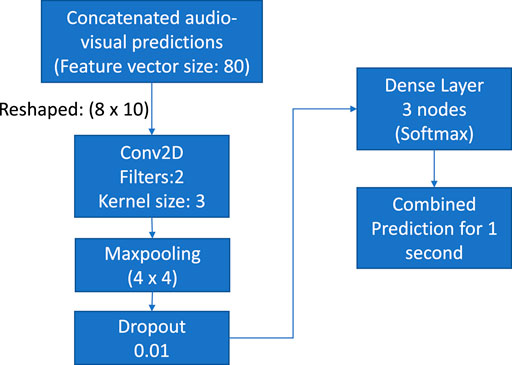
FIGURE 7. Neural network combining the two modalities: video and audio.
The concatenated features are reshaped and fed to a 2-dimensional convolution layer having ReLu activation. The max pooling layer with a pool size of (2, 2) and a dropout layer with a drop rate of 0.01, respectively, are added next. The last layer is a “dense layer” having three nodes and softmax activation. The network uses the Adam optimizer with a learning rate of 0.001. The “Kullback–Leibler (KL) divergence” function calculates the network loss.
The performance exhibited by the three architectures using images extracted from video data is as explained in Figure 4. Again Bi-LSTM architecture outperforms giving maximum UAR of 73.6% on the test partition. In Figure 8, we have compared the predicted category labels with the true label for the feature-based Bi-LSTM video model. It is seen that the highest true prediction is for “medium” confidence data, which is above 75%, whereas the lowest true prediction is for “low” confidence data, which is about 70%. It is an impressive result as the work is done only with facial features. It is also visible that there are false predictions as well for true “high” and true “low” confidence levels which are very less compared to true predictions. While comparing the performances by the three architectures, it can be seen from Figure 4 that the other two models based on CNN and CNN+LSTM architectures have given UAR of 45.0 and 67.5%, respectively, on the test partition.
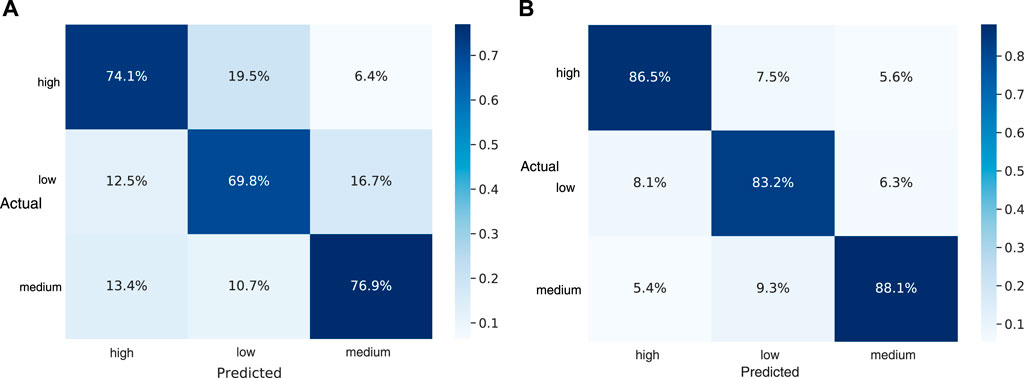
FIGURE 8. (A) Confusion matrix for video model; (B) confusion matrix for the audio model.
The 10-fold cross validation of the video model with 1–15 repeats on the video data set is shown in Figure 9. The UAR of the video model decreases with an increase in the number of repeats and stabilizes at 0.71 with 10 repeats. The 95% confidence interval calculated for the 10-fold cross-validation UAR across all 15 repeats for the video analysis, it is (70.1–82.3%).
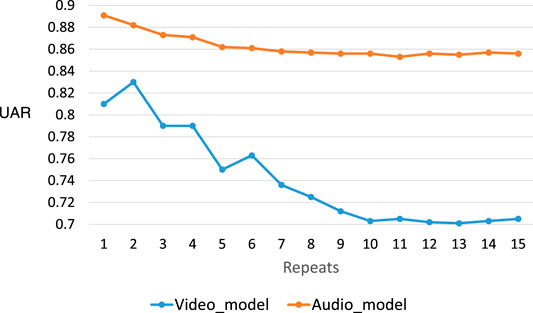
FIGURE 9. 10-fold cross validation of the audio and video model with 1–15 repeats on audio and video data set, respectively.
The audio model using Bi-LSTM architecture gives a UAR of 85.9% on the test set. Similarly, the UARs given by the above explained CNN and LSTM architectures are 59.7 and 77.2%, respectively. The performance comparison of the three audio models is shown in Figure 4.
As seen in Figure 8, we have compared the predicted category labels with the true label for Bi-LSTM audio model. The highest true prediction is visible for “medium” confidence data and the lowest true prediction has come for “low” confidence data which is also above 80%. It is also visible that the major false prediction has come for the “medium” confidence level data which is wrongly predicted as “low” and the value is less than 10%. Similarly, the true “high” and “low” confidence data is wrongly predicted as “low” and “high,” respectively, which has created confusion of less than 9%.
The audio-only model, as described in Section 4.2, is applied on the audio extracts of the first 20 participants video interview recordings well. This provided an additional test set for the audio model. Though the data collection is executed following the same protocol, it is a completely new test data for this model, with annotations from a different interviewer. The audio data is preprocessed as required by the model as described in Section 3.2. The confidence level labels given to the entire video is used as ground truth for this analysis. With this, UAR of 75.9% is achieved for the audio extracts, which is shown in Figure 10. We can see that highest true prediction is for “high” confidence data, which is above 75%, whereas the lowest true prediction is for “medium” confidence data, which is also above 70%. There are false predictions as well and the highest false prediction is for “low” confidence data which is also admissible compared to the true prediction values.
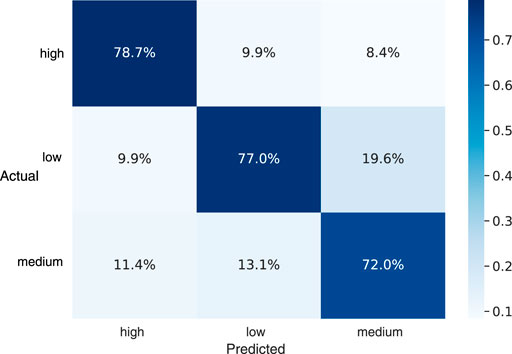
FIGURE 10. Confusion matrix of the predicted value over ground truth for the audio model with extracted audio from video as test data.
Figure 9 shows the UAR of the audio model decreasing with an increasing number of repeats. It stabilizes at 0.86 UAR with around 10 repeats. The 95% confidence interval calculated for the 10-fold cross-validation UAR across all 15 repeats for the audio analysis is (85.3–88.8%).
To analyze the agreement between the two modalities, the audio- and video-based predictions for each second are calculated. The video frame rate is 30 fps and audio is sampled at 8 kHz sampling rate; hence, we get 50 predictions for each second of audio and 30 predictions for each second of video data. The majority rule is applied to assign a label (high/low/medium) for 1-s duration. After correlating these per second predictions, it is observed that the two modalities exhibit a correlation of 0.7 or higher for more than 54% of the unit second samples. However, for around 27% of these unit second samples, the two modalities exhibit a low correlation of less than 0.3. Further analyzing each second prediction from the audio and video, it is seen that a UAR of 13% is achieved if only those predictions are considered correct where both the modalities are in agreement. It exhibits the need for a network to merge the independent modality-based predictions and provide a single outcome. Section 4.3 introduces a fusion network giving a UAR of 49%. The confusion matrix of the results on test set is as shown in Figure 11.
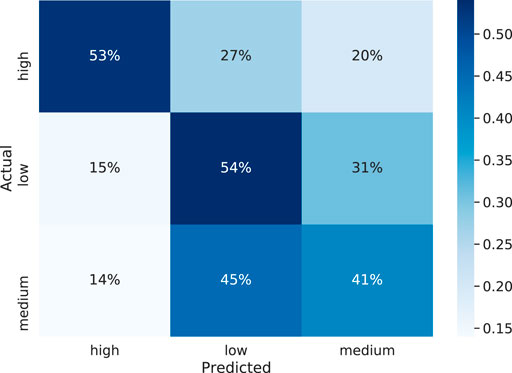
FIGURE 11. Confusion matrix of the predicted value over ground truth for the fusion model on test data.
Given that there is scarce research done in detecting the confidence level from audiovisual modality, the work done here is first of its kind in this domain. The entire work, from data collection to testing the model on a new data set, is accomplished and is mentioned above. There exists higher confusion in detecting “high” and “low” confidence levels as compared to the “medium” confidence level. Confidence, being a behavioral parameter, the perception of it being expressed by an individual tends to be subjective in nature. However, the different audiovisual cues as indicated by several studies are used to label the data in one of the categories of confidence to avoid this subjectivity. These markers are used as rules for the annotation mechanism.
As a first step towards analyzing human confidence, we have separately analyzed audio and video modalities. This work has also led us to go deeper in multi-modality framework for confidence classification. As a first step towards the multimodal analysis, we presented the results of audiovisual late-fusion, where the predictions obtained from individual models are concatenated and fed to another neural network. We plan to explore early fusion techniques to compare and observe the performances.
In the current situation of COVID-19, the interview procedures are preferred over virtual channels. In some scenarios, the candidates are also asked to upload their video profiles which are further manually analyzed by the interviewers. Such tools, as proposed in this study, can be useful in analyzing the confidence levels exhibited by the individuals and can serve as an input for the panel of interviewers.
In this current approach, we have measured the performance of individual and merged audio/visual models for human confidence classification and showed their feasibility. We have also applied the independently built audio model on the audio extracts of the video data. We plan to build a multimodal model by combining the raw data or the feature representation of the two approaches. Current research focuses on the basic features of the face including the mouth and the eye. In order to reduce the number of false classifications, we plan to include more features to render it more effectively. The data collection process is ongoing; hence, we are considering the possibility to extend the proposed approach with more data as well.
The upcoming work should also consider the use of a RNN-based memory network with multi-hop attention modeling. Additionally, the ability to visualize the attention may bring a sense of interpretability to the model, as it will allow us to investigate which utterances in the conversational history provide important confidence cues for the current confidence level of the candidates. We have plans to use Different Contextual Window Sizes–Based Recurrent Neural Network (DCWS-RNNs) to increase the performance of the model with existing features. The current work includes image-by-image analysis of video data. In future, we plan to work with time series nature of video data.
The datasets presented in this article are not readily available due to company policies of TCS Research, Pune, India. The raw data can be made available under certain company policies. Requests to access the datasets should be directed to the corresponding authors.
Ethical review and approval was not required for the study on human participants in accordance with the local legislation and institutional requirements. The patients/participants provided their written informed consent to participate in this study. Written informed consent was obtained from the individual(s) for the publication of any potentially identifiable images or data included in this article.
SC: audio feature and the audio model, paper writing, and image creation. KF: video features, the video model, and paper writing. GD: guidance throughout the work and paper writing and correction, BS: reviewer of the whole work. SP: reviewer of the whole work.
Authors SC, GD and SP were employed by company TCS Research.
The remaining authors declare that the research was conducted in the absence of any commercial or financial relationships that could be construed as a potential conflict of interest.
All claims expressed in this article are solely those of the authors and do not necessarily represent those of their affiliated organizations, or those of the publisher, the editors, and the reviewers. Any product that may be evaluated in this article, or claim that may be made by its manufacturer, is not guaranteed or endorsed by the publisher.
The authors express their special thanks of gratitude to Vaishali Anil (Researcher, Tata Research Design and Development Centre) for helping in audio data annotation.
1https://github.com/iver56/audiomentations.
Adler, W. T., and Ma, W. J. (2018). Comparing Bayesian and Non-bayesian Accounts of Human Confidence Reports. PLoS Comput. Biol. 14, e1006572. doi:10.1371/journal.pcbi.1006572
Anderson, K. T., and Holloway-Libell, J. (2014). A Review of “Interviewing as Qualitative Research: A Guide for Researchers in Education and the Social Sciences. Editor I. Seidman (New York, NY: Teachers College Press), 178.
Audacity Team (2017). Audacity (r): Free Audio Editor and Recorder. version 2.2. 1. Available at: https://www.audacityteam.org (Accessed May 5, 2018).
Avni-Babad, D. (2011). Routine and Feelings of Safety, Confidence, and Well-Being. Br. J. Psychol. 102, 223–244. doi:10.1348/000712610x513617
Bennett, P. D., and Harrell, G. D. (1975). The Role of Confidence in Understanding and Predicting Buyers’ Attitudes and Purchase Intentions. J. Consum Res. 2, 110–117. doi:10.1086/208622
Black, K. D. (2007). Stress, Symptoms, Self‐Monitoring Confidence, Well‐Being, and Social Support in the Progression of Preeclampsia/Gestational Hypertension. J. Obstet. Gynecol. Neonatal Nurs. 36, 419–429. doi:10.1111/j.1552-6909.2007.00173.x
Bridger, R. S., Johnsen, S. Å. K., and Brasher, K. (2013). Psychometric Properties of the Cognitive Failures Questionnaire†. Ergonomics 56, 1515–1524. doi:10.1080/00140139.2013.821172
Calder, I., Picard, J., Chapman, M., O’Sullivan, C., and Crockard, H. A. (2003). Mouth Opening. J. Am. Soc. Anesthesiol. 99, 799–801. doi:10.1097/00000542-200310000-00009
Cech, E., Rubineau, B., Silbey, S., and Seron, C. (2011). Professional Role Confidence and Gendered Persistence in Engineering. Am. Sociol. Rev. 76, 641–666. doi:10.1177/0003122411420815
Chanda, S., and Acharya, A. (2016). Analysis of Multi Touch Interactive Device for a Cost Effective Architecture. Int. J. Comput. Appl. 140, 12–17. doi:10.5120/ijca2016909433
Chanda, S., and Chandra, P. (2016). “A Novel Approach for Content Based Image Retrieval in Context of Supervised Learning and Regression Analysis,” in 2016 International Conference on Computer, Electrical & Communication Engineering (ICCECE) (IEEE), 1–8. doi:10.1109/iccece.2016.8009541
Cook, N. D. (2002). Tone of Voice and Mind: The Connections between Intonation, Emotion, Cognition, and Consciousness. John Benjamins Publishing.
Craig, S. L., McInroy, L. B., Goulden, A., and Eaton, A. D. (2021). Engaging the Senses in Qualitative Research via Multimodal Coding: Triangulating Transcript, Audio, and Video Data in a Study with Sexual and Gender Minority Youth. Int. J. Qual. Methods 20, 16094069211013659. doi:10.1177/16094069211013659
Franklin, A. E., Burns, P., and Lee, C. S. (2014). Psychometric Testing on the Nln Student Satisfaction and Self-Confidence in Learning, Simulation Design Scale, and Educational Practices Questionnaire Using a Sample of Pre-Licensure Novice Nurses. Nurse Educ. Today 34, 1298–1304. doi:10.1016/j.nedt.2014.06.011
Gangamohan, P., Kadiri, S. R., and Yegnanarayana, B. (2016). “Analysis of Emotional Speech-A Review,” in Toward Robotic Socially Believable Behaving Systems. Editors A. Esposito, and C. L. Jain (Springer International Publishing), 205–238. doi:10.1007/978-3-319-31056-5_11
Gao, H., Yüce, A., and Thiran, J.-P. (2014). “Detecting Emotional Stress from Facial Expressions for Driving Safety,” in 2014 IEEE International Conference on Image Processing (ICIP) (IEEE), 5961–5965. doi:10.1109/icip.2014.7026203
Goette, L., Bendahan, S., Thoresen, J., Hollis, F., and Sandi, C. (2015). Stress Pulls Us Apart: Anxiety Leads to Differences in Competitive Confidence under Stress. Psychoneuroendocrinology 54, 115–123. doi:10.1016/j.psyneuen.2015.01.019
Guyer, J. J., Fabrigar, L. R., and Vaughan-Johnston, T. I. (2019). Speech Rate, Intonation, and Pitch: Investigating the Bias and Cue Effects of Vocal Confidence on Persuasion. Pers Soc. Psychol. Bull. 45, 389–405. doi:10.1177/0146167218787805
Hall, J. A. (1980). Voice Tone and Persuasion. J. Personal. Soc. Psychol. 38, 924–934. doi:10.1037/0022-3514.38.6.924
Heereman, J., and Walla, P. (2011). Stress, Uncertainty and Decision Confidence. Appl. Psychophysiol. Biofeedback 36, 273–279. doi:10.1007/s10484-011-9167-9
Horne, J. C., Lincoln, N. B., and Logan, P. A. (2017). Measurement of Confidence: the Development and Psychometric Evaluation of a Stroke-Specific, Measure of Confidence. Clin. Rehabil. 31, 1529–1537. doi:10.1177/0269215517705424
Horta, P., Demo, G., and Roure, P. (2012). Políticas de gestão de pessoas, confiança e bem-estar: estudo em uma multinacional. Rev. Adm. Contemp. 16, 566–585. doi:10.1590/s1415-65552012000400005
Irvine, A., Drew, P., and Sainsbury, R. (2013). Am I Not Answering Your Questions Properly?' Clarification, Adequacy and Responsiveness in Semi-structured Telephone and Face-To-Face Interviews. Qual. Res. 13, 87–106. doi:10.1177/1468794112439086
Jiang, X., and Pell, M. D. (2017). The Sound of Confidence and Doubt. Speech Commun. 88, 106–126. doi:10.1016/j.specom.2017.01.011
Joo, I.-T., and Choi, S.-H. (2018). Stock Prediction Model Based on Bidirectional Lstm Recurrent Neural Network. J. Korea Inst. Inf. Electron. Commun. Techn. 11, 204–208. doi:10.17661/jkiiect.2018.11.2.204
Judd, B. K., Currie, J., Dodds, K. L., Fethney, J., and Gordon, C. J. (2019). Registered Nurses Psychophysiological Stress and Confidence during High-Fidelity Emergency Simulation: Effects on Performance. Nurse Educ. Today 78, 44–49. doi:10.1016/j.nedt.2019.04.005
Kong, W., Dong, Z. Y., Jia, Y., Hill, D. J., Xu, Y., and Zhang, Y. (2017). Short-term Residential Load Forecasting Based on Lstm Recurrent Neural Network. IEEE Trans. Smart Grid 10, 841–851.
Kouali, D., and Hall, C. R. (2018). Effects of Imagery and Mindfulness on Anxiety, Confidence, Mental Well-Being, and Performance in Shot Putt Throwers: A Case Study. J. Emerging Sport Stud. 1, 5.
Lundh, F. (1999). An Introduction to Tkinter. Available at: www.pythonware.com/library/tkinter/introduction/index.html (Accessed February 23, 2021).
Mao, X., Marion, G., and Renshaw, E. (2002). Environmental Brownian Noise Suppresses Explosions in Population Dynamics. Stochastic Process. their Appl. 97, 95–110. doi:10.1016/s0304-4149(01)00126-0
Medsker, L. R., and Jain, L. (2001). Recurrent Neural Networks. Design and Applications 5. New York: CRC Press.
Mellalieu, S. D., Hanton, S., and Thomas, O. (2009). The Effects of a Motivational General-Arousal Imagery Intervention upon Preperformance Symptoms in Male Rugby Union Players. Psychol. Sport Exerc. 10, 175–185. doi:10.1016/j.psychsport.2008.07.003
Mellouk, W., and Handouzi, W. (2020). Facial Emotion Recognition Using Deep Learning: Review and Insights. Proced. Comput. Sci. 175, 689–694. doi:10.1016/j.procs.2020.07.101
Metallinou, A., Lee, S., and Narayanan, S. (2008). “Audio-visual Emotion Recognition Using Gaussian Mixture Models for Face and Voice,” in 2008 Tenth IEEE International Symposium on Multimedia (IEEE), 250–257. doi:10.1109/ism.2008.40
Meyniel, F., Sigman, M., and Mainen, Z. F. (2015). Confidence as Bayesian Probability: From Neural Origins to Behavior. Neuron 88, 78–92. doi:10.1016/j.neuron.2015.09.039
Millen, A. E., Hope, L., and Hillstrom, A. P. (2020). Eye Spy a Liar: Assessing the Utility of Eye Fixations and Confidence Judgments for Detecting Concealed Recognition of Faces, Scenes and Objects. Cogn. Res. Princ Implic. 5, 38–18. doi:10.1186/s41235-020-00227-4
Moritz, S., Gläscher, J., Sommer, T., Büchel, C., and Braus, D. F. (2006). Neural Correlates of Memory Confidence. Neuroimage 33, 1188–1193. doi:10.1016/j.neuroimage.2006.08.003
Mozos, O. M., Sandulescu, V., Andrews, S., Ellis, D., Bellotto, N., Dobrescu, R., et al. (2017). Stress Detection Using Wearable Physiological and Sociometric Sensors. Int. J. Neural Syst. 27, 1650041. doi:10.1142/s0129065716500416
Muda, L., Begam, M., and Elamvazuthi, I. (2010). Voice Recognition Algorithms Using Mel Frequency Cepstral Coefficient (mfcc) and Dynamic Time Warping (dtw) Techniques. J. Comput. 2 (3).
Ngo, D. C., Teoh, A. B., and Goh, A. (2006). Biometric Hash: High-Confidence Face Recognition. IEEE Trans. Circuits Syst. Video Technol. 16, 771–775. doi:10.1109/tcsvt.2006.873780
Nguyen, B. T., Trinh, M. H., Phan, T. V., and Nguyen, H. D. (2017). “An Efficient Real-Time Emotion Detection Using Camera and Facial Landmarks,” in 2017 Seventh International Conference on Information Science and Technology (ICIST) (IEEE), 251–255. doi:10.1109/icist.2017.7926765
Pajares, F., and Schunk, D. H. (2001). Self-beliefs and School success: Self-Efficacy, Self-Concept, and School Achievement. Perception 11, 239–266.
Pallier, G., Wilkinson, R., Danthiir, V., Kleitman, S., Knezevic, G., Stankov, L., et al. (2002). The Role of Individual Differences in the Accuracy of Confidence Judgments. J. Gen. Psychol. 129, 257–299. doi:10.1080/00221300209602099
Panda, A. (2014). “Psychoacoustic Model Compensation with Robust Feature Set for Speaker Verification in Additive Noise,” in The 9th International Symposium on Chinese Spoken Language Processing (IEEE), 629–632. doi:10.1109/iscslp.2014.6936706
Proskurnikov, A. V., and Tempo, R. (2017). A Tutorial on Modeling and Analysis of Dynamic Social Networks. Part I. Annu. Rev. Control. 43, 65–79. doi:10.1016/j.arcontrol.2017.03.002
Rao, K. S., and Koolagudi, S. G. (2015). Recognition of Emotions from Video Using Acoustic and Facial Features. Signal. Image Video Process. 9, 1029–1045. doi:10.1007/s11760-013-0522-6
Reynolds, D. A., Quatieri, T. F., and Dunn, R. B. (2000). Speaker Verification Using Adapted Gaussian Mixture Models. Digital Signal. Process. 10, 19–41. doi:10.1006/dspr.1999.0361
Saidin, S., Kadir, M. R. A., Sulaiman, E., and Kasim, N. H. A. (2012). Effects of Different Implant–Abutment Connections on Micromotion and Stress Distribution: Prediction of Microgap Formation. J. Dentistry 40, 467–474. doi:10.1016/j.jdent.2012.02.009
Scherer, K. R. (1986). “Voice, Stress, and Emotion,” in Dynamics of Stress. (Springer), 157–179. doi:10.1007/978-1-4684-5122-1_9
Schlüter, J., and Grill, T. (2015). “Exploring Data Augmentation for Improved Singing Voice Detection with Neural Networks,” in ISMIR, 121–126.
Siami-Namini, S., Tavakoli, N., and Namin, A. S. (2018). “A Comparison of Arima and Lstm in Forecasting Time Series,” in Proceedings of the 17th IEEE International Conference on Machine Learning and Applications (ICMLA) (IEEE), 1394–1401. doi:10.1109/icmla.2018.00227
Spegman, A. M., and Herrin, S. (2007). Chiropractic Interns’ Perceptions of Stress and Confidence. J. Chiropractic Educ. 21, 129–137. doi:10.7899/1042-5055-21.2.129
Stankov, L., and Lee, J. (2008). Confidence and Cognitive Test Performance. J. Educ. Psychol. 100, 961. doi:10.1037/a0012546
Tessler, R., and Sushelsky, L. (1978). Effects of Eye Contact and Social Status on the Perception of a Job Applicant in an Employment Interviewing Situation. J. Vocat. Behav. 13, 338–347. doi:10.1016/0001-8791(78)90060-x
Tripathi, S., Tripathi, S., and Beigi, H. (2018). Multi-Modal Emotion Recognition on Iemocap Dataset Using Deep Learning. arXiv.
Vukadinovic, D., and Pantic, M. (2005). “Fully Automatic Facial Feature point Detection Using Gabor Feature Based Boosted Classifiers,” in Proceedings of the International Conference on Systems, Man and Cybernetics (IEEE), 1692–1698.
Walker, L. O., and Cheng, C.-Y. (2007). Maternal Empathy, Self-Confidence, and Stress as Antecedents of Preschool Children’s Behavior Problems. J. Special. Pediatr. Nurs. 12, 93–104. doi:10.1111/j.1744-6155.2005.00098.x
Xiang, J., and Zhu, G. (2017). “Joint Face Detection and Facial Expression Recognition with mtcnn,” in 2017 4th International Conference on Information Science and Control Engineering (ICISCE) (IEEE), 424–427. doi:10.1109/icisce.2017.95
Ye, M., and Anderson, B. D. (2019). “Modelling of Individual Behaviour in the Degroot–Friedkin Self-Appraisal Dynamics on Social Networks,” in 2019 18th European Control Conference (ECC) (IEEE), 2011–2017.
Keywords: confidence classification, Bi-LSTM, audio analysis, video analysis, deep neural network, data collection
Citation: Chanda S, Fitwe K, Deshpande G, Schuller BW and Patel S (2021) A Deep Audiovisual Approach for Human Confidence Classification. Front. Comput. Sci. 3:674533. doi: 10.3389/fcomp.2021.674533
Received: 01 March 2021; Accepted: 26 August 2021;
Published: 13 October 2021.
Edited by:
Gelareh Mohammadi, University of New South Wales, AustraliaReviewed by:
Oliver Jokisch, Hochschule für Telekommunikation Leipzig, GermanyCopyright © 2021 Chanda, Fitwe, Deshpande, Schuller and Patel. This is an open-access article distributed under the terms of the Creative Commons Attribution License (CC BY). The use, distribution or reproduction in other forums is permitted, provided the original author(s) and the copyright owner(s) are credited and that the original publication in this journal is cited, in accordance with accepted academic practice. No use, distribution or reproduction is permitted which does not comply with these terms.
*Correspondence: Sushovan Chanda, YXJha2lzOTJAZ21haWwuY29t; Gauri Deshpande, Z2F1cmkuZGVzaHBhbmRlQHVuaS1hLmRlJiN4MDAwMjY7aGFpcnNw; Björn W. Schuller, c2FjaGluLnBhdGVsQHRjcy5jb20=
Disclaimer: All claims expressed in this article are solely those of the authors and do not necessarily represent those of their affiliated organizations, or those of the publisher, the editors and the reviewers. Any product that may be evaluated in this article or claim that may be made by its manufacturer is not guaranteed or endorsed by the publisher.
Research integrity at Frontiers
Learn more about the work of our research integrity team to safeguard the quality of each article we publish.