 Shamila Nasreen
 Morteza Rohanian
 Julian Hough
 Matthew Purver
95% of researchers rate our articles as excellent or good
Learn more about the work of our research integrity team to safeguard the quality of each article we publish.
Find out more
ORIGINAL RESEARCH article
Front. Comput. Sci. , 18 June 2021
Sec. Human-Media Interaction
Volume 3 - 2021 | https://doi.org/10.3389/fcomp.2021.640669
This article is part of the Research Topic Alzheimer's Dementia Recognition through Spontaneous Speech View all 21 articles
Alzheimer’s disease (AD) is a progressive, neurodegenerative disorder mainly characterized by memory loss with deficits in other cognitive domains, including language, visuospatial abilities, and changes in behavior. Detecting diagnostic biomarkers that are noninvasive and cost-effective is of great value not only for clinical assessments and diagnostics but also for research purposes. Several previous studies have investigated AD diagnosis via the acoustic, lexical, syntactic, and semantic aspects of speech and language. Other studies include approaches from conversation analysis that look at more interactional aspects, showing that disfluencies such as fillers and repairs, and purely nonverbal features such as inter-speaker silence, can be key features of AD conversations. These kinds of features, if useful for diagnosis, may have many advantages: They are simple to extract and relatively language-, topic-, and task-independent. This study aims to quantify the role and contribution of these features of interaction structure in predicting whether a dialogue participant has AD. We used a subset of the Carolinas Conversation Collection dataset of patients with AD at moderate stage within the age range 60–89 and similar-aged non-AD patients with other health conditions. Our feature analysis comprised two sets: disfluency features, including indicators such as self-repairs and fillers, and interactional features, including overlaps, turn-taking behavior, and distributions of different types of silence both within patient speech and between patient and interviewer speech. Statistical analysis showed significant differences between AD and non-AD groups for several disfluency features (edit terms, verbatim repeats, and substitutions) and interactional features (lapses, gaps, attributable silences, turn switches per minute, standardized phonation time, and turn length). For the classification of AD patient conversations vs. non-AD patient conversations, we achieved 83% accuracy with disfluency features, 83% accuracy with interactional features, and an overall accuracy of 90% when combining both feature sets using support vector machine classifiers. The discriminative power of these features, perhaps combined with more conventional linguistic features, therefore shows potential for integration into noninvasive clinical assessments for AD at advanced stages.
Alzheimer’s disease (AD) is a chronic neurodegenerative disorder of the brain and the most prevalent form of dementia. According to the National Institute of Neurological and Communicative Disorders and Stroke (NINCDS) and the Alzheimer’s Disease and Related Disorders Association (ADRDA), the most common symptoms include an inability to function at work or to perform usual activities, reduced cognitive capabilities (including impaired reasoning and visuospatial abilities, impaired ability to acquire and remember new information, impaired language function), and changes in behavior. Language deficit primarily occurs through a decline in lexical semantic abilities with anomia and word comprehension, object naming, semantic paraphasias, and a decrease in vocabulary and verbal fluency throughout the entire span of the disease (Bayles and Boone, 1982; Forbes-McKay and Venneri, 2005). Effects are also seen at the pragmatic level, including problems with maintaining and alteration in discourse planning (Chapman et al., 2002). At the phonetic and phonological level, speech in patients with AD is principally characterized by a low speech rate and by frequent hesitations (Hoffmann et al., 2010); however, syntactic processing is relatively preserved at the early stages of the disease (Kavé and Levy, 2003; Forbes-McKay and Venneri, 2005).
There is no single universally accepted medical test for the diagnosis of AD; instead, physicians typically use a variety of methods with the help of specialists (including neurologists) to make a diagnosis. This includes a combination of taking feedback from family members and carers asking about changed patterns in behaviors and thinking, getting family history, and mental status examination. NINCDS established the criteria for AD diagnosis and requires that the presence of cognitive impairment needs to be confirmed by neuropsychological testing for a clinical diagnosis of possible or probable AD (McKhann et al., 1984). Neuropsychological testing should be performed when the routine history and bedside mental status examination cannot provide a confident diagnosis (McKhann et al., 2011). Suitable neuropsychological tests include the Mini-Mental Status Examination (Folstein et al., 1975), Mini-Cog (Rosen et al., 1984), Addenbrooke’s Cognitive Examination–Revised (ACE-R) (Noone, 2015), Hopkins Verbal Learning Test (HVLT) (Brandt, 1991), and DemTect (Kalbe et al., 2004). Other routes include the use of blood tests and/or brain imaging (MRI) to check for high levels of beta-amyloid, an accumulation of protein fragments outside neurons, and one of the several brain changes associated with AD (Straiton, 2019).
Medical diagnoses based on the clinical interpretation of patients’ history, complemented by brain scanning (MRI), are time-consuming, stressful, costly, and often cannot be offered to all patients complaining about functional memory. The other alternatives are extensive neurological screening tests that are used for the early diagnosis of AD and dementia. These tests require experts to interpret the results, strongly relying on brief cognitive tests, and are performed in medical clinics, with patients required to visit the clinics for diagnosis. There is a need for new, less invasive approaches that improve and speed up the process of early diagnosis, reduce distress to patients, and place less emphasis on extensive and expensive formal testing. Currently, researchers are therefore investigating the impact of neurodegenerative impairment on patients’ speech and language, with the hope of deriving tests that are easier to administer and automate via natural language processing techniques (see, e.g., Fraser KC. et al., 2016).
Conversational dialogue is the primary means of human natural language use, so dialogue, and open domain dialogue in particular, might provide more generally applicable insights in studying the effects of AD on dialogue (Nasreen et al., 2019). Conversational analysis (CA) studies have traditionally looked in more detail at what characteristics of dialogue with dementia might be important (Jones et al., 2016; Elsey et al., 2015; Hamilton, 2005; Davis and Maclagan, 2010; Mirheidari et al., 2019; Perkins et al., 1998; Varela Suárez, 2018). Although some computational works explore the detection of dementia from speech and interaction (e.g. Luz et al., 2018; Broderick et al., 2018; Mirheidari et al., 2019), it is so far relatively limited, and there is little work on how dementia might affect interactional patterns in natural conversations (Addlesee et al., 2019).
AD is associated with many characteristic changes in language and speech not only with individual capabilities but also consequently in the interactive patterns observed in conversations. However, most language-based approaches so far use picture description or narrative tasks, or analyze individual speech, and thus miss conversational clues. This article examines the function of combining single-speaker disfluency features with interactional (dialogue) features to analyze the predictive power of these features in the diagnosis of AD. Extracts from the spontaneous speech of 15 AD and 15 non-AD patients from a conversational dataset, the Carolinas Conversation Collection (CCC), are analyzed to highlight the function of these interactional patterns, particularly pauses within a patient’s utterances and during turn changes with a conversation partner in natural conversation. As will be described, we show the value of both disfluency and interactional information in conversation, combining them to achieve an overall accuracy of 90% in the recognition of AD from dialogue data.
Much of the work to date in AD diagnosis has focused on properties of individual language, using various kinds of linguistic and acoustic features (Jarrold et al., 2014), or fluency, information content, and syntactic complexity (Fraser et al., 2016b; Fraser et al., a; de Lira et al., 2011). However, this is often studied within particular individual language tasks, usually within specific domains including picture description [the commonly used Cookie Theft picture description task from the Boston Diagnostic Aphasia Examination (Goodglass et al., 2001)], story narration task [e.g. The Dog story (Le Boeuf, 1976)], and semi-structured interviews [e.g. Autobiographical Memory Interview (Kopelman et al., 1990)]. Approaches to analysis and diagnosis therefore usually focus on aspects of individual language such as lexical, grammatical, and semantic features. Kavé and Dassa (2018), for example, examined dementia via a picture description task in the Hebrew language, using ten linguistic features, and showed that the AD group produced a smaller percentage of content words, more pronouns relative to nouns and pronouns, a lower type-token ratio, and more frequent words as compared with cognitively intact participants. Orimaye et al. (2017) built an automated diagnosis model using low-level linguistic features including lexical, syntactic, and semantic features (NGrams) from verbal utterances of Probable AD and control participants. In another line of research, Ahmed et al. (2013) argued that speech production, syntactic complexity, lexical content, semantic content, idea efficiency, and idea density are important features of connected speech that are used to examine longitudinal profiles of impairment in AD.
Fluency has also been shown to be indicative of AD. Patients with AD have difficulty performing tasks that leverage semantic information, and exhibit problems with verbal fluency and identification of objects (Pasquier et al., 1995; López-de Ipiña et al., 2013). The semantics and pragmatics of their language appear affected throughout the entire span of the disease more than syntax (Bayles and Boone, 1982). Patients with AD talk more gradually with longer pauses and invest extra time seeking the right word, which contributes to disfluency of speech (López-de Ipi et al., 2013). Abel et al. (2009) modeled patient speech errors (naming and repetition disorders) to the problem of AD diagnosis. Rohanian et al. (2020) used a deep multi-modal fusion model to show the predictive power of disfluency features in the identification of AD.
Pausing behavior is often associated with a lack of fluency, and several studies have suggested various temporal forms of speech analysis to identify AD. During speech production, pauses are often considered a hallmark of a patient’s lexical-semantic decline, one of the earliest symptoms of AD (Pistono et al., 2019b). Davis and Maclagan (2010) examined the silent pauses in a story retelling task with an older woman on two different occasions and found changes in pauses function signaling difficulty in word finding to difficulty in finding key component in the thread of a story. Forbes-McKay and Venneri (2005) compared the word-finding difficulties during the discourse in a picture description task among AD and healthy elderly subjects and stressed the fact that pauses, use of indefinite terms, and repetition are significantly more frequent in the AD group. According to Gayraud et al. (2011), AD patients produce more silence pauses than healthy controls but they found no significant difference in the duration of pauses. This study was performed on spontaneous speech data of an autobiographical task of AD and healthy persons and also identified that silent pauses occur more often outside syntactic boundaries and are followed by more frequent words. Singh et al. (2001) utilized different temporal measures including frequency of pauses, total pause time, mean duration of pause (MDP), standardized pause rate (SPR), standardized phonation time (SPT), and a few more to distinguish between AD and healthy control group by performing statistical analysis and discriminant analysis.
From a more linguistic perspective, silences in conversation have been analyzed in terms of distinct categories, with several terms coined to distinguish these, especially pauses at speaker changes or turn changes. Sacks et al. (1978) distinguished three kinds of silences in speech: pause (silence within the same speaker), gap (shorter silence at speaker change), and lapse (longer pause at speaker change). A normal gap duration is 200–1000 ms, as reported in the literature (Heldner and Edlund, 2010). Levinson (1983) employed a turn-taking system by integrating its forms and functions and categorized silence into three categories: within-turn silence (pause), inter-turn silence (gap or lapse), and turn silence (attributable silence). Researchers investigated turn silences within the framework of conversational analysis (CA) and Relevance Theory (RT) by taking into account the communicators’ psychological factors, i.e. why they resort to silence rather than other means of communication to avoid giving a dis-preferred response (Wang, 2019). Applying these ideas to Alzheimer’s discourse, Davis and Maclagan (2009) showed that both filled and silent pauses are keyed to functions within narration and within a conversation. They demonstrated that filled pauses (e.g. “uh” and “um”) serve as placeholders and hesitation markers while silent pauses serve as a function for word finding, planning a word, and narrative level as well as an indicator of decreases in other interactional and narrative skills. They utilized the convention of Crystal and Davy (2016) to distinguish between micro-pause (less than a second), average pause (less than 2 s), and long pause (longer than 2 s) with elderly people (speech rate decreases with age).
CA’s emphasis on conversation as a collaborative achievement demonstrates that examining interaction can provide more insight than separate analysis of the contributions of the two halves: each contribution to the conversation is built upon and responds to the partner’s previous contribution. Perkins et al. (1998) explored turn-taking behavior, repairs, and topic management in conversations with dementia, and demonstrated that cognitive deficits may compromise the ability to secure the conversational floor or hold onto it and that failure to maintain topics often leads to topic changes by the conversational partner. Jones et al. (2016) presented a CA study of dyadic communication between clinicians and patients during initial specialist clinic visits, while Elsey et al. (2015) highlighted the role of carer, looking at triadic interactions among a clinician, a patient, and a carer. They established differential conversational profiles that distinguish between nonprogressive functional memory disorder (FMD) and progressive neurodegenerative disorder (ND), based on the interactional behavior of patients responding to neurologists’ questions about their memory problems. Davis et al. (2014) examined how effective communication can be with the usage of strategies such as quilting, go ahead, and indirect questions between residents with dementia and their conversation partners, exploring various aspects including the impact of different types of questions, delayed responses, and the number of ideas in response using idea density.
Interactional features, therefore, promise one way to help alleviate the problems discussed in Section 1, by contributing to general, noninvasive methods of diagnosis that can be applied in natural everyday conversation, and some recent work has therefore investigated computational models using machine learning techniques. In a recent study, Mirheidari et al. (2019) performed an automated analysis for dementia detection with CA-inspired features, together with some language and acoustic features, achieving a classification accuracy of 90%. Luz et al. (2018) built a predictive model based on content-free features extracted from dialogue interactions from spontaneous speech in more natural settings using the CCC corpus of patient interview dialogues (Pope and Davis, 2011). They achieved promising results with an accuracy of 86% with only dialogue interaction-based features with less reliance on the content of task/dialogue. In a study building on the PREVENT Dementia project, de la Fuente Garcia et al. (2019) built a protocol for a conversation-based analysis study to investigate whether early behavioral signs of AD may be detected through dialogue interactions. Interactional patterns are considered among the current challenges to be addressed to make the spoken dialogue systems usable by older adults or frail patients (Addlesee et al., 2019). The purpose of this study is to investigate a new set of interactional features in AD conversations and evaluate their use in a computational model for AD classification.
This study aims to investigate the behavior of AD patients based on the interaction patterns, including repairs and pauses within utterances and between turns, observed in a corpus of dialogue. This is a post hoc study based on an existing dataset, the CCC corpus, collected and distributed by the Medical University of South Carolina (MUSC) (Pope and Davis, 2011). The CCC corpus is a digital collection of semi-structured interviews including time-aligned transcripts with audio and video for some of the samples. These conversations are not based on a fixed task like picture description, but rather are based on the general discussion on daily routine, health, and different occasions like Christmas. AD subjects were aged 65 years and older with their AD at relatively moderate stages, while non-AD subjects include unimpaired persons with 12 chronic diseases of similar age. Each patient is interviewed by a different interviewer, either a linguistics student or a person from the community center involved. The demographic and clinical variables available include age range, gender, occupation prior to retirement, diseases diagnosed, and level of education (in years). Patients and interviewers are anonymized for security and privacy reasons. Access to the data was granted after ethical review by the both Queen Mary University of London (via QMERC 2019/04 dated April 25, 2019) and MUSC. As this dataset includes only elder patients, with diagnosed dementia of Alzheimer’s type at moderate stage, it can only allow us to observe patterns associated with AD at a relatively advanced stage. This does not directly tell us whether these extend to early-stage diagnosis. However, it has the advantage of containing relatively free conversational interaction, compared to the more formulaic tasks and one-sided interaction available in corpora more commonly used in AD research, e.g. DementiaBank (Becker et al., 1994).
For this particular study, we use the transcript and audio recording from one dialogue conversation chosen randomly from each of a total of 30 patients: 15 AD diagnosed patients (4 male, 11 female) and 15 patients (4 male, 11 female) with other chronic diseases including diabetes, heart problems, arthritis, high cholesterol, cancer, leukemia but not AD; no patients were diagnosed as having breathing problems. These groups are selected to match the age range, to compare the different patterns of interaction, and to avoid bias. The demographic data of the participants are given in Table 1.
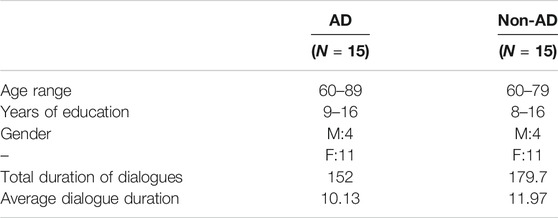
TABLE 1. Demographic data for AD and non-AD patients, with dialogue duration in minutes.
Detailed language use research helps us to find the indications of language impairment in AD and is a step toward the design of future clinical diagnostic tools. Disfluencies like self-repairs, pauses, and fillers are widespread in everyday speech (Schegloff et al., 1977). Disfluencies are usually seen as indicative of communication problems, caused by production or self-monitoring issues (Levelt, 1983). Individuals with AD are likely to deal with troubles in language and cognitive skills. Patients with AD speak more slowly and with longer breaks, and invest extra time seeking the right word, which in effect contributes to disfluency (López-de Ipi et al., 2013). The present research explores the disfluencies present in the speech of AD patients as they contribute to the severity of symptoms.
Self-repair disfluencies are typically assumed to have a reparandum–interregnum–repair structure, in their fullest form as speech repairs (Shriberg, 1994). A reparandum is a speech error subsequently fixed by the speaker; the corrected expression is a repair. An interregnum word is a filler or a reference expression between the words of repair and reparandum, often a halting step as the speaker produces the repair, giving the structure as in (1)
In the absence of reparandum and repair, the disfluency reduces to an isolated edit term. A marked, lexicalized edit term such as a filled pause (“uh” or “um”) or more phrasal terms like “I mean” and “you know” can occur. Recognizing these elements and their structure is then the task of disfluency detection.
Here, each word is either tagged as a repair onset tag (marking the first word of the repair phase), edit term (edit_terms), or fluent word by the disfluency detector. To get the most information from different types of disfluency, we split repairs between the broad classes of verbatim repeats (Rpt), substitutions (Sub), and deletes (Del):
1) “So (he + he) brings the fresh flowers …” Repeats
2) “(Someone said that + I heard someone out here say) it is getting quite cool outside, is it?” Substitution
3) “…and I looked [at + (uh)] and answered her question. . .” Deletes
We automatically annotated self-repairs using a deep-learning-driven model of incremental detection of disfluency developed by Rohanian and Hough (2020) and Hough and Schlangen (2017).1 It consists of a deep learning sequence model, a long short-term memory (LSTM) network, which uses word embeddings of incoming words, part-of-speech annotations, and other features in a left-to-right, word-by-word manner to learn a sequence model of, and predict, disfluency tags according to the structure in (1) and any other edit term words. The model is trained on the disfluency detection training section of the Switchboard corpus (Godfrey et al., 1992), a sizable multispeaker corpus of conversational speech. Rohanian and Hough (2020) reported the automatic disfluency detector achieves an F1-score accuracy on detecting the first word of the repair phase at 0.743 and an F1-score accuracy of 0.922 on detecting all edit term words on the Switchboard disfluency detection test data. We considered its accuracy adequate for our purposes. Automatically deriving the types of interest from the tagger’s output, we use four disfluency tags for patients (P) and four for interviewers (I) resulting in a total of eight disfluency features (details in Table 2).
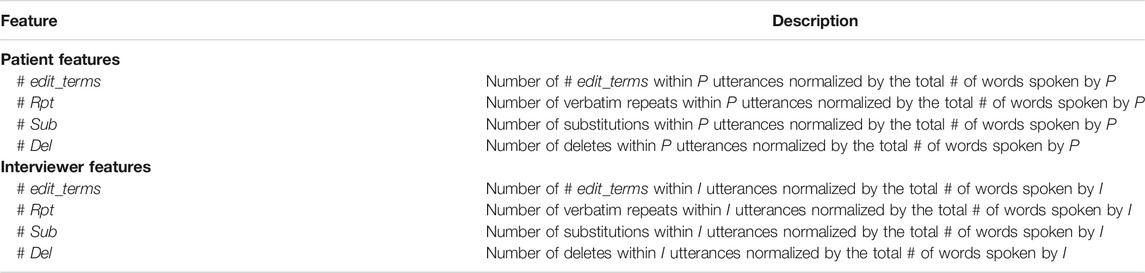
TABLE 2. The proposed disfluency feature set.
We consider any silence of at least 0.5 s length for this particular study. To categorize the silences, we employed Levinson (1983)’s definitions: pauses (silences within a single speaker’s turn), gaps and lapses (silences between speaker turns), and attributable silences (silences where speaker changes were expected but did not occur). We further categorized pauses into short pause (SP) and long pause (LP). An SP is a silence that occurs inside a single speaker turn, which we advised in the annotation protocol for average speech rates is greater than 0.5 s and less than 1.5 s; an LP is a longer pause within a single speaker turn, normally at least 1.5 s. We used guidelines for these thresholds rather than strict rules, because of different speech rates, and the judgment was left to annotators as to which category the pause fell into based on their perception. Both SPs and LPs may occur either at a transition relevance place (TRP) or not at a TRP, but no speaker change occurred. TRPs are junctures at which the turn could pass from one speaker to another.
For inter-turn silences and attributable silences, we did not use explicit time thresholds—annotators used their judgment when listening to the silences in the context of the conversation closely and categorized them according to the following definitions. We define a gap (GA) as a silence at a speaker change (i.e. turn boundary, with speaker change from I-P or vice versa P-I) which is not perceived as unusually long. Following Sacks et al. (1978), a lapse (LA) is then distinguished from a gap by not only being longer by “rounds of possible self-selection” but also involving a discontinuity in the flow of conversation. More precisely, annotators were told to annotate a silence as a lapse for unusually long silences in communication between two individuals, at TRPs, and after which one participant (usually the interviewer in this dataset) initiates a new topic (topic shift). The final category, attributable silence (AS), occurs when the current speaker selects another next speaker (by asking a question, by naming, or by looking at them), thereby putting the selected speaker under the obligation to speak next, but for one reason or another, that selected speaker does not respond; after the silence, the current speaker, therefore, continues the conversation (Elouakili, 2017). We define attributable silence as a longer silence after a question is asked from one party, no response from the other, and the first party then continues. Examples of these pause types with conversation samples are given in the Supplementary Materials. We also differentiated between speakers (patient P and interviewer I) by assigning speaker ID (SP_ID) to each labeled pause.
These annotations were performed using both transcripts and audio files using ELAN software (Sloetjes and Wittenburg, 2008).2 To check the inter-rater agreement, two annotators annotated the silences of at least 0.5 s in one randomly selected AD patient dialogue; both had a good knowledge of linguistics and were familiar with the annotation rules. We use a multi-rater version of Cohen’s κ (Cohen, 1960) as described by Siegel and Castellan (1988) to establish the agreement of annotators in terms of the overall agreement on all pause types, and also in terms of each pause type individually—see Table 3. We got an overall substantial agreement of κ = 0.66 for all categories of pauses. We got lower, though still moderately strong, κ values for LP and SP as these are pauses within the same speaker utterances and patients are older people with lower speech rates, making it more difficult to decide whether there is a relatively shorter or longer pause at certain lengths around the recommended boundary of 1.5 s.
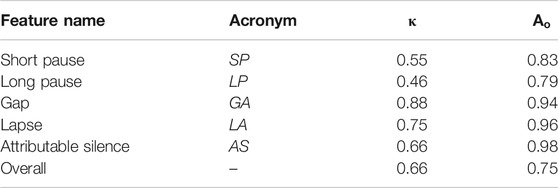
TABLE 3. Inter-annotator agreement: Cohen’s kappa (κ) and observed agreement (
Table 4 presents the extracted set of high-level interactional features to quantify the P–I interactions. There are 14 features for P and 12 features for I within the conversation and six features for overall conversation. This results in a set of 32 features representing the interaction within the natural dialogue conversations. We normalize the number of pauses within P or I by the number of words spoken by each respectively instead of normalizing by the number of utterances because it may be possible that when P speaks, they use a smaller number of words per utterance.
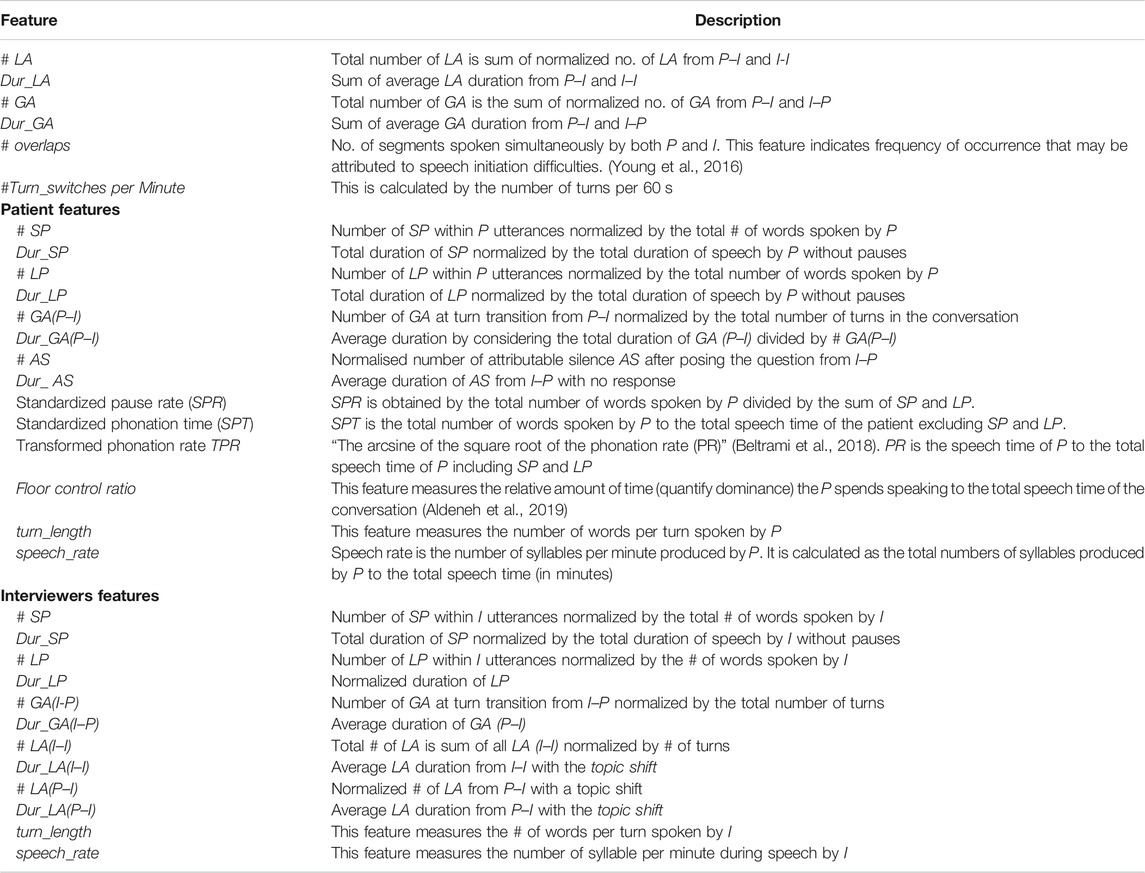
TABLE 4. The proposed interactional feature set.
To investigate the importance of each feature, we calculated the mean and standard deviation (SD) for each group (AD and non-AD). We chose a nonparametric independent sample test (Mann-Whitney U) on disfluency and interactional features due to the small sample size. We applied a nonparametric test as a two-tailed test for unpaired samples and unequal variances. The value
Table 5 shows the results of our analysis indicating a significant difference between AD and non-AD patient groups in terms of the rate of patient edit terms, repeats, and substitution per word. The rate of edit terms is significantly higher (p = 0.001) for AD patients with a mean of 0.029 (SD = 0.009) compared to 0.017 (SD = 0.006) for non-AD patients. Furthermore, the rate of verbatim repeat disfluencies is significant (p = 0.011) with a higher mean value for AD patients than non-AD patients (0.027 vs. 0.011). The findings also indicate a significant correlation between conditions and substitution disfluencies (p = 0.045), again with higher rates for AD patients vs. non-AD patients (0.012 vs. 0.008). Disfluencies are known to be symptomatic of communication difficulties. People who suffer from AD typically experience communication problems through weak conversation flow; it is reasonable that this will be observable through increased disfluencies in dialogue. The rate of delete disfluencies is, however, not found to be significantly different between AD and non-AD patients, possibly due to lack of data as they are very rare.
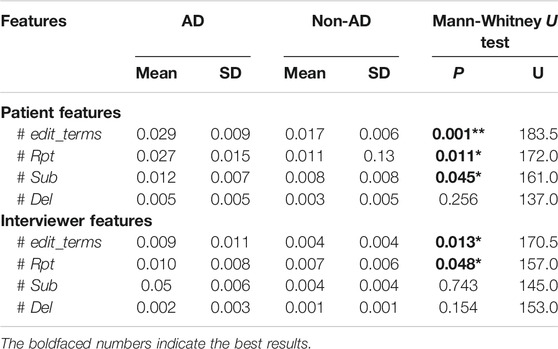
TABLE 5. Descriptive statistics (mean, SD) and statistical significance of the disfluency feature set. ** denotes highly significant at
As with patient features, we found that there is a significantly greater rate of edit terms in conversations with AD patients (p = 0.013) with a mean value of 0.009 (SD = 0.011) compared to 0.004 (SD = 0.004) for those with non-AD patients. The rate of repeat disfluencies (p = 0.048) is also significantly greater with a mean value of 0.010 (SD = 0.008) in interviewer speech with AD patients and a mean value of 0.007 (SD = 0.006) in interviewer speech with non-AD individuals. The rate of delete and substitution disfluencies are not found to be significantly different in interviewer speech with AD and non-AD patients. The fact that there are more disfluencies in the interviewer’s speech suggests that trouble with communication is shared between both participants, in line with the Conversation Analytic emphasis on collaborative achievement.
Table 6 presents the mean, SD, the p-values, and test statistic U (for Mann-Whitney U test) for each of the interactional features reported in Table 4. Significant differences between the AD and non-AD groups are marked in bold. Overall, the total number of GA and the total number of LA are found to be significantly higher in the AD group. There were fewer turn switches in AD dialogues with a mean of 2.544 compared to non-AD dialogues with a higher mean of 3.510. Figure 1 shows the distributions of three significant features with Figure 1A–C and Figure 1D representing the distribution of a nonsignificant feature, i.e. average duration of LA (P–I) between AD and non-AD groups. There is a great number of AS shown in Figure 1A with longer silences in the AD group than the non-AD group. The Y-axis shows the normalized duration while the X-axis shows the frequency of duration of the AS in each group.
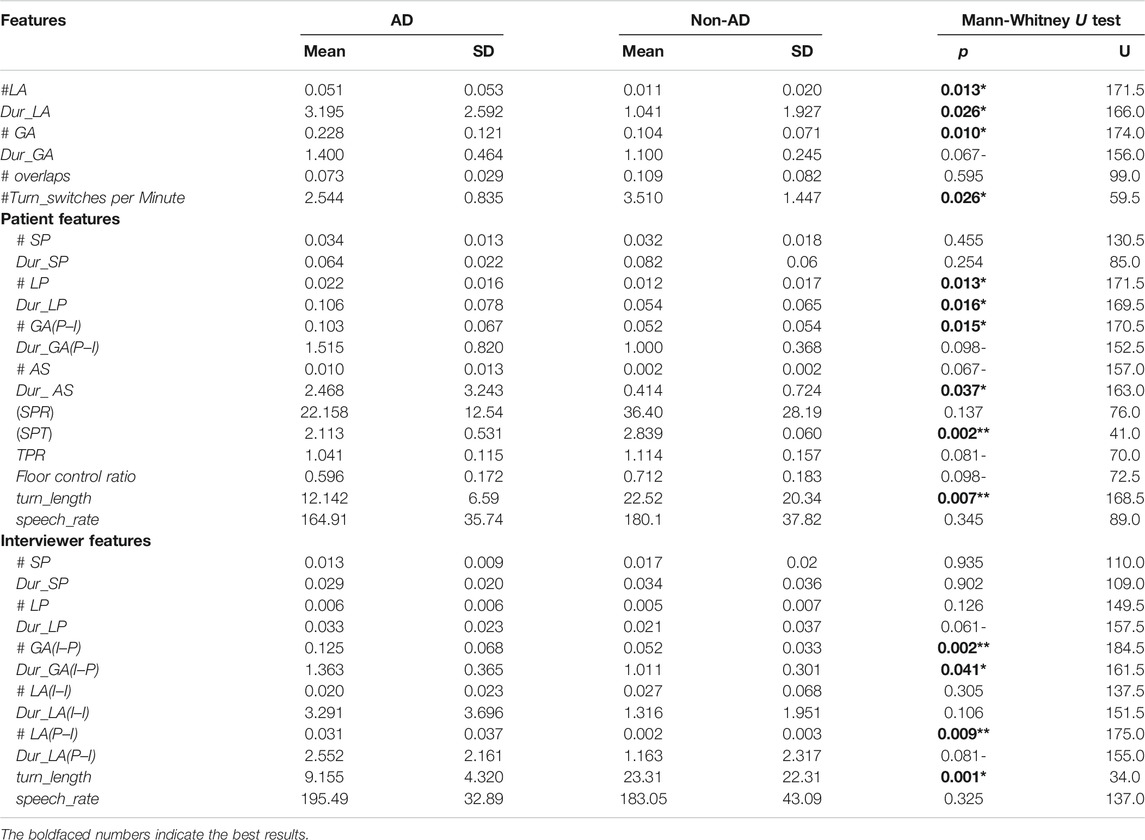
TABLE 6. Descriptive statistics (mean, SD) and statistical significance for our interactional feature set. We report p values obtained from Mann-Whitney U tests against a null hypothesis with no differences in distributions of these interactions on AD. ** denotes highly significant at
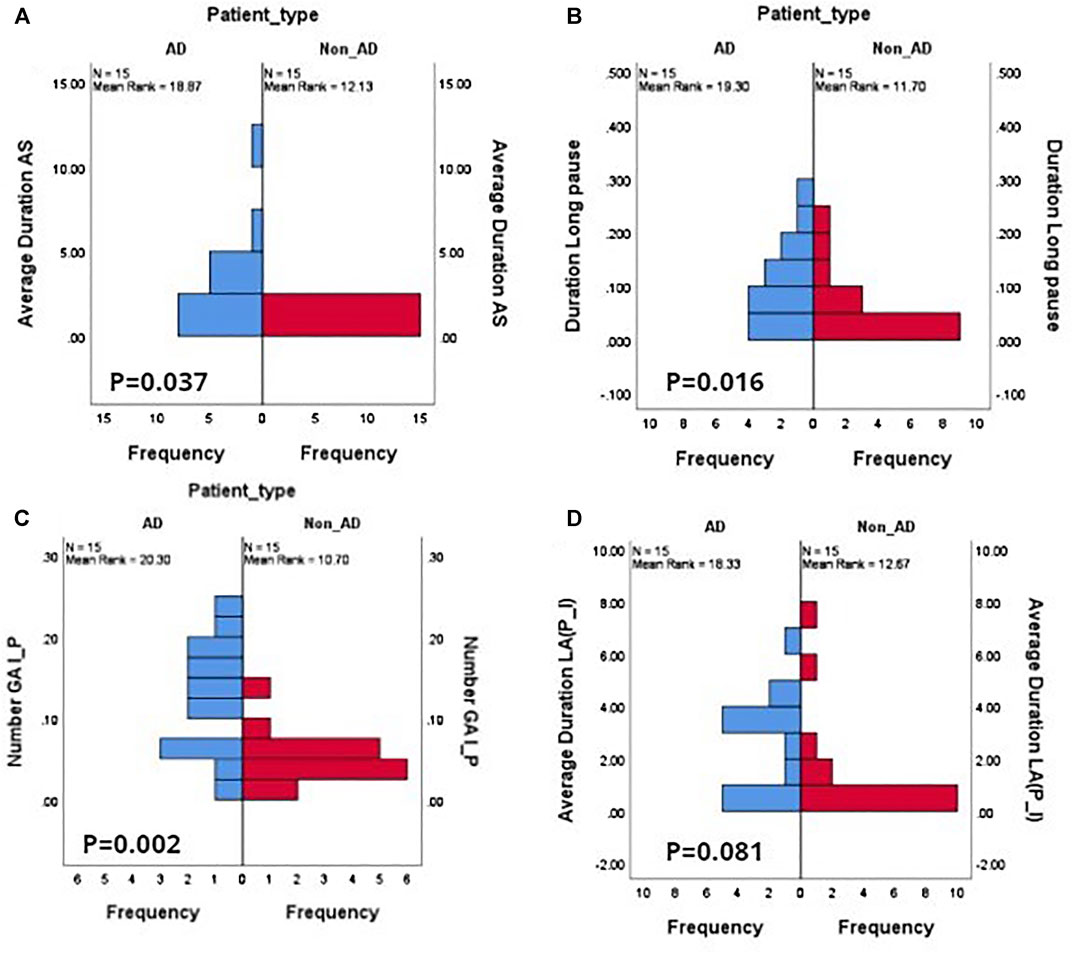
FIGURE 1. Feature value histograms for a selection of different pause types, showing differences in distributions between AD and non-AD dialogues. (A) Average duration of patient attributable silences AS; (B) duration of patient long pauses LP; (C) frequency distribution of interviewer-to-patient gaps GA(I–P); (D) duration of patient-to-interviewer lapses LA(P–I). (A), (B), (C) show distributions that are significant at
Our analysis found that the patient’s long pauses, duration of long pause, number of gaps from P–I, and duration of AS exhibit significant differences between AD and non-AD patient groups. Standardized phonation time of patients is significantly lower for AD patients, with a mean of 2.113 and variability of 0.531 for AD patients, and a mean of 2.839 for non-AD patients. Mean turn length is significantly higher at 22.52 s for non-AD patients compared to 12.142 for AD patients. These results suggest AD patients produce a greater number of pauses with a longer duration (>1.5 s), with slower speech rates than non-AD patients. These longer pauses within the patients’ utterances signal the difficulty in lexical search and semantic processing problems of finding key components related to events, places, etc. Additionally, the results suggest that AD patients exhibit higher variability in the time they either respond to questions by clinicians (resulting in high values for the number of gaps from I–P with larger delays) or they preferred attributable silences (mean duration of 2.468 for AD patients as compared to 0.414 for non-AD patients) instead of response. Notably, the floor control ratio is higher for non-AD patients, suggesting that AD patients hold the floor for less time compared to non-AD patients. The number of short pauses and duration of short pauses were not found to be significant between AD and non-AD patients, suggesting that short pauses are present naturally for breathing and for planning at the word or phrase level.
We found that the duration of LP is approaching significance with the mean 0.033 (SD = 0.023) for interviewers with an AD patient being higher than 0.021 (SD = 0.037) for those with non-AD patients. While only a tendency, we can tentatively conclude interviewers tend to insert longer silences while interacting with AD patients. The number of GA at I–P turn changes is significantly greater at turn exchanges with AD patients, with an average of 0.103 with a longer duration of 1.515 compared to the mean of 0.052 with a relatively shorter duration on average of 1.011 at turn exchanges with non-AD patients. The number of LA is also highly predictive among the two groups in the P–I turn changes. This means that the frequency of initiating a new topic by the interviewer after a considerable amount of silence after the patient has stopped speaking is higher in the AD group with a mean of 0.031, compared to 0.002 for non-AD patients. Finally, we found that the average turn length of interviewers interacting with AD patients is 9.155 s (SD = 4.320) compared to 23.31 s (SD = 22.31) with non-AD interactions, the mirror image of the case with patient turn length, where AD patients have far longer turns. This reveals that although the interviewers paused for longer periods within their turns while interacting with AD patients they also tend to speak for a shorter period of time.
Our study provides strong evidence that these interactional features including pause duration, gaps, lapse duration, presence of attributable silences, phonation time, and turn length seem to be sensitive markers of cognitive decline and also distinguish the AD group from the non-AD group.
Our final goal is to perform a classification task to assess whether AD prediction can be improved by integrating these inter-speaker interactional features with the intra-speaker disfluency features. We study the influence of these features using three machine learning classifiers: logistic regression (LR), support vector machines (SVM), and multilayer perceptron (MLP). We train each classifier using disfluency features, interactional features, and then by combining both. As the dataset is fairly small, we did not use separate splits of data for train and test, but rather follow a leave-one-out cross validation (LOOCV) scheme to get a better estimation of generalization accuracy. This process involves selecting one participant as a test and training the classifier on the remaining instances. This process is repeated until all instances have been selected for testing. The resulting accuracies on all folds are then aggregated into a final score. We build our models using the Scikit-Learn library (Pedregosa et al., 2011). We optimize our models with the following hyper-parameters: logistic regression with
Because our dataset is balanced, we reported our results in terms of accuracy, precision, recall, F1 score, and area under the ROC curve (AUC) as evaluation metrics. Precision measures what percentage of AD predictions correspond to real cases of AD (i.e. true positive divided by true positive and false positive). Recall measures the percentage of the actual AD occurrences that were detected (i.e. true positives divided by false negative plus true positive). F1 is the harmonic mean of precision and recall. AUC is commonly used for evaluating the performance of clinical diagnostic and predictive models (Zou et al., 2007). The ROC curve is used to show the trade-off between true positive rate (TPR, recall of the AD class) and false positive rate (FPR, one- recall of the non-AD class). Different clinical diagnostic scenarios may call for different TPR/FPR trade-offs, so the area under the curve (AUC) is used to express the overall level of diagnostic power; AUC greater than 0.75 is usually recommended for clinical purposes (Orimaye et al., 2017).
Table 7 provides the classification accuracy measures obtained using an individual group of features for combining both sets of features and when applying RFE top 15 selected features against all three classifier algorithms—LR, SVM, and MLP. It can be seen that the SVM outperformed both LR and MLP using disfluency features, interactional features, the combination of both, and with RFE-based top 15 features. Comparing the two feature sets, the best scores attained (with the SVM) are in fact identical with accuracies of 83%. However, by combining the two feature sets we achieved the highest accuracy of 90% with an F1 score of 0.90 with the SVM classifier. With LR, we achieved an accuracy of 77% with disfluency features, 80% with interactional features, and an increase in accuracy of roughly 7% when combining both feature sets with 87%.
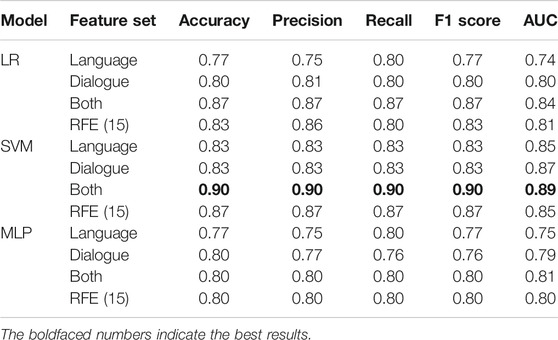
TABLE 7. Comparison of results for the AD classification with three classifiers with LOOCV.
MLP performed similarly to LR for disfluency features, with the same accuracy and F1 score; however, it performs slightly worse with the interactional features with an F1 score of 0.76 compared to LR and SVM. The combination of both feature sets showed an increase in the F1 score to 0.80. From the overall accuracy results with MLP, we can draw the conclusion that as MLP is a feed-forward neural network with more parameters and is a more data-hungry algorithm, the small number of samples and small feature space available for training is suboptimal.
Luz et al. (2018) used a probabilistic graphical model to classify AD patients in the CCC, using a slightly bigger dataset but with shorter dialogue conversations. They used only interactional features, and achieved comparable accuracies of 0.757 with LR and 0.837 with SVM classifiers; but did not investigate the role of different pause types, or the combination with fluency. Interestingly, they found that AD patients produce longer turns with more words and a higher speech rate; this contrasts with our results, in which AD patients produce fewer words than non-AD patients, with lower speech rates. We note that our findings align better with other research (Martínez-Sánchez et al., 2013; Kavé and Dassa, 2018; Pistono et al., 2019a; Themistocleous et al., 2020). Mirheidari et al. (2019) went a step further, combining CA-inspired interaction features including turn-taking behavior with some acoustic and language features, to achieve a classification accuracy of 90% similar to this study. However their approach is based on structured interviews with chosen topics and question types, in more clinical settings, and the use of features that directly target particular aspects of this structure (e.g. responses to particular setting-specific questions).
We found that disfluency tags help as features in AD detection. With these disfluency features, we got the highest accuracy of 83% with the SVM classifier, an identical accuracy to using interactional features. It is also worth examining the ROC AUC as it evaluates the different classifiers at different true positive rates and false positive rates. Figure 2A shows the ROC curve for the disfluency features with the SVM, with AUC 0.85, and with TPR 0.87 and FPR 0.20 at the chosen trade-off point. We have chosen this trade-off point as it gives maximum accuracy.
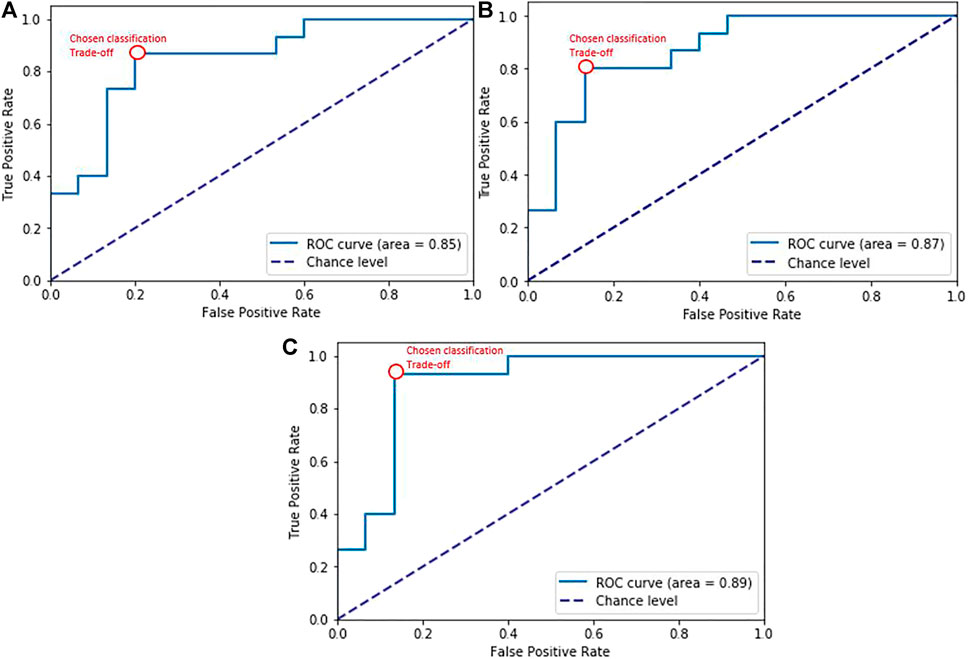
FIGURE 2. ROC curves for SVM classification experiments with (A) disfluency features, (B) interactional features, (C) the combined feature set. The red bubble shows the chosen trade-off point for the classification experiment results in Table 7.
Our interactional features produced promising results in distinguishing AD from non-AD with overall accuracy reaching 83% with the SVM classifier, showing that interactional patterns can provide salient cues to the detection of AD in dialogues. The results are further enhanced when adding with disfluency language feature reaching an accuracy of 90% and F1 score of 0.90. These results suggest that different pauses behavior not only indicate word-finding difficulties as AD progresses but also mark disfluency—in certain situations showing these were used to sustain social interaction as part of compensatory language (e.g. in the case of attributable silences). The corresponding ROC curve is shown in Figure 2B with AUC 0.87, and the chosen trade-off between TPR and FPR (0.80 vs 0.13). It can also be seen in Figure 2C that combining these interactional features with language features over dialogues had the effect of improving classification performance overall to AUC = 0.89, and improving trade-offs between true positive (0.93) and false positive rates (0.13), reducing the false positives while increasing the true positives.
We also reported the top 15 ranked features based on RFE as shown in Table 8. These features were also found to be significant in our statistical analysis (see Table 6). As with the statistical test-based features, Dur_AS has been picked and is ranked first as the most significant. This confirms the findings of Levinson (1983) concerning attributable silences and aligns with conversation analysis studies showing that individuals with cognitive decline resort to silence rather than other means of communication to avoid giving a dispreferred response. Among the other useful features, not only the number of gaps and lapses are found to be important but also the duration of gaps and lapses are observed differently in both groups. Turn switches per minute, patient turn lengths, and standardized phonation time are negatively correlated with AD patients with higher mean values for non-AD. That means turn switches happen more frequently, with longer turn lengths, in conversations with non-AD patients compared to AD individuals.
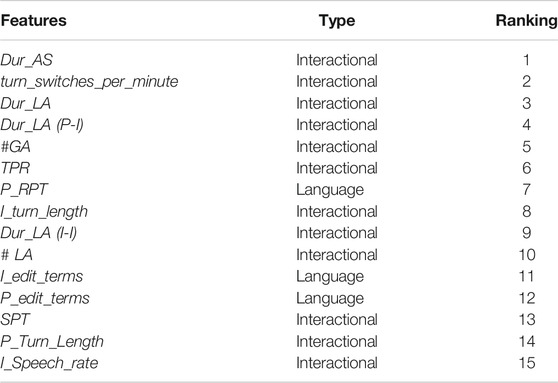
TABLE 8. Top 15 ranked features including disfluency and interactional features by RFE.
The results in Table 9 show that the SVM model with disfluency and interactional features attained the highest F1 score, precision, and recall for both AD and non-AD classes; we show both classes to provide a measure of both sensitivity (recall of the positive AD class) and specificity (recall of the non-AD class), standard measures for diagnostic tests. Note that due to the small dataset, differences between modes are indicative rather than statistically significant—see the confidence intervals in Table 9. The model achieves F1 scores of 0.90 for both the AD and the non-AD classes. Combining the disfluency features with interactional features particularly improves the recall of the AD class (i.e. improves the sensitivity of the classifier): the SVM model with both feature sets has a recall of 0.93, improving overused disfluency features alone at 0.87 and over the 0.80 achieved with interactional features. The specificity (recall for the non-AD class) was lowest when using language features only at 0.80, significantly lower than the 0.87 achieved by both using dialogue features alone and combining both feature sets. A balanced F1 score for both the AD and non-AD classes with all three combinations was achieved overall with our chosen threshold (0.84 vs 0.83 for disfluency features, 0.83 vs 0.84 with interactional features, and 0.90 for the combined feature sets). Depending on the application the model is used for, higher sensitivity or higher specificity for AD detection will be more or less desirable and this can be achieved in line with the AUC results shown in Figure 2, but as it stands using the combined feature set considerably increases the sensitivity of AD diagnosis over the most sensitive single feature set classifier (language features) while maintaining a high specificity on par with that achieved using dialogue features. We can observe the confusion matrices of predictions of the SVM Model with language, interactional, and combining both in Figure 3 which show the influence of (A) and (B) on (C).
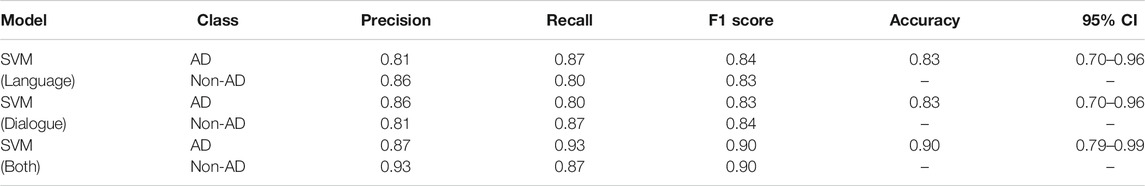
TABLE 9. Results of AD classification task with SVM classifiers with different feature sets, using LOOCV, with 95% confidence intervals (CI).
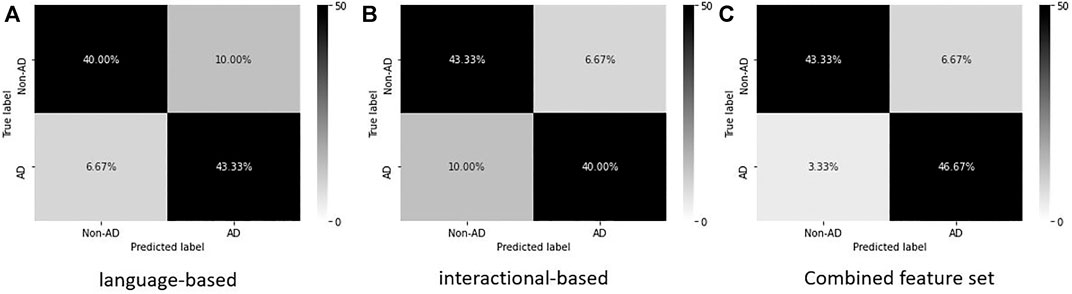
FIGURE 3. Confusion matrices for AD classification task with different feature sets.
This study investigated techniques for the diagnosis of dementia using features of disfluency and interaction in natural dialogue conversation, rather than relying on linguistic features alone, or either structured interviews or picture description tasks. We first performed a statistical analysis on the disfluency and interactional features. This analysis indicates that the relative frequency of edit terms, verbatim repeats, and substitution disfluencies are derived measures of disfluency in natural conversations that have different distributions in interviews with AD patients and those with non-AD patients. We also found that most of the interactional features, including attributable silences, gaps, lapses, turn lengths, and turn switches per minute, are sensitive cues in discriminating AD patients from non-AD patients. We also observed that in natural conversation not only are patients’ conversation characteristics affected but also distinctive patterns can be observed in interviewers’ or carers’ conversational behavior when talking to AD patients.
Our results showed the efficacy of detecting AD from dialogue using machine learning classifiers with different feature sets, which involved using them separately and then combining them. We obtained identical overall accuracy scores when both using disfluency features and interactional features separately at 83%. Disfluency features hold predictive power for the identification of AD, giving rise to a classifier with higher sensitivity (recall on AD = 0.87 vs 0.80), while the interactional dialogue features allow a higher specificity of AD detection (recall of non-AD = 0.87 vs 0.80). However combining the linguistic and interactional features obtained the most sensitive and specific automatic diagnostic classifier (recall on AD = 0.93, recall on non-AD = 0.87) with an overall accuracy of 90% on a balanced dataset, suggesting the potential benefits of integrating these features into clinical assessments via natural conversation as diagnostics.
We further plan to extend this study by introducing language markers associated with AD severity beyond disfluencies, as well as interactions between them. In particular, we want to use a more principled approach to lexical markers and measures of grammatical fluency. We also plan to use acoustic features, including prosodic, voice quality, and spectral features, which contribute to AD recognition and have higher correlations and interact with linguistic information. At the interactional feature level, we plan to include dialogue act (DA) tags that provide more of the speaker’s illocutionary content at the utterance level, including different tags for questions, answers types, clarification requests, signals of misunderstanding, and then use sequences of these DA tags to predict the disrupted communication patterns in natural conversations with AD patients.
While the results are promising, there are limitations to the data used in this study. The CCC only contains older patients with diagnosed dementia at moderate stages, so it can only allow us to observe the patterns associated with AD at a relatively advanced stage, and not whether these extend to early-stage diagnosis. To overcome this, we need to collect new datasets that contain spontaneous speech conversations with patients at different stages of dementia to analyze disfluencies and interactional features shown in early cognitive decline.
The data analyzed in this study is subject to the following licenses/restrictions: Due to privacy concerns of patient’s data, data is not publically available and was accessed after Ethical research approval (QMERC2019/04) in the present study. Requests to access these datasets should be directed to https://carolinaconversations.musc.edu/help/access.
The studies involving human participants were reviewed and approved by the Queen Mary Ethics of Research Committee, Queen Mary University of London, and the Medical University of South Carolina (MUSC). All subjects provided written informed consent in the original study by the MUSC. The patients/participants provided their written informed consent to participate in this study.
SN contributed to the design of the study, interpreted the data, took part in annotation protocol design, and performed statistical analysis on interactional features. MR performed disfluency feature analysis and performed classification experiments by combining disfluency and interactional features and helped in drafting the manuscript. MP contributed to the interpretation of data, helped in preparing the annotation protocol, supervised the whole process from annotation to statistical analysis to experimentation, and revised the manuscript critically. JH contributed to the interpretation of data, calculated the kappa agreement for pauses types, and revised the manuscript critically. All authors have contributed to this study and gave final approval for this manuscript and agree to be accountable for the content of the work.
MP was partially supported by the EPSRC under grant EP/S033564/1 and by the European Union’s Horizon 2020 programme under grant agreements 769661 (SAAM, Supporting Active Ageing through Multimodal coaching) and 825153 (EMBEDDIA, Cross-Lingual Embeddings for Less-Represented Languages in European News Media). The results of this publication reflect only the authors’ views and the Commission is not responsible for any use that may be made of the information it contains.
The authors declare that the research was conducted in the absence of any commercial or financial relationships that could be construed as a potential conflict of interest.
The contribution of Jorge Del-Bosque-Trevino to the annotation protocol design process and the annotations themselves is gratefully acknowledged.
The Supplementary Material for this article can be found online at: https://www.frontiersin.org/articles/10.3389/fcomp.2021.640669/full#supplementary-material
1The python implementation used is at https://github.com/clp-research/deep_disfluency
2https://archive.mpi.nl/tla/elan
Abel, S., Huber, W., and Dell, G. S. (2009). Connectionist Diagnosis of Lexical Disorders in Aphasia. Aphasiology 23, 1353–1378. doi:10.1080/02687030903022203
Addlesee, A., Eshghi, A., and Konstas, I. (2019). Current Challenges in Spoken Dialogue Systems and Why They Are Critical for Those Living with Dementia. arXiv preprint arXiv:1909.06644
Ahmed, S., Haigh, A.-M. F., de Jager, C. A., and Garrard, P. (2013). Connected Speech as a Marker of Disease Progression in Autopsy-Proven Alzheimer's Disease. Brain a J. Neurol. 136, 3727–3737. doi:10.1093/brain/awt269
Aldeneh, Z., Jaiswal, M., Picheny, M., McInnis, M., and Provost, E. M. (2019). Identifying Mood Episodes Using Dialogue Features from Clinical Interviews. arXiv preprint arXiv:1910.05115doi:10.21437/interspeech.2019-1878
Bayles, K. A., and Boone, D. R. (1982). The Potential of Language Tasks for Identifying Senile Dementia. J. Speech Hear. Disord. 47, 210–217. doi:10.1044/jshd.4702.210
Becker, J. T., Boller, F., Lopez, O., Saxton, J., and McGonigle, K. (1994). The Natural History of Alzheimer's Disease. Arch. Neurol. 51, 585–594. doi:10.1001/archneur.1994.00540180063015
Beltrami, D., Gagliardi, G., Rossini Favretti, R., Ghidoni, E., Tamburini, F., and Calzà, L. (2018). Speech Analysis by Natural Language Processing Techniques: a Possible Tool for Very Early Detection of Cognitive Decline? Front. Aging Neurosci. 10, 369. doi:10.3389/fnagi.2018.00369
Brandt, J. (1991). The Hopkins Verbal Learning Test: Development of a New Memory Test with Six Equivalent Forms. Clin. Neuropsychologist 5, 125–142. doi:10.1080/13854049108403297
Broderick, B. M., Tou, S. L., and Provost, E. M. (2018). TD-P-014: Cogid: A Speech Recognition Tool for Early Detection of Alzheimer’s Disease. Alzheimer’s Demen. 14, P191–P192. doi:10.1016/j.jalz.2018.06.2030
Chapman, S. B., Zientz, J., Weiner, M., Rosenberg, R., Frawley, W., and Burns, M. H. (2002). Discourse Changes in Early Alzheimer Disease, Mild Cognitive Impairment, and normal Aging. Alzheimer Dis. Associated Disord. 16, 177–186. doi:10.1097/00002093-200207000-00008
Cohen, J. (1960). A Coefficient of Agreement for Nominal Scales. Educ. Psychol. Meas. 20, 37–46. doi:10.1177/001316446002000104
Crystal, D., and Davy, D. (2016). Investigating English Style. (London: Routledge). doi:10.4324/9781315538419
Davis, B. H., and Maclagan, M. (2009). Examining Pauses in Alzheimer's Discourse. Am. J. Alzheimers Dis. Other Demen. 24, 141–154. doi:10.1177/1533317508328138
Davis, B. H., and Maclagan, M. (2010). Pauses, Fillers, Placeholders and Formulaicity in Alzheimer's Discourse. Fillers, Pauses and placeholders 93, 189–216. doi:10.1075/tsl.93.09dav
Davis, B., Maclagan, M., and D, S. (2014). “Exploring Interactions between Visitors and Residents with Dementia, with a Focus on Questions and the Responses They Evoke,” in The Routledge Handbook of Language and Health Communication (The city: Routledge), 344–360.
de la Fuente Garcia, S., Ritchie, C. W., and Luz, S. (2019). Protocol for a Conversation-Based Analysis Study: Prevent-Ed Investigates Dialogue Features that May Help Predict Dementia Onset in Later Life. BMJ open 9, e026254. doi:10.1136/bmjopen-2018-026254
de Lira, J. O., Ortiz, K. Z., Campanha, A. C., Bertolucci, P. H. F., and Minett, T. S. C. (2011). Microlinguistic Aspects of the Oral Narrative in Patients with Alzheimer's Disease. Int. Psychogeriatr. 23, 404–412. doi:10.1017/s1041610210001092
Elouakili, S. (2017). A Conversation Analysis Approach to Attributable Silence in Moroccan Conversation. Ire 5, 1–21. doi:10.5296/ire.v5i2.11369
Elsey, C., Drew, P., Jones, D., Blackburn, D., Wakefield, S., Harkness, K., et al. (2015). Towards Diagnostic Conversational Profiles of Patients Presenting with Dementia or Functional Memory Disorders to Memory Clinics. Patient Edu. Couns. 98, 1071–1077. doi:10.1016/j.pec.2015.05.021
Folstein, M. F., Folstein, S. E., and McHugh, P. R. (1975). "Mini-mental State". J. Psychiatr. Res. 12, 189–198. doi:10.1016/0022-3956(75)90026-6
Forbes-McKay, K. E., and Venneri, A. (2005). Detecting Subtle Spontaneous Language Decline in Early Alzheimer's Disease with a Picture Description Task. Neurol. Sci. 26, 243–254. doi:10.1007/s10072-005-0467-9
Fraser, K. C., Meltzer, J. A., and Rudzicz, F. (2016a). Linguistic Features Identify Alzheimer's Disease in Narrative Speech. J. Alzheimers Dis. 49, 407–422. doi:10.3233/JAD-150520
Fraser, K. C., Rudzicz, F., and Hirst, G. (2016b). “Detecting Late-Life Depression in Alzheimer’s Disease through Analysis of Speech and Language,” in Proc. CLPsych (San Diego, CA, USA: Association for Computational Linguistics)), 1–11.
Gayraud, F., Lee, H.-R., and Barkat-Defradas, M. (2011). Syntactic and Lexical Context of Pauses and Hesitations in the Discourse of Alzheimer Patients and Healthy Elderly Subjects. Clin. Linguistics Phonetics 25, 198–209. doi:10.3109/02699206.2010.521612
Godfrey, J. J., Holliman, E. C., and McDaniel, J. (1992). “Switchboard: Telephone Speech Corpus for Research and Development,” in Acoustics, Speech, and Signal Processing, IEEE International Conference on (IEEE Computer Society)), 1, 517–520.
Goodglass, H., Kaplan, E., Weintraub, S., and Barresi, B. (2001). The boston Diagnostic Aphasia Examination. (Philadelphia, PA: Lippincott, Williams & Wilkins)
Hamilton, H. E. (2005). Conversations with an Alzheimer’s Patient: An Interactional Sociolinguistic Study. New York: Cambridge University Press.
Hoffmann, I., Nemeth, D., Dye, C. D., Pákáski, M., Irinyi, T., and Kálmán, J. (2010). Temporal Parameters of Spontaneous Speech in Alzheimer's Disease. Int. J. speech-language Pathol. 12, 29–34. doi:10.3109/17549500903137256
Hough, J., and Schlangen, D. (2017). “Joint, Incremental Disfluency Detection and Utterance Segmentation from Speech,” in Proceedings of the 15th Conference of the European Chapter of the Association for Computational Linguistics, 1, 326–336.
Jarrold, W., Peintner, B., Wilkins, D., Vergryi, D., Richey, C., Gorno-Tempini, M. L., et al. (2014). “Aided Diagnosis of Dementia Type through Computer-Based Analysis of Spontaneous Speech,” in Proceedings of the Workshop on Computational Linguistics and Clinical Psychology: From Linguistic Signal to Clinical Reality, 27–37.
Jones, D., Drew, P., Elsey, C., Blackburn, D., Wakefield, S., Harkness, K., et al. (2016). Conversational Assessment in Memory Clinic Encounters: Interactional Profiling for Differentiating Dementia from Functional Memory Disorders. Aging Ment. Health 20, 500–509. doi:10.1080/13607863.2015.1021753
Kalbe, E., Kessler, J., Calabrese, P., Smith, R., Passmore, A. P., Brand, M., et al. (2004). Demtect: a New, Sensitive Cognitive Screening Test to Support the Diagnosis of Mild Cognitive Impairment and Early Dementia. Int. J. Geriat. Psychiatry 19, 136–143. doi:10.1002/gps.1042
Kavé, G., and Dassa, A. (2018). Severity of Alzheimer's Disease and Language Features in Picture Descriptions. Aphasiology 32, 27–40. doi:10.1080/02687038.2017.1303441
Kavé, G., and Levy, Y. (2003). Morphology in Picture Descriptions provided by Persons with Alzheimer’s Disease. J. Speech, Lang. Hearing Res. 46 (2), 52–341.
Kopelman, M., Wilson, B., and Baddeley, A. (1990). The Autobiographical Memory Interview (Manual). Bury St. Edmunds, England: Thames Valley Test Company.
Levelt, W. (1983). Monitoring and Self-Repair in Speech. Cognition 14, 41–104. doi:10.1016/0010-0277(83)90026-4
Levinson, S. C. (1983). Pragmatics. Cambridge UK: Cambridge University Press. doi:10.1017/cbo9780511813313
López-de-Ipiña, K., Alonso, J.-B., Travieso, C., Solé-Casals, J., Egiraun, H., Faundez-Zanuy, M., et al. (2013). On the Selection of Non-invasive Methods Based on Speech Analysis Oriented to Automatic Alzheimer Disease Diagnosis. Sensors 13, 6730–6745. doi:10.3390/s130506730
Luz, S., de la Fuente, S., and Albert, P. (2018). “A Method for Analysis of Patient Speech in Dialogue for Dementia Detection,” in Proceedings of the LREC 2018 Workshop Resources and Processing of Linguistic, Para-Linguistic and Extra-linguistic Data from People with Various Forms of Cognitive/psychiatric Impairments (RaPID-2). Editor D. Kokkinakis, 25–42.
Martínez-Sánchez, F., Meilán, J. J. G., García-Sevilla, J., Carro, J., and Arana, J. M. (2013). Oral reading Fluency Analysis in Patients with Alzheimer Disease and Asymptomatic Control Subjects. Neurología (English Edition) 28, 325–331. doi:10.1016/j.nrleng.2012.07.017
McKhann, G., Drachman, D., Folstein, M., Katzman, R., Price, D., and Stadlan, E. M. (1984). Clinical Diagnosis of Alzheimer's Disease: Report of the NINCDS-ADRDA Work Group* under the Auspices of Department of Health and Human Services Task Force on Alzheimer's Disease. Neurology 34, 939. doi:10.1212/wnl.34.7.939
McKhann, G. M., Knopman, D. S., Chertkow, H., Hyman, B. T., Jack, C. R., Kawas, C. H., et al. (2011). The Diagnosis of Dementia Due to Alzheimer's Disease: Recommendations from the National Institute on Aging-Alzheimer's Association Workgroups on Diagnostic Guidelines for Alzheimer's Disease. Alzheimer's Demen. 7, 263–269. doi:10.1016/j.jalz.2011.03.005
Mirheidari, B., Blackburn, D., Walker, T., Reuber, M., and Christensen, H. (2019). Dementia Detection Using Automatic Analysis of Conversations. Comp. Speech Lang. 53, 65–79. doi:10.1016/j.csl.2018.07.006
Nasreen, S., Purver, M., and Hough, J. (2019). “A Corpus Study on Questions, Responses and Misunderstanding Signals in Conversations with Alzheimer’s Patients,” in Proceedings of the 23rd Workshop on the Semantics and Pragmatics of Dialogue-Full Papers (London, United Kingdom: SEMDIAL), 13, 89–98. http://semdial.org/anthology/Z19-Nasreen semdial.
Noone, P. (2015). Addenbrooke's Cognitive Examination-III. Occmed 65, 418–420. doi:10.1093/occmed/kqv041
Orimaye, S. O., Wong, J. S., Golden, K. J., Wong, C. P., and Soyiri, I. N. (2017). Predicting Probable Alzheimer’s Disease Using Linguistic Deficits and Biomarkers. BMC Bioinformatics 18, 34. doi:10.1186/s12859-016-1456-0
Pasquier, F., Lebert, F., Grymonprez, L., and Petit, H. (1995). Verbal Fluency in Dementia of Frontal Lobe Type and Dementia of Alzheimer Type. J. Neurol. Neurosurg. Psychiatry 58, 81–84. doi:10.1136/jnnp.58.1.81
Pedregosa, F., Varoquaux, G., Gramfort, A., Michel, V., Thirion, B., Grisel, O., et al. (2011). Scikit-learn: Machine Learning in python. J. Machine Learn. Res. 12, 2825–2830.
Perkins, L., Whitworth, A., and Lesser, R. (1998). Conversing in Dementia: A Conversation Analytic Approach. J. Neurolinguist. 11, 33–53. doi:10.1016/s0911-6044(98)00004-9
Pistono, A., Jucla, M., Bézy, C., Lemesle, B., Men, J., and Pariente, J. (2019a). Discourse Macrolinguistic Impairment as a Marker of Linguistic and Extralinguistic Functions Decline in Early Alzheimer's Disease. Int. J. Lang. Commun. Disord. 54, 390–400. doi:10.1111/1460-6984.12444
Pistono, A., Pariente, J., Bézy, C., Lemesle, B., Le Men, J., and Jucla, M. (2019b). What Happens when Nothing Happens? an Investigation of Pauses as a Compensatory Mechanism in Early Alzheimer's Disease. Neuropsychologia 124, 133–143. doi:10.1016/j.neuropsychologia.2018.12.018
Pope, C., and Davis, B. H. (2011). Finding a Balance: The Carolinas Conversation Collection. Corpus Linguistics Linguistic Theor. 7, 143–161. doi:10.1515/cllt.2011.007
Rohanian, M., Hough, J., and Purver, M. (2020). Multi-Modal Fusion with Gating Using Audio, Lexical and Disfluency Features for Alzheimer's Dementia Recognition from Spontaneous Speech. Proc. Interspeech 2020, 2187–2191. doi:10.21437/Interspeech.2020-2721
Rohanian, M., and Hough, J. (2020). “Re-framing Incremental Deep Language Models for Dialogue Processing with Multi-Task Learning,” in Proceedings of the 28th International Conference on Computational Linguistics, 497–507.
Rosen, W. G., Mohs, R. C., and Davis, K. L. (1984). A New Rating Scale for Alzheimer's Disease. Am. J. Psychiatry 141, 1356–1364. doi:10.1176/ajp.141.11.1356
Sacks, H., Schegloff, E. A., and Jefferson, G. (1978). “A Simplest Systematics for the Organization of Turn Taking for Conversation**This Chapter Is a Variant Version of "A Simplest Systematics for the Organization of Turn-Taking for Conversation," Which Was Printed in Language, 50, 4 (1974), Pp. 696-735. An Earlier Version of This Paper Was Presented at the Conference on "Sociology of Language and Theory of Speech Acts," Held at the Centre for Interdisciplinary Research of the University of Bielefeld, Germany. We Thank Dr. Anita Pomerantz and Mr. Richard Faumann for Pointing Out to us a Number of Errors in the Text,” in Studies in the Organization of Conversational Interaction (Elsevier), 7–55. doi:10.1016/b978-0-12-623550-0.50008-2
Schegloff, E. A., Jefferson, G., and Sacks, H. (1977). The Preference for Self-Correction in the Organization of Repair in Conversation. Language 53, 361–382. doi:10.2307/413107
Shriberg, E. E. (1994). “Preliminaries To a Theory of Speech Disfluencies,”. Ph.D. thesis, Citeseer.
Siegel, S., and Castellan, N. (1988). Measures of Association and Their Tests of Significance. Nonparametric Stat. Behav. Sci. 13, 224–312.
Singh, S., Bucks, R. S., and Cuerden, J. M. (2001). Evaluation of an Objective Technique for Analysing Temporal Variables in Dat Spontaneous Speech. Aphasiology 15, 571–583. doi:10.1080/02687040143000041
Sloetjes, H., and Wittenburg, P. (2008). “Annotation by Category-Elan and Iso Dcr,” in 6th International Conference on Language Resources and Evaluation (LREC 2008).
Themistocleous, C., Eckerström, M., and Kokkinakis, D. (2020). Voice Quality and Speech Fluency Distinguish Individuals with Mild Cognitive Impairment from Healthy Controls. Plos one 15, e0236009. doi:10.1371/journal.pone.0236009
Varela Suárez, A. (2018). The Question-Answer Adjacency Pair in Dementia Discourse. Int. J. Appl. Linguistics 28, 86–101. doi:10.1111/ijal.12185
Wang, C. (2019). “A Relevance-Theoretic Approach to Turn Silence,” in 4th International Conference on Contemporary Education, Social Sciences and Humanities (ICCESSH 2019) (Atlantis Press)).
Young, J. A., Lind, C., and van Steenbrugge, W. (2016). A Conversation Analytic Study of Patterns of Overlapping Talk in Conversations between Individuals with Dementia and Their Frequent Communication Partners. Int. J. Lang. Commun. Disord. 51, 745–756.
Keywords: Alzheimer’s disease, spontaneous speech, disfluency, interaction, natural language processing, mental health monitoring
Citation: Nasreen S, Rohanian M, Hough J and Purver M (2021) Alzheimer’s Dementia Recognition From Spontaneous Speech Using Disfluency and Interactional Features. Front. Comput. Sci. 3:640669. doi: 10.3389/fcomp.2021.640669
Received: 11 December 2020; Accepted: 12 May 2021;
Published: 18 June 2021.
Edited by:
Fasih Haider, University of Edinburgh, United KingdomReviewed by:
Peter Garrard, St George’s, University of London, United KingdomCopyright © 2021 Nasreen, Rohanian, Hough and Purver. This is an open-access article distributed under the terms of the Creative Commons Attribution License (CC BY). The use, distribution or reproduction in other forums is permitted, provided the original author(s) and the copyright owner(s) are credited and that the original publication in this journal is cited, in accordance with accepted academic practice. No use, distribution or reproduction is permitted which does not comply with these terms.
*Correspondence: Shamila Nasreen, c2hhbWlsYS5uYXNyZWVuQHFtdWwuYWMudWs=
Disclaimer: All claims expressed in this article are solely those of the authors and do not necessarily represent those of their affiliated organizations, or those of the publisher, the editors and the reviewers. Any product that may be evaluated in this article or claim that may be made by its manufacturer is not guaranteed or endorsed by the publisher.
Research integrity at Frontiers
Learn more about the work of our research integrity team to safeguard the quality of each article we publish.