 Shanwen Zhang
 Jing Guo
 Zhen Wang
- 1School of Information Engineering, XiJing University, Xi'an, China
- 2School of Information Science Technology, Northwestern University, Xi'an, China
Weed species recognition is the premise to control weeds in smart agriculture. It is a challenging topic to control weeds in field, because the weeds in field are quite various and irregular with complex background. A recognition method of weed species in crop field is proposed based on Grabcut and local discriminant projections (LWMDP) algorithm. First, Grabcut is used to remove the most background and K-means clustering (KMC) is utilized to segment weeds from the whole image. Then, LWMDP is employed to extract the low-dimensional discriminant features. Finally, the support vector machine (SVM) classifier is adopted to identify weed species. The characteristics of the proposed method are that, (1) Grabcut and KMC are combined to remove the most of background and obtain the clean weed image, which can reduce the burden of the subsequent feature extraction; (2) LWMDP can project the high-dimensional original image into the low-dimensional subspace, such that the different-class data points are mapped as far as possible, while the within-class data points are projected as close as possible, and the matrix inverse computation is ignored in the generalized eigenvalue problem, thus the small sample size (SSS) problem is avoided naturally. The experimental results on the dataset of the weed species images show that the proposed method is effective for weed identification species, and can preliminarily meet the requirements of multi-row spraying of crop based on machine vision.
Introduction
In the process of crop growth, various weeds compete with crop seedlings for nutrients, water, light, and growth space, which severally affect the normal growth of crop seedlings and reduce the yield of crops. Chemical herbicides are an effective method to control weeds, and they are often extensively sprayed. At present, the main measure to control weeds is to spray chemical herbicide evenly in large area. In China, a large amount of herbicide is used for weeding every year. Because of the uneven and irregular distribution of weed growth in field, large-field uniform spraying not only causes pollution of environment, soil and water, but also results in a lot of pesticide residues in crop. Automated intelligent spraying herbicide system is a potentially cost-effective alternative to overcome large-scale spraying herbicides (Borregaard et al., 2000; EI-Faki et al., 2000). The key step to realize this system is to distinguish crops and weeds in field. With the development of computer and pattern recognition technologies, many weed recognition methods have been proposed (Xavier et al., 2011; Tannouche et al., 2015). Granitto et al. (2005) surveyed the existing computer-based automatic identification systems of weeds, applied a simple Bayesian approach and artificial neural network systems for seed identification. Slaughter et al. (2008) reviewed the current status of the general-purpose robotic system for weeding. Liu et al. (2010) proposed a weed/corn recognition method based on imbalanced weed/corn images. In the method, the morphological and wavelet-based energy features were extracted, and the various combinations of these features were utilized for weed/corn classification. Longchamps et al. (2010) explored the potential of corn-weed discrimination by UV-induced fluorescence of green plants, and employed linear discriminant analysis (LDA) to classify spectra on a species/hybrids basis. Tellaeche et al. (2011) designed an automatic weed identification system, which contains three processes, image segmentation, feature extraction and decision making. Ahmed et al. (2012) applied SVM to the automated weed control system, in which 14 features are extracted to characterize crop/weed images. The results indicated that SVM can achieve over 97% accuracy on the set of 224 test images. Romeo et al. (2012) proposed a crop row identification system in maize fields. In the system, a threshold is used to separate crops/weeds from the soil, stones, and others, then the crop row is detected based on image perspective projection, finally the expected crop lines in the images are determined. Herrera et al. (2014) proposed a weed type classification method based on shape descriptors and a fuzzy decision. In the approach, 7 Hu moments and 6 geometric shape descriptors are extracted from each weed image, and 4 decision-making algorithms are adapted to classify weeds/crops. Tannouche et al. (2016) proposed a shape descriptor based discriminant factor analysis (DFA) method for weed identification. The results indicated that the proposed method is effective to recognize two kinds of weed species. Zheng et al. (2017) presented a weed recognition method based on a post-processing algorithm. In the method, 9 optimal color features are selected by principal component analysis (PCA) to eliminate the effect of illumination and noise, and SVM classifier is used to recognize weed species from maize fields. Rojas et al. (2017) presented a weed/vegetable classification system, in which 10 texture features are extracted from gray level co-occurrence matrices (GLCM), and SVM is used to recognize weed types.
From the above analysis, the results of the existing weed recognition methods rely heavily on the extracted features, but it is difficult to extract the optimal features from each outdoor weed/crop image, thus many methods have not been applied to the weed intelligent identification system. The reasons are that the weeds/crops in fields are complex, various, irregular and overlapped, as shown in Figure 1. From Figure 1, it is seen that the weeds of the same class are different from each other in shapes, while the weed shapes of two different classes are very similar.
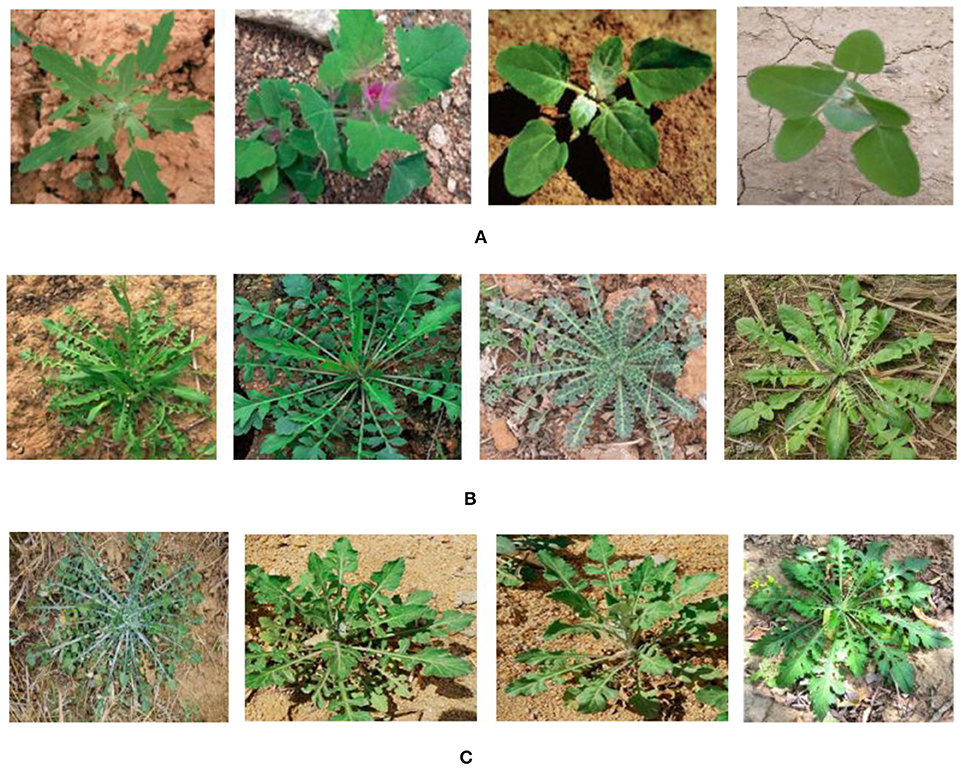
Figure 1. Weed images. (A) Gray vegetable. (B) Shepherd's-purse. (C) Hemistepta lyrata.
With the development of computer and image processing techniques, there are many effective nonlinear-data processing and pattern recognition methods (Kilde and Halgren, 2014; Ali et al., 2016; Wang et al., 2016; Li and Wong, 2017a,b, 2018; Bouguelia et al., 2018; Li et al., 2018a,b), which can be applied to image recognition. Manifold learning is a basic method in pattern recognition. It aims to find the intrinsic low-dimensional manifold structure in the high-dimensional space from the high-dimensional original images, and obtain the corresponding embedded projection to achieve the dimensional reduction or data visualization (Gou and Zhan, 2013). Many manifold learning algorithms have been presented for image classification, such as discriminant locality preserving projections (DLPP) (Lu et al., 2010), maximum neighborhood margin discriminant projection (MNMDP) (Gou et al., 2014), weighted neighborhood maximum margin discriminant embedding (WNMMDE) (Jiang et al., 2016), weighted maximum margin discriminant analysis (WMMDA) (Zheng et al., 2005), Local weighted maximum margin discriminant analysis (LWMMDA) (Wang et al., 2007) and supervised global-locality preserving projection (SGLPP) (Shao, 2019). From these manifold learning methods, it is found that they have two common steps, i.e., construct the local neighborhood structures of sample points on manifolds and map the sample points globally to a low-dimensional space by the local neighborhood structures. The differences between them mainly are that the different local neighborhood structures are constructed and the different low-dimensional embedding methods are used to establish the optimal problems by these local neighborhood structures. Grabcut is one of the popular image segmentation algorithms. It has obtained a lot of attention because it is not only promising to specific image with known information but also effective to the natural image without any pre-known information (Na et al., 2014). It is applicable for the background segmentation, but it is not effective to segment the complex multi-component image, such as weed image in field. K-nearest neighbor clustering (KNNC) (Vajda and Santosh, 2016) and K-means clustering (KMC) (Baghel and Jain, 2016) algorithms are two clustering algorithms, which are the representative of a typical target function clustering method based on prototype. Grabcut and KMC are often combined for the fast image segmentation (Jaisakthi et al., 2018). Recently, deep learning has been widely applied to various image classification tasks, and achieved considerable success, because of its ability to atomically learn the features for recognizing images, instead of extracting some handcraft features from each image. It has been used to solve the agricultural problems including weed recognition (Dyrmann et al., 2017; Tang et al., 2017; Sarker and Kim, 2019). However, it is not yet suitable to actual weed recognition in field, because it requires a large number of images and takes a long time even several days to train its parameters.
Motivated by Grabcut, KMC and LWMMDA, a weed recognition method is proposed by combining Grabcut, KMC and LWMMDA. Grabcut and KMC are integrated to segment the weed image from the whole image collected in fields, and LWMDP is utilized to find the projection matrix to map the high-dimensional original images into the low-dimensional discriminant subspace, which can not only preserve local intrinsic structure of the with-class data, but also obtain more discriminant features from the different-class data. The experiments are conducted to indicate its performance for weed species identification. The contributions of LWMDP are as follows:
(1) Grabcut is used to remove the most background and KMC is utilized to segment weeds from the whole image, which can obtain the clean weed images.
(2) LWMDP is employed to extract the discriminative features from the weed images by incorporating local information and class information of the data points.
(3) LWMDP is validated on the weed image dataset.
The rest of this paper is organized as follows. The related works are simply introduced in section Related works. LWMDP is proposed for the weed recognition in section Local weighted maximum discriminant projections. Section Experiments and analysis gives the experimental results and comparisons. Finally, this paper is concluded in section Conclusions.
Related Works
In this section, the related works are simply introduced, including Grabcut, K-means clustering, image segmentation method and Local weighted maximum margin discriminant analysis.
Grabcut
Grabcut aims to find the optimal solution by labeling foreground pixels, similar color clustering, boundary pixel punishment and iteration (Rother et al., 2014; Ren et al., 2017). It describes the distributions of the foreground and background pixels by using the Gaussian mixture model (GMM) of color image instead of the grayscale histogram model, and utilizes GMM for each channel of each pixel of the color image. Then, an iterative method is employed to minimize the energy function of the graph. The steps of Grabcut are given as follows.
Step 1: Select a rectangular box, where the external pixel of the rectangle is marked as the background and the internal pixel is marked as unknown.
Step 2: Initialize the segmentation parameters of GMM, where the unknown pixels are classified as foreground and the rest pixels as background.
Step 3: Create GMM for the initial foreground and background.
Step 4: Assign each pixel in the foreground class the most likely Gaussian component in the foreground GMM, the background class does the same.
Step 5: Update the parameters of GMM according to the set of pixels allocated in the previous step.
Step 6: Create the graph and perform graph segmentation to generate new pixel classification.
Step 7: Repeat Steps 4~6 until convergence.
K-means Clustering
K-means clustering (KMC) is one of the simplest clustering algorithms and is widely used in image segmentation (Cheng et al., 2013; Li et al., 2015). It divides all pixels of the image into several clusters by minimizing the sum of squares of the distance between the pixels in each cluster and the clustering center. The steps of KMC are as follows.
Step 1: randomly select k pixels as the initial clustering centers.
Step 2: compute the distances between the remaining pixels and each clustering center, and then classify each pixel into the class where the nearest clustering center is located.
Step 3: recalculate the average value of each class and update the clustering center of each class.
Step 4: calculate the criterion function by
where k is the number of clustering, is the i-th clustering center, Ci is the i-th cluster region.
Step 5: output the clustering result when the criterion function no longer changes and converges, otherwise go to Step 2 and continue.
In a color image, each pixel point corresponds to the position coordinate and color coordinate. KMC is used to cluster the image instead of clustering the position information, but clustering its color. Here the color adopts the RGB model, then the coordinate corresponding to each pixel in the picture is (x, y, r, g, b), where (x, y) represents the position information, and (r, g, b) represents the color information of the pixel. By clustering each pixel in the three dimensions of RGB to achieve the same color pixel in a cluster, the image can be segmented, and the image information can be extracted according to the color information for further image processing and recognition (Huang and Su, 2016).
Image Segmentation by Grabcut and K-means Clustering
From the above analysis, the segmentation of weed image in fields is carried out on the image component that contains most of the energy, including two stags.
Stage 1: Remove the main background from original image Figure 2A by GrabCut, as shown in Figures 2B,C, where Figure 2B is the selected region of interest, Figure 2C is the segmented image by Grabcut. From Figure 2C, it is found that the most of the background is removed.
Stage 2: Segment weed from Figure 2C by FMC, as shown in Figure 2D. In order to indicate the effective of the segmentation method by combining Grabcut and FMC, Figure 2E is the segmented image by only FMC.
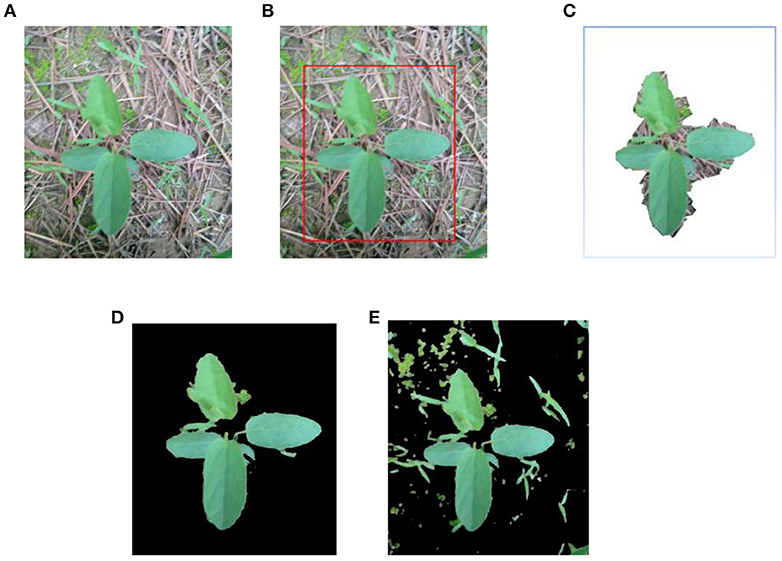
Figure 2. Weed image segmentation by combining Grabcut and KMC. (A) Original image. (B) Selected region. (C) Removing background by Grabcut. (D) Segmented weed by KMC. (E) Segmented weed by KMC.
Comparing Figures 2D,E, it is seen that the weed can be effectively segmented by combing Grabcut and FMC, and most of the background and noise are removed.
Local Weighted Maximum Margin Discriminant Analysis
Local weighted maximum margin discriminant analysis (LWMMDA) is one of the effective manifold learning methods to explore the underlying non-linear manifold for image recognition (Wang et al., 2007; Zhao et al., 2017). It arms to seek a mapping matrix to project the high-dimensional points into the low-dimensional subspace, such that the data points of the different classes are projected as far as possible while the data points of the same class are projected as near as possible (Zheng et al., 2005). It is described in detail ad follows,
Given n samples from C classes X = [x1, x2, …, xn], ci is the class label of the ith point xi, the number of samples in class c is nc, Y = [y1, y2, …, yn] is the corresponding projection of X, i.e., , A is the projecting matrix. Let be the ith sample in class c for . Then the optimal function of LWMMDA is defined as follows:
where α ∈ [0, 1] is an adjustable parameter to adjust the tradeoff between the first term and the second term, denotes the projection of , mc is the mean of belonging to class c, i.e., , is the weighted value between and , and is the weighted value between mc and md.
Two weighted matrices in Equation (2) are noted as follows:
where β as a regulator, is a positive parameter.
Maximizing J in Equation (2) means to maximize the first term and minimize the second term simultaneously. The projecting matrix is obtained to solve Equation (2).
Local Weighted Maximum Discriminant Projections
Inspired by WMMDA (Zheng et al., 2005), WNMMDE (Jiang et al., 2016), and LWMMDA (Wang et al., 2007), a supervised manifold learning algorithm namely local weighted maximum discriminant projection (LWMDP) algorithm is proposed. As the above supervised manifold learning algorithms, the goal of LWMDP is to seek a projecting matrix to maximize the distances between the different-class data points while minimize the distances between the within-class data points. Therefore, a heavy weight is put between any two data points according to the maximum margin criterion (Li et al., 2006). That is, after projecting, the within-class samples are close to each other, and different-class samples are far away. Then the different-class points are mapped far away, which is beneficial to pattern classification. One reasonable weighted matrix is defined as follows:
where is the k-nearest neighbors of xi, η is an adjustment parameter, which can be determined by cross-validation experiments.
Based on Equation (5), the objection function of LWMDP is designed as follows:
By some algebraic operations, Equation (6) can be derived as follows:
where , D is a diagonal matrix consisting of the elements of the column sum of W, S = D − W.
As for any two sample points xi and xj belonging to the k-nearest-neighbor, several conclusions can be drawn from Equations (5) and (6):
(1) If they are two within-class samples, they are given a positive weight to try to push xi and xj to close.
(2) If they are two between-class samples, they are set −1 to attempt to pull xi and xj far away. Note that the maximum of the function exp(-x) for any x is 1.
(3) Minimizing JJ is to make the intra-class samples as close as possible and make the inter-class samples as far as possible, which will preserve the local structure of each class.
(4) If any two intra-class samples xi and xjare close, then their corresponding yi and yj are close as well, since it will incur a heavy penalty if is large.
(5) if two inter-class samples xi and xj are far away, then yi and yj are far away, since a heavy penalty will be set if is small.
(6) Wij deemphasizes the atypical samples of the same class, so LWMDP is robust to the noise points and outliers.
(7) Preserving the structure of each class is beneficial to the discriminative classification task.
By Equation (7), the optimal function of LWMDP is defined as follows:
Similar to the classical discriminant projection manifold learning methods (Wang et al., 2007; Lu et al., 2010; Gou et al., 2014; Jiang et al., 2016), the projection matrix A can be obtained by solving the generalized eigen-value problem as follows:
Then, Equation (9) is carried out by the partial derivative of L(ai, λi) with respect to ai:
Set Equation (10) to zero, thus
Suppose {a1, a2, …, ad} are the d eigenvectors corresponding to the d smallest eigenvalues, where λ1 ≤ λ2 ≤ ... ≤ λd. The mapping matrix A is denoted as A = [a1, a2, ..., ad], then any data point x is mapped into a low-dimensional feature vector as follows:
From the above equations and the derivation process, it is known that the key problem of LWMDP is to construct the k-nearest-neighbor weighted graph to integrate the class information and local information into only one weighted matrix, and to make use of the between-class scatter to enhance discriminant ability of LWMDP.
From the above analysis, the steps of the LWMDP based weed species recognition method are given as following (Shao, 2019):
Step1: Construct a k-nearest-neighbor graph G = (V, E) by the training set X.
Step2: Calculate the discriminant k-nearest-neighbor weight matrix by Equation (5).
Step3: Optimize the eigenvalues via the generalized eigenvalue problem in Equation (8), obtain d eigen-vectors corresponding d minimizing eigenvalues.
Step4: Construct the projection matrix A = [a1, a2, …, ad].
Step5: Project the data points into the low-dimensional feature vectors by Equation (12), including training data points and test data points.
Step6: Classify the low-dimensional feature vectors of the test samples using a certain classifier to decide their class labels.
Experiments and Analysis
To validate the performance of the LWMDP based weed recognition method, a lot of experiments are implemented on a weed image dataset, and compared with four state-of-the-art weed identification algorithms: weed type recognition based on shape descriptors and a fuzzy decision-making method (SDFDM) (Herrera et al., 2014), Classification of crops and weeds from digital images: A support vector machine approach (DISVM) (Ahmed et al., 2012), maize/weed classification by color indices with support vector data description in outdoor fields (CISVDD) (Zheng et al., 2017), and weed identification by SVM based texture feature classification (SVMTFC) (Rojas et al., 2017). To further indicate the classification ability of LWMDP, it is compared with LWMMDA (Wang et al., 2007). We also compare the proposed method with the convolutional neural network (CNN) based weed identification method (Tang et al., 2017). All experiments are conducted by Intel Xeon E5-2643v3 @3.40GHz CPU, 64GB RAM, NVidia Quadro M4000 GPU, 8GB of video memory, by CUDA Toolkit 9.0, CUDNN V7.0, Matlab 7.0, Windows 7 64bit operating system.
Dataset
Weeds are everywhere in crop seedling growth stage. In North China, 8–10 days after crop sowing is the most concentrated period in which various weeds break through the soil. Amount of weeding is about 80% of the total amount in 12–15 days and 95% in 25 days. Weeding in time can guarantee crop yield. Weeds are at the seedling growth stage 7 to 15 days after crop seedling growth. It is the key period for weeding. At present, crop test fields are machine-seeded with fixed row spacing of 30 to 50 cm, and intelligent weeding is widely used to control weeds. Spraying selectively herbicides is an effective means of weeding, which can mainly aim at the weeds between the crop rows. Therefore, it is easily collect the weed images between the rows of crop seedlings without crop seedling images. Considering fully the natural scenes, we collected the weed images in sunny, cloudy and multi-angles. To overcome the perspective view problem and improve the spatial resolution, the photographic equipment was set in vertical position to the crop field at 25 to 30 cm, and the visible scene covered an area of 50 × 50 cm2 above the region of interest in fields (Tannouche et al., 2016). The acquisition equipment is Canon SLR digital camera, model IXUS1000HS (EF-S36-360mmf/3.4-5.6 ISSTM), focal length is set to automatic intelligent focusing, and image resolution is 640 × 480 pixels. Eight kinds of 1,600 weed images per plant in the crop field were collected when crop grew to 3 to 8 leaves, forming a weed image dataset, including Bromus, Sargassum spinosa, Curly ear with sticky hair, Gray vegetable, Affiliated vegetables, Sowing Niang Peng, Mud Hu Cabbage and Shepherd's purse. All images were used to train and test weed identification method. Thirty weed images of Shepherd's purse are shown in Figure 3A, 8 kinds of weed images per weed species in crop fields are shown in Figure 3B. All original images are segmented by K-means clustering algorithm and obtained the segmented weed images, as shown in Figure 3C. In order to indicate the segmentation effectiveness by Grabcut and FMC, the segmented color weed images are obtained by the function cat() in MATLAB 7.0, as shown in Figure 3C.
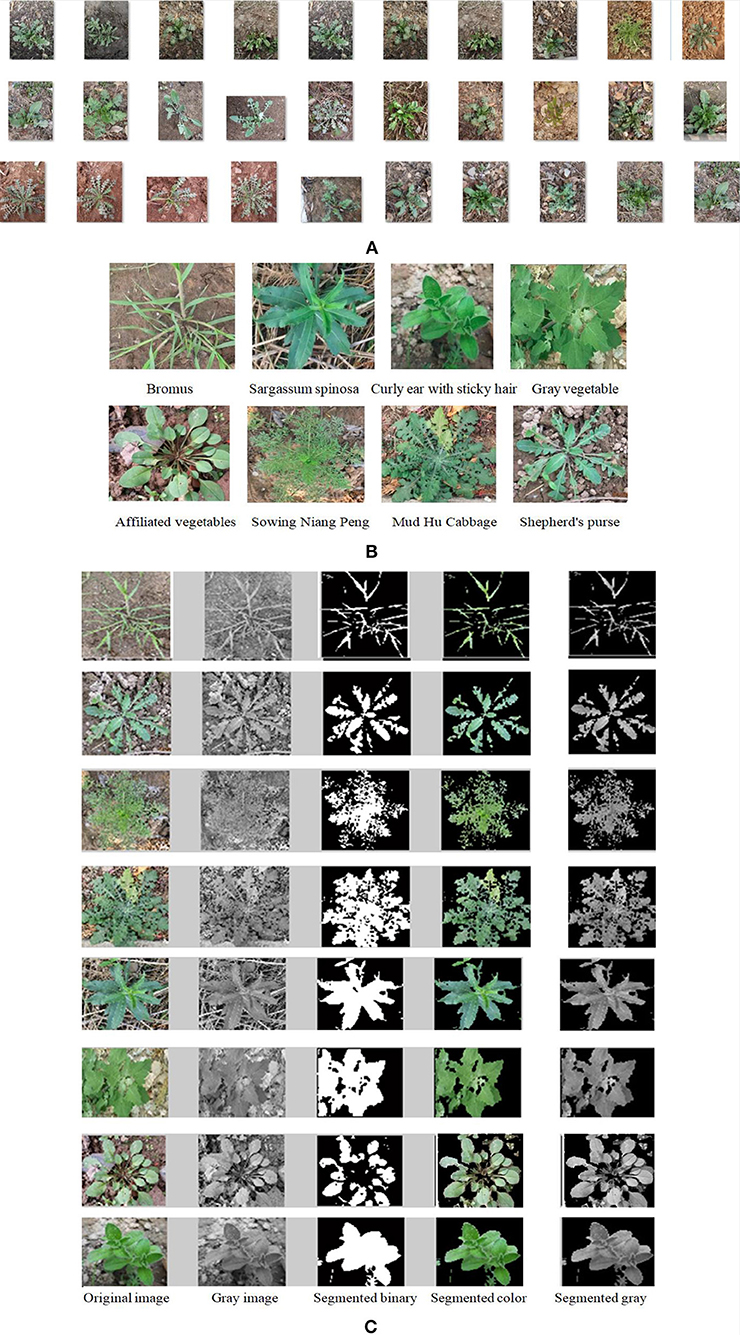
Figure 3. Weed image segmentation samples. (A) 30 original weed images of Shepherd purse. (B) 8 kinds of weed images. (C) Segmenting weed images.
Because different kinds of weeds and crop seedling are common green, their image color characteristics are not suitable for classifying features. So, the gray images of the segmented color weeds in Figure 3C are the input data of LWMMDE for weed identification.
Experimental Results
From Figures 3A,B, it is seen that the original weeds in the dataset are color images with various orientations, shapes, colors, sizes, illumination with complex background. Because the color characteristic of weed images is unstable and most of the classical weed recognition methods are in general sensitive to the orientation and scaling of the weed image, we firstly segment each weed image from the complex background by combining Grabcut and FMC, and then normalize the segmented gray weed image in unified size of 400 × 400 pixels, and then is concatenated into a 4,096-dimensional vector as the input data for weed recognition by LWMDP. The experimental steps of the proposed approach consists of the following five stages: (1) remove the background from the whole weed image by Grabcut; (2) segment weed image by FMC; (3) transform the color image into gray-scale image; (4) reduce the dimensionality of the gray-scale image by LWMDP; and (5) recognize the weed species by SVM. The flowchart of the proposed method is shown in Figure 4.
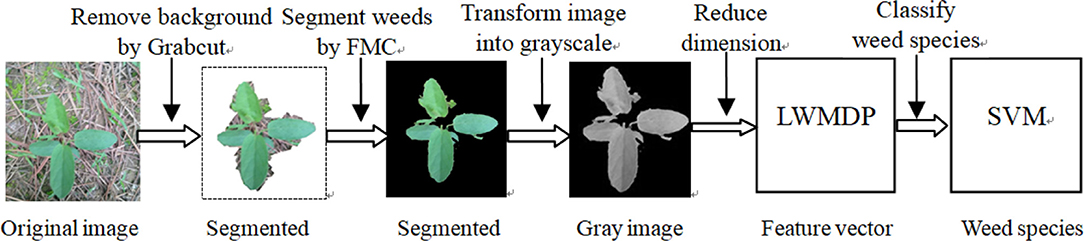
Figure 4. The flowchart of the proposed method.
To improve the convergence of LWMDP, principle component analysis (PCA) is employed to reduce the dimensionality of the extracted low-dimensional feature vector by remaining 98% image energy (Lu et al., 2010; Gou et al., 2014; Jiang et al., 2016). Five-fold cross validation algorithm is used to evaluate the recognition rate in the following experiments. The SVM classifier is adopted to recognize the weed species. The parameters of SVM are selected when the recognition rate achieves the highest accuracy rate. There are three important parameters in LWMDP that can be obtained experimentally, i.e., k-nearest neighbor number k, adjustment parameter η, and reduction dimensionality d. The experiment results of the face recognition indicated that the recognition rate is not sensitive to η when it is large enough (Li et al., 2009), where η is set as 200. Figure 5 shows the maximum recognition rates with varying k. Figure 6 shows the maximum recognition rates via the reduction dimensionality.
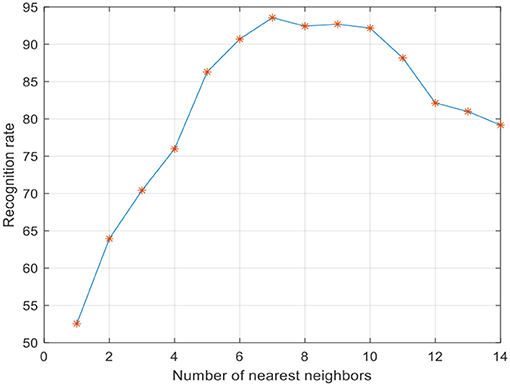
Figure 5. Recognition accuracy rates via the number of the k-nearest neighbors.
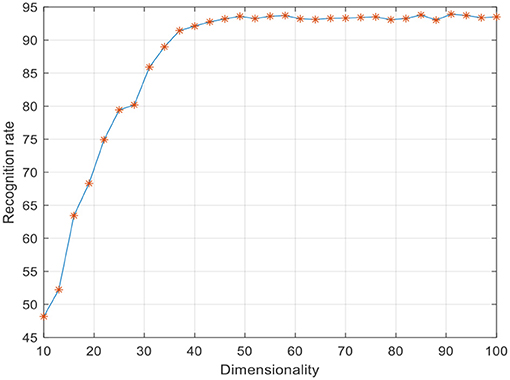
Figure 6. Recognition accuracy rates via the reduction dimensionality, where k = 7.
From Figures 5, 6, we can simply set k = 7 and d = 80 in the following experiments. To show the discriminant performance and separability of LWMDP, 50 original images of gray-gray vegetable and shepherd's purse are mapped into a 2D feature subspace by LWMMDA and LWMDP, respectively, as shown in Figure 7. From Figure 7, it is found in the 2D-visualization that the data points of the same class are clustered very closely in LWMDP subspace compared to LWMMDA. Figure 7 indicates that LWMDP can minimize the within-class distances and maximize the between-class distances. So, LWMDP has more discriminate performance than LWMMDA.
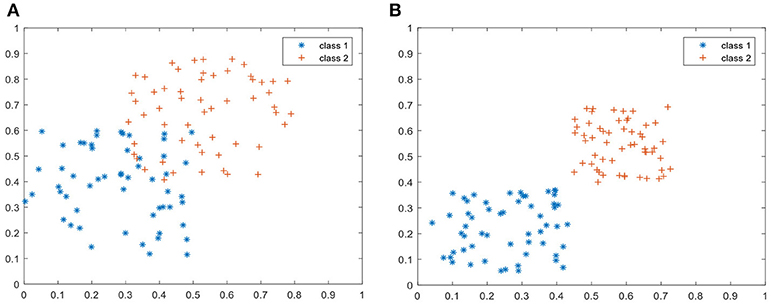
Figure 7. 2D-visualization by LWMMDA and LWMDP on two kinds of weed images. (A) LWMMDA. (B) LWMDP.
The 5-fold-cross-validation experiments are carried out on the gray-scale image dataset of the segmented weed images, and the average results are recorded as the final recognition accuracy rate. To obtain the unbiased estimation results from the certain random selection of training/testing set, the 5-fold cross validation experiments are repeated independently 50 times, and the average recognition rates of 50 runs with 95% confidence are regarded as the recognition results, as shown in Table 1. The experimental results by SDFDM, DISVM, CISVDD, SVMTFC, LWMMDA and CNN are also given in Table 1 for comparison. PCA is used to reduce the dimensionality of the extracted feature vectors by LWMMDA and LWMDP to avoid the small-size-sample problem.
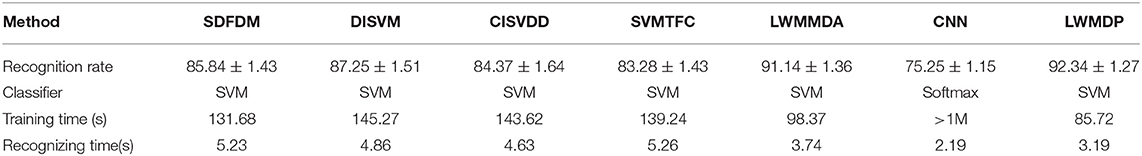
Table 1. Average recognition rates and standard deviations by 7 different methods.
Analysis
From Table 1 and Figure 6, it is found that LWMMDA and LWMDP outperform other algorithms. The reasons are that they are supervised manifold learning and are able to deal with the complicated, non-linear, and high-dimensionality weed images by mapping the vectored image data into the discriminant subspace to obtain low-dimensional feature vectors, instead of extracting the classification features from each weed image. The result of LWMDP is higher than that of LWMMDA, because LWMDP utilizes the local and global structure and label information of the training images to construct its objection function. In particular, the weighted value between any two k-nearest-neighbor points from different classes is directly set −1, which can maximize the separation of the between-class samples when they are the k-nearest-neighbor points. However, LWMMDA ignores similarity between a point and its neighbors, its simple weight assignment scheme could be inadequate for constructing the within-class compactness and between-class scatter, which may result in the degradation of recognition performance. Consequently, LWMMDA is not better than LWMDP. Moreover, the optimal dimensionality of LWMDP is less than that of LWMMDA, and the computing time of LWMDP is the lowest, because Grabcut is firstly used to remove the most of the background, and then FMC can fast segment the weed image, and the weighted information is introduced into the objective function to speed up the iteration convergence of LWMDP.
From Table 1, it is also found that the recognition rate of CNN isn't as high as we expected, but it takes a lot of to train the model parameters. The reason is that our dataset is not enough for CNN requirement. However, when we augment our dataset to 20 times by affine transformation, perspective transformation, and simple image rotations (Salamon and Bello, 2017), the identification rate of CNN achieves about 99%, while the training time is more than a day. Comprehensive comparison, the proposed method is effective for weed species recognition in fields.
Comparing with linear discriminant analysis (LDA) algorithm, one major drawback of the proposed method is that it has higher computational complexity. As far as weed images are concerned, they are vectorized for LWMDP to find the intrinsic manifold structure. While the dimension of weed image is usually very high, PCA is used to secondly reduce the dimensionality of the extracted feature vector by LWMDP, so as to avoid the small-size-sample problem.
Conclusions
Weeding is a timely work for crops in seedling stage. It is a necessary condition to ensure the high yield of crops. At present, the chemical weeding method is widely used, which has the advantage of low implementation cost and is suitable for all kinds of various farmlands. The biggest disadvantage is the large consumption of herbicides damages the balance of biological environment in fields, and the residual herbicides will also threaten human health. Controlling weeds can be implemented using robotic cultivators. Accurate identification of weed species can provide scientific basis for the rational using herbicides. This paper proposes a LWMDP based weed recognition method. In the method, Grabcut is firstly used to remove the most background, FMC is utilized to fast segment the weed image, and then LWMDP is employed to reduce the dimensionality of the segmented weed image, finally SVM is adopted to recognize weed species. The experiment results on the weed image dataset validated the effectiveness of the proposed method. Although it is effective for dimensionality reduction of the non-linear data, how to effectively reduce the computational load and even extend it to the linearization algorithm is a research topic in the future. One of the key points of further research is how to get a linearized manifold learning method that can deal with non-linear data. We will extend LWMDP to two-dimensional LWMDP (2D-LWMDP) for image recognition, which is based directly on 2D image matrices rather than 1D vectors. 2D-LWMDP will be based directly on image matrix to find an embedding that preserves local information and detects the intrinsic image manifold structure, and then improve its classification performance. This is another future work.
Data Availability
The datasets generated for this study are available on request to the corresponding author.
Author Contributions
SZ was responsible for paper writing. JG was responsible for designing the algorithm. ZW was responsible for experiment implementation.
Conflict of Interest Statement
The authors declare that the research was conducted in the absence of any commercial or financial relationships that could be construed as a potential conflict of interest.
References
Ahmed, F., Al-Mamun, H. A., Hossain-Bari, A. S. M., Hossain, E., and Kwan, P. (2012). Classification of crops and weeds from digital images: a support vector machine approach. Crop Prot. 40, 98–104. doi: 10.1016/j.cropro.2012.04.024
Ali, M. M. H., Mahale, V. H., Yannawar, P., and Gaikwad, A. T. (2016). “Overview of fingerprint recognition system,” in 2016 International Conference on Electrical, Electronics, and Optimization Techniques (ICEEOT) (Chennai: IEEE; Scopus), 1334–1338. doi: 10.1109/ICEEOT.2016.7754900
Baghel, J., and Jain, P. (2016). K-means segmentation method for automatic leaf disease detection. Int. J. Eng. Res. Appl. 6, 83–86.
Borregaard, T., Nielsen, H., Nørgaard, L., and Have, H. (2000). Crop–weed discrimination by line imaging spectroscopy. J. Agricult. Eng. Res. 75, 389–400. doi: 10.1006/jaer.1999.0519
Bouguelia, M. R., Nowaczyk, S., Santosh, K. C., and Verikas, A. (2018). Agreeing to disagree: active learning with noisy labels without crowdsourcing. Int. J. Machine Learn. Cybernet. 9, 1307–1319. doi: 10.1007/s13042-017-0645-0
Cheng, H., Peng, H., and Liu, S. (2013). “An improved K-means clustering algorithm in agricultural image segmentation,” in Image Processing and Photonics for Agricultural Engineering (International Society for Optics and Photonics).
Dyrmann, M., Rgensen, J. R. N., and Midtiby, H. S. (2017). Roboweedsupport - detection of weed locations in leaf occluded cereal crops using a fully convolutional neural network. Adv. Anim. Biosci. 8, 842–847. doi: 10.1017/S2040470017000206
EI-Faki, M. S., Zhang, N., and Peterson, D. E. (2000). Weed detection using color machine vision. Transac. ASAE 43, 1969–1978. doi: 10.13031/2013.3103
Gou, J., and Zhan, Y. (2013). Locality-based discriminant neighborhood embedding. Comput. J. 56, 1063–1082. doi: 10.1093/comjnl/bxs113
Gou, J., Zhan, Y., Wan, M., Shen, X., Chen, J., and Du, L. (2014). Maximum neighborhood margin discriminant projection for classification. Sci. World, J. 2014:186749. doi: 10.1155/2014/186749
Granitto, P. M., Verdes, P. F., and Ceccatto, H. A. (2005). Large-scale investigation of weed seed identification by machine vision. Comput. Electronics Agricult. 47, 15–24. doi: 10.1016/j.compag.2004.10.003
Herrera, P. J., Dorado, J., and Ribeiro, Á. (2014). A novel approach for weed type classification based on shape descriptors and a fuzzy decision-making method. Sensors 14, 15304–15324. doi: 10.3390/s140815304
Huang, X., and Su, W. (2016). “An improved K-means clustering algorithm,” in World Automation IEEE Congress.
Jaisakthi, S. M., Mirunalini, P., and Aravindan, C. (2018). Automated skin lesion segmentation of dermoscopic images using grabcut and k-means algorithms. IET Comput. Vis. 12:5289. doi: 10.1049/iet-cvi.2018.5289
Jiang, Y. X., Wu, T. F., and Liu, Z. Y. (2016). Face recognition algorithm based on weighted neighborhood maximum margin discriminant embedding. Comput. Eng. 42, 167–170. doi: 10.3969/j.issn.1000-3428.2016.06.029
Kilde, J. H., and Halgren, J. (2014). Approaching religious space: an overview of theories, methods, and challenges in religious studies. Religion Theol. 20, 183–201. doi: 10.1163/15743012-12341258
Li, B., Wang, C., and Huang, D. S. (2009). Supervised feature extraction based on orthogonal discriminant projection. Neurocomputing 73, 191–196. doi: 10.1016/j.neucom.2008.09.030
Li, H., He, H., and Wen, Y. (2015). Dynamic particle swarm optimization and K-means clustering algorithm for image segmentation. Optik-Int. J. Light Electron Opt. 126, 4817–4822. doi: 10.1016/j.ijleo.2015.09.127
Li, H., Jiang, T., and Zhang, K. (2006). Efficient and robust feature extraction by maximum margin criterion. IEEE Transac. Neural Network. 17, 157–165. doi: 10.1109/TNN.2005.860852
Li, X., and Wong, K. C. (2017a). Elucidating genome-wide protein-RNA interactions using differential evolution. IEEE/ACM Transac. Comput. Biol. Bioinformatics 99, 1–13.
Li, X., and Wong, K. C. (2017b). Multiobjective patient stratification using evolutionary multiobjective optimization. IEEE J. Biomed. Health Inform. 22, 1619–1629. doi: 10.1109/JBHI.2017.2769711
Li, X., and Wong, K. C. (2018). Evolutionary multiobjective clustering and its applications to patient stratification. IEEE Trans. Cybern. 49, 1680–1693. doi: 10.1109/TCYB.2018.2817480
Li, X., Zhang, S., and Wong, K. C. (2018a). “Nature-inspired multiobjective epistasis elucidation from genome-wide association studies,” in IEEE/ACM Transactions on Computational Biology and Bioinformatics. doi: 10.1109/TCBB.2018.2849759
Li, X., Zhang, S., and Wong, K. C. (2018b). Single-cell RNA-seq interpretations using evolutionary multiobjective ensemble pruning. Bioinformatics 35, 2809–2817. doi: 10.1093/bioinformatics/bty1056
Liu, X., Mengjun, L., Sun, Y., and Deng, X. (2010). Support vector data description for weed/corn image recognition. J. Food Agricult. Environ. 8, 214–219. doi: 10.1023/B:MACH.0000008084.60811.49
Longchamps, L., Panneton, B., Samson, G., Leroux, G. D., and Thériault, R. (2010). Discrimination of corn, grasses and dicot weeds by their UV-induced fluorescence spectral signature. Precision Agricult. 11, 181–197. doi: 10.1007/s11119-009-9126-0
Lu, G. F., Lin, Z., and Jin, Z. (2010). Face recognition using discriminant locality preserving projections based on maximum margin criterion. Pattern Recogn. 43, 3572–3579. doi: 10.1016/j.patcog.2010.04.007
Na, W., Miao, L., Sheng, C., and Yuan, Y. (2014). Automatic segmentation of plant disease images based on graphcuts fusing multiple features. Transac. Chin. Soc. Agricult. Eng. 30, 212–219. doi: 10.3969/j.issn.1002-6819.2014.17.027
Ren, D., Jia, Z., Yang, J., and Kasabov, N. K. (2017). A practical GrabCut color image segmentation based on Bayes classification and simple linear iterative clustering. IEEE Access. 5, 18480–18487. doi: 10.1109/ACCESS.2017.2752221
Rojas, C. P., Guzmán, L. S., and Toledo, N. V. (2017).Weed recognition by SVM texture feature classification in outdoor vegetable crops images. Ing. Invest. 37, 68–74. doi: 10.15446/ing.investig.v37n1.54703
Romeo, J., Pajares, G., Montalvo, M., Guerrero, J. M., Guijarro, M., and Ribeiro, A. (2012). Crop row detection in maize fields inspired on the human visual perception. Sci. World. J. 2012:484390. doi: 10.1100/2012/484390
Rother, C., Kolmogorov, V., and Blake, A. (2014). GrabCut: interactive foreground extraction using iterated graph cuts. ACM Trans. Graph 23, 309–314. doi: 10.1145/1015706.1015720
Salamon, J., and Bello, J. P. (2017). Deep convolutional neural network and data augmentation for environmental sound classification. IEEE Signal Process. Lett. 24, 279–283. doi: 10.1109/LSP.2017.2657381
Sarker, M. I., and Kim, H. (2019). Farm land weed detection with region-based deep convolutional neural networks. Computer vision and pattern recognition. arXiv 2019:1906.01885.
Shao, Y. (2019). Supervised global-locality preserving projection for plant leaf recognition. Comput. Electronics Agricult. 158, 102–108. doi: 10.1016/j.compag.2019.01.022
Slaughter, D. C., Giles, D. K., and Downey, D. (2008). Autonomous robotic weed control systems: a review. Comput. Electronics Agricult. 61, 63–78. doi: 10.1016/j.compag.2007.05.008
Tang, J. L., Wang, D., Zhang, Z. G., He, L., Xin, J., Xu, Y., et al. (2017). Weed identification based on k-means feature learning combined with convolutional neural network. Comput. Electronics Agricult. 135, 63–70. doi: 10.1016/j.compag.2017.01.001
Tannouche, A., Sbai, K., Ounnejar, Y., Rahmoune, M., and Rahmani, A. (2015). A fast and efficient approach for weeds identification using haar-like features. Am. Eur. J. Sust. Agricult. 9, 44–48.
Tannouche, A., Sbai, K., Rahmoune, M., Zoubir, A., Agounoune, R., Saadani, R., et al. (2016). A fast and efficient shape descriptor for an advanced weed type classification approach. Int. J. Electric. Comput. Eng. 6, 1168–1175. doi: 10.11591/ijece.v6i3.9978
Tellaeche, A., Pajares, G., Burgos-Artizzu, X. P., and Riberio, A. (2011). A computer vision approach for weeds identification through support vector machines. Appl. Soft Comput. J. 11, 908–915. doi: 10.1016/j.asoc.2010.01.011
Vajda, S., and Santosh, K. C. (2016). A fast k-nearest neighbor classifier using unsupervised clustering. RTIP2R 709, 185–193. doi: 10.1007/978-981-10-4859-3_17
Wang, H., Wenming, Z., Zilan, H., and Sibao, C. (2007). “Local weighted maximum margin discriminant analysis,” in IEEE Computer Society Conference on Computer Vision and Pattern Recognition.
Wang, Q., Zhao, J., Li, M., and Lei, Y. (2016). “Preserving discriminant manifold subspace learning for plant leaf recognition,” in Conference: 2016 12th International Conference on Natural Computation and 13th Fuzzy Systems and Knowledge Discovery (ICNC-FSKD). doi: 10.1109/FSKD.2016.7603441
Xavier, P., Angela, R., Maria, G., and Gonzalo, P. (2011). Real-time image processing for crop/weed discrimination in maize fields. Comput. Electron. Agric. 75, 337–346. doi: 10.1016/j.compag.2010.12.011
Zhao, L., Gao, Q., Dong, X. J., Dong, A., and Dong, X. (2017). K-local maximum margin feature extraction algorithm for churn prediction in telecom. Cluster Comput. 20, 1401–1409. doi: 10.1007/s10586-017-0843-2
Zheng, W., Zou, C., and Zhao, L. (2005). Weighted maximum margin discriminant analysis with kernels. Neurocomputing 67, 357–362. doi: 10.1016/j.neucom.2004.12.008
Keywords: weed species recognition, Grabcut, K-means clustering (KMC), maximum neighborhood margin discriminant projection (MNMDP), local weighted maximum discriminant projection (LWMDP)
Citation: Zhang S, Guo J and Wang Z (2019) Combing K-means Clustering and Local Weighted Maximum Discriminant Projections for Weed Species Recognition. Front. Comput. Sci. 1:4. doi: 10.3389/fcomp.2019.00004
Received: 06 June 2019; Accepted: 30 August 2019;
Published: 11 September 2019.
Edited by:
Yong Fan, University of Pennsylvania, United StatesReviewed by:
Xiangtao Li, Northeast Normal University, ChinaK. C. Santosh, University of South Dakota, United States
Copyright © 2019 Zhang, Guo and Wang. This is an open-access article distributed under the terms of the Creative Commons Attribution License (CC BY). The use, distribution or reproduction in other forums is permitted, provided the original author(s) and the copyright owner(s) are credited and that the original publication in this journal is cited, in accordance with accepted academic practice. No use, distribution or reproduction is permitted which does not comply with these terms.
*Correspondence: Jing Guo, wjdw716@163.com