 David M. Rothschild
 Coen Needell2
 Joe Veverka
 Elad Yom-Tov
- 1Microsoft Research, New York, NY, United States
- 2Reality Defender, New York, NY, United States
- 3Microsoft, Redmond, WA, United States
- 4Department of Computer Science, Bar Ilan University, Ramat Gan, Israel
We map the conversion journey (i.e., the path a costumer takes to purchase a product or service) for phones, laptops, and vehicles (i.e., cars and trucks) by analyzing a massive corpus of online searches on Bing by people in the U.S. during 2021. We show that, contrary to the idealized version of the model, the observed path of customers is often circuitous and haphazard. Nevertheless, major advertisers heavily concentrate their advertising late in the customer's journey, on people who are not just already likely to buy in the product category, but likely to be committed to a specific brand. Using a natural experiment we show that, overall, ads correlate with increased conversions for vehicles by 7%, 22% for laptops, and have no discernible increase for phones. We introduce “associated keywords”, which are keywords related to the conversion journey, but are not the actual products, brands, or product categories, as cost effective keywords for targeting people who are committed to buying in the product category but not yet committed to a specific brand. Finally, we show that, if approximately 5 days of search history of each user are taken into consideration, the accuracy in estimating if a user is intending to convert increases 8 to 15 percentage points (depending on the product category) compared with the common current practice of just focusing on the current query for targeting. These findings show how advertising can be optimized and tailored to customers throughout the conversion journey. Our results provide a critical baseline and precursor to both wider targeting scope and increased contextual data to target, becoming available in the large language model-based search world.
1 Introduction
The conversion journey (also known as buying cycle or sales funnel or conversion funnel) describes the staged process taken by a customer in order to purchase a product or service (Ramos and Cota, 2008). The customer starts at the awareness stage (i.e., early in the journey) and proceeds to research and decision in order to arrive at the purchase stage (i.e., late in the journey) (Jansen and Schuster, 2011). The last stage of the process is the post-purchase phase of the journey (Zhang et al., 2018).
The conversion journey is a model which has received significant attention. This interest is especially ingrained by practitioners (Abhishek et al., 2012), but also heavily explored in academic research, from predicting probability of conversion for any given shopper (Moe and Fader, 2004), to online to offline journeys (Li et al., 2018), to the breadth of online search in conversion journeys (Johnson et al., 2004; Blake et al., 2016), to the effects of surprise information along the journey (Hodgson and Lewis, 2019), to the uniqueness of geographically local conversions (Cacheda et al., 2018). In some cases the location within the journey can be estimated from stated intent, for example, the text of queries to a search engine in Jansen and Schuster (2011). Others (Goldstein et al., 2022; Zhou et al., 2019) used the text in conjunction with other measures such as interaction with ads and website visits to estimate the location of the customer in the journey. More complex analytic tools (e.g., Hidden Markov Models) (Anderl et al., 2016) or neural networks (Zhu et al., 2023) which take historical interactions of the client have been applied to the task as well.
Yet, even with the substantial past literature, there is still a lot to learn about what the conversion journey looks like under different conditions and for various types of consumers. In short, empirical evidence is tricky, as it hard to capture the full journey which may span many different modes (Gallino and Moreno, 2014). Data shows that consumers don't always move along its phases sequentially (Jansen and Schuster, 2011).
A key goal of advertising is to increase the likelihood that a person will purchase the advertised product: there is a massive and divided literature on the impacts of different types of advertisements (modes, context, etc.) and when in the conversion journey they are administered. In the context of supermarket advertising, Seiler and Yao (2017) found that advertising had no effect on consumers who were early in the conversion process but did cause an increase in purchase for those customers who were late in it. There are only a few examples which compared different marketing channels over the duration of the conversion process. A study of one website which focused on furniture and lifestyle found that the most effective marketing channel varied during stages of the conversion journey: digital ads (specifically, banner ads) were most effective during the intermediate stage of the journey (Dost and Phieler, 2018). Krupenkin et al. (2021) found that search ads for vaccines caused people exposed to them to preferentially search for information about these vaccines, with greater effects for people who were already considering the vaccines (and thus were later in the conversion journey) than those who were not. However, the effects were significant even for the those earlier in the journey, making them cost effective on the margin. Similarly, Jansen and Schuster (2011) and Yang et al. (2021) reported a differential effect of ads on sales depending on the customer's stage in the conversion journey. Others have shown that search ads increased sales (Abhishek et al., 2012) and visits to a company's website regardless of a customer's stage of the conversion journey (Hoban and Bucklin, 2015).
Comparable results were found for retargeting ads, which increased sales 2.25 times more when directed to customers toward the end of the conversion journey (near sale) compared to when it they were aimed at customers earlier in the journey (Moriguchi et al., 2016).
In short, ads have a higher conversion rate later in the journey (when the consumer already has a high probability of conversion without intervention), but slightly less effective ads earlier in the journey can have a higher marginal return (as the probability of conversion without intervention is lower). Thus, in theory, advertisers for conversion oriented ads, want to be as early as possible assuming they are targeting people with a high potential for impact. The innovation in this paper is to focus on keywords that identify people a likely to buy a product category, but not any given product, ensuring a high potential return to brand-specific advertisements.
This paper tracks the conversion journey through the online search queries of US-based customers for relatively expensive goods: mobile phones, laptops, and vehicles (i.e., cars and trucks). Nearly every adult American has access to a mobile phone (85% of US adults own a smartphone),1 a computer (95% of US households own a computer),2 and a vehicle (where 92% of US households have access to a vehicle).3 Once someone enters the market for their first phone, computer, vehicle, they are always in some form of a conversion journey for that product category: consumption of their current product gradually gives way to the search for, and then purchase, of a new product in the same product category. This ubiquity and continuity make the conversion journey somewhat unique, but also easier and important to study.
The paper is structured as follows: We begin by demonstrating (Section 3.1) that conversion journeys have several archetypes and evaluate their relative prominence. We then analyze when advertisements are shown relative to the conversion journey (Section 3.2) and find that most are shown late in the journeys, because of the keywords chosen by advertisers. At this stage of the conversion journey many customers have already committed to both the product category and specific brand. To mitigate this problem we define (Section 3.3) “associated keywords”, keywords that a related to conversion journey, but not the actual products or brands, or product categories. These keywords are cost effective keywords for targeting people when they are committed to buying in the product category, but before they are committed to a specific brand. We identify these keywords, test their efficacy (Section 3.4), and show that their selection can be even more precise with just a few days of search history (Section 3.5).
It is unsurprising that the literature has not addressed “associated keywords” before, because it would be impossible to study without access to proprietary search data. Companies and researchers can speculate on which non-product and non-category keywords may associate with various conversation journeys, but they cannot prove it without individual-level longitudinal search data. We hope that this research opens up more exploration into this type of keyword, which, to an extent, is inevitable as keyword-based search moves into the LLM-based search.
We anticipate that in a search world based on large-language models (LLMs) increasingly complex and iterative queries will provide similar (or more) context than past history, with advertising plausibly reflecting the more associative nature of natural language-based responses, making this research valuable in both providing us with a baseline of what can be done now and prediction of what could be done soon.
2 Materials and methods
The data analyzed in this paper are all Bing search queries submitted by users in the United States during 2021. The research was reviewed for ethical and security concerns, and all data was fully anonymzied for research. Bing, the 2nd largest search engine in the U.S. has smaller market-share than Google, but still has a sizable user-base, at the time a very similar ad market, with similar conversation rates.4 Thus, we are confident the finds of this study should port over any similar traditional search engine with similar style ad markets (Dong et al., 2019).
We define a query as any search, and consider a query to be a sequence of keywords. We start by designating a regular expression (RegEx) pattern match for identifying the purchase of each of our three product categories; the pattern will be used to identify queries that indicate when a searcher has recently purchased a product in the category. The patterns are all built off of a base structure, with the operative words changed for each category. The patterns we use are of the form “((my new)|just (bought|got) a) ?\w*($SUBPATTERN)”, where $SUBPATTERN is replaced with the appropriate pattern in Table 1. This pattern was chosen to have high precision (i.e., a large portion of positively identified searchers bought a product) at the expense of low recall (i.e., the set of positively identified searchers is significantly smaller than the set of all searchers who bought a product).
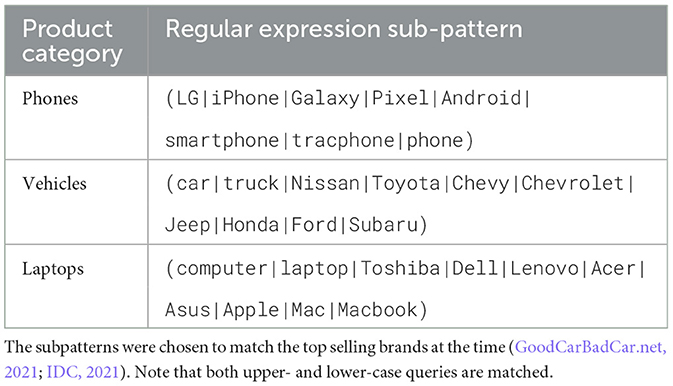
Table 1. A specific description of the subpattern used to generate the treatment group for each product category.
A searcher is placed in the “treatment” group if they submitted at least one query during the data period that matches the pattern (i.e., a target query). For each searcher, their earliest query that matches the pattern is given the time-value t = 0 and all of the searcher's queries from the preceding 90 days are placed at relative t-values (90 days, or 1 roughly a quarter, was chosen as a round number several times longer than the typical B2C conversation journey of a few days to a few weeks).5 For the “control” group, queries are randomly sampled using random queries as target queries from the complement of the treatment group such that no searcher has more than one query selected. These randomly selected queries are then treated the same way as the first matching query in the treatment group. This process is intended to mimic the selection process for the treatment group, we are choosing queries completely at random at roughly the same rate as the treatment pattern would select queries. The sampled queries are placed at t = 0 and all of that searcher's queries from the preceding 90 days are placed at appropriate t-values. The sampling proportion was chosen arbitrarily to make the control and treatment groups roughly equal in number of searchers (note that the exact size of the control group will not have a meaningful impact on the results in the paper, as long as it is big enough to mirror the rarity of the predictive terms, and both the treatment and control are huge, providing plenty of identification for what is predictive or not, and minimizing concerns over any subtle differences between the two panels that we did not control for).
Next, we map the conversion journey of archetypal purchasers in each of our three product categories. To accomplish this, we construct a logistic regression model that estimates a probability to purchase from a single query, and observe how the estimated probability for a given searcher changes as t approaches 0. For each searcher, we record the estimated probability for each time step. We apply a smoothing (blur) to each time-probability vector by convolving the path with an exponential kernel (note that this blur is only used for building the archetypes, not for any keyword level statistics). This is to prevent spurious differences from appearing in the final archetypes. For example: a flurry of searches at t−30 days is not a meaningfully different archetype from a flurry of searches at t−35 days. This has a similar effect to applying a Gaussian blur, but where a Gaussian kernel would blur in both directions, the exponential kernel can only apply a blur forward in time. Then we identify archetypes by clustering the final time-probability vectors using k-means. Some customers search early, take a long break, and then do a flurry of searches right before purchasing, others search and buy in a short period, others continuously search over long periods of time.
This model intentionally discards a lot of information, e.g., all of the previous searches of the searcher, because we use this model to mimic what the advertisers could know conditional on keyword, but no searcher history. This, of course, matches the current situation where advertiser bid on keywords, not searchers. We will relax this later in the paper and explore what we gain from more searcher history.
Thus, we explore these archetypes and their behaviors in the conversion journey, as well as how predictive various queries are of archetype membership. Understanding where a searcher is in their conversion journey is critical for the search engine to help guide the customer to a successful product search and for its advertisers, in both targeting and context, to know where and when to serve what ads.
HYPOTHESIS 1. Most conversion journeys are short and sharp, but some searchers have a two- or three-mode journey.
After mapping our searcher's conversion journeys, we retrieve keywords which have the largest weights in the model. For each keyword, we determine what percentage of searchers who use that keyword purchase within 90 days (it's precision), what percentage of buyers used that keyword at some point within 90 days prior to purchase (it's recall), the most likely t for a query containing that keyword, the percent of ads shown to that keyword that are targeted for the product category, and the price of ads for that keyword. Probabilities and t are determined by direct calculation from the dataset, and ad information is retrieved from the Bing Ads system.
HYPOTHESIS 2. Search ads are currently targeted at people with a high probability of an imminent purchase of a product in the product category.
In general, advertisers want to buy ads that will maximize the marginal increase in purchase probability (or expected purchase amount) per dollar in advertising spend. Two plausible tracks are for advertisers to try to get people into their product category with a bias toward their own brand (i.e., target people early in the conversion journey), or they could target people intent on buying in the product category but not yet sure what product (i.e., target people late in the conversion journey). If a searcher will definitely buy the product soon, or if the searcher will definitely not buy no matter how much they are advertised to, there is no value in advertising to that searcher. Thus, we ask, is there some combination of probability to purchase in a product category, probability to purchase a given brand, and position in the conversion journey where searchers that defines an under-utilized but high marginal return target?
We model buying a specific product in the exact same way we model buying in the product category. We limit to the top seven brands in each product category (due to identification issues, just the top two in phones). And, there is some asymmetric drop-off in identifying which product a searcher buys within a product category. There are many searchers who are defined here as both buying in the category and buying a specific product (e.g., someone who searches for “my new iPhone”) and others who bought in the category but for whom a specific brand is not obvious (e.g., someone who searches for “my new phone”). Further, for phones and laptops we sometimes learn just the operating system (PC or Apple), but not the specific product: in those conditions Apple's vertical integration with their operating system makes it easier to identify the end brand (MacOS only runs on Apple hardware, iOS only runs on iPhones). This all translates to a less rich dataset for the specific products relative to the product categories. We can control for the similar levels of precision (because, lacking ground truth this is within the model), but we assume that compared to the model for probability to buy in a product category the product-specific model should have lower recall.
There is, by definition, a gap between probability of purchasing in the product category, and the highest probability of purchasing any given product in that category. And, since we have lower recall in the specific product probabilities, we overestimate this gap. But, we have no strong prior on why this gap should be smaller or larger, early or later, in the conversion journey, and we believe the gap should be relatively monotonic to the ground truth gap (i.e., bigger identified gaps should be bigger than smaller identified gaps, even if they are by definition both smaller), thus we are confident in the relative sizes of this gap as a key indicator of potential for the advertisers.
HYPOTHESIS 3. “Associated keywords” exist in all of our product categories: Keywords that are some combination of (1) associated with the product category but not the name of the category or product or brands (2) with similar or greater probability of purchase in the product category than ones regularly utilized by advertising campaigns, (3) at lower prices, (4) with similar or lower probability of purchase for any specific product, and (5) used frequently and earlier in the conversion journey.
We do not attempt to catalog all associated keywords, or precisely estimate their value, but show that they exist and show they are valuable. We obtain examples of the most impactful associated keywords by exploring a list of the top keywords by F1-score (a measure which takes into account precision and recall) on the probability of conversion in the product category. We then manually record each keyword as: “brand”, “product category”, or associated keywords. In all product categories we examined associated keywords count for more than half of the keywords in our list, in the top 50, and almost all keywords after that.
Using observational data, we explore the lift (the marginal gain of purchase) in seeing search ads in the product category on associated keywords. Ads are rendered on a search page regardless of its resolution, screen size, etc., but these govern whether users can see the ads. That is, if an ad is shown in an area of the page that is not displayed to the user, the user will not be able to see it unless they scroll to the area of the ad. This represents a semi-natural experiment for the effect of seeing an ad on future behavior. It is not a completely natural experiment because ads at a lower rank are less likely to be seen by users.
Thus, to estimate the lift in purchase for a particular products (or product category) caused by seeing an ad we utilized a natural experiment whereby only part of the search results page is seen by a user, owing to their device's resolution, screen size, and font size. Therefore, we extracted all searches that triggered ads for phones, laptops, or vehicles during January and February 2021 in the United States. We break up all searchers into “brand”, “product category”, or “associated keywords”, with keyword based exploration for ‘brand” and “product category”, with the remainder designated as “associated keywords”. We kept only searches where at least one ad was visible to the user (because the scenarios where the searcher had no visible ads is a rare edge case). For each ad displayed we collected information on whether it could be seen by a user (defined as having at least 25% of it visible to them), the rank (position) at which the ad was shown, the number of ads, and organic links displayed on the page, and the fraction of visible ads.
The data collected were used to compute two measures: First, we define the conversion gain of an ad as the percentage of users who converted within K days after seeing an ad, divided by same percentage for users who could not see an ad, even though it was targeted for display (due to screen resolution, zoom level, etc.). Second, we created a Cox proportional hazard model of conversion given the above-mentioned parameters.
HYPOTHESIS 4. Searches for particular brands will lead to conversions, but ads on “associated keywords” will have meaningful conversion as well.
Observational studies are fraught, so we also perform a difference-in-difference analysis. Rather than just exploring the marginal lift for an advertisement vs. a synthetic control, we compare two sets of searchers, both targeted and hit with ads, but different on their underlying probabilities of purchase and time-frame conversion journey. The advertisers are not controlling for these properties (see Hypothesis 1, advertisers are generally advertising to people late in their conversion journey with a high probability purchase, but they cannot control for within keyword variation in these). We assume that this will limit some of the natural bias.
So far, we have assumed the advertiser is targeting users based on the keywords they use in their current query. What would happen if instead the advertiser considered a collection of queries searched in the recent past? We explore this, while considering the privacy trade-offs: how much history is necessary to provide a sufficiently large lift in advertising effectiveness?
HYPOTHESIS 5. If ad targeting can be informed by the searcher's full session or preceding few days of searches, there are dramatic increases in a model's precision in predicting probability of purchase and/or position in conversion journey.
To test this, we create a collection of new datasets, each defined by a certain number of days, l. Whenever one of the relevant keywords is seen in a query, we create a new document from that query and the previous l days' queries. We then train a logistic model on these documents which predicts if the searcher is in the treatment or control group, and test its accuracy, precision, and recall on a held-out dataset. By varying l, we can see how a model's performance changes as it is given more information about the customer's previous queries.
3 Results
In this section we start by mapping the conversion journey, then we explore the nature of the keywords that currently dominate search advertising.
3.1 Mapping the conversion journey
In Figure 1, pertaining to Hypothesis 1, we map archetypal conversion journeys. Those who buy have two different archetypes: start searching and keep searching until they buy (note that this includes those that start very close to purchase), and those that search earlier but ebb and flow in their search until purchase. Those who do not buy have two archetypes: never search in the product category, and occasional search in the product category. Since there is no proper end time for those who do not buy, the timing of their relevant searches is assumed to be random. Figure 1 shows archetypes for laptops, while cars and trucks, and phones have comparable figures in the Appendix S1 (vehicles), Appendix S2 (phones).
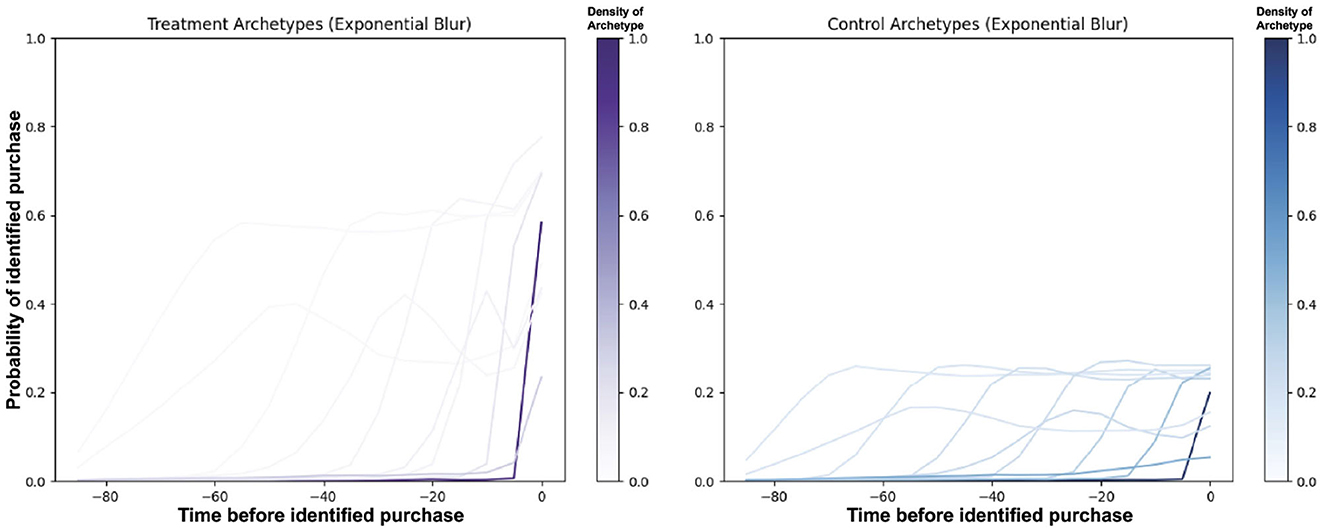
Figure 1. Estimated probability of purchase for laptops. Each line represents the centroid of a cluster of searchers, smoothed using a 5-day window. Clusters of people who purchased are shown on the left and those who did not are on the right. Darker colors correspond to more people in that archetype. The density measure has been normalized so that the most populous archetype has a density of 1.
3.2 Mapping search advertising within the conversion journey
In Figure 2, pertaining to Hypothesis 2, we map the probability of purchase and position in the conversion journey for keywords to the percent of instances where an advertiser used the keyword for the product category in question. In the top pane of Figure 2, vehicles, there is a good variation of some advertisements in keywords earlier in the conversion journey (see a group of dots on the right side of the far right panel), and some with lower probability of purchase in the product category (see a group of dots lower down in any given plot). In the middle pane of Figure 2, laptops, there is little advertisement early in the conversion journey (a few dots in the far right panel that are not close to 0), but there is much less variation in the probability of purchase (very little in any pane is not at the top of the chart). In the bottom pane of Figure 2, phones, almost all ads are confined to extremely high probability of purchase late in the conversion journey.
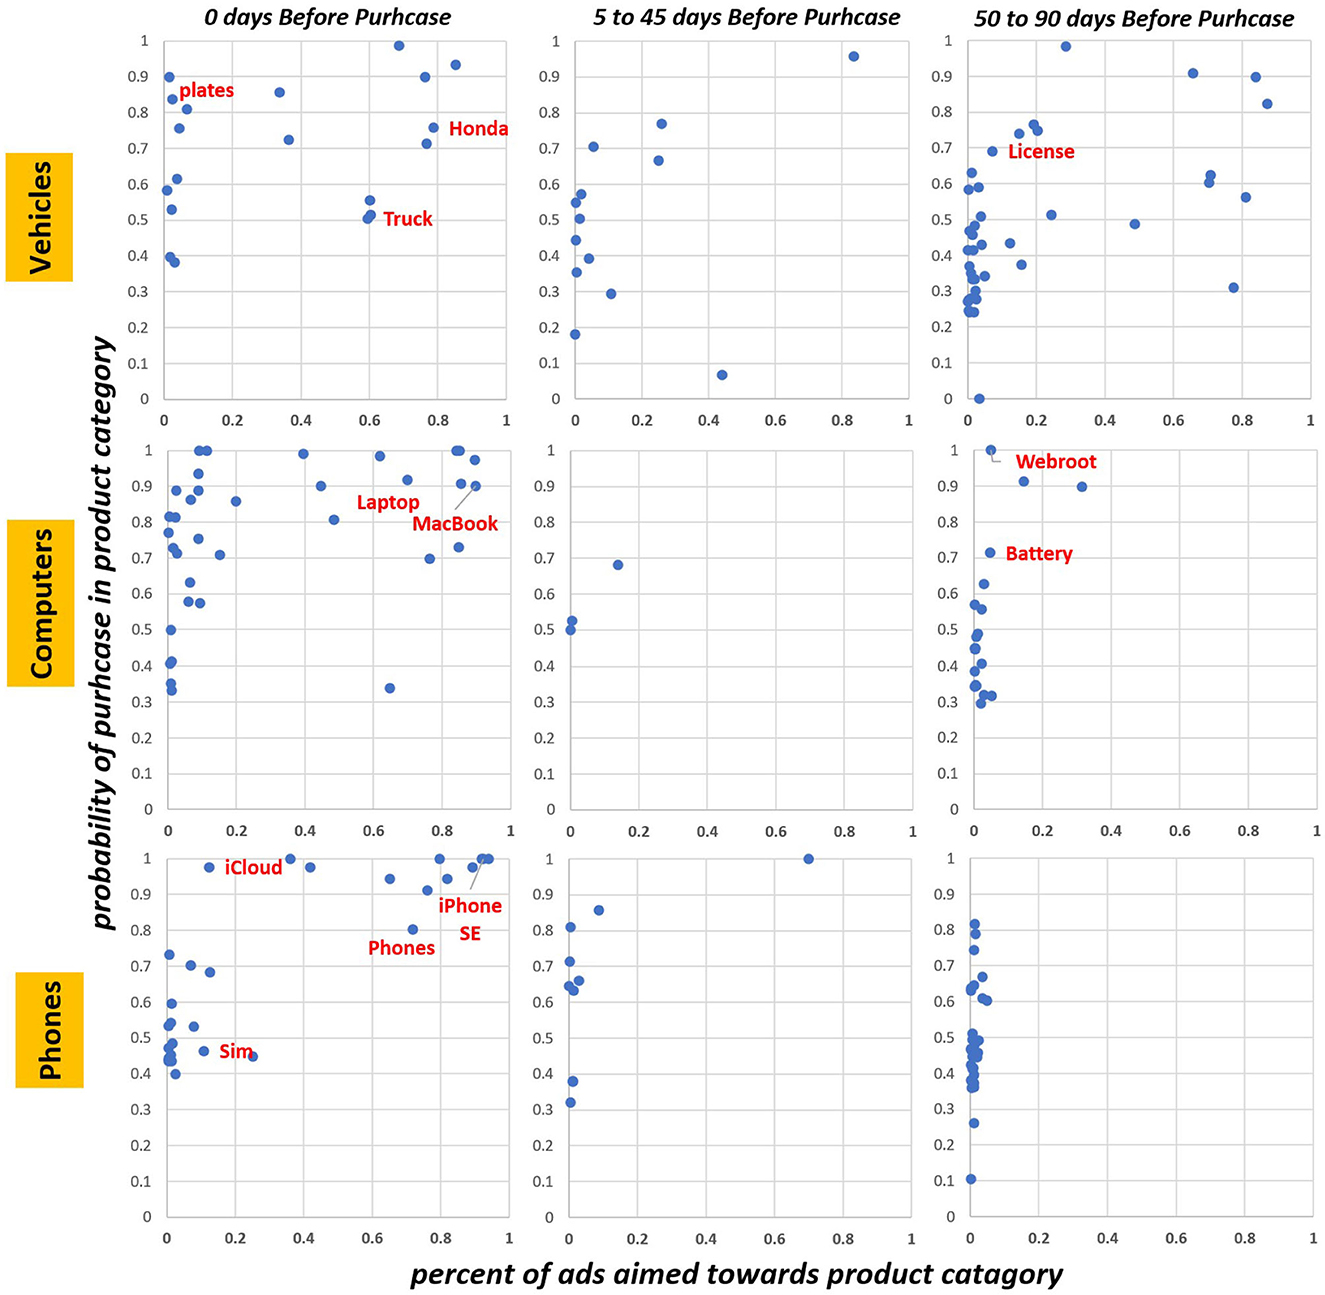
Figure 2. Probability of purchase in product categories (top to bottom: vehicles, laptops, phones) charted against the percent of ads aimed toward product category for most predictive keywords, stratified by timeframe. Charts are divided into keywords that are most likely in last 5 days, 5–45 days, or 50–90 days before purchase. Keywords highlighted in red appear in Table 2.
Figure 3 illustrates the gap between the probability to buy in a product category and the max probability to buy any particular product, charted against the estimated days before purchase for the keyword. To make the chart easier to read, we aggregated at every 5 days, and the width of the circle is proportional to the number of keywords at the time-period. There are two different patterns that emerge in this figure. First, there is a serious gap at 0 days: this is driven by product category keywords that signify a high probability of purchase, and (by themselves) do not indicate any given product. Second, with the exception of those final days, there is a sharp trend where the earlier keywords correspond to a larger gap.
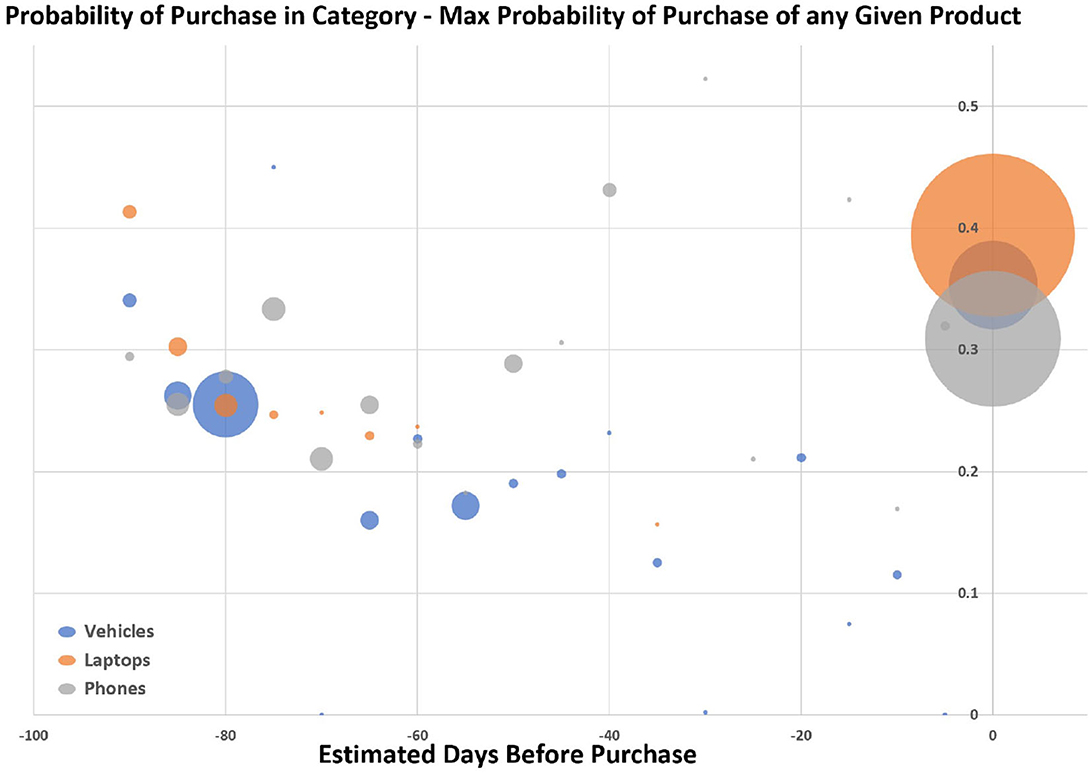
Figure 3. Prediction of days before the purchase charted against the purchase probability gap, (i.e., we calculate for any given keyword the probability of purchase in the category minus the highest probability of purchase the keyword has for any brand or product, then we take a weighted average from the keywords at any given time period). The width of the circles is proportional to the number of keywords at that time-period.
3.3 Associated keywords and their effectiveness
In Table 2, pertaining to Hypothesis 3, we explore “associated” keywords that show the potential for growth in advertising, along with keywords for products and product categories (all keywords noted in Table 2 are highlighted in red in Figure 2). These associated keywords have mixtures of high probability of purchase in the product category with low probability to purchase any particular product and low cost, while all of them have 15% or less of their ads aimed at the product category. For example, it is not surprising that advertisers buy “truck” and “phones”, product category words, to advertise in that product category, but both are expensive ($1.97 and $2.93 respectively) and late in the cycle (typical expected day before purchase approaches 0), and probability of purchase in the product category is high but not extraordinary (50% and 80% respectively). As the terms are generic, they may be used often in searches not pertaining to immediate purchase or purchase of a specific product. Thus, these product category terms do have a wide divide between likeliness to buy in the category, and buy a particular product. Actual product terms, like “Honda” or “MacBook”, are generally less expensive ($0.60 and $0.36 respectively), but have a very small gap between likeliness to buy in the category and likeliness to buy an particular product. Meanwhile, a vehicle accessory like “license” has just 7% of ads aimed at purchase in the product category, but captures people early in the journey (−80 days is typical), has a high probability of purchase in the category (69%), and a low costs of ($0.62). In the laptop category we highlight “battery” as one of many indicators that the product is breaking down: people tend to search for it 85 days out of purchase, it is relatively cheap at $1.06 and has a high probability of purchase 71%. And, most important, both license and battery have a comparatively low probability of purchase for any given product. Table 2 is not meant to be exhaustive, these examples are handpicked to demonstrate the possibility of discovery.
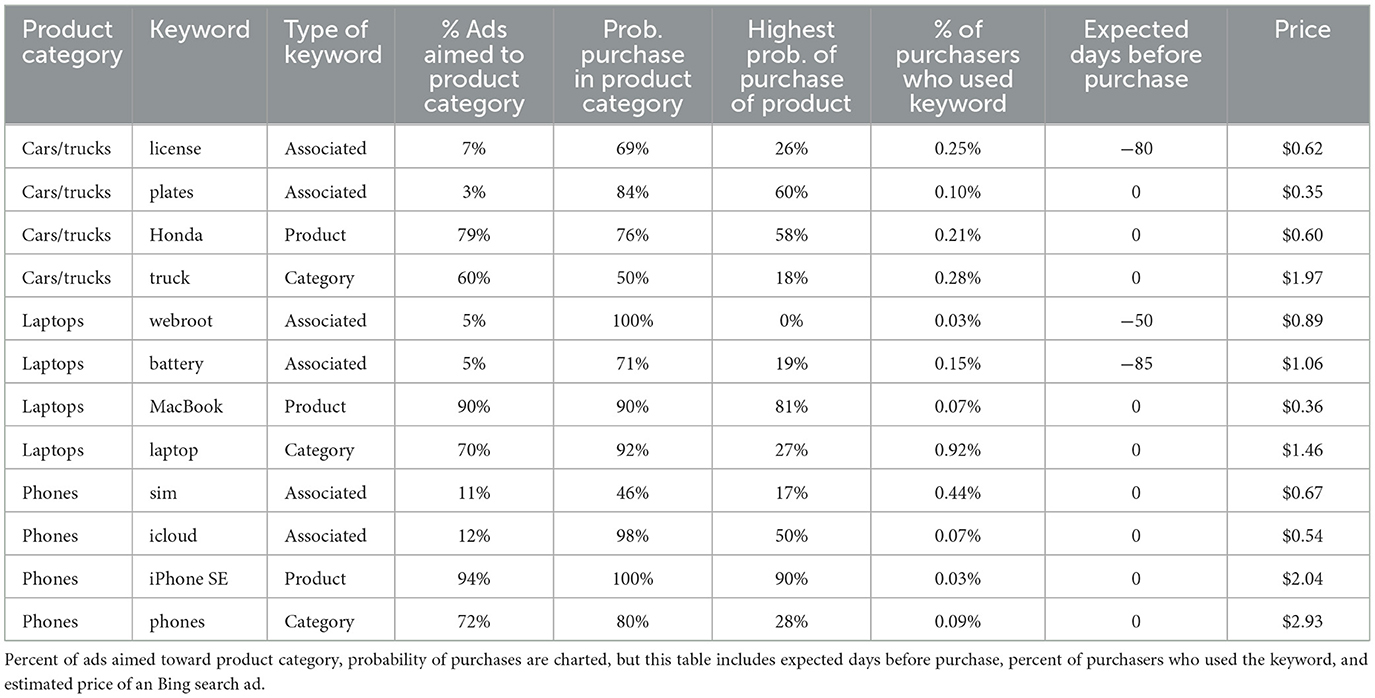
Table 2. Shows more details on the keywords highlighted in Figure 2.
3.4 Impact of search advertising within the conversion journey
We estimated the conversion gain (for seeing any ad on the monitor vs. not seeing an ad on the monitor despite the fact ad was meant to be displayed) for any product category ads by analyzing searches that triggered an ad for phones, laptops, or vehicles during a two month period. Figure 4 shows that all three product categories have periods of lift near the end of the conversion journey, and show some variation in peaks earlier in the journey.
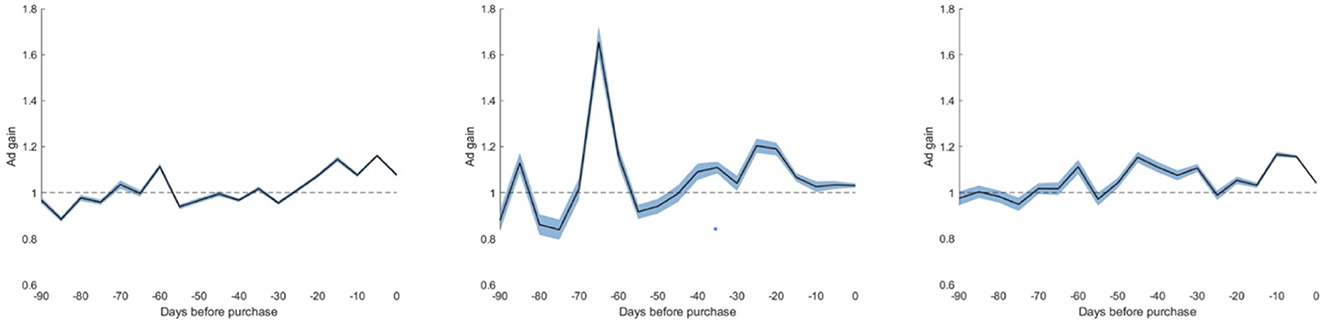
Figure 4. Conversion gain as a function of time before purchase. From left to right: vehicles, laptops and phones. Shaded areas are one standard deviation around the mean, computed using bootstrap estimate with 90% resampling.
Table 3 explores these results by showing the coefficients of the Cox hazard model for the three products categories. As Table 3 demonstrates, the gain of an ad is approximately 7% for vehicles and 22% for laptops (note: a coefficient in a Cox hazard model of 1 means baseline, and anything above 1 is the percent impact). Seeing an ad for phones does not cause noticeable gain for product purchase. None of the other variables in the model were statistically significantly correlated with conversion.
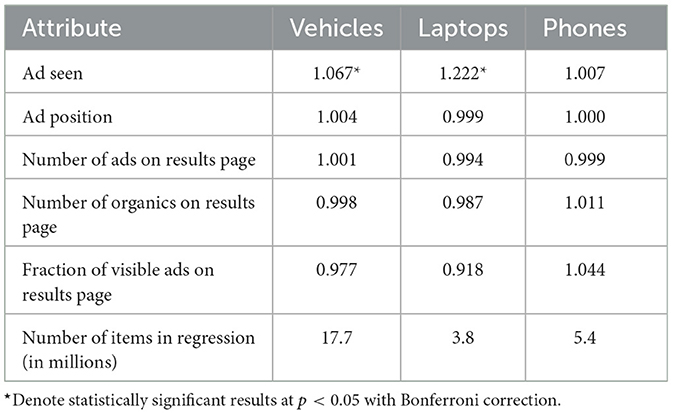
Table 3. Model coefficients of a Cox proportional hazard model for conversion given parameters of ads, contrasting ads that were visible to the users vs. ads that were displayed but not visible to the user due to technical parameters of the users' device.
Taking a closer look inside of these product categories, Table 4 shows the percent of conversions we have in our data to specific brand names, of all conversions we have in our data. Over 50% of conversions are made without mention of a specific brand in the query. Among vehicles, Ford is the most mentioned brand name in the conversions while Apple dominates both laptops and phones. This reinforces the asymmetry we noted above: vertically integrated Apple products are easier to identify than PC and Android products.
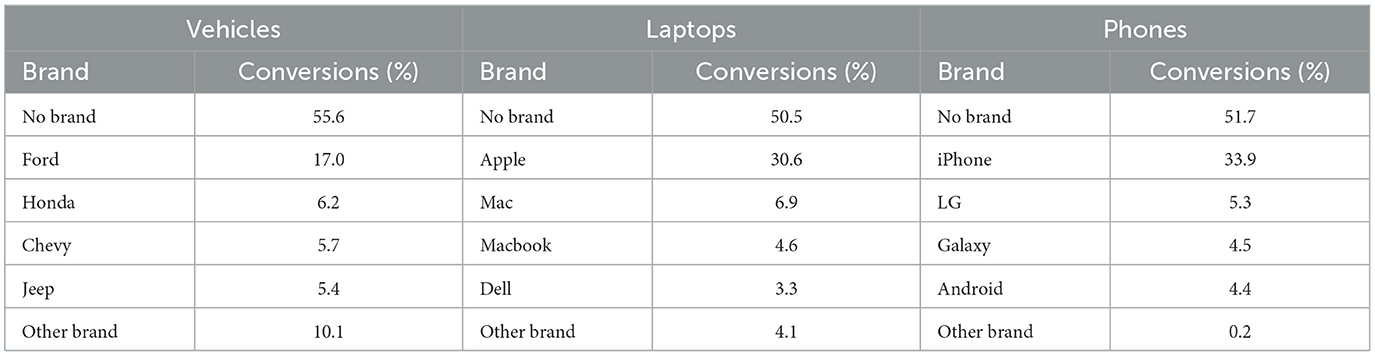
Table 4. Percentage of conversions for different brand names in the query.
Now we can narrow the treatment and outcome of interest: we estimate the conversion gain stratified by the query type and the brand stated in the conversion. Specifically, we calculated the conversion gain given the keywords mentioned in the query (e.g., “Ford” which is a product query, or "license" which is an associated query) and the stated brand in the conversion (e.g., “my new Ford”). We kept only ads shown at rank 2 or greater, since they are seen approximately half the times that they are shown. Associated queries are any queries that do not mention a product brand name or product category (thus, we are downwardly biasing our results by not making any minimum qualifications other than not being product or category). We do not have enough power to break out which companies are running which ads (by definition most ads on associated keywords are not within the product category, limiting our power!).
Table 5 shows advertising on the brand often correlates with to higher gain compared to advertising on a competing brand, and that advertising on associated keywords has a consistent, though lower, positive return (confirming Hypothesis 4). For example, people who query with the keyword “Ford” and see a product category relevant ad (which may be Ford, Chevrolet, another brand, or a product category) are more likely to convert to either Ford or Chevrolet, than if they did not see an ad, but their highest gain is converting for the Ford. However, this is not always the case, for example advertising on Android leads to greater gain on iPhone than on Android, although this may be driven by the asymmetric discoverability of what Android people buy vs. iPhone.
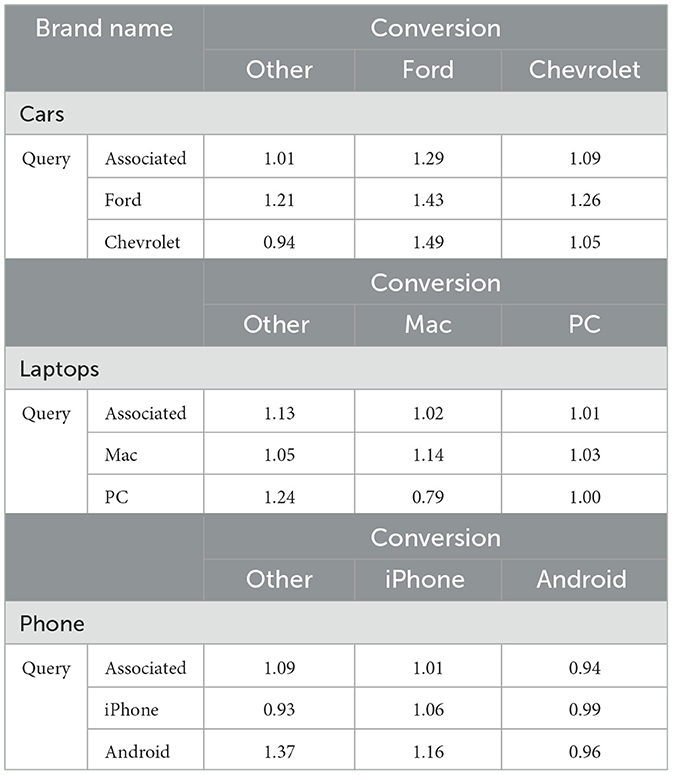
Table 5. Conversion gain by brand name in the query and in the conversion.
Importantly, when someone queries an associated keyword and sees a product category relevant ad, they are more likely to convert. This is true for “Other” in all three categories, and every product except for Android. Note that the “Other” category encompasses a variety of products and services. Nevertheless, our observational diff-and-diff causal estimation, demonstrate a lift in future conversions.
3.5 Benefit of increased context for search advertising within the conversion journey
In Table 2 we show there are potentially cost-effective associated keywords that can target conversion journeys which are committed to the product category, but do not yet know the product, and Table 5 shows they can be meaningful. But this is all built on the average of a keyword, assuming that that is the only contextual clue. What if the advertiser was able to benefit from the platform discerning differences among the users based on their recent history?
Figure 5 pertaining to Hypothesis 5, explores the model's performance in predicting if any given users will be in the treatment group given the last X days of their search history. We see that within 2 to 7 days the model gets most of the precision or recall it is going to get: there is limited added value after that point. What that means is that given just a few days of history a platform could effectively break up users who use the same keyword into high or low probability, early or late in conversion journey, rather than just assuming anyone who uses that keyword is the typical outcome for that keyword. Figure 5 shows just laptops, while vehicles and phones are very similar, and shown in the Appendix: Figure S3 (vehicles) and Figure S4 (phones).
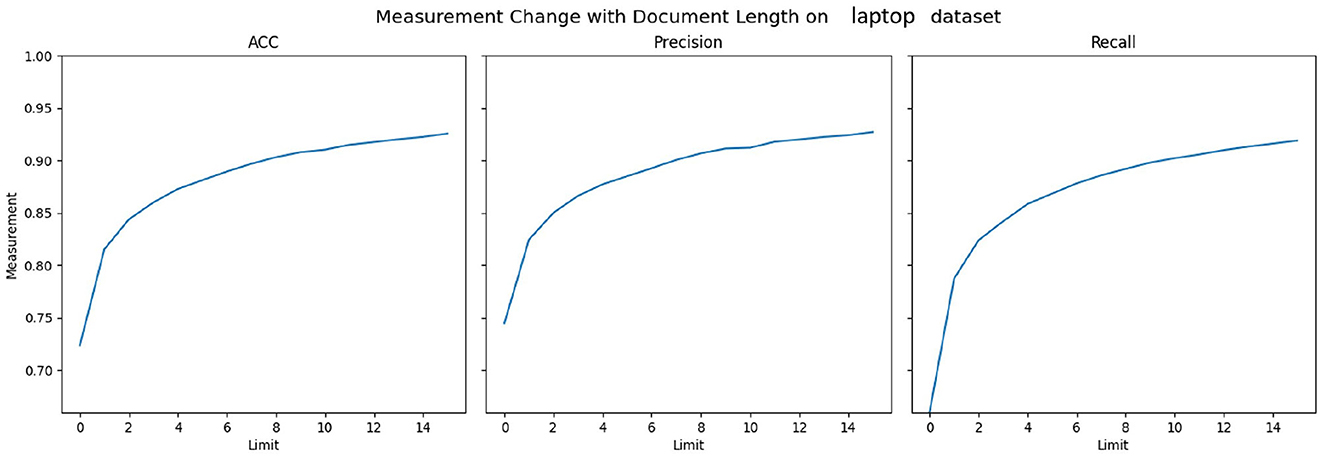
Figure 5. Accuracy vs. document size limit (e.g., use history taken into account) for predicting treatment group membership. This describes an effectiveness and confidence to privacy trade-off in our model.
Just a little bit of additional context allows us to clearly delineate very distinct probabilities of purchase for people with the exact same keyword. Figure 6 shows the distribution of the probability of purchase in the purchase category by days of documents used to make the prediction (for three keywords in each of our product categories). With 0 days, everyone looks similar (they are not the same because even if they use the same keyword, we are estimating probability based-off of the query, which contains additional information). There is a very large separation with 1 day of data and then continuous movement over the next few days.
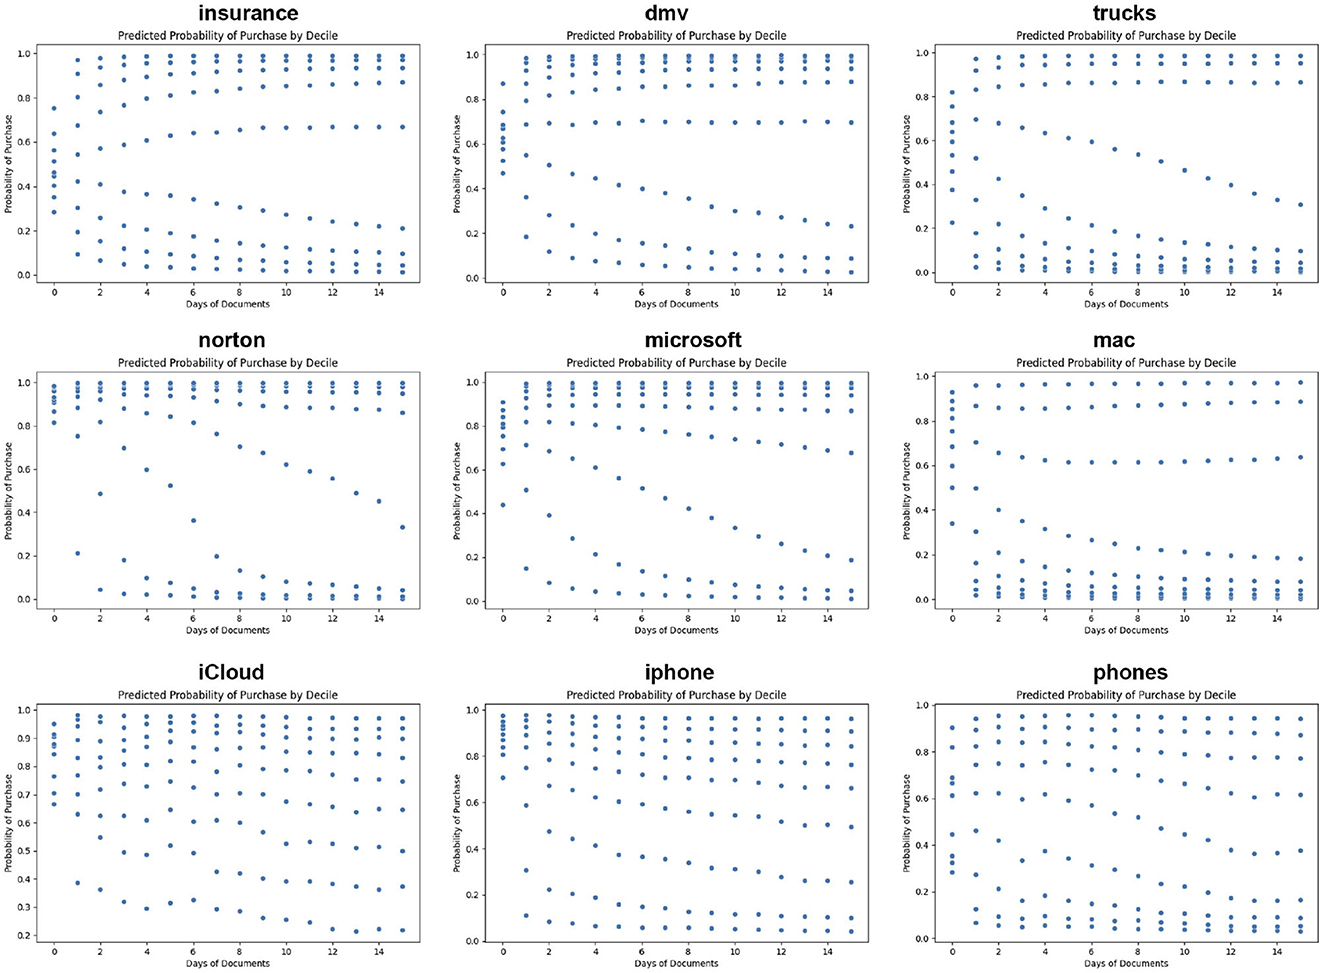
Figure 6. Distribution of probability of purchase in a product category by document size limit for “iCloud”, “iPhone”, and “phones”; “insurance”, “dmv”, “trucks”; “Norton”, “Microsoft”, “Mac”.
What this means is that if we see someone with a query “truck”, and nothing else, the full query provides a little bit of separation between different people. But, if we had just 2 days of searchers, 3 in 10 searchers would be in a much higher probability group, 1 in 10 would be in the middle, 3 in 10 much lower, and 3 in 10 almost non-existent. Now consider this: how much context will a searcher provide in a multistage chat-based search that includes vehicles? And, what will that mean for both organic and advertisement results.
4 Discussion
People use online search to consider whether they want to buy a product in a product category, and what specific product to buy. They may search in a burst right before purchase or regularly search over weeks. They might perform a burst of searches, go dormant for a period of time, and then return to their research later. By tracking a searcher's journey, we are able to consider the key attributes which advertisers should care about: the probability that they will buy in the product category, the probability that they are committed to a specific product, and roughly when they they are expected to buy. But advertisers do not buy searchers, they buy keywords, so we frame this information in terms of the keywords that define a searcher's journey.
Advertisers currently, in general and in most product categories, choose terms that indicate a very high probability of purchasing in the product category and also a high probability of purchasing a specific product; this leaves a meaningful opening for keywords that are both cost-effective and early in the conversion journey (before people are likely to have a specific product in mind) and/or having a high probability of eventual purchase in the product category with a low probability of buying a specific product. Some of these high opportunity keywords are not as obvious as the keywords that advertisers normally buy, as they focus on accessories, related products, and even signs that the previous product is breaking down.
We are able to show with an observational study that ads can provide a big lift when they are advertised to the right person at the right time. But, of course, these are underutilized keywords, so we could use more identification. And, since this is observational, we do not know how increased advertising in a given product category could affect the experience of these keywords. Future work would attempt to get more precise estimates of this lift with RCT studies [e.g., Krupenkin et al. (2021)] focused on these more high opportunity associate keywords.
While considering keywords and other contextual clues (such as keyword combinations) could provide a significant impact on the return for advertisers, any further individual-level clues would as well; just a few days of search history can refine the predicted probability of purchase. Platforms could calculate client-side probability to purchase in various categories using only the last few days of search, and only activate to block or receive ads aimed at a certain keyword and advertiser goal, greatly increasing the return on investment for the advertiser at extremely limited cost of privacy or security to the end user.
This paper also provides a blueprint for other opportunities besides associated keywords. These include tangential keywords that are even higher up in the conversion journey, but are extraneously associated with the target population, even if they are not related to the product category (let alone the product). But, also near the bottom of the journey: this process used in this paper can help differentiate searchers who are right before or after the product purchase, thus in need of very different types of information to either buy, up-sell, or not churn.
Finally, it is plausible that large-language-models could dramatically shift how search and search ads function: this paper serves as a valuable baseline as the market shifts. As search moves to more conversational (longer queries) and incremental (queries strung together), the platforms will have more context, leading to better understanding of where consumers are in their journey. Further, with many more words and a more conversational style, the LLM-based search experience is already demonstrating a more associative set of organic answers than one would expect in a traditional search experience. This can lead to new and exciting opportunities for advertisers to explore the added value. But, it hinges on how platforms choose to evolve their advertising within the LLM-based search, and how knowledgeable the advertiser is in how they take advantage of it. Both will require exciting new research into the value of this expanded understanding of the query intent.
Our study has several limitations. First, we utilized observational and natural experiments, e.g., to evaluate the effect of ads on conversion. Future work will attempt to replicate these findings through randomized controlled tests. Second, we analyzed the conversion journey for three product categories that are purchased several times over a person's lifetime. We aim to expand this investigation to rare product purchases (e.g., housing), essential products (e.g., medicines) and digital goods such as software and online streaming services.
Data availability statement
Due to privacy and commercial considerations, raw data used in this study are confidential, but a full replication file built on a mix of synthetic and aggregated data will be made available. Requests to access the data should be directed to the corresponding author.
Author contributions
DR: Conceptualization, Data curation, Formal analysis, Methodology, Project administration, Supervision, Validation, Writing – original draft, Writing – review & editing. CN: Conceptualization, Data curation, Formal analysis, Investigation, Methodology, Writing – original draft, Writing – review & editing. JV: Investigation, Writing – original draft, Writing – review & editing. EY-T: Conceptualization, Data curation, Formal analysis, Investigation, Methodology, Project administration, Supervision, Validation, Writing – original draft, Writing – review & editing.
Funding
The author(s) declare that financial support was received for the research and/or publication of this article. The authors were all Microsoft (owner of Bing) employees at the time that this work was conducted, but no specific payment was received for this work.
Conflict of interest
The authors were all Microsoft (owner of Bing) employees at the time that this work was conducted.
Generative AI statement
The author(s) declare that no Gen AI was used in the creation of this manuscript.
Publisher's note
All claims expressed in this article are solely those of the authors and do not necessarily represent those of their affiliated organizations, or those of the publisher, the editors and the reviewers. Any product that may be evaluated in this article, or claim that may be made by its manufacturer, is not guaranteed or endorsed by the publisher.
Supplementary material
The Supplementary Material for this article can be found online at: https://www.frontiersin.org/articles/10.3389/fcomm.2025.1560141/full#supplementary-material
Footnotes
1. ^https://www.pewresearch.org/internet/fact-sheet/mobile/
2. ^https://www.ibisworld.com/us/bed/percentage-of-households-with-at-least-one-computer/4068/
3. ^https://www.forbes.com/advisor/car-insurance/car-ownership-statistics/
4. ^https://brightbid.com/blog/google-ads-vs-bing-ads-what-is-the-difference/
5. ^https://agencyanalytics.com/kpi-definitions/time-to-conversion and https://www.zoho.com/blog/salesiq/b2b-vs-b2c-customer-journey-mapping.html
References
Abhishek, V., Fader, P., and Hosanagar, K. (2012). The Long Road to Online Conversion: A Model of Multi-Channel Attribution.
Anderl, E., Becker, I., Von Wangenheim, F., and Schumann, J. H. (2016). Mapping the customer journey: Lessons learned from graph-based online attribution modeling. Int. J. Res. Market. 33, 457–474. doi: 10.1016/j.ijresmar.2016.03.001
Blake, T., Nosko, C., and Tadelis, S. (2016). “Returns to consumer search: evidence from ebay,” in Proceedings of the 2016 ACM Conference on Economics and Computation, EC '16 (New York, NY: Association for Computing Machinery), 531–545.
Cacheda, F., Blanco, R., and Barbieri, N. (2018). Characterizing and predicting users' behavior on local search queries. ACM Trans. Web (TWEB) 12, 1–32. doi: 10.1145/3157059
Dong, J., Yom-Tov, E., and Yom-Tov, G. B. (2019). The impact of delay announcements on hospital network coordination and waiting times. Manage. Sci. 65, 1969–1994. doi: 10.1287/mnsc.2018.3048
Dost, F., and Phieler, U. (2018). “Supporting the adoption funnel with differential effects from traditional advertising, online displays, and a micro-influencer campaign,” in 39th International Conference on Information Systems (San Francisco, CA: Association for Information Systems).
Gallino, S., and Moreno, A. (2014). Integration of online and offline channels in retail: The impact of sharing reliable inventory availability information. Manage. Sci. 60, 1434–1451. doi: 10.1287/mnsc.2014.1951
Goldstein, A., Oestreicher-Singer, G., Barzilay, O., and Yahav, I. (2022). Are we there yet? Analyzing progress in the conversion funnel using the diversity of searched products. MIS Q. 46, 2015–2054. doi: 10.25300/MISQ/2022/15524
GoodCarBadCar.net (2021). Light Vehicle Sales in The United States Between January and December of 2019 and 2020, by Manufacturer. Hamburg: Statista.
Hoban, P. R., and Bucklin, R. E. (2015). Effects of internet display advertising in the purchase funnel: Model-based insights from a randomized field experiment. J. Market. Res. 52, 375–393. doi: 10.1509/jmr.13.0277
Hodgson, C., and Lewis, G. (2019). “You can lead a horse to water: Spatial learning and path dependence in consumer search,” in Proceedings of the 2019 ACM Conference on Economics and Computation, EC '19 (New York, NY: Association for Computing Machinery), 215.
Jansen, B. J., and Schuster, S. (2011). Bidding on the buying funnel for sponsored search and keyword advertising. J. Elect. Commerce Res. 12:1. Available online at: http://www.jecr.org/node/333
Johnson, E. J., Moe, W. W., Fader, P. S., Bellman, S., and Lohse, G. L. (2004). On the depth and dynamics of online search behavior. Manage. Sci. 50, 299–308. doi: 10.1287/mnsc.1040.0194
Krupenkin, M., Yom-Tov, E., and Rothschild, D. (2021). Vaccine advertising: preach to the converted or to the unaware? NPJ Digit. Med. 4, 1–8. doi: 10.1038/s41746-021-00395-7
Li, H., Shen, Q., and Bart, Y. (2018). Local market characteristics and online-to-offline commerce: an empirical analysis of groupon. Manage. Sci. 64, 1860–1878. doi: 10.1287/mnsc.2016.2666
Moe, W. W., and Fader, P. S. (2004). Dynamic conversion behavior at e-commerce sites. Manage. Sci. 50, 326–335. doi: 10.1287/mnsc.1040.0153
Moriguchi, T., Xiong, G., and Luo, X. (2016). Retargeting Ads for Shopping Cart Recovery: Evidence from Online Field Experiments. Amsterdam: Elsevier BV.
Seiler, S., and Yao, S. (2017). The impact of advertising along the conversion funnel. Quant. Mark. Econ. 15, 241–278. doi: 10.1007/s11129-017-9184-y
Yang, S., Pancras, J., and Song, Y. A. (2021). Broad or exact? search ad matching decisions with keyword specificity and position. Decis. Support Syst. 143:113491. doi: 10.1016/j.dss.2021.113491
Zhang, Q., Hill, S., and Rothschild, D. (2018). “Post purchase search engine marketing,” in Companion Proceedings of the The Web Conference 2018 (New York, NY: ACM), 663–670.
Zhou, Y., Mishra, S., Gligorijevic, J., Bhatia, T., and Bhamidipati, N. (2019). “Understanding consumer journey using attention based recurrent neural networks,” in Proceedings of the 25th ACM SIGKDD International Conference on Knowledge Discovery & Data Mining (New York, NY: ACM), 3102–3111.
Keywords: conversion journey, search, advertising, keywords, LLM
Citation: Rothschild DM, Needell C, Veverka J and Yom-Tov E (2025) Search conversion journeys and the missed opportunity of associated keywords. Front. Commun. 10:1560141. doi: 10.3389/fcomm.2025.1560141
Received: 14 January 2025; Accepted: 24 March 2025;
Published: 23 April 2025.
Edited by:
Tereza Semerádová, Technical University of Liberec, CzechiaReviewed by:
Kholidil Amin, Diponegoro University, IndonesiaPriyadarshini Patil, KLE Technological University, India
Zlatan Morić, Algebra LAB, Croatia
Copyright © 2025 Rothschild, Needell, Veverka and Yom-Tov. This is an open-access article distributed under the terms of the Creative Commons Attribution License (CC BY). The use, distribution or reproduction in other forums is permitted, provided the original author(s) and the copyright owner(s) are credited and that the original publication in this journal is cited, in accordance with accepted academic practice. No use, distribution or reproduction is permitted which does not comply with these terms.
*Correspondence: David M. Rothschild, RGF2aWRAUmVzZWFyY2hETVIuY29t