 Liang Shen1†Chunhua Wang1†Ruilin Wang2†Xue Hu2Shiying Liao2Wentong Liu2Aoling Du2Shengwei Ji3Eloiza May Galon3Hang Li3Xuenan Xuan3Juan Xiao2*Mingming Liu2*
- 1Central Laboratory, Xiangyang Central Hospital, Affiliated Hospital of Hubei University of Arts and Science, Xiangyang, China
- 2School of Basic Medicine, Hubei University of Arts and Science, Xiangyang, China
- 3National Research Center for Protozoan Diseases, Obihiro University of Agriculture and Veterinary Medicine, Obihiro, Japan
Introduction: The protozoan parasite Babesia microti is the primary cause of human babesiosis. This parasite invades and multiplies inside red blood cells (RBCs), and infections differ significantly based on the age and immune competency of the host. The aim of this study was to investigate the use of serum metabolic profiling to identify systemic metabolic variations between B. microti-infected mice and noninfected controls.
Methods: A serum metabolomics analysis of BALB/c mice that had been intraperitoneally injected with 107 B. microti-infected RBCs was performed. Serum samples from the early infected group (2 days postinfection), the acutely infected group (9 days postinfection), and the noninfected group were collected and evaluated using a liquid chromatography−mass spectrometry (LC−MS) platform. Principal component analysis (PCA), partial least squares discriminant analysis (PLS-DA), and orthogonal partial least squares discriminant analysis (OPLS-DA) identified metabolomic profiles that differentiated the B. microti-infected and noninfected groups.
Results: Our results confirm that the serum metabolome is significantly influenced by acute B. microti infection and show that infection results in dysregulation of metabolic pathways and perturbation of metabolites. Acutely infected mice displayed perturbations in metabolites associated with taurine and hypotaurine metabolism, histidine metabolism, and arachidonic acid metabolism. Taurocholic acid, anserine, and arachidonic acid may be potential candidates as serological biomarkers for diagnosing B. microti infection at the acute stage. These metabolites could be further examined for their role in disease complexity.
Discussion: Our findings demonstrate that the acute stage of B. microti infection induces abnormalities in the metabolites present in mouse serum and provide new insight into the mechanisms involved in systemic metabolic changes that occur during B. microti infection.
Introduction
Babesia microti is the most common intraerythrocytic parasite that causes human babesiosis (Vannier et al., 2015). This parasite is mainly transmitted by tick bites, but it has been shown that it can also spread through blood transfusion, and a few reports have suggested that it may be transmitted to a developing fetus via the placenta (Tufts and Diuk-Wasser, 2021). Severe symptoms in neonates or older adults could be related to depressed cellular immunity in immunocompromised individuals, particularly splenectomized individuals (Yi et al., 2018). Death occurs in 10% of patients who are hospitalized for severe B. microti infection (Bloch et al., 2022). The mild disease caused by B. microti typically manifests as intermittent fever, malaise, and weakness (Vannier and Krause, 2012).
Metabolomics, a high-throughput analytical profiling technique in which the small biochemical compounds produced during metabolic processes are measured and compared, offers an advantage for identifying and quantifying a wide range of minor chemical metabolites, evaluating disease development, and determining physiological status based on analysis of complex biological samples (Chen et al., 2022). This approach facilitates the exploration of various metabolic changes that occur throughout the parasite life cycle and fulfils the demand for advanced diagnostics and precision therapeutics (Yu et al., 2021). Moreover, it can be used to diagnose disease, screen for biomarkers, and explore the mechanisms of pathogenesis (Gowda et al., 2008).
In recent years, metabolomics analysis has been extensively utilized in the study of protozoan parasites, including Cryptosporidium baileyi, Plasmodium berghei, Toxoplasma gondii, and Trypanosoma cruzi (Lizardo et al., 2019; Zhou et al., 2019; Hajialiani et al., 2021; Wu et al., 2021). A metabolomics study found that human malarial infections are associated with the presence of elevated amounts of bile acids, bile pigments, and steroid hormones. Upregulated levels of metabolites such as histidine, ornithine, pantothenate, phenylalanine, pipecolate and valine were observed in individuals with severe malaria (Das et al., 2022). In addition, serum metabolic analysis of mice infected with T. gondii revealed changes in glycerophospholipid metabolism, amino acid biosynthesis, and tyrosine metabolism (Zhou et al., 2018).
Compared to in vitro studies of parasite biology, serum metabolomic analysis provides a potent tool for the discovery of clinical biomarkers (Lakshmanan et al., 2012). Aiming to gain a better understanding of B. microti pathogenesis and identify new biomarkers that possess potential diagnostic or therapeutic value, we analyzed the serum metabolic profiles of B. microti-infected mice using an untargeted liquid chromatography−mass spectrometry (LC−MS) approach. We successfully identified alterations in several specific metabolic pathways and in specific metabolites, as well as potential diagnostic and therapeutic targets, in serum obtained from mice with B. microti infection.
Materials and methods
Animals and parasites
Female BALB/c mice 6–9 weeks old (China Three Gorges University) were used in this study. The Peabody mjr strain of B. microti (ATCC® PRA-99™) was intraperitoneally administered to BALB/c mice with 107 parasites per animal when parasitemia was 20–30% in the donor mice.
Sample preparation
Blood samples from the early infected group (2 days postinfection), the acutely infected group (9 days postinfection), and the noninfected group were prepared as previously described (Wikoff et al., 2009). The blood samples were collected through an intracardiac bleed into microcentrifuge tubes and allowed to clot at room temperature for 3 h, followed by centrifugation at 3,000 × g for 10 min at 4°C. The serum was immediately frozen in liquid nitrogen and subsequently stored at −80 ° until use.
Extraction of serum metabolites
Frozen serum samples were removed from the −80°C freezer, thawed, and vortexed for 10 sec. A total of 50 μL of the sample was mixed with 300 μL of 20% acetonitrile/methanol internal standard extractant. The mixture was thoroughly vortexed and centrifuged at 8,000 × g for 10 min at 4°C. Then, 200 μL of the supernatant was placed at −20°C for 30 min, followed by centrifugation at 8,000 × g for 3 min at 4°C. Approximately 180 μL of the supernatant was used in the analysis.
Untargeted LC−MS metabolomics analysis
LC−MS metabolomics analysis was performed at Metware Biotechnology Co., Ltd. (Wuhan, China). The analytical parameters were set as follows. Ultra-performance liquid chromatography (UPLC) was performed on a Waters ACQUITY UPLC HSS T3 C18 column (1.8 µm, 2.1 mm × 100 mm) at a column temperature of 40°C, a flow rate of 0.4 mL/min, and an injection volume of 2 μL. The solvent system was water (0.1% formic acid): acetonitrile (0.1% formic acid); the gradient program was 95:5 V/V at 0 min, 10:90 V/V at 11.0 min, 10:90 V/V at 12.0 min, 95:5 V/V at 12.1 min, 95:5 V/V at 14.0 min. Quality control (QC) samples were used with each serum sample to evaluate the reliability and reproducibility of the LC−MS system.
Data processing and statistical analysis
Serum metabolites were analyzed using LC−MS. The original LC−MS data file was converted to mzML format using ProteoWizard software. The XCMS program was used to perform peak extraction, alignment, and retention time correction. The peak area was corrected using the “SVR” method. Metabolic features detected in at least 50% of the members of any set of samples were retained. The information used to identify specific metabolites was acquired through a search of the self-compiled metabolite database MWDB (Metware Biotechnology Co., Ltd., Wuhan, China) and integration of the results with information obtained from public databases and metDNA.
The criteria used to screen for differential metabolites were as follows: variable importance in projection (VIP) ≥1, fold change ≥2 or ≤0.5 and p value < 0.05. VIP values were obtained from the orthogonal partial least squares discriminant analysis (OPLS-DA) results, and p values were derived from a two-tailed Student’s t test. The data was log2-transformed and mean-centered before OPLS-DA. To avoid overfitting, a permutation test with 200 permutations was performed.
Graphs showing principal component analysis (PCA), partial least squares discriminant analysis (PLS-DA), OPLS-DA and volcano plots were constructed using R software (Version 4.2.2). The identified metabolites were annotated using the compound Human Metabolome Database (HMDB) (https://hmdb.ca/metabolites) (Wishart et al., 2022), and pathway analysis was performed on the differentially expressed metabolites detected in electrospray ionization (ESI)− and ESI+ modes using MetaboAnalyst 5.0 (https://www.metaboanalyst.ca) (Pang et al., 2022). Significant enrichment of metabolic pathways among a given list of metabolites was determined based on a hypergeometric test’s p value. Data analysis of abnormal metabolites was performed using GraphPad Prism 8. The t test was used to determine statistically significant differences between the means of variables. A difference was considered statistically significant when the p value was less than 0.05.
Results
Collection of serum samples from mice
Parasitemia was detectable 2 days postinfection; it increased rapidly to a peak at Day 9 (33.79%) and subsequently decreased as a result of the immune response (Figure 1A). The serum samples obtained from the infected group on Day 2 and Day 9 and those obtained from the noninfected group on Day 9 were subjected to metabolomics analysis by LC−MS (Figure 1B). Images of the parasites present in mice with early and acute infections are shown in Figures 1C, D, respectively.
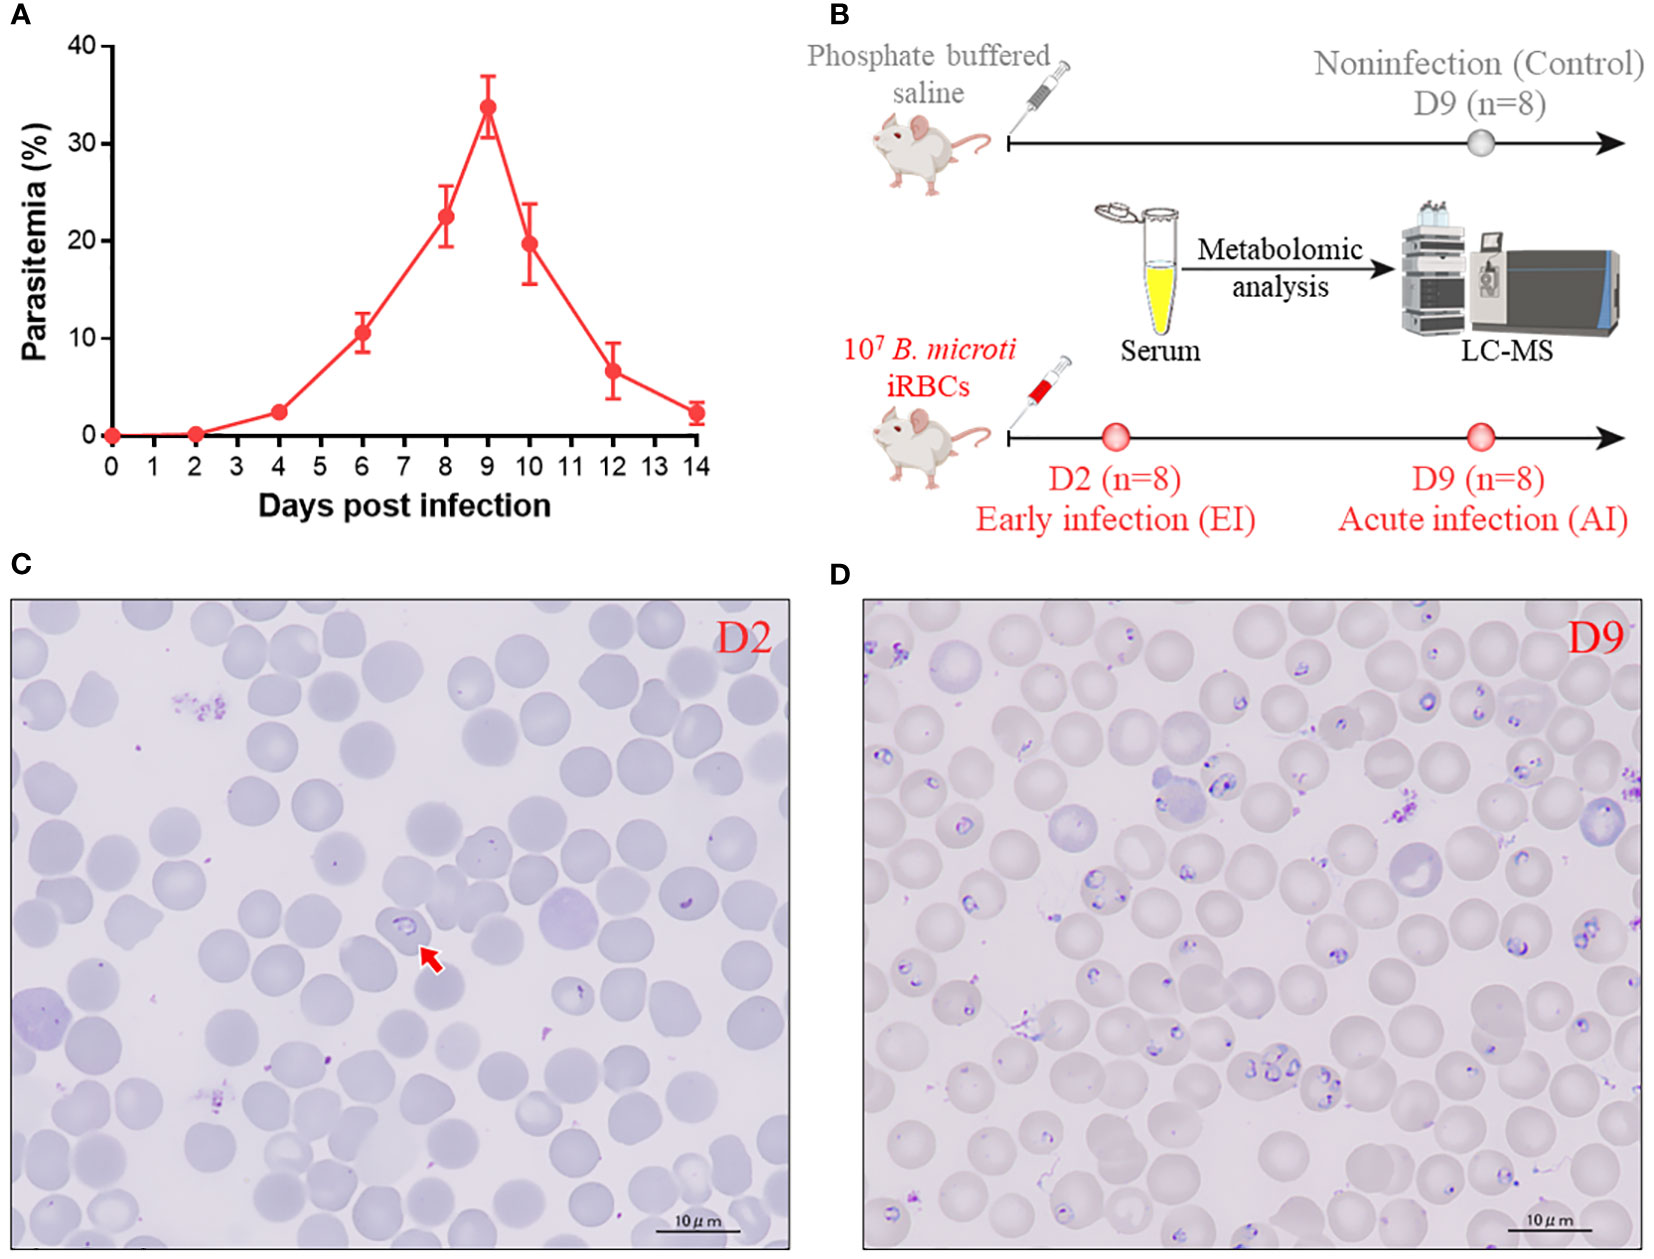
Figure 1 Data on the samples used in this study. (A) Percentage of peripheral blood erythrocytes infected with B. microti over time. (B) Schematic showing how serum samples were prepared for LC−MS metabolomics analysis. (C, D) Parasite images at the early stage (2 days postinfection) (C) and at the acute stage (9 days postinfection) (D) Arrow: iRBC.
Identification of serum metabolites
Two-dimensional PCA was used to compare the metabolic profiles of the mice in different groups. Despite the fact that the acutely infected group appeared to show a metabolic profile that differed from the profiles of the early infected group and the noninfected group, the PCA score plots obtained under either ESI− mode (Figure 2A) or ESI+ mode (Figure 2B) did not clearly differentiate the early infected group from the noninfected group. Cross-validated two-dimensional PLS-DA models were used to perform further multivariate analysis, and that analysis distinctly differentiated the three groups of mice in both ESI− mode (Figure 2C) and ESI+ mode (Figure 2D).
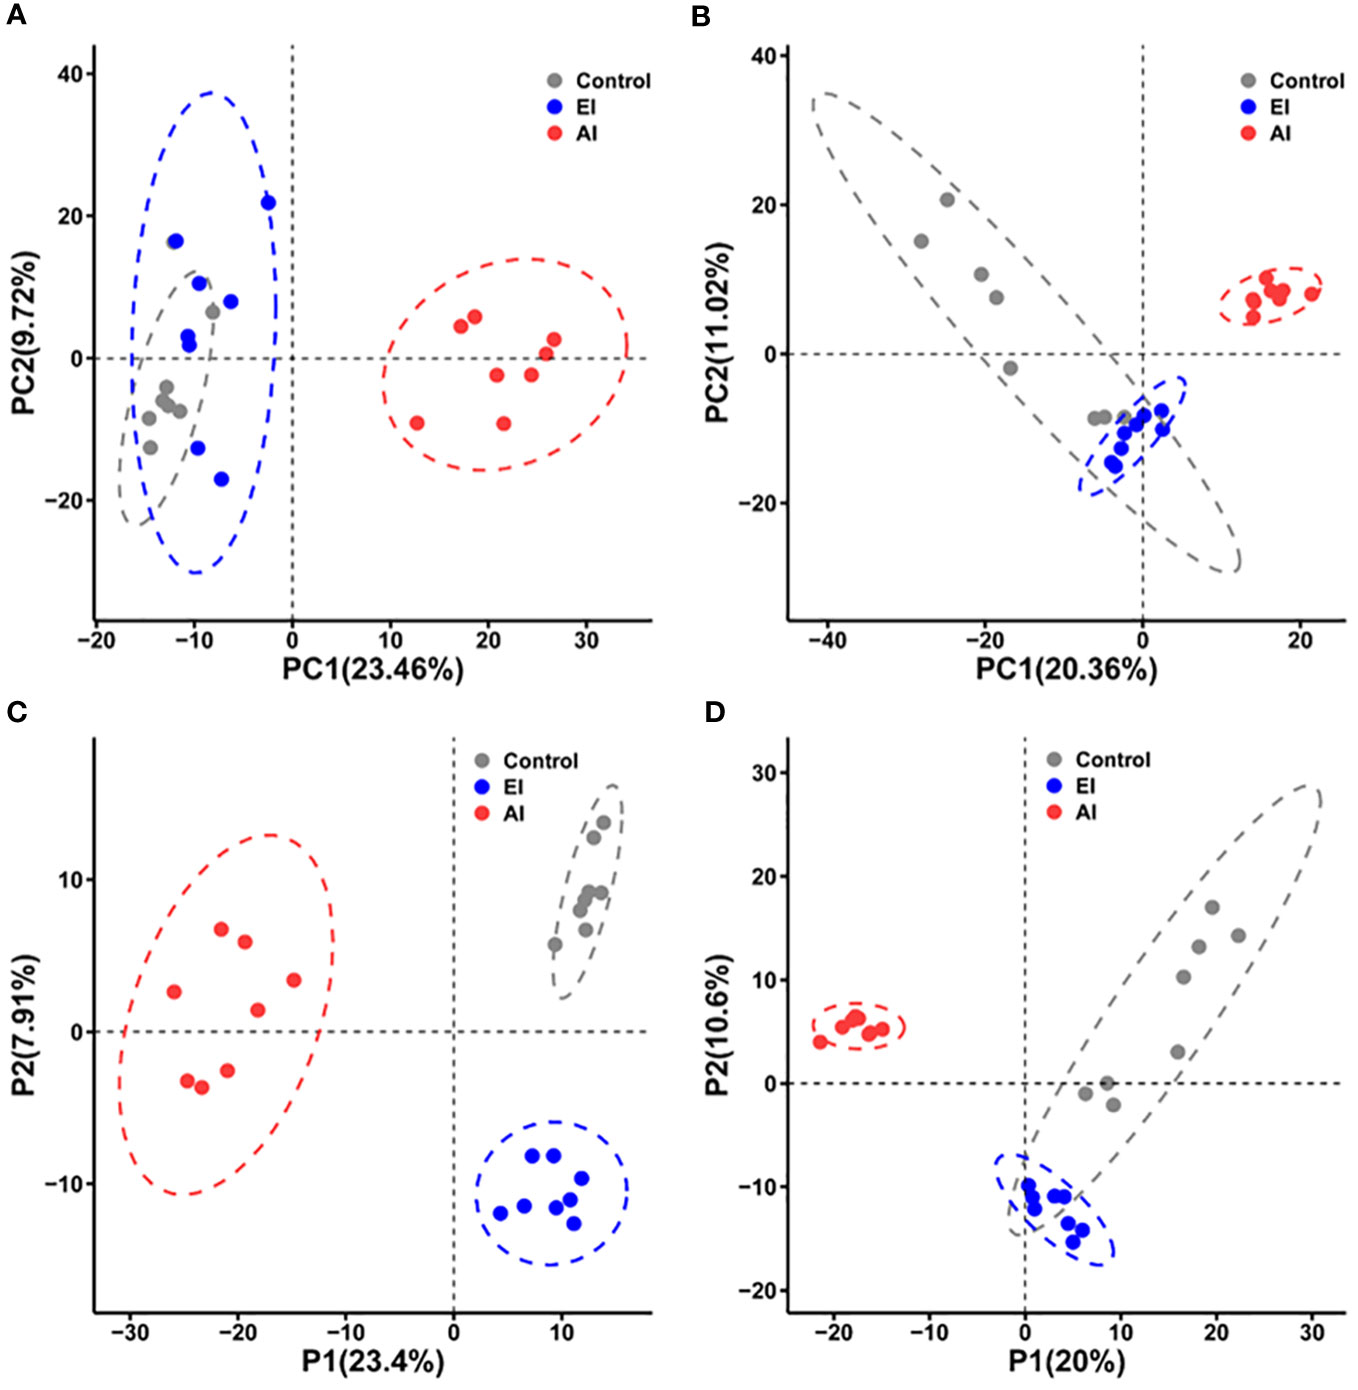
Figure 2 Differential metabolic profiles of mouse serum during B. microti infection. (A, B) Principal component analysis (PCA) score scatter plots of metabolites obtained through LC−MS in ESI− mode (A) and ESI+ mode (B). (C, D) Partial least squares discriminant analysis (PLS-DA) separation of the metabolites presents in the three groups in ESI− mode (C) and ESI+ mode (D). EI, early infected group; AI, acutely infected group; Ctrl, noninfected group.
An OPLS-DA model was used to further analyze the differential metabolites between the acutely infected group and the noninfected group. According to the OPLS-DA scores, the two groups were separated into different regions in both ESI− mode (Figure 3A) and ESI+ mode (Figure 3C). Comparison of the results of the OPLS-DA model test for the acutely infected group and the noninfected group in ESI− mode (R2Y = 0.998, Q2 = 0.938, p value = 0.005) (Figure 3B) and in ESI+ mode (R2Y = 0.998, Q2 = 0.939, p value = 0.005) (Figure 3D) indicated that the OPLS-DA model had a satisfactory fit, with effective stability and predictability. The OPLS-DA model comparing the metabolite profiles of the early infected group and the noninfected group is shown in Figure S1. Meanwhile, Figure S2 shows the OPLS-DA model comparing the metabolite profiles of the early infected group and the acutely infected group.
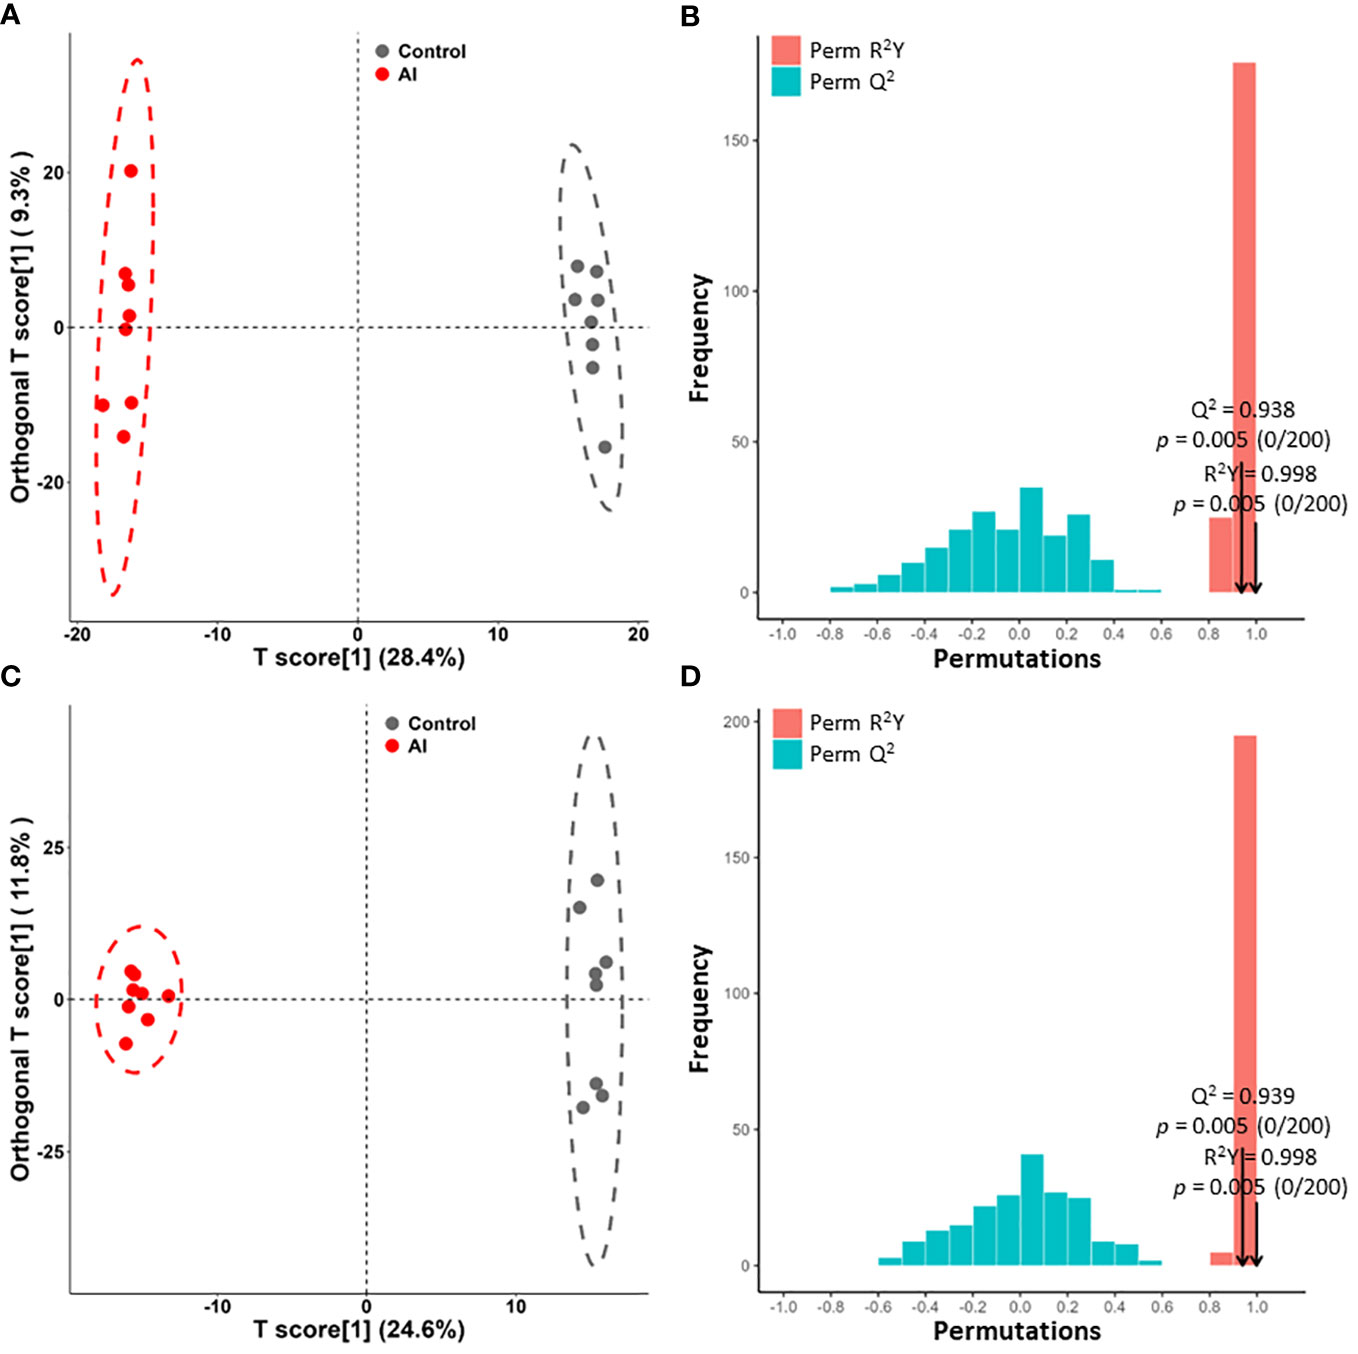
Figure 3 Orthogonal partial least squares discriminant analysis (OPLS-DA) of the metabolite profile. (A, C) OPLS-DA score plots between the acutely infected group (AI) and the noninfected group (Ctrl) in ESI− mode (A) and ESI+ mode (C). (B, D) OPLS-DA model with 200 permutation tests between AI and Ctrl in ESI− mode (B) and in ESI+ mode (D).
Perturbed metabolite identification
Based on the results of OPLS-DA, VIP ≥1, fold change ≥2 or ≤0.5 and p value < 0.05 were used as thresholds to further confirm the presence of differential metabolites. In ESI− mode, 110 differential metabolites were identified in the acutely infected group versus the noninfected group; these included 24 metabolites that increased significantly and 86 that decreased significantly (Figure 4A). In ESI+ mode, 112 differential metabolites were identified in the acutely infected group versus the noninfected group; the levels of 51 of these metabolites increased significantly, and those of 61 decreased significantly (Figure 4C). Figures 4B, D show the top 20 metabolites identified in the ESI− and ESI+ modes, respectively, using linear discriminant analysis. A list of the top 40 perturbed metabolites identified is shown in Table 1.
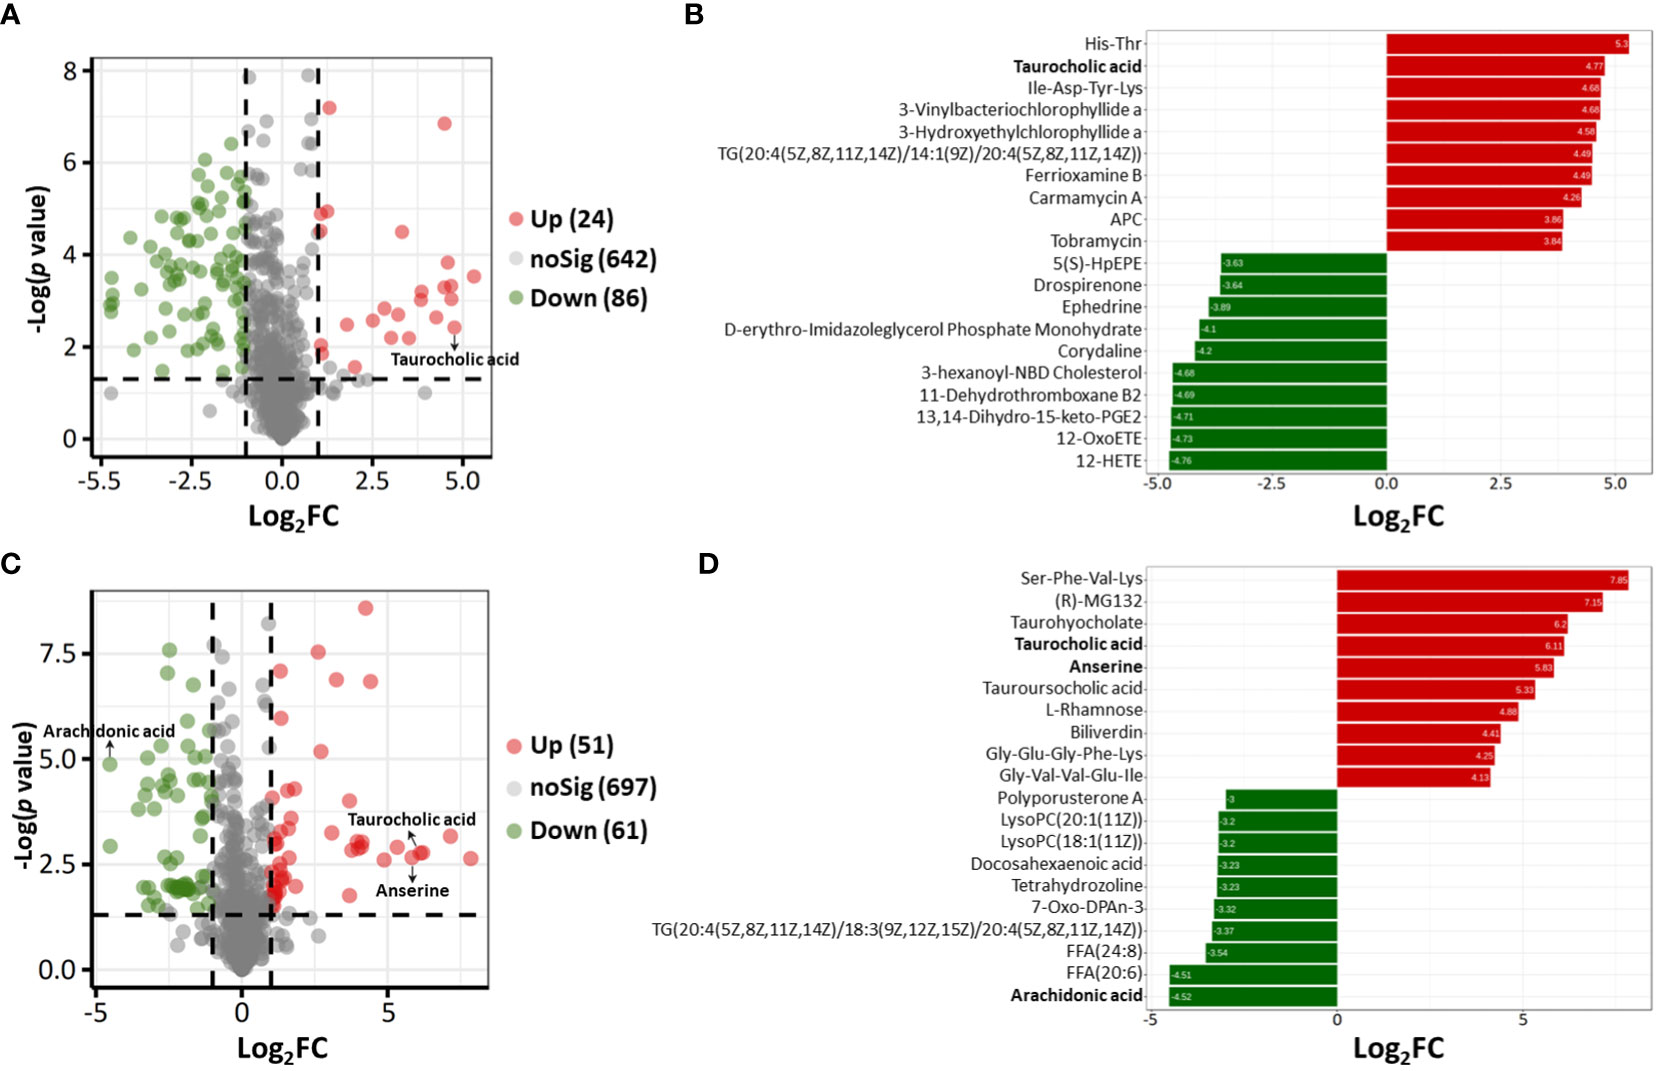
Figure 4 (A, C) Volcano plots showing differential metabolites between the acutely infected group (AI) and the noninfected group (Ctrl) in ESI− mode (A) and in ESI+ mode (C). Each dot represents a metabolite; the red dots represent significantly upregulated metabolites, and the green dots represent significantly downregulated metabolites. (B, D) Linear discriminant analysis (LDA) results showing the top 40 enriched metabolites that were significantly upregulated (red) or downregulated (green) between the AI and Ctrl groups in ESI− mode (B) and in ESI+ mode (D).
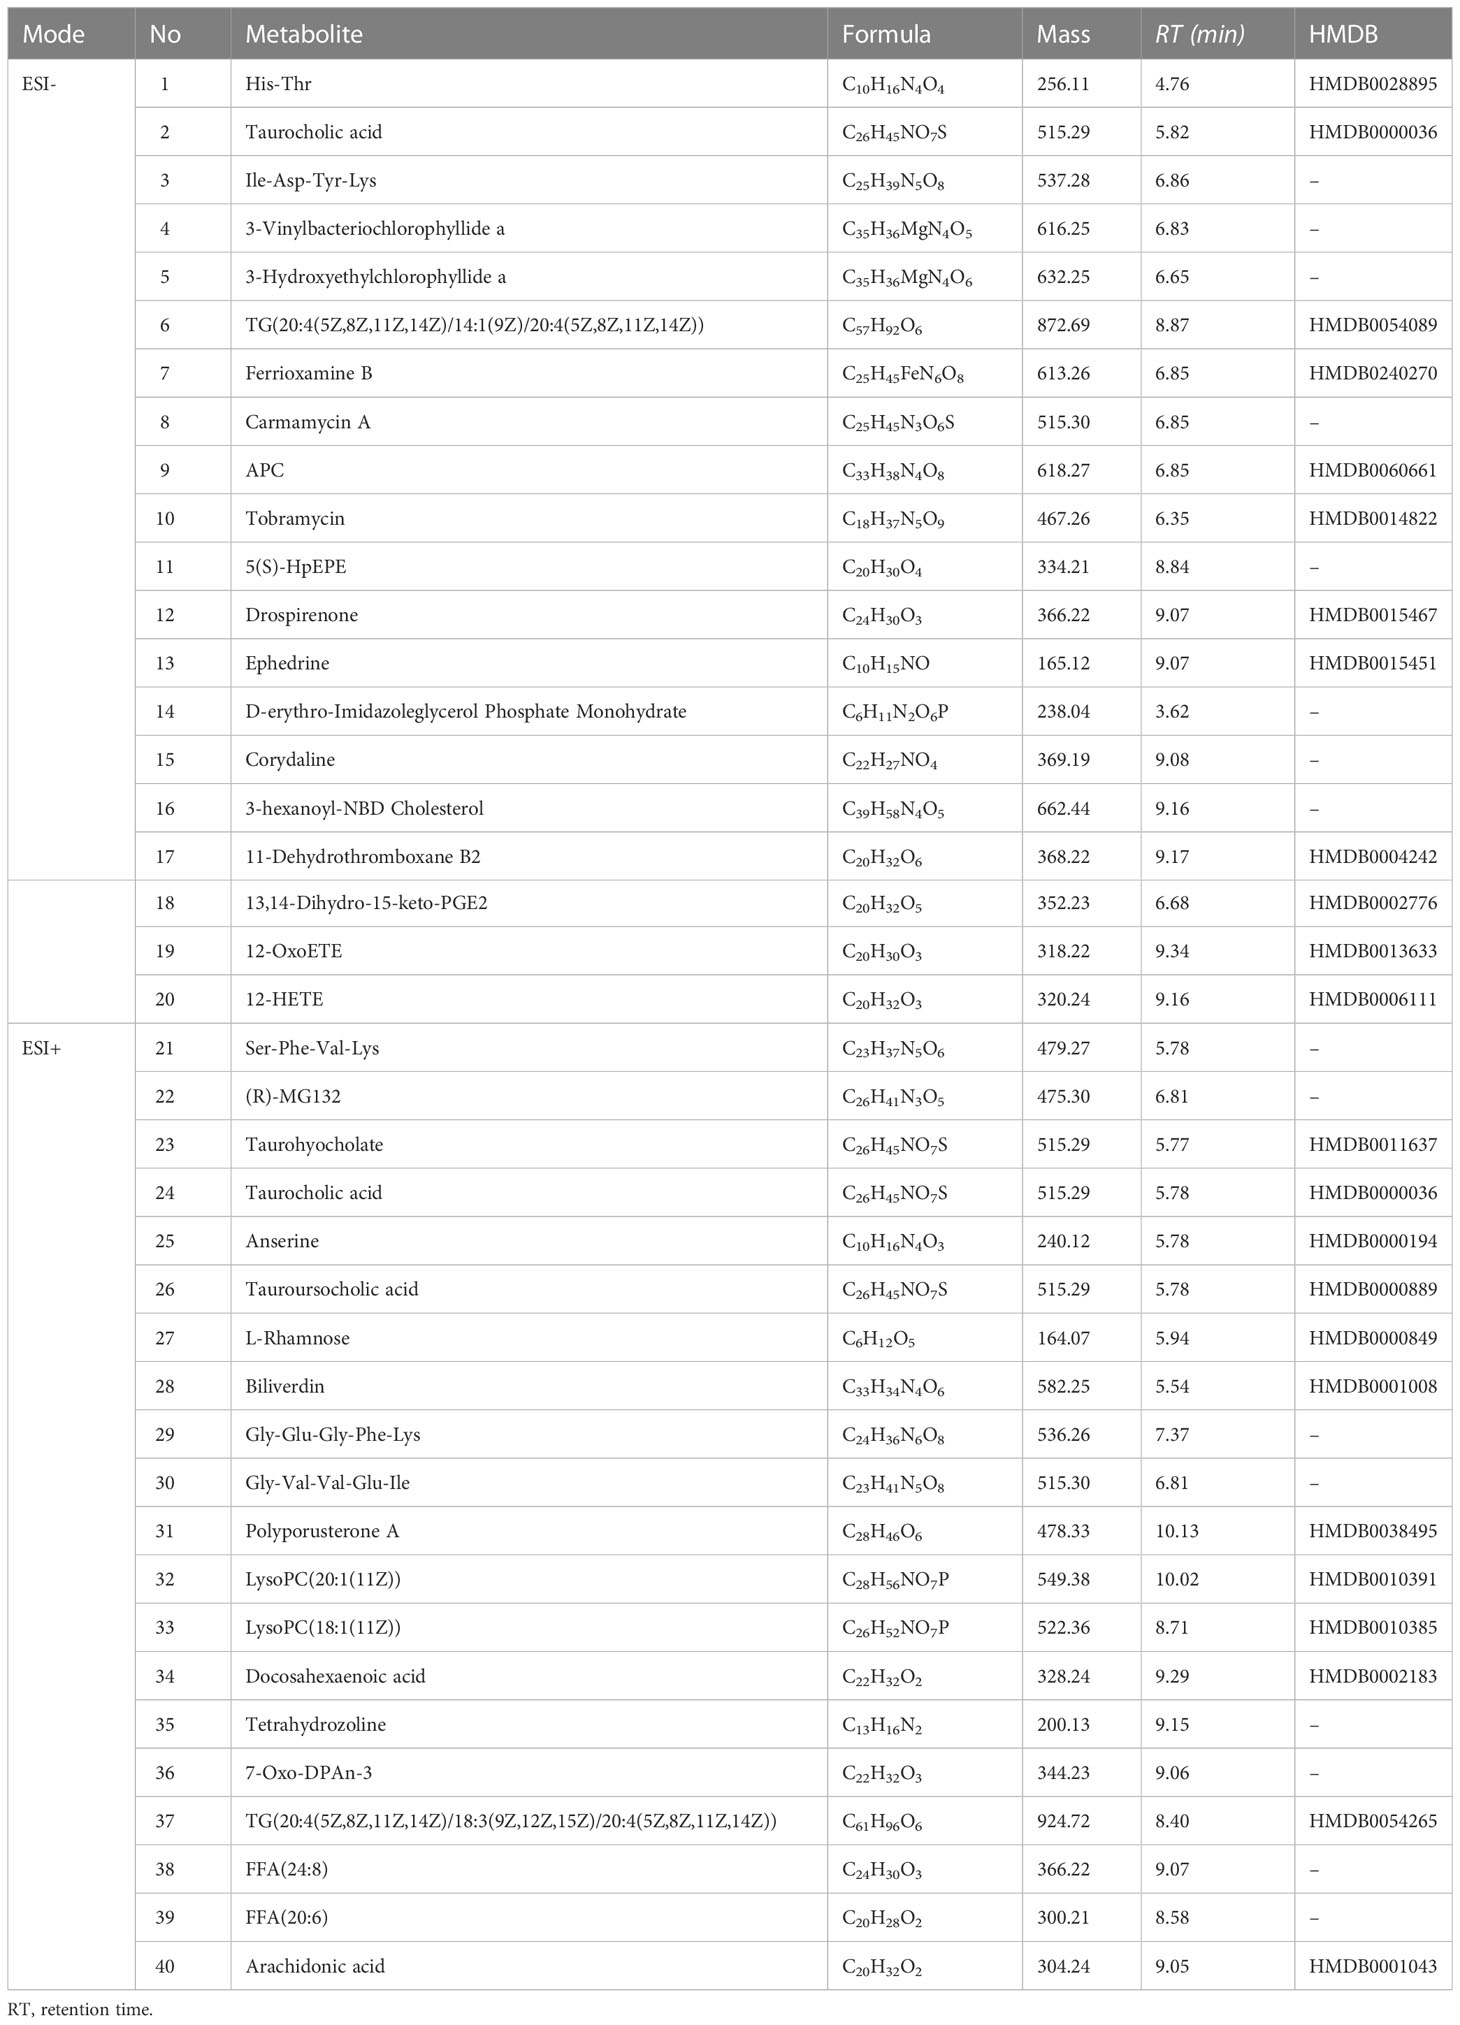
Table 1 List of dysregulated metabolites identified in acutely infected group in ESI− mode and ESI+ mode.
Analysis of dysregulated metabolic pathways
More than 20 metabolic pathways were influenced in the acutely infected group. Six pathways (linoleic acid metabolism, arachidonic acid metabolism, taurine and hypotaurine metabolism, glycerophospholipid metabolism, pyrimidine metabolism, and histidine metabolism) showed the greatest impact and the lowest p values. The three pathways that were most affected were linoleic acid metabolism, arachidonic acid metabolism, and taurine and hypotaurine metabolism (Figure 5).
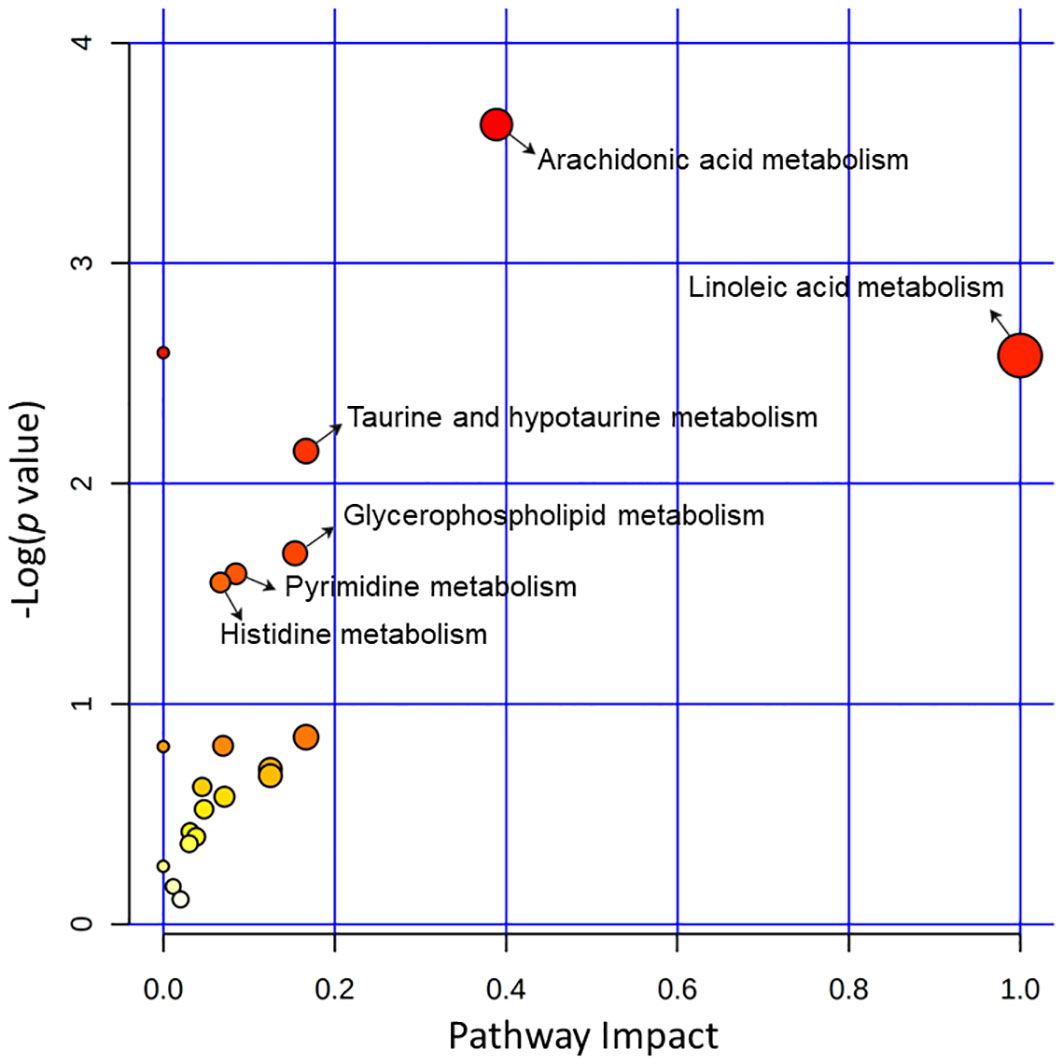
Figure 5 Pathway analysis of the identified differential metabolites between the acutely infected group (AI) and the noninfected group (Ctrl) in ESI− mode and ESI+ mode. Pathway impacts resulting from the differential metabolites were obtained using MetaboAnalyst 5.0. The magnitude of the enrichment ratio was computed as observed hits/expected hits. Pathways with p < 0.05 were considered significant.
Time courses of significant perturbations of metabolites
A total of ten metabolites that were significantly perturbed were identified and correlated with dysregulated metabolic pathways. Taurocholic acid and linoleic acid levels increased during early infection, and the differences in the levels of these metabolites increased significantly during acute infection (Figure 6A). At the beginning of the infection, no abnormalities in anserine, thymine, or thymidine levels were detected, but a significant rise in the levels of these metabolites was observed during acute infection (Figure 6A). The dUTP level increased significantly beginning early in the infection and remained constant until the acute infection stage (Figure 6A). No abnormalities in arachidonic acid or 20-HETE levels were detected during early infection, but the levels of these metabolites decreased significantly during acute infection (Figure 6B). Leukotriene B4 and L-cysteic acid levels were reduced beginning early in the infection, and the change became significant during acute infection (Figure 6B). Interestingly, at the acute stage of B. microti infection, taurocholic acid and anserine production was upregulated; the levels of these metabolites increased by 69.24-fold and 57.06-fold, respectively, while the arachidonic acid level was downregulated to 0.04 of the control level (Table 2).
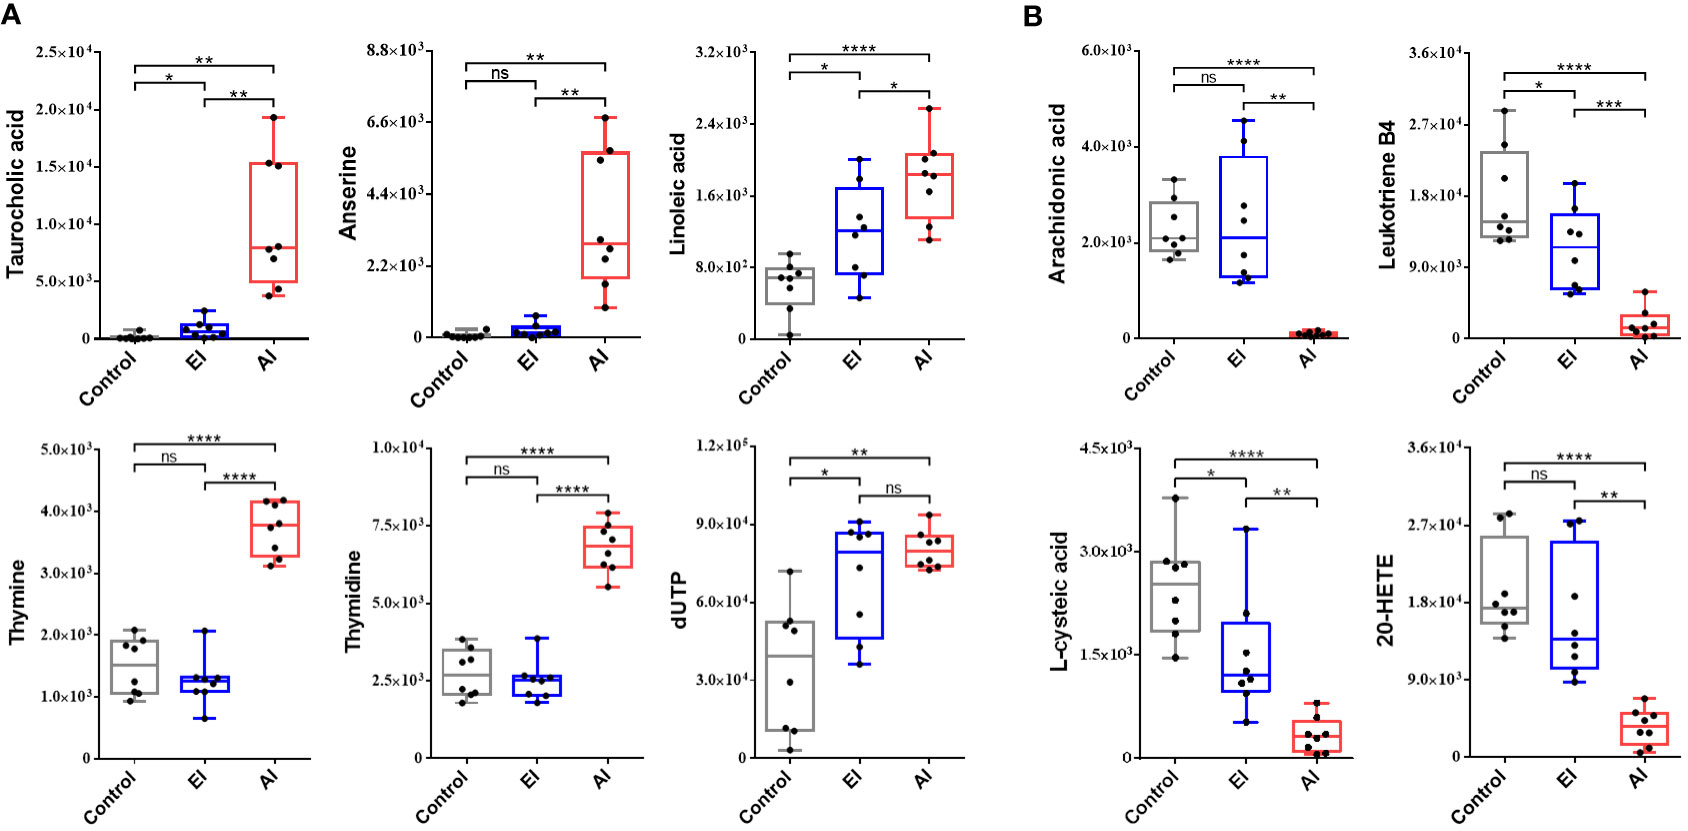
Figure 6 Box and whisker plots showing significantly perturbed metabolites correlated with the dysregulated metabolic pathways. (A) Top 6 upregulated metabolites in the enriched pathway. (B) Top 4 downregulated metabolites in the enriched pathway. EI, early infected group; AI, acutely infected group; Ctrl, noninfected group. Statistically significant differences in metabolites between groups were determined by t tests (*, p <0.05; **, p <0.01; ***, p <0.001; ****, p <0.0001).
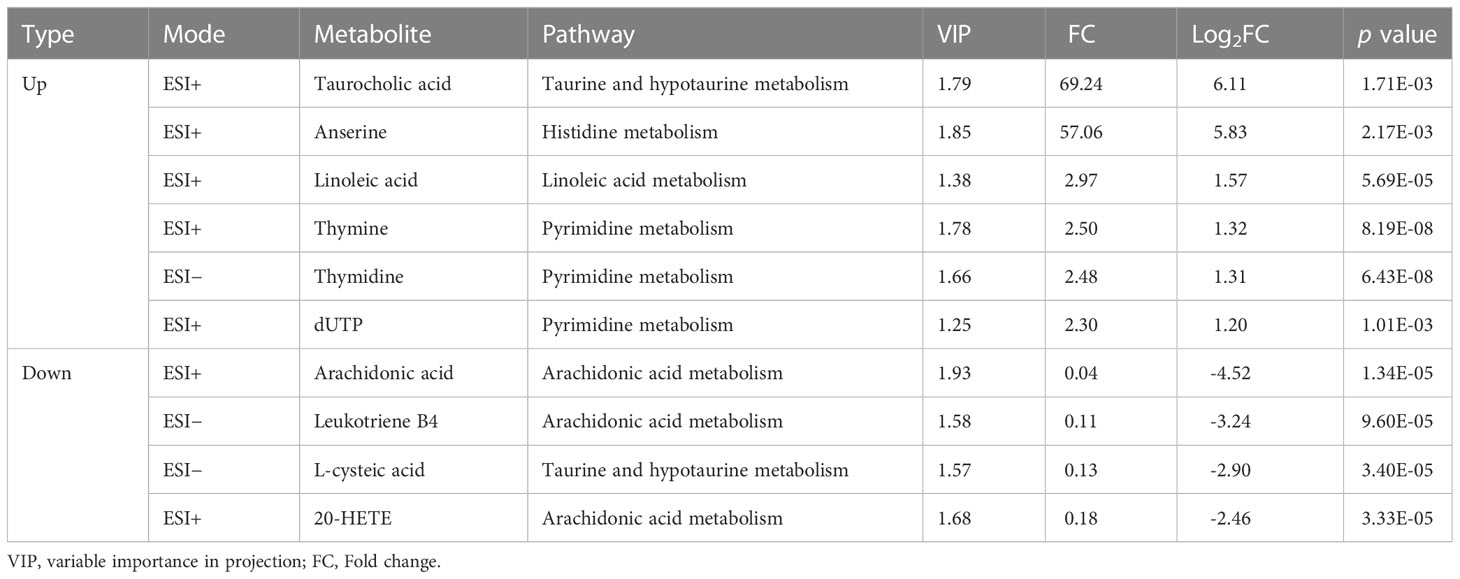
Table 2 Identified perturbed metabolites correlated to the significantly dysregulated metabolic pathways.
Discussion
Babesia is a tick-borne protozoan parasite that infects mammals and has great veterinary, economic and medical impact worldwide (Homer et al., 2000). Human babesiosis, which is also transmitted through blood transfusion, is becoming a global public health concern (Kumar et al., 2021). The clinical symptoms of Babesia infection typically include fever accompanied by malaise and fatigue, followed by anemia, anorexia, emaciation, hemoglobinuria and vomiting. In severe cases, death may occur during the acute hemolytic phase of the infection (Akel and Mobarakai, 2017). However, knowledge of the pathophysiology of human babesiosis is still limited. As a result, there is an urgent need for the identification of new biomarkers that can be used to reliably detect Babesia infection in patients.
Several “omics” techniques, such as genomics, proteomics, and transcriptomics, are used to observe host−pathogen interactions (Jean Beltran et al., 2017). Untargeted metabolomics is a powerful approach for investigating host-parasite interactions at the biochemical level and discovering new biomarkers of infection (Chienwichai et al., 2022). LC−MS is commonly used to analyze metabolites and can be used to screen for variations in small-molecule metabolites in complex biological samples. Compared with proteomics and transcriptomics, metabolomics focuses on downstream changes resulting from genetic modification or alterations in the external environment; it shows the closest correlation with phenotype and is the ultimate manifestation of gene function (Marchev et al., 2021).
There are only a few existing studies of the metabolome of Babesia. Previous investigations assessed differences in the metabolism of free merozoites and infected RBCs (iRBCs) during B. divergens infection and in the urine metabolic profiles of dogs with B. canis infection using metabolomics approaches (Fernández-Garcia et al., 2021; Kuleš et al., 2021; Beri et al., 2023). Recent research on metabolic profiling was based on erythrocytes separated from B. microti-infected mice and found sabotage of metabolic pathways in iRBCs, including amino acid, lipid, and nucleotide metabolism and the tricarboxylic acid cycle (Gong et al., 2023). However, there is still a gap in our knowledge of how the host metabolome changes during B. microti infection.
Serum metabolomics, as an important indicator of pathological and physiological state, may contribute to understanding the mechanisms through which diseases occur and progress at the metabolic level and will provide information that facilitates the identification of differential metabolic markers of disease (Zhang et al., 2012). As Babesia is a blood parasite, serum metabolomics directly reflects the infection-related metabolic changes in its host (Antunes et al., 2017). The only study that has been conducted to date on the serum metabolomics of Babesia is a study of dogs with B. canis infection; in that study, differentially abundant metabolites were found that indicated the involvement of various pathways during infection. The involved pathways included phenylalanine, tyrosine, and tryptophan biosynthesis and alanine, aspartate, glutamate, cysteine and methionine metabolism (Rubić et al., 2022).
In the current study, an untargeted LC−MS-based method was used to identify different metabolic signatures and perturbed metabolites in the serum of mice during the early and acute stages of infection with B. microti. Taurocholic acid is a bile acid and is the product of the conjugation of cholic acid with taurine. Like other bile acids, taurocholic acid acts as a detergent to solubilize fats for absorption, but it is not itself absorbed by the small intestine (Ridlon et al., 2016). Generally, high serum levels of taurocholic acid are associated with biliary damage and liver injury (Tian et al., 2021). As taurocholic acid is a nonessential amino acid, the observed 69.24-fold upregulation of taurocholic acid in the serum of infected mice supports the idea that Babesia infection induces hepatocellular injury in the host, as our previous study demonstrated (Liu et al., 2021). Anserine is a derivative of carnosine. Unlike carnosine, which is rapidly cleaved by carnosinase, the anserine in serum is methylated and is therefore more stable and resistant to degradation (Katakura et al., 2017). Considering that anserine is a potent antioxidant that reduces the oxidative stress caused by B. microti infection and brings the organism towards redox homeostasis (Peters et al., 2018), the observed 57.06-fold increase in the anserine level in serum may be a result of the host’s defense against parasite invasion. Polyunsaturated fatty acids (PUFAs) kill microbes through their direct action on microbial cell membranes. PUFAs enhance the generation of free radicals and augment the formation of lipid peroxides that are cytotoxic to microbes. PUFAs also increase the formation of bioactive metabolites such as lipoxins, maresins, prostaglandins, protectins and resolvins, all of which are compounds that enhance the phagocytic action of macrophages and leukocytes (Das, 2018). Arachidonic acid, a polyunsaturated fatty acid, has been reported to be an endogenous antiparasitic and an agent that modulates the immune response to malaria and schistosomiasis (Kilunga Kubata et al., 1998; Tallima et al., 2020). Thus, the rapid growth of parasites in the mice in our study led to the depletion of arachidonic acid, and this was manifested as a 0.04-fold downregulation in the level of arachidonic acid during the acute stage of B. microti infection.
In conclusion, our study provides novel insights into the pathogenesis of B. microti within its host and improves the current understanding of the biology of B. microti through LC−MS metabolomics analysis. The findings of this study indicate that taurocholic acid, anserine, and arachidonic acid show potential as candidate serological biomarkers for B. microti infection and contribute to the discovery of further effective anti-B. microti therapeutics. Further validation, including evaluation of the specificity, sensitivity, and clinical utility, is needed to establish the reliability and clinical relevance of above candidate metabolites as biomarkers.
Data availability statement
The datasets presented in this study can be found in online repositories. The names of the repository/repositories and accession number(s) can be found below: The metabolomics data are available in the MetaboLights database (MTBLS7399).
Ethics statement
The animal study was reviewed and approved by the Science Ethics Committee of the Hubei University of Arts and Science (Permit No. 2021-012).
Author contributions
JX and ML designed the study. LS, CW, RW, and XH carried out the experiments. SL, WL, and AD performed the statistical analysis. LS, CW, RW, JX, and ML drafted the manuscript. SJ, EG, HL, and XX revised the manuscript. All authors contributed to the article and approved the submitted version.
Funding
This research was supported by the National Natural Science Foundation of China (82002192), the Young and Middle-aged Talents Project of Hubei Provincial Education Department (Q20222605), and the Science and Technology Plan (in the field of medical and health care) of Xiangyang (2022YL12A; 2022YL05B).
Acknowledgments
We are grateful to Prof. Lan He from the College of Veterinary Medicine, Huazhong Agricultural University who kindly contributed the Babesia microti Peabody mjr strain used in this study.
Conflict of interest
The authors declare that the research was conducted in the absence of any commercial or financial relationships that could be construed as a potential conflict of interest.
Publisher’s note
All claims expressed in this article are solely those of the authors and do not necessarily represent those of their affiliated organizations, or those of the publisher, the editors and the reviewers. Any product that may be evaluated in this article, or claim that may be made by its manufacturer, is not guaranteed or endorsed by the publisher.
Supplementary material
The Supplementary Material for this article can be found online at: https://www.frontiersin.org/articles/10.3389/fcimb.2023.1179967/full#supplementary-material
Supplementary Figure 1 | Orthogonal partial least squares discriminant analysis (OPLS-DA) of the metabolite profile. (A) and (C): OPLS-DA score plots between the early infected group (EI) and the noninfected group (Ctrl) in ESI− mode (A) and ESI+ mode (C). (B) and (D): OPLS-DA model with 200 permutation tests between EI and Ctrl in ESI− mode (B) and in ESI+ mode (D).
Supplementary Figure 2 | Orthogonal partial least squares discriminant analysis (OPLS-DA) of the metabolite profile. (A) and (C): OPLS-DA score plots between the early infected group (EI) and the acutely infected group (AI) in ESI− mode (A) and ESI+ mode (C). (B) and (D): OPLS-DA model with 200 permutation tests between EI and AI in ESI− mode (B) and in ESI+ mode (D).
References
Akel, T., Mobarakai, N. (2017). Hematologic manifestations of babesiosis. Ann. Clin. Microbiol. Antimicrob. 16, 6. doi: 10.1186/s12941-017-0179-z
Antunes, S., Rosa, C., Couto, J., Ferrolho, J., Domingos, A. (2017). Deciphering Babesia-vector interactions. Front. Cell. Infect. Microbiol. 7, 429. doi: 10.3389/fcimb.2017.00429
Beri, D., Singh, M., Rodriguez, M., Goyal, N., Rasquinha, G., Liu, Y., et al. (2023). Global metabolomic profiling of host red blood cells infected with Babesia divergens reveals novel antiparasitic target pathways. Microbiol Spectr. 11, e0468822. doi: 10.1128/spectrum.04688-22
Bloch, E. M., Day, J. R., Krause, P. J., Kjemtrup, A., O’Brien, S. F., Tobian, A. A., et al (2022). Epidemiology of hospitalized patients with babesiosis, united state 2010–2016. Emerg. Infect. Dis. 28, 354–362. doi: 10.3201/eid2802.210213
Chen, Y., Li, E. M., Xu, L. Y. (2022). Guide to metabolomics analysis: a bioinformatics workflow. Metabolites 12, 357. doi: 10.3390/metabo12040357
Chienwichai, P., Nogrado, K., Tipthara, P., Tarning, J., Limpanont, Y., Chusongsang, P., et al. (2022). Untargeted serum metabolomic profiling for early detection of Schistosoma mekongi infection in mouse model. Front. Cell. Infect. Microbiol. 12, 910177. doi: 10.3389/fcimb.2022.910177
Das, U. N. (2018). Arachidonic acid and other unsaturated fatty acids and some of their metabolites function as endogenous antimicrobial molecules: a review. J. Adv. Res. 11, 57–66. doi: 10.1016/j.jare.2018.01.001
Das, A., Sahu, W., Ojha, D. K., Reddy, K. S., Suar, M. (2022). Comparative analysis of host metabolic alterations in murine malaria models with uncomplicated or severe malaria. J. Proteome Res. 21, 2261–2276. doi: 10.1021/acs.jproteome.2c00123
Fernández-Garcia, M., Sanchez-Flores, A., Gonzalez, L. M., Barbas, C., Rey-Stolle, M. F., Sevilla, E., et al. (2021). Integration of functional genomic, transcriptomic, and metabolomic data to identify key features in genomic expression, metabolites, and metabolic pathways of Babesia divergens. Methods Mol. Biol. 2369, 217–249. doi: 10.1007/978-1-0716-1681-9_13
Gong, H., Rahman, S. U., Zhou, K., Lin, Z., Mi, R., Huang, Y., et al. (2023). Temporal metabolic profiling of erythrocytes in mice infected with Babesia microti. Microb. Pathog. 175, 105954. doi: 10.1016/j.micpath.2022.105954
Gowda, G. N., Zhang, S., Gu, H., Asiago, V., Shanaiah, N., Raftery, D. (2008). Metabolomics-based methods for early disease diagnostics. Expert Rev. Mol. Diagn 8, 617–633. doi: 10.1586/14737159.8.5.617
Hajialiani, F., Shahbazzadeh, D., Maleki, F., Elmi, T., Tabatabaie, F., Zamani, Z. (2021). The metabolomic profiles of sera of mice infected with Plasmodium berghei and treated by effective fraction of naja naja oxiana using 1H nuclear magnetic resonance spectroscopy. Acta Parasitol. 66, 1517–1527. doi: 10.1007/s11686-021-00456-7
Homer, M. J., Aguilar-Delfin, I., Telford, S. R., III, Krause, P. J., Persing, D. H. (2000). Babesiosis. Clin. Microbiol. Rev. 13, 451–469. doi: 10.1128/CMR.13.3.451
Jean Beltran, P. M., Federspiel, J. D., Sheng, X., Cristea, I. M. (2017). Proteomics and integrative omic approaches for understanding host–pathogen interactions and infectious diseases. Mol. Syst. Biol. 13, 922. doi: 10.15252/msb.20167062
Katakura, Y., Totsuka, M., Imabayashi, E., Matsuda, H., Hisatsune, T. (2017). Anserine/carnosine supplementation suppresses the expression of the inflammatory chemokine CCL24 in peripheral blood mononuclear cells from elderly people. Nutrients 9, 1199. doi: 10.3390/nu9111199
Kilunga Kubata, B., Eguchi, N., Urade, Y., Yamashita, K., Mitamura, T., Tai, K., et al. (1998). Plasmodium falciparum produces prostaglandins that are pyrogenic, somnogenic, and immunosuppressive substances in humans. J. Exp. Med. 188, 1197–1202. doi: 10.1084/jem.188.6.1197
Kuleš, J., Rubić, I., Beer Ljubić, B., Bilić, P., Barić Rafaj, R., Brkljačić, M., et al. (2021). Combined untargeted and targeted metabolomics approaches reveal urinary changes of amino acids and energy metabolism in canine babesiosis with different levels of kidney function. Front. Microbiol. 12, 715701. doi: 10.3389/fmicb.2021.715701
Kumar, A., O’Bryan, J., Krause, P. J. (2021). The global emergence of human babesiosis. Pathogens 10, 1447. doi: 10.3390/pathogens10111447
Lakshmanan, V., Rhee, K. Y., Wang, W., Yu, Y., Khafizov, K., Fiser, A., et al. (2012). Metabolomic analysis of patient plasma yields evidence of plant-like α-linolenic acid metabolism in Plasmodium falciparum. J. Infect. Dis. 206, 238–248. doi: 10.1093/infdis/jis339
Liu, M., Ji, S., Kondoh, D., Galon, E. M., Li, J., Tomihari, M., et al. (2021). Tafenoquine is a promising drug candidate for the treatment of babesiosis. Antimicrob. Agents Chemother. 65, e0020421. doi: 10.1128/AAC.00204-21
Lizardo, K., Ayyappan, J. P., Ganapathi, U., Dutra, W. O., Qiu, Y., Weiss, L. M., et al. (2019). Diet alters serum metabolomic profiling in the mouse model of chronic chagas cardiomyopathy. Dis. Markers 2019, 4956016. doi: 10.1155/2019/4956016
Marchev, A. S., Vasileva, L. V., Amirova, K. M., Savova, M. S., Balcheva-Sivenova, Z. P., Georgiev, M. I. (2021). Metabolomics and health: from nutritional crops and plant-based pharmaceuticals to profiling of human biofluids. Cell. Mol. Life Sci. 78, 6487–6503. doi: 10.1007/s00018-021-03918-3
Pang, Z., Zhou, G., Ewald, J., Chang, L., Hacariz, O., Basu, N., et al. (2022). Using MetaboAnalyst 5.0 for LC–HRMS spectra processing, multi-omics integration and covariate adjustment of global metabolomics data. Nat. Protoc. 17, 1735–1761. doi: 10.1038/s41596-022-00710-w
Peters, V., Calabrese, V., Forsberg, E., Volk, N., Fleming, T., Baelde, H., et al. (2018). Protective actions of anserine under diabetic conditions. Int. J. Mol. Sci. 19, 2751. doi: 10.3390/ijms19092751
Ridlon, J. M., Wolf, P. G., Gaskins, H. R. (2016). Taurocholic acid metabolism by gut microbes and colon cancer. Gut Microbes 7, 201–215. doi: 10.1080/19490976.2016.1150414
Rubić, I., Burchmore, R., Weidt, S., Regnault, C., Kuleš, J., Barić Rafaj, R., et al. (2022). Multi platforms strategies and metabolomics approaches for the investigation of comprehensive metabolite profile in dogs with Babesia canis infection. Int. J. Mol. Sci. 23, 1575. doi: 10.3390/ijms23031575
Tallima, H., Hanna, V. S., El Ridi, R. (2020). Arachidonic acid is a safe and efficacious schistosomicide, and an endoschistosomicide in natural and experimental infections, and cysteine peptidase vaccinated hosts. Front. Immunol. 11, 609994. doi: 10.3389/fimmu.2020.609994
Tian, Q., Yang, R., Wang, Y., Liu, J., Wee, A., Saxena, R., et al. (2021). A high serum level of taurocholic acid is correlated with the severity and resolution of drug-induced liver injury. Clin. Gastroenterol. Hepatol. 19, 1009–1019. doi: 10.1016/j.cgh.2020.06.067
Tufts, D. M., Diuk-Wasser, M. A. (2021). Vertical transmission: a vector-independent transmission pathway of Babesia microti in the natural reservoir host peromyscus leucopus. J. Infect. Dis. 223, 1787–1795. doi: 10.1093/infdis/jiaa595
Vannier, E. G., Diuk-Wasser, M. A., Ben Mamoun, C., Krause, P. J. (2015). Babesiosis. Infect. Dis. Clin. North Am. 29, 357–370. doi: 10.1016/j.idc.2015.02.008
Vannier, E. G., Krause, P. J. (2012). Human babesiosis. N Engl. J. Med. 36, 2397–2407. doi: 10.1056/NEJMra1202018
Wikoff, W. R., Anfora, A. T., Liu, J., Schultz, P. G., Lesley, S. A., Peters, E. C., et al. (2009). Metabolomics analysis reveals large effects of gut microflora on mammalian blood metabolites. Proc. Nati Acad. Sci. U S A 106, 3698–3703. doi: 10.1073/pnas.0812874106
Wishart, D. S., Guo, A., Oler, E., Wang, F., Anjum, A., Peters, H., et al. (2022). HMDB 5.0: the human metabolome database for 2022. Nucleic Acids Res. 50, D622–D631. doi: 10.1093/nar/gkab1062
Wu, X. M., Yang, X., Fan, X. C., Chen, X., Wang, Y. X., Zhang, L. X., et al. (2021). Serum metabolomics in chickens infected with Cryptosporidium baileyi. Parasit Vectors 14, 336. doi: 10.1186/s13071-021-04834-y
Yi, W., Bao, W., Rodriguez, M., Liu, Y., Singh, M., Ramlall, V., et al. (2018). Robust adaptive immune response against Babesia microti infection marked by low parasitemia in a murine model of sickle cell disease. Blood Adv. 2, 3462–3478. doi: 10.1182/bloodadvances.2018026468
Yu, X., Feng, G., Zhang, Q., Cao, J. (2021). From metabolite to metabolome: metabolomics applications in Plasmodium research. Front. Microbiol. 11, 626183. doi: 10.3389/fmicb.2020.626183
Zhang, A., Sun, H., Wang, X. (2012). Serum metabolomics as a novel diagnostic approach for disease: a systematic review. Anal. Bioanal Chem. 404, 1239–1245. doi: 10.1007/s00216-012-6117-1
Zhou, C. X., Cong, W., Chen, X. Q., He, S. Y., Elsheikha, H. M., Zhu, X. Q. (2018). Serum metabolic profiling of oocyst-induced Toxoplasma gondii acute and chronic infections in mice using mass-spectrometry. Front. Microbiol. 8, 2612. doi: 10.3389/fmicb.2017.02612
Keywords: Babesia microti, mouse model, serum, metabolome, LC−MS
Citation: Shen L, Wang C, Wang R, Hu X, Liao S, Liu W, Du A, Ji S, Galon EM, Li H, Xuan X, Xiao J and Liu M (2023) Serum metabolomic profiles in BALB/c mice induced by Babesia microti infection. Front. Cell. Infect. Microbiol. 13:1179967. doi: 10.3389/fcimb.2023.1179967
Received: 05 March 2023; Accepted: 20 April 2023;
Published: 28 April 2023.
Edited by:
Haiyan Gong, Chinese Academy of Agricultural Sciences, ChinaReviewed by:
Hassan Hakimi, Texas A&M University College Station, United StatesFacai Li, Southwest University, China
Copyright © 2023 Shen, Wang, Wang, Hu, Liao, Liu, Du, Ji, Galon, Li, Xuan, Xiao and Liu. This is an open-access article distributed under the terms of the Creative Commons Attribution License (CC BY). The use, distribution or reproduction in other forums is permitted, provided the original author(s) and the copyright owner(s) are credited and that the original publication in this journal is cited, in accordance with accepted academic practice. No use, distribution or reproduction is permitted which does not comply with these terms.
*Correspondence: Mingming Liu, lmm_2010@hotmail.com; Juan Xiao, xiaoj@hbuas.edu.cn
†These authors have contributed equally to this work