 Spencer J. Spratt1Takaha Mizuguchi1Hikaru Akaboshi1Hina Kosakamoto2Rina Okada2Fumiaki Obata2,3
 Yasuyuki Ozeki1*
- 1Department of Electrical Engineering and Information Systems, The University of Tokyo, Tokyo, Japan
- 2Laboratory for Nutritional Biology, RIKEN Center for Biosystems Dynamics Research, Kobe, Japan
- 3Laboratory of Molecular Cell Biology and Development, Graduate School of Biostudies, Kyoto University, Kyoto, Japan
Introduction: Visualizing small individual biomolecules at subcellular resolution in live cells and tissues can provide valuable insights into metabolic activity in heterogeneous cells, but is challenging.
Methods: Here, we used stimulated Raman scattering (SRS) microscopy to image deuterated methionine (d-Met) incorporated into Drosophila tissues in vivo.
Results: Our results demonstrate that SRS can detect a range of previously uncharacterized cell-to-cell differences in d-Met distribution within a tissue at the subcellular level.
Discussion: These results demonstrate the potential of SRS microscopy for metabolic imaging of less abundant but important amino acids such as methionine in tissue.
1 Introduction
Small biomolecules, such as amino acids, are essential for life and play a crucial role in controlling cell fate through their participation in metabolic reactions. The metabolic profile of an individual can provide valuable information about their physiological status. However, while our understanding of the molecular details of these processes has improved, we still lack knowledge of their finer spatial details, which are important for understanding cell-to-cell differences. In cancer, such differences can lead to differential sensitivity to treatment and the emergence of resistant cells (Dagogo-Jack and Shaw, 2018). To better understand cellular heterogeneity and its implications for disease, it is necessary to visualize small biomolecules at subcellular resolution in live cells and tissue. However, this presents significant technical challenges.
Existing technologies used for medical bioimaging and metabolic profiling have limitations. Positron emission topography with magnetic resonance imaging (PET-MRI) (Castellano et al., 2021; Overcast et al., 2021) is applicable to in vivo imaging, but does not have the ability to resolve subcellular details. Mass spectrometry techniques (Hu et al., 2020; Goncalves et al., 2022) provide detailed molecular information and can include spatial resolution (Goncalves et al., 2022), but is destructive to cells and tissue, making it non-permissive for in situ testing. Click chemistry (Bird et al., 2021; Scinto et al., 2021) has more recently been used to bypass the cumbersome nature of the traditional probes in high resolution fluorescence microscopy, but these probes may not be non-invasive (Scinto et al., 2021; Spratt et al., 2022) and may not allow for the use of live cells. Additionally, most of these technologies have limited capabilities for long-term imaging.
Stimulated Raman scattering (SRS) microscopy is an imaging technique that can visualize the vibrational resonances of small biomolecules at subcellular resolution (Freudiger et al., 2008; Nandakumar et al., 2009; Ozeki et al., 2009; Ozeki et al., 2012). Its lower energy for excitation makes it well suited for use in fragile cell and tissue environments, and it has been applied in a variety of biological contexts (Cheng and Xie, 2015; Zhang and Cheng, 2018; Hill and Fu, 2019; Hu et al., 2019; Ozeki, 2020; Cheng et al., 2021). In principle, SRS can detect any molecule without the need for labeling, as each molecule has a unique spectral signature based on its bond characteristics. However, it has been difficult to specifically visualize single species among all the other molecules present. Nitriles and alkynes, which contain triple bonds (Shen et al., 2019) and have been used to label analogues (Wei et al., 2014; Wei et al., 2016), produce relatively strong signals in a region of the spectrum where most endogenous biomolecules do not. However, their submolecular differences do not allow them to fully mimic their natural counterparts, and this limits their use for long term imaging. Deuterium, or heavy hydrogen, consisting of an additional neutron, has shown promise as a submolecular label for imaging (van Manen et al., 2008). It has been used to label abundant amino acids such as leucine (Wei et al., 2013; Wei et al., 2015), as well as multiple amino acids (Wei et al., 2013; Wei et al., 2015; Wei et al., 2016). In recent work, deuterated water and the model organism Drosophila have further demonstrated the non-invasive nature of deuterium for systemic labelling in vivo and long-term imaging, highlighting its potential as a universal metabolic probe (Shi et al., 2018; Li et al., 2021; Li et al., 2022a; Li et al., 2022b; Fung et al., 2022). However, deuterium’s weaker vibrational resonance can limit the detectable signal, making it less suitable for labeling less abundant single species of biomolecules such as methionine (Met). Met is an essential amino acid and plays a crucial role in cell fate. Its metabolic product, S-adenosyl methionine (SAM), regulates stem cell division and differentiation (Shiraki et al., 2014; Obata et al., 2018), and Met is essential for cancer cell division (Hoffman and Erbe, 1976; Kaiser, 2020). In our recent work, we used deuterated methionine (d8-Met) and demonstrated the ability to detect the CD stretching peak of d8-Met by careful subtraction of background signal (Spratt et al., 2022).
Here, we expand upon this work and demonstrate SRS imaging to visualize d8-Met, in multiple dissected Drosophila tissues, incorporated systemically in vivo. By using our integrated SRS and fluorescence microscope (Figure 1), we were able to observe specific cells and investigate the heterogeneous nature of cells in tissue at subcellular resolution, observing cell-to-cell differences in d8-Met uptake and distribution. Here, we also see differences comparing tissue from Drosophila after genetic manipulation. We anticipate that d8-Met and other deuterated single species of small biomolecules have the potential to be useful for investigating metabolic processes at subcellular resolution and for understanding cell heterogeneity and cell fate.
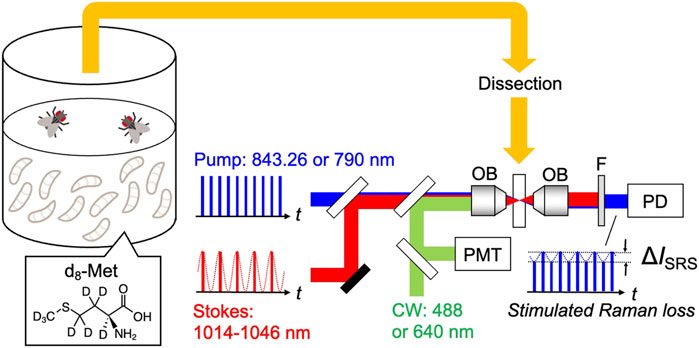
FIGURE 1. Schematic of the experiment: SRS and fluorescence imaging of tissue, dissected from Drosophila raised on holidic medium containing deuterated methionine (d8-Met). OB: objective lens, F: short-pass filter, PD: photodiode, PMT: photomultiplier tube.
2 Materials and methods
2.1 Drosophila stocks and husbandry
Flies were reared on a standard diet containing 4% cornmeal, 6% yeast, 6% glucose, and 0.8% agar with propionic acid and nipagin. The hsFLP, UAS-mCD8-GFP; act5C-FRTstopFRT-GAL4, UAS-GFP with UAS-TorTED genotype was used to generate marked cells and clones for imaging the fat body. The esg-GAL4, UAS-GFP, tub-Gal80t genotype (Obata et al., 2018) was used to mark stem cells and progenitor cells in the adult gut. The Canton S strain was used as the normal control.
2.2 Sample preparation for SRS imaging of Drosophila tissue
Flies were transferred to a modified version of holidic medium (Kosakamoto et al., 2022) supplemented with 3.82 mM d8-Met (Cambridge Isotope Laboratories: DLM-6797–0.1) instead of Met, for up to 48 h prior to dissection unless otherwise stated. Third instar larvae or one-week-old adult Drosophila were placed in phosphate buffered saline (PBS) (4°C) and dissected using forceps (Dumont, Inox, #5) under a dissecting microscope. n = 3 or greater and carried out on different days using at least two different populations. Tissues were mounted on glass coverslips (Matsunami: (24 mm × 50 mm, 0.13–0.17 mm); (round, 12 mm, 0.13–0.17 mm)) with SecureSeal imaging spacers (Grace Bio-Labs, 654008), in PBS, PBS with 4% paraformaldehyde (adult gut only), or PBS with LysoTracker Deep Red (Invitrogen, L12492), 50 μM.
2.3 SRS and fluorescence imaging
The integrated SRS and fluorescence imaging system used in this study is described previously (Shou et al., 2021; Spratt et al., 2022). The central wavelength of the pump pulses is fixed at 843.26 nm or 790 nm, with a spectral width of 0.15 nm for imaging the silent (2,000–2,300 cm−1) or CH stretching (2,800–3,100 cm−1) regions, respectively. The light is focused on the sample by an objective lens (Olympus, 60×, N. A. = 1.2 or Olympus, 25×, N. A. = 1.05) and the transmitted light is collected by another objective of the same type. After confirming the position of the spectral peak for d8-Met, measurements were taken for four spectral points each with 1,500 frames: 2,107, 2,127, 2,130, and 2,150 cm−1. SRS signal of d8-Met was obtained as
2.4 Data processing and image generation
SRS and fluorescence data were acquired with LabVIEW-FPGA software and processed using ImageJ to generate tissue images. For further details, please refer to (Spratt et al., 2022).
3 Results
3.1 SRS imaging of d8-Met in Drosophila tissues
To evaluate the in vivo incorporation of d8-Met in whole organisms, we raised Drosophila larvae on a holidic medium containing d8-Met and used SRS imaging to detect d8-Met signal in various tissues after dissection. In Figure 2, we compare d8-Met uptake in the Drosophila larval wing imaginal disc, larval brain, larval fat body, and adult gut. The subcellular characteristics of the relatively small wing disc cells and larval brain cells are not easily distinguished in the images (Figures 2A,B), and the homogenous distribution of high d8-Met signal may be due to the high division rate of these tissues at this stage (Tripathi and Irvine, 2022). The distribution of d8-Met in the relatively large fat body cells appears to show localized signal at specific loci or puncta (Figure 2C). These puncta appear to be located near subcellular structures resembling lipid droplets (LDs), which are commonly present in the fat body. The SRS image of gut tissue from an adult Drosophila kept in the same vial for 30 days (Figure 2D) shows a high level of signal, supporting the potential of d8-Met for long-term incorporation in vivo. These results support the use of SRS imaging with a deuterated probe to distinguish cellular features at subcellular resolution, depending on the cell type and developmental stage.
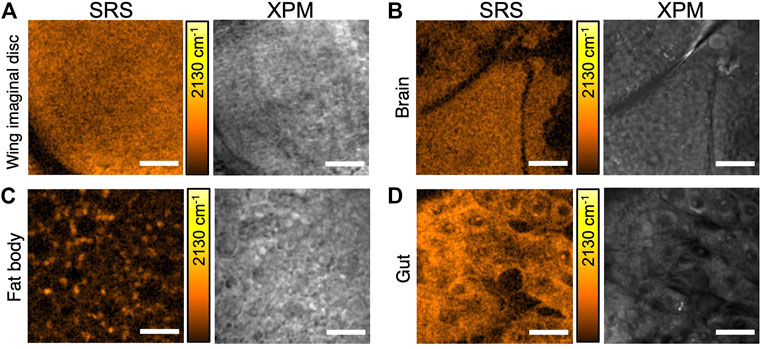
FIGURE 2. SRS imaging of d8-Met uptake in various Drosophila tissues. (A) larval wing imaginal disc, (B) larval brain, (C) larval fat body, and (D) adult gut. SRS images are shown (left side) with the corresponding background due to cross-phase modulation (XPM) (right side). The color bars corresponding to the d8-Met concentration shows maximum values of (A) 65 mM, (B) 40 mM, (C) 51 mM and (D) 37 mM. Scale bars 20 μm (A, D), 25 μm (B, C).
3.2 SRS and fluorescence imaging of cell-type dependent uptake of d8-Met
Many tissues consist of at least two cell types at some stage during their development, including stem cells and cells that have undergone determination to differentiate into a specific cell type with specific functions. A good example of this complexity is the Drosophila midgut, which consists of at least five cell types (Obata et al., 2018; Hung et al., 2020; Guo et al., 2022): intestinal stem cells (ISCs), enteroblasts (EBs), enteroendocrine progenitors (EEPs), enterocytes (ECs) and enteroendocrine cells (EEs). ISCs can self-renew or be determined/specified to differentiate into ECs or EEs via committed EBs or EEPs progenitor cells, respectively. ECs and EEs, have specialized functions such as gut enzyme secretion and hormone secretion, respectively (Guo et al., 2022). This arrangement continues throughout development from larval stages to the adult. The relatively large size of these cells makes the Drosophila gut a suitable model to investigate cell-to-cell differences within a tissue.
To examine d8-Met uptake in specific cell types, we used our SRS and fluorescence microscope, and the GAL4 UAS genetic technique (Brand and Perrimon, 1993) to control and direct expression. We marked midgut progenitor cells by directing the expression of GFP under the control of the escargot (esg) gene, which is known to be expressed in cells including ISCs and EBs. In the case of the adult gut, we fixed the dissected tissue to avoid any movement during the time required for imaging. d8-Met uptake in Drosophila adult gut shows a heterogeneous distribution (Figures 3A,C). Cell-to-cell differences in d8-Met uptake are clearly apparent, with some of the marked GFP expressing cells showing higher d8-Met uptake compared to the surrounding unmarked non-GFP expressing cells (Figures 3B,D). Furthermore, not all the purported progenitor cells marked with GFP show high d8-Met uptake, perhaps reflecting their heterogeneous nature. However, without further experiments, at this stage we are unable to comment further about each cell’s developmental stage or whether a more detailed description of a cell’s developmental stage could potentially benefit from the highly sensitive and quantitative capabilities of SRS.
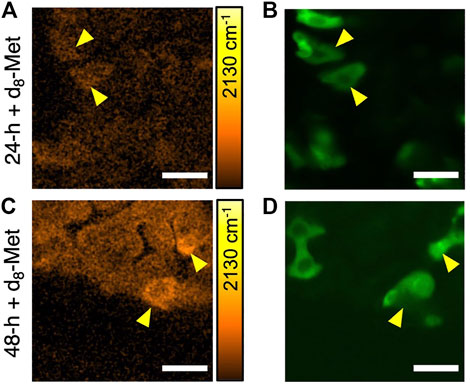
FIGURE 3. The uptake of d8-Met in fixed Drosophila adult gut cells varies by cell type. SRS images of d8-Met uptake (orange) after feeding on d8-Met food for 24 h (A) and 48 h (C). Yellow arrowheads indicate cells with high d8-Met signal (A, C) and their corresponding esg directed GFP expression (green) (B, D). The color bars corresponding to the d8-Met concentration shows maximum values of (A) 43 mM and (C) 45 mM. Scale bars, 25 μm.
3.3 d8-Met puncta have lysosomal characteristics
To further characterize the d8-Met positive puncta observed in the fat body tissue, we performed SRS imaging in the CH stretching region and observed strong SRS signal from CH2 stretching vibrations at 2,853 cm−1 (Figure 4C), which is typical of -CH2 vibrational frequencies, suggesting high amounts of lipid typical of LDs. The d8-Met positive puncta observed in the fat body tissue appear to be located around LDs (Figure 4A, Figure 2C). To further investigate the puncta and LDs, we used LysoTracker—a commercially available fluorescent probe that is commonly used to track acidic organelles, previously used to mark lysosomes including those lying near or interacting with LDs in Drosophila larval fat body (Scott et al., 2004). Our results show that some of the d8-Met positive puncta colocalize with LysoTracker (Figure 4B), indicating a lower pH and a lysosomal identity. In addition, not all d8-Met positive puncta colocalize with LysoTracker. The putative lysosomes appear to be located around the LDs (Figures 4B,C). Taken together, these observations raise interesting questions about d8-Met uptake kinetics and metabolism in the fat body, and whether lysosomes and additional organelles might play a role.
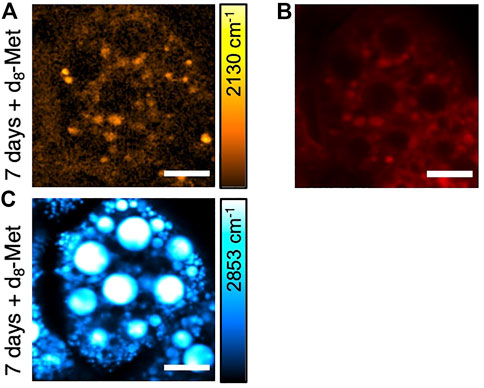
FIGURE 4. SRS and fluorescence imaging of Drosophila larval fat body. (A) d8-Met uptake (orange), (B) LysoTracker (red) and (C) lipid (blue). The color bar corresponding to the d8-Met concentration shows maximum values of (A) 42 mM. Scale bars, 20 μm.
3.4 Genetic manipulation of mTOR signaling in vivo can control d8-Met uptake
The mechanistic target of rapamycin (mTOR), a kinase that is a central regulator of cell metabolism (Simcox and Lamming, 2022), integrates signals from multiple sources to control cell fate. Deactivation of mTOR signaling can decelerate anabolic processes such as protein synthesis and lipid synthesis, and accelerate catabolic processes such as lysosome biogenesis and autophagy. Therefore, mTOR signaling is a suitable model to study the relationship between d8-Met uptake and the lysosome, as well as subcellular organelle biology in general.
Using the flip-out technique in Drosophila (Golic and Lindquist, 1989), which offers powerful genetic techniques to control biological processes in vivo, we directed the expression of TorTED (Hennig and Neufeld, 2002), a dominant negative form of mTOR that interferes and inhibits mTOR signaling in specific cells marked with GFP (Figure 5C). Remarkably, d8-Met uptake appears to be significantly reduced in fat body tissue with cells that have manipulated mTOR signaling (Figure 5B), suggesting that methionine uptake in Drosophila larval fat body is regulated by mTOR signaling. However, we do not currently understand why the lack of puncta appears to be global and does not correspond only to the pattern of GFP expression marking ectopic TorTED expressing cells (Figures 5B,C). One possibility is that, unlike the membrane tagged GFP, TorTED or a metabolic product of mTOR signaling disruption may cross membranes to affect adjacent cells. An alternative explanation might involve some other aspect of biology, perhaps related to the fat body’s important role in monitoring global homeostasis and the organism’s need for fast joint control of immediate metabolic demands.
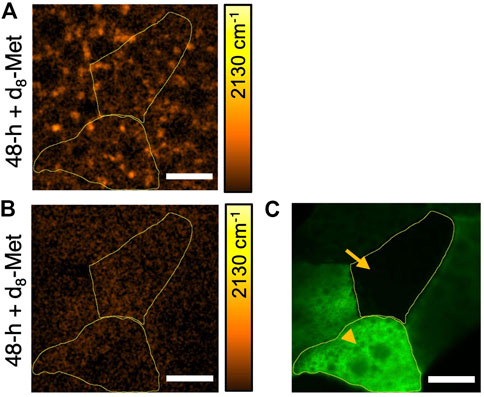
FIGURE 5. The uptake of d8-Met in the Drosophila larval fat body can vary according to genotype. d8-Met uptake (orange) in control (A) and TorTED expressing fat body tissue (B). The flip-out technique has been used to direct TorTED expression in GFP marked cells (green) (C) and demarcated areas (yellow boundaries) correspond to regions of interest (ROI), ROI1 (arrowhead) and ROI2 (arrow). Note that (B) and (C) corresponds to the same tissue and same field of view. The average d8-Met concentrations in ROI1 and ROI2 are (A) 3.68 mM and 3.34 mM, (B) 1.97 mM and 2.48 mM, respectively. The color bars corresponding to the d8-Met concentration shows a maximum value of 51 mM, Scale bars, 20 μm.
4 Discussion
In this work, we performed SRS imaging on dissected Drosophila tissue to detect the in vivo systemic incorporation of d8-Met. We demonstrate that SRS imaging is capable of detecting cell heterogeneity within live tissue and of providing detailed information about the distribution of d8-Met at subcellular resolution. These findings add to the growing evidence showing that SRS imaging of small deuterated biomolecules is a highly versatile and sensitive method for long-term analysis of metabolism, with the potential to track many aspects of metabolism from uptake and distribution to downstream molecular fate (Wei et al., 2013; Wei et al., 2015; Wei et al., 2016; Shi et al., 2018; Li et al., 2021; Li et al., 2022a; Li et al., 2022b; Fung et al., 2022). The high sensitivity and quantification capabilities of SRS imaging make it a useful tool for metabolic profiling with subcellular spatial resolution, and this will be useful for studying metabolism and cellular heterogeneity in a range of biological processes, including protein metabolism in development and diseases such as cancer. This technique could also be extended to other amino acids and small biomolecules, providing insights into the relationships between nutrition, metabolism, cell heterogeneity, cell fate and physiological status. Additionally, the ability to study specific biomolecules in live cells and tissues at subcellular resolution could be used for target identification in the search for therapeutics.
It is known that SAM is a key regulator of epigenetic control during normal development and disease (Moore et al., 2013). It has a close relationship with metabolism and is an important driver in cancer. SRS imaging of deuterated Met has the potential to add to our understanding of these biochemical processes and to provide detailed information at the subcellular level. However, it is important to note that there may be limitations to this approach. For example, it is unclear whether the signal from the deuterium atoms in the methyl group (CD3) may be affected by the additional five deuterium atoms present in other parts of d8-Met. Additionally, while the CD3 group of deuterated methionine provides a strong signal (Hu et al., 2014), it is possible that CD3 may have alternative fates aside from methylation. On the other hand, deuterated Met may also be useful for studying other aspects of Met metabolism. A recent study using SRS imaging and deuterated water as a probe found that manipulating the level of L-Met together with insulin can alter de novo lipogenesis, the process of synthesizing new lipids, in cancer cells (Fung et al., 2022). This raises interesting questions about the molecular fate under different conditions, such as the role of fatty acid chain elongation and redox control in lipogenesis. Deuterated methionine, along with other deuterated biomolecules, may be well suited to address these questions.
Also, while all our experiments thus far have been carried out on dissected tissue, SRS imaging on tissue in vivo has been carried out by other groups but has been limited to accessible tissues or embryos (Wei et al., 2015). SRS imaging does appear to have high potential to record embryonic development in oviparous organisms in vivo, should their size permit. Still, the limitation of tissue accessibility for SRS imaging in vivo may require miniaturization and an introduction of flexible components or remote technologies. Alternatively, from a systems perspective SRS imaging’s capability to track molecular fate appears to offer high potential for diagnostics using more accessible tissues.
5 Conclusion
In this study, we have generated SRS images of d8-Met in several dissected Drosophila tissues and demonstrated the ability to overcome the challenges that have previously limited long-term uptake of small biomolecules in live cells and tissue at subcellular resolution. In agreement with the known role of mTOR signaling in regulating Met uptake, we provided direct, real-time visualization of mTOR function controlling d8-Met uptake and distribution in the fat body. The ability to visualize the range of cell-to-cell differences of d8-Met distribution within tissue using SRS has significant potential for basic research on metabolic imaging of less abundant but important amino acids such as methionine and may also have potential for medical applications.
Data availability statement
The raw data supporting the conclusion of this article will be made available by the authors, without undue reservation.
Author contributions
YO, FO, and SJS conceived the concept and designed experiments. SJS conducted imaging experiments. TM and HA worked on the construction and maintenance of the imaging system. FO and HK prepared Drosophila samples. SJS analyzed the data. SJS and YO made the figures. SJS and YO wrote the manuscript with input from all other authors.
Funding
This work was supported in part by Japan Society for the Promotion of Science KAKENHI under JP20H02650, JP20H05725, JP20H05726, and JP21J00452; in part by Japan Science and Technology Agency Core Research for Evolutional Science and Technology (CREST) under Grant JPMJCR 1872; in part by Nakatani Foundation Grant for Technology Development Research, and in part by Quantum Leap Flagship Program of the Ministry of Education, Culture, Sports, Science and Technology (MEXT) under Grant JPMXS0118067246.
Conflict of interest
The authors declare that the research was conducted in the absence of any commercial or financial relationships that could be construed as a potential conflict of interest.
Publisher’s note
All claims expressed in this article are solely those of the authors and do not necessarily represent those of their affiliated organizations, or those of the publisher, the editors and the reviewers. Any product that may be evaluated in this article, or claim that may be made by its manufacturer, is not guaranteed or endorsed by the publisher.
References
Bird, R. E., Lemmel, S. A., Yu, X., and Qiongqiong, A. Z. (2021). Bioorthogonal chemistry and its applications. Bioconjug. Chem. 32, 2457–2479. doi:10.1021/acs.bioconjchem.1c00461
Brand, A. H., and Perrimon, N. (1993). Targeted gene expression as a means of altering cell fates and generating dominant phenotypes. Development 118, 401–415. doi:10.1242/dev.118.2.401
Castellano, A., Bailo, M., Cicone, F., Carideo, L., Quartuccio, N., Mortini, P., et al. (2021). Advanced imaging techniques for radiotherapy planning of gliomas. Cancers (Basel) 13, 1063. doi:10.3390/cancers13051063
Cheng, J. -X., Min, W., Ozeki, Y., and Polli, D. (2021). Stimulated Raman scattering microscopy – techniques and applications. Amsterdam, Netherlands: Elsevier.
Cheng, J. -X., and Xie, X. S. (2015). Vibrational spectroscopic imaging of living systems: An emerging platform for biology and medicine. Science 350, aaa8870. doi:10.1126/science.aaa8870
Dagogo-Jack, I., and Shaw, A. T. (2018). Tumour heterogeneity and resistance to cancer therapies. Nat. Rev. Clin. Oncol. 15, 81–94. doi:10.1038/nrclinonc.2017.166
Freudiger, C. W., Min, W., Saar, B. G., Lu, S., Holtom, G. R., He, C., et al. (2008). Label-free biomedical imaging with high sensitivity by stimulated Raman scattering microscopy. Science 322, 1857–1861. doi:10.1126/science.1165758
Fung, A. A., Hoang, K., Zha, H., Chen, D., Zhang, W., and Shi, L. (2022). Imaging sub-cellular methionine and insulin interplay in triple negative breast cancer lipid droplet metabolism. Front. Oncol. 12, 858017. doi:10.3389/fonc.2022.858017
Golic, K. G., and Lindquist, S. (1989). The FLP recombinase of yeast catalyzes site-specific recombination in the Drosophila genome. Cell 59, 499–509. doi:10.1016/0092-8674(89)90033-0
Goncalves, J. P. L., Bollwein, C., and Schwamborn, K. (2022). Mass spectrometry imaging spatial tissue analysis toward personalized medicine. Life (Basel) 12, 1037. doi:10.3390/life12071037
Guo, X., Lv, J., and Xi, R. (2022). The specification and function of enteroendocrine cells in Drosophila and mammals: A comparative review. FEBS J. 289, 4773–4796. doi:10.1111/febs.16067
Hennig, K. M., and Neufeld, T. P. (2002). Inhibition of cellular growth and proliferation by dTOR overexpression in Drosophila. Genesis 34, 107–110. doi:10.1002/gene.10139
Hill, A. H., and Fu, D. (2019). Cellular imaging using stimulated Raman scattering microscopy. Anal. Chem. 91, 9333–9342. doi:10.1021/acs.analchem.9b02095
Hoffman, R. M., and Erbe, R. W. (1976). High in vivo rates of methionine biosynthesis in transformed human and malignant rat cells auxotrophic for methionine. Proc. Natl. Acad. Sci. U. S. A. 73, 1523–1527. doi:10.1073/pnas.73.5.1523
Hu, F., Shi, L., and Min, W. (2019). Biological imaging of chemical bonds by stimulated Raman scattering microscopy. Nat. Methods 16, 830–842. doi:10.1038/s41592-019-0538-0
Hu, F., Wei, L., Zheng, C., Shen, Y., and Min, W. (2014). Live-cell vibrational imaging of choline metabolites by stimulated Raman scattering coupled with isotope-based metabolic labeling. Analyst 139, 2312–2317. doi:10.1039/c3an02281a
Hu, L., Liu, J., Zhang, W., Wang, T., Zhang, N., Lee, Y. H., et al. (2020). Functional metabolomics decipher biochemical functions and associated mechanisms underlie small-molecule metabolism. Mass Spectrom. Rev. 39, 417–433. doi:10.1002/mas.21611
Hung, R.-J., Hu, Y., Kirchner, R., Liu, Y., Xu, C., Comjean, A., et al. (2020). A cell atlas of the adult Drosophila midgut. Proc. Natl. Acad. Sci. U. S. A. 117, 1514–1523. doi:10.1073/pnas.1916820117
Kosakamoto, H., Okamoto, N., Aikawa, H., Sugiura, Y., Suematsu, M., Niwa, R., et al. (2022). Sensing of the non-essential amino acid tyrosine governs the response to protein restriction in Drosophila. Nat. Metab. 4, 944–959. doi:10.1038/s42255-022-00608-7
Li, Y., Bagheri, P., Chang, P., Zeng, A., Hao, J., Fung, A., et al. (2022). Direct imaging of lipid metabolic changes in Drosophila ovary during aging using DO-SRS microscopy. Front. Aging 2, 819903. doi:10.3389/fragi.2021.819903
Li, Y., Zhang, W., Fung, A. A., and Shi, L. (2021). DO-SRS imaging of metabolic dynamics in aging Drosophila. Analyst 146, 7510–7519. doi:10.1039/d1an01638e
Li, Y., Zhang, W., Fung, A. A., and Shi, L. (2022). DO-SRS imaging of diet regulated metabolic activities in Drosophila during aging processes. Aging Cell 21, e13586. doi:10.1111/acel.13586
Moore, L. D., Le, T., and Fan, G. (2013). DNA methylation and its basic function. Neuropsychopharmacology 38, 23–38. doi:10.1038/npp.2012.112
Nandakumar, P., Kovalev, A., and Volkmer, A. (2009). Vibrational imaging based on stimulated Raman scattering microscopy. New J. Phys. 11, 033026. doi:10.1088/1367-2630/11/3/033026
Obata, F., Tsuda-Sakurai, K., Yamazaki, T., Nishio, R., Nishimura, K., Kimura, M., et al. (2018). Nutritional control of stem cell division through S-adenosylmethionine in Drosophila intestine. Dev. Cell 44, 741–751.e3. doi:10.1016/j.devcel.2018.02.017
Overcast, W. B., Davis, K. M., Ho, C. Y., Hutchins, G. D., Green, M. A., Graner, B. D., et al. (2021). Advanced imaging techniques for neuro-oncologic tumor diagnosis, with an emphasis on PET-MRI imaging of malignant brain tumors. Curr. Oncol. Rep. 23, 34. doi:10.1007/s11912-021-01020-2
Ozeki, Y. (2020). Molecular vibrational imaging by stimulated Raman scattering microscopy: Principles and applications. Chin. Opt. Lett. 18, 121702–121711.
Ozeki, Y., Dake, F., Kajiyama, S., Fukui, K., and Itoh, K. (2009). Analysis and experimental assessment of the sensitivity of stimulated Raman scattering microscopy. Opt. Express 17, 3651–3658. doi:10.1364/oe.17.003651
Ozeki, Y., Umemura, W., Otsuka, Y., Satoh, S., Hashimoto, H., Sumimura, K., et al. (2012). High-speed molecular spectral imaging of tissue with stimulated Raman scattering. Nat. Photonics 6, 845–851. doi:10.1038/NPHOTON.2012.263
Scinto, S. L., Bioldeau, D. A., Hincapie, R., Lee, W., Nguyen, S. S., Xu, M., et al. (2021). Bioorthogonal chemistry. Nat. Rev. Methods Primers 1, 30. doi:10.1038/s43586-021-00028-z
Scott, R. C., Schuldiner, O., and Neufeld, T. P. (2004). Role and regulation of starvation-induced autophagy in the Drosophila fat body. Dev. Cell 7, 167–178. doi:10.1016/j.devcel.2004.07.009
Shen, Y., Hu, F., and Min, W. (2019). Raman imaging of small biomolecules. Annu. Rev. Biophys. 48, 347–369. doi:10.1146/annurev-biophys-052118-115500
Shi, L., Zheng, C., Shen, Y., Chen, Z., Silveira, E. S., Zhang, L., et al. (2018). Optical imaging of metabolic dynamics in animals. Nat. Commun. 9, 2995. doi:10.1038/s41467-018-05401-3
Shiraki, N., Shiraki, Y., Tsuyama, T., Obata, F., Miura, M., Nagae, G., et al. (2014). Methionine metabolism regulates maintenance and differentiation of human pluripotent stem cells. Cell Metab. 19, 780–794. doi:10.1016/j.cmet.2014.03.017
Shou, J., Oda, R., Hu, F., Karasawa, K., Nuriya, M., Yasui, M., et al. (2021). Super-multiplex imaging of cellular dynamics and heterogeneity by integrated stimulated Raman and fluorescence microscopy. iScience 24, 102832. doi:10.1016/j.isci.2021.102832
Simcox, J., and Lamming, D. W. (2022). The central moTOR of metabolism. Dev. Cell 57, 691–706. doi:10.1016/j.devcel.2022.02.024
Spratt, S. J., Oguchi, K., Miura, K., Asanuma, M., Kosakamoto, H., Obata, F., et al. (2022). Probing methionine uptake in live cells by deuterium labeling and stimulated Raman scattering. J. Phys. Chem. B 126, 1633–1639. doi:10.1021/acs.jpcb.1c08343
Tripathi, B. K., and Irvine, K. D. (2022). The wing imaginal disc. Genetics 220, iyac020. doi:10.1093/genetics/iyac020
van Manen, H.-J., Lenferink, A., and Otto, C. (2008). Noninvasive imaging of protein metabolic labeling in single human cells using stable isotopes and Raman microscopy. Anal. Chem. 80, 9576–9582. doi:10.1021/ac801841y
Wei, L., Hu, F., Chen, Z., Shen, Y., Zhang, L., and Min, W. (2016). Live-cell bioorthogonal chemical imaging: Stimulated Raman scattering microscopy of vibrational probes. Acc. Chem. Res. 49, 1494–1502. doi:10.1021/acs.accounts.6b00210
Wei, L., Hu, F., Shen, Y., Chen, Z., Yu, Y., Lin, C.-C., et al. (2014). Live-cell imaging of alkyne-tagged small biomolecules by stimulated Raman scattering. Nat. Methods 11, 410–412. doi:10.1038/nmeth.2878
Wei, L., Shen, Y., Xu, F., Hu, F., Harrington, J. K., Targoff, K. L., et al. (2015). Imaging complex protein metabolism in live organisms by stimulated Raman scattering microscopy with isotope labeling. ACS Chem. Biol. 10, 901–908. doi:10.1021/cb500787b
Wei, L., Yu, Y., Shen, Y., Wang, M. C., and Min, W. (2013). Vibrational imaging of newly synthesized proteins in live cells by stimulated Raman scattering microscopy. Proc. Natl. Acad. Sci. U. S. A. 110, 11226–11231. doi:10.1073/pnas.1303768110
Keywords: stimulated Raman scattering, methionine, deuterium, metabolic tracing, Drosophila, cell heterogeneity, mTOR
Citation: Spratt SJ, Mizuguchi T, Akaboshi H, Kosakamoto H, Okada R, Obata F and Ozeki Y (2023) Imaging the uptake of deuterated methionine in Drosophila with stimulated Raman scattering. Front. Chem. 11:1141920. doi: 10.3389/fchem.2023.1141920
Received: 11 January 2023; Accepted: 16 March 2023;
Published: 29 March 2023.
Edited by:
Chi Zhang, Purdue University, United StatesReviewed by:
Isaac Pence, University of Texas Southwestern Medical Center, United StatesSamir F. El-Mashtoly, Egypt-Japan University of Science and Technology, Egypt
Copyright © 2023 Spratt, Mizuguchi, Akaboshi, Kosakamoto, Okada, Obata and Ozeki. This is an open-access article distributed under the terms of the Creative Commons Attribution License (CC BY). The use, distribution or reproduction in other forums is permitted, provided the original author(s) and the copyright owner(s) are credited and that the original publication in this journal is cited, in accordance with accepted academic practice. No use, distribution or reproduction is permitted which does not comply with these terms.
*Correspondence: Yasuyuki Ozeki, b3pla2lAZWUudC51LXRva3lvLmFjLmpw