- 1Department of Medicinal Chemistry, School of Pharmaceutical Sciences, Cheeloo College of Medicine, Shandong University, Jinan, Shandong, China
- 2Department of Pharmaceutical Analysis, School of Pharmaceutical Sciences, Cheeloo College of Medicine, Shandong University, Jinan, Shandong, China
As a potent zinc chelator, hydroxamic acid has been applied in the design of inhibitors of zinc metalloenzyme, such as histone deacetylases (HDACs). A series of hydroxamic acids with HDAC inhibitory activities were subjected to the QSRR (Quantitative Structure–Retention Relationships) study. Experimental data in combination with calculated molecular descriptors were used for the development of the QSRR model. Specially, we employed PCA (principal component analysis) to accomplish dimension reduction of descriptors and utilized the principal components of compounds (16 training compounds, 4 validation compounds and 7 test compounds) to execute GA (genetic algorithm)-BP (error backpropagation) algorithm. We performed double cross-validation approach for obtaining a more convincing model. Moreover, we introduced molecular interaction-based features (molecular docking scores) as a new type of molecular descriptor to represent the interactions between analytes and the mobile phase. Our results indicated that the incorporation of molecular interaction-based features significantly improved the accuracy of the QSRR model, (R2 value is 0.842, RMSEP value is 0.440, and MAE value is 0.573). Our study not only developed QSRR model for the prediction of the retention time of hydroxamic acid in HPLC but also proved the feasibility of using molecular interaction-based features as molecular descriptors.
Introduction
Hydroxamic acids have metal chelating properties. Especially, due to the high chelating power to zinc ions, hydroxamic acids are widely used as inhibitors of enzymes having a Zn2+ in the active site (matrix metalloproteinases (MMPs), tumor necrosis factor-alpha (TNF-α) converting enzyme, and histone deacetylase (HDAC)) (Schaal et al., 2018; Ho et al., 2020; Sanyal et al., 2022). Moreover, some drugs possessing hydroxamic acid structure, especially HDAC inhibitors, have been approved for the clinic (Figure 1) (Ho et al., 2020). However, compounds having hydroxamic acid structure usually possess poor solubility and affect their chromatography analyze of them.
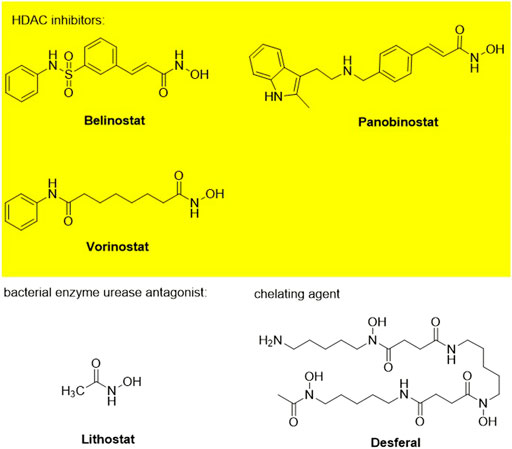
FIGURE 1. Chemical structures of hydroxamic acid-based drugs have been approved for the clinic or in clinical trails.
Chromatography is a method by which we can obtain a lot of precise, comparable, and repeatable retention data for structure-diverse compounds. At the same experimental conditions, we can get the almost same results on analytes’ retention data. In a chromatographic system, the molecular structure of a compound determines its properties, and further, affect relative affinity for the mobile and stationary phases and, therefore, its retention characteristics (Roman, 2007; Ganesh et al., 2022). The quantitative structure-retention relationships (QSRR) have been used as a model approach to establish methods of property prediction (Roman, 2007). So the construction of the QSRR model is helpful for the chromatography of hydroxamic acids. Reliable structural descriptors are necessary for QSRR models. Here, we choose the results of the scoring functions based on experience as the new structural descriptors to regression analysis for the first time. Scoring functions are usually used to evaluate the rationality of the receptor-ligand binding mode obtained theoretically. They also can be applied to estimate the binding affinity between the receptor and ligands for molecular docking and virtual screening.
Each analyte has its retention behavior in a chromatographic system. To great extent, the analyte’s retention behavior depends on the stationary phase of the chromatographic column and its structure. Some studies have reported the models to characterize the conformation of ODS (Octadecylsilyl) material (Figure 2A) and the interaction with solvent molecules (Ledesma and Wornat, 2000; Brambilla et al., 2007). Meanwhile, docking procedure has been used to select the best pose for each ligand to build QSPR model and docking descriptors are calculated based on the major interactions between ligand and cyclodextrin (Mirrahimi et al., 2016). So we hypothesize the material of stationary phase (ODS) and the analytes in the mobile phase as ‘receptors’ and ‘ligands’ respectively to simulate the combination between protein and ligands. Then we can get some scores that can characterize the molecular interaction-based feature and be used as descriptors through various scoring functions. We attempted to adopt the molecular modeling and docking method and consider the docking scores (molecular interaction-based features) as descriptors to characterize the interaction between the stationary phase and analytes for estimating a more reliable QSRR model.
Multiple variables can provide abundant information for the research technically. But in many cases, there may be correlations between variables, which increases the complexity of problem analysis. PCA (principal component analysis) is one of the most widely used data dimension reduction algorithms. It can eliminate noise and some unimportant information and change the variables into a few independent integrated variables which can stand for the most kinds of information existing in each original variable (Prasad et al., 2022). A certain range of information loss can save us a lot of time and cost. BP (error backpropagation) neural network is a neural network algorithm used in QSPR (quantitative structure-property relationships) research, QSAR (quantitative structure-activity relationships) research, and other models’ establishment widely and can handle complex data effectively (Luo et al., 2015; Bahmani et al., 2021; Yang et al., 2021; Xie and Xue, 2022). Therefore, we applied it in the establishment of the QSRR model. Meanwhile, the GA (genetic algorithm) is capable of optimizing the initial weight and threshold, thereby improving the robustness of the BP neural network (Zhang et al., 2019; Fang et al., 2022). And because of the wide application of hydroxamic acids in the area of HDAC inhibitors, we apply the PCA-GA-BP (Pan et al., 2007; Zhang et al., 2019; Li et al., 2020; Fang et al., 2022) neural network to establish the QSRR model to predict the retention time of hydroxamic acid-based HDAC inhibitors, for making it convenient to do HPLC and test whether molecular interaction-based features can be applied as new structure descriptors. Meanwhile, to ensure reliability and precision, we utilized double cross-validation, which contains internal (inner) and external (outer) cross-validation loops, to establish models (Roy and Arnbure, 2016).
Experimental
Chemicals and materials
If not specified, all chemicals were of analytical grade. The methanol was purchased from Fisher Chemical (HPLC Grade), while the formic acid was obtained from Kermel. The ultra-pure water was obtained from Heal Force SPW ultra-pure water system. All the twenty-seven analytes, including the marketed drugs or the compounds reported by our group’s former work (Wang et al., 2014; Fu et al., 2015; Liu et al., 2016), were the compounds possessing hydroxamic acid structure and were synthesized and confirmed by ourselves.
HPLC analysis
All the compounds were tested on Agilent 1,100 system (Agilent Technologies, USA), equipped with a quaternary pump, manual injector (20 μL sample loop), and VWD detector. The column used in this study was Phenomenex Luna 5u C18 (150*4.6 mm 5micron). The mobile phase consisted of 45% aqueous phase (contains 0.1% formic acid) and 55% methanol (contains 0.1% formic acid). The flow rate was 1 ml/min and the UV detection was performed at 254 nm. The retention time of each analyte was shown in Supplementary Table S1.
QSRR model generation
Calculation of the molecular descriptors
The steps of descriptor generation were as follows. First, we sketched molecular structures with ChemDraw 14.0. Then the molecules were minimized using Tripos Field (White, 1977; Motoc et al., 1986; Waltho et al., 1988; Clark et al., 1989; Purohit et al., 2020) in Sybyl-X 2.0 (SYBYL, 2012; Liang et al., 2021). The lowest energy structures were further optimized by undergoing (Turner et al., 2017) (PM7) (Stewart, 2013; Turner et al., 2017) in Molecular Orbital PACkage (MOPAC 2016) method. Then we used Schrödinger software to carry out the optimization function applying the Becke 3-parameter (exchange) with correlation by Lee Yang and Parr (B3LYP) (Becke, 1988; Lee et al., 1988; Becke, 1993; Stephens et al., 1994; Adekoya et al., 2022; Sakr et al., 2022) functional and the 6-31G (**) (Frisch et al., 1984; Adekoya et al., 2022; Sakr et al., 2022) basis set, density functional theory (DFT) (Calais, 1993; Koch and Holthausen, 2001; Adekoya et al., 2022; Sakr et al., 2022), and the standard Poisson-Boltzmann continuum solvation function (PBF) (Gilson et al., 1985; Sharp and Honig, 1990; Tomasi and Persico, 1994; Wang et al., 2017) for further geometry optimization.
The Molecular Descriptors function of Schrödinger software was applied to descriptors calculation. The molecular descriptors, Schrödinger software can calculate, contain three main categories: Topological Descriptors, QikProp Properties, and Semiempirical Properties. The Handbook of Molecular Descriptors (Roberto Todeschini and Consonni, 2000) details the calculation procedure. 273 molecular descriptors were obtained, and for the sake of minimizing subsequent problems of chance correlation, descriptors which were constant or near-constant values, less than 0.0001 concerning standard deviation, strongly correlated (descriptors with a correlation coefficient >0.90), and not available for all compounds were excluded. After the pre-reduction step, 197 molecular descriptors were obtained.
Molecular docking
The ODS model was manually established using Sybyl-X 2.0. All the analytes were docked against the ODS model using Surflex-Dock module (Jain, 2007; Singh et al., 2019). The representative docking result is shown in Figure 2B. For each analyte, the docked conformation with the highest was selected and 8 different types of docking scores as new descriptors, including Total_Score, Crash, Polar, D_SCORE, PMF_SCORE, G_SCORE, CHEMSCORE, GLOBAL_SCORE (Kuntz et al., 1982; Eldridge et al., 1997; Jones et al., 1997; Muegge and Martin, 1999). The docking scores of each analyte were summarized in Supplementary Table S2 in Supporting Information.
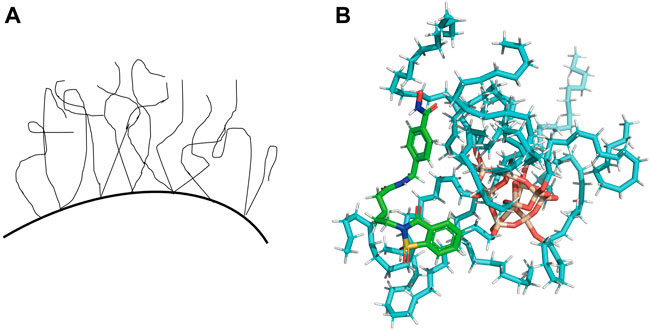
FIGURE 2. (A) The liquid-like configuration of ODS. (B) Representative docking result of one of the analytes in the ODS (C18) model.
Dimension reduction and the construction of the QSRR model
Because the descriptors were too much to get a good QSRR model rapidly, we performed the PCA on two matrixes, one consists of the descriptors without molecular interaction-based features and the other is made up of the descriptors with molecular interaction-based features, in Matlab (Matlab, 2013) to achieve the dimension reduction of independent variables (molecular descriptors). Before that, all the descriptors had to be standardized. The principal components which can reflect 95% of the original data were chosen for the building of the QSRR model.
The matrixes we obtained through PCA were independent variables and we added the retention time of each compound as the dependent variable to form two new matrixes. The retention time of each compound was added into the matrixes consisted of principal components to form two new matrixes. Each matrix was separated into two groups randomly, of which one was the training group consisted of twenty samples and the other one was the testing group consisted of seven samples. Each line was a sample and every column except the last one was the independent variable and the last column was the dependent variable.
GA-BP was performed on these two matrixes respectively. The matrix was divided into training group (20 compounds) which was used in the inner loop for the model training and selection, and test group (7 compounds) utilized to validate the precision of model externally. In the inner loop, we utilized 5-fold cross validation which means that we separate the training group into five portions and take four portions for training and one for validation for five times. Then we compared the mean absolute error (MAE) value of these five model in the internal validation and selected the one whose MAE value is lowest to process external prediction (Roy and Arnbure, 2016). Levenberg-Marquart optimization algorithm (Raja et al., 2021) was chosen for training step in Matlab R2020a. The number of the hidden layers and hidden neurons of each layer is significant for the BP model. The addition of hidden layers can reduce the error but also can make the network complicate and increase the training time and the tendency of over-fit. A single sufficiently largely hidden layer is adequate for the approximation of most simple functions (Reed and Marks, 1999). So one hidden layer is enough and we can increase the number of hidden neurons to improve the precision. The number of hidden neurons was determined with the experimental function (1).
h = the number of hidden neurons, m = the number of input nodes, n = the output nodes, α = adjustment constant between 1 and 10, and N = the number of training samples.
To validate the accuracy of GA-BP models built for this study, the R2, the root-mean-square error prediction (RMSEP) and MAE were measured for an independent set of analytes that were completely separate from the training set used in creating a QSRR model. R2 and RMSEP were defined as the function 2) (Alexander et al., 2015) and 3) (Žuvela et al., 2015) respectively.
yi (obsd) = observed retention time,
Applicability domain
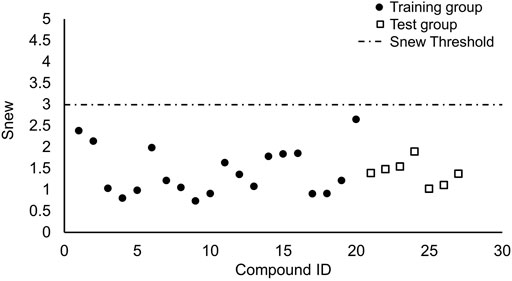
The purpose of establishing the QSRR model is to predict the retention value of new chemical entries falling within the applicability domain (AD) of the developed model. The reliability of any QSRR model relies on the confident predictions of these new compounds based on the AD of the model, and therein lies the importance of the AD study. Therefore, we harnessed an approach which has been reported to test the compounds we used whether were suitable. If the means of the Si (the corresponding standardized value for principal component i of one compound) values of a compound for all components in a model plus 1.28 times corresponding standard deviation (call it Snew) is lower than 3, then there is 90% probability that the Si values of that compound are lower than 3. Thus, when Snew value of a compound is lower than 3, then the compound can be considered to be not an X-outlier (if in the training group) or within the AD (if in the test group). (Roy et al., 2015).
Results and discussion
Generation of principal components
After the dimension reduction by the PCA, some components were obtained. The principal components were ranked according to the contribution rate and we selected the first few components whose cumulative contribution rate can reach 95% to form new matrixes. The matrix generated from the matrix without molecular interaction-based features was named matrix 1, the other one called matrix 2. The contribution rates of these principal components of two matrixes are shown in Table 1 and Table 2 (The principle components of each analyte of two matrixes were shown in Supplementary Tables S3, S4).
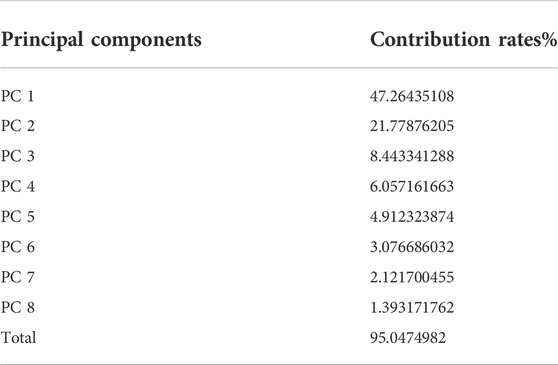
TABLE 1. Principal Components and their contribution rates (PCA was performed on the matrix consisting of descriptors without molecular interaction-based features).
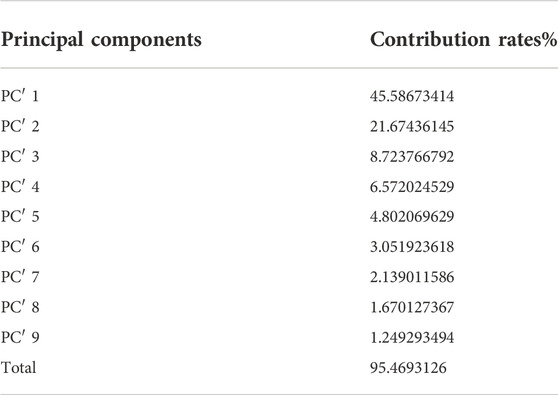
TABLE 2. Principal Components and their contribution rates (PCA was performed on the matrix consisting of descriptors with molecular interaction-based features).
According to the results of PCA performed on different matrixes, when the molecular interaction-based features are added as new descriptors, one more component was gained and the contribution rates of principal components are different. Since the PCA can reduce the correlation of variables and change the closely related variables into as few new variables as possible, these new variables are not related in pairs. It suggests the molecular interaction-based features, to a certain extent, are independent of other descriptors.
Determination of the number of hidden neurons
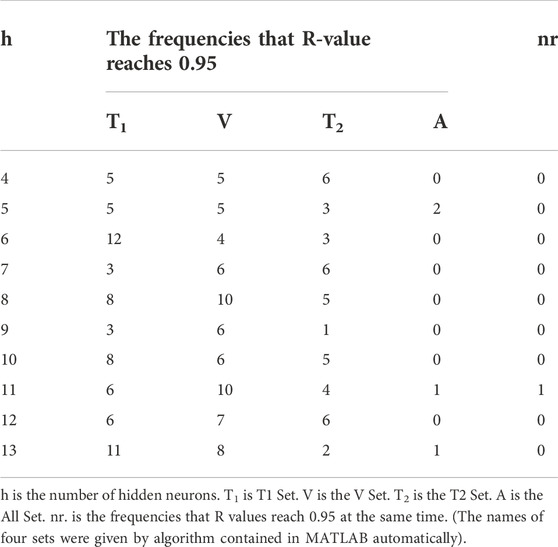
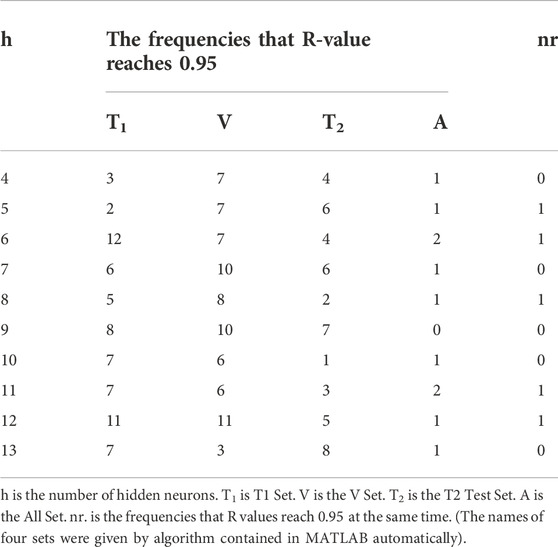
With the selection range of the number of hidden neurons existing, we used each number to test on each matrix 20 frequencies respectively to find the optimum number of hidden neurons. The Regression R values measure the correlation between outputs and targets, meaning predicted retention time and observed retention time here. An R-value of 1 means a close relationship and 0 means a random relationship. We took whether the Regression R-value reaches 0.95 as a simple judgment criterion of the training model and counted the number of frequencies that R-value reaches 0.95 when the different number of hidden neurons was chosen to run. The results are shown in Table 3 and Table 4.
According to the results above, the frequencies that R-value reaches 0.95 of the All Set have been improved apparently when we added the molecular interaction-based features as molecular descriptors, which suggested they are beneficial for the accuracy of QSRR models. Meanwhile, the frequencies that R values of four sets reach 0.95 at the same time are improved as well. Through the running with different numbers of hidden neurons on different matrixes, we decided to choose 11 hidden neurons to perform the GA-BP algorithm. Because the R values of Training Set, Validation Set, Test Set, and All Set (for the avoidance of the conflict of names, we renamed them T1 set, V set and T2 set), which were assigned randomly by the Levenberg-Marquart optimization algorithm, can reach 0.95 at the same time when we took eleven hidden neurons to perform the algorithm on the training group of matrix 1 and 2 (After the PCA, the matrix generated from the matrix without molecular interaction-based features named matrix 1, the other one called matrix 2).
The establishment of the QSRR model
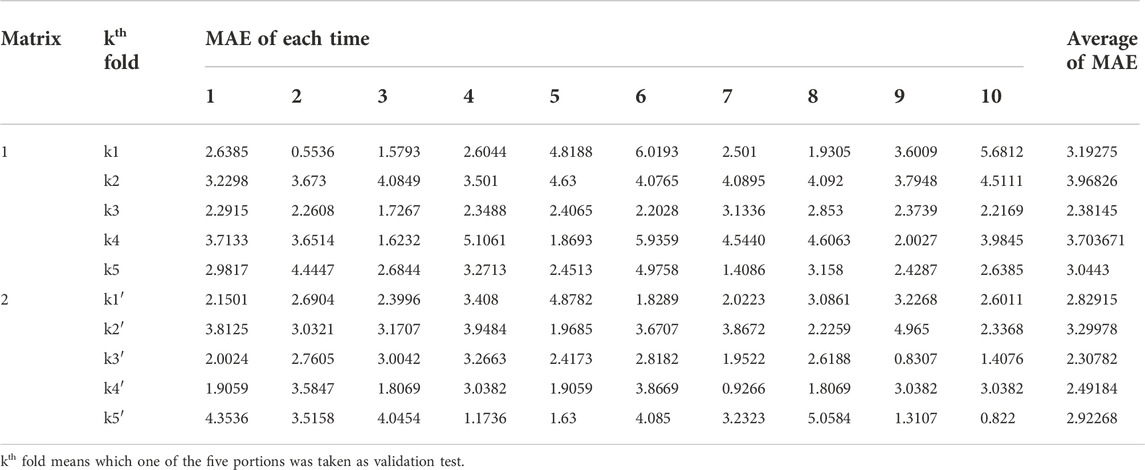
We took 11 hidden neurons and a double cross-validation approach to run GA-BP on the training groups of matrixes 1 and 2, and due to the random generation of weights initialization threshold, we take the same validation set to modelling 10 times respectively, then calculated the average of each training group (Table 5). Comparing the data shown in Table 5, we found that the MAE values of training groups whose principal components related to docking scores are mostly better than those without docking scores.
According to the averages of MAE values, we chose the third portion as the validation set in the inner loop of matrices 1 and 2. Then we used a test group to perform external prediction. The results are shown in Figure 3 which were the linear relationships of the predicted retention time obtained by using training models together with measured retention time and Table 6. The R2 values of both test groups are greater than 0.6, suggesting the models are not rejected irrespective of the absolute error (Alexander et al., 2015). But when we put molecular interaction-based features into running, the RMSEP value had no apparent improvement, which has areas for further optimism. However, the MAE value becomes better. It manifested the molecular interaction-based features as an independent category of descriptors that were helpful to the establishment of the QSRR model to predict the retention time of hydroxamic acid.
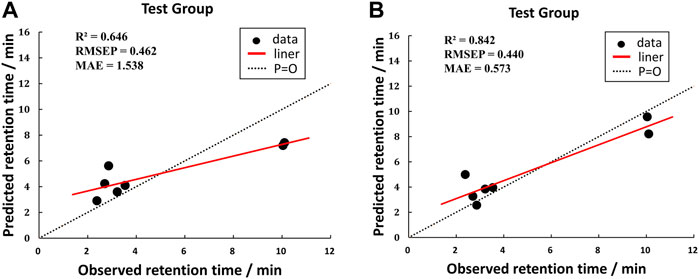
FIGURE 3. Comparison of test results of two matrixes. [(A) was the test group of matrix 1, and (B) was the test group of matrix 2].
Applicability domain
We performed the reported program to calculate the Snew values of our compounds. The result was shown in Figure 4. The Snew values of all the compounds we used are lower than 3, which means they are suitable for the model and not X-outlier (if in the training group) or within the AD (if in the test group).
Detection of systematic error in predictions
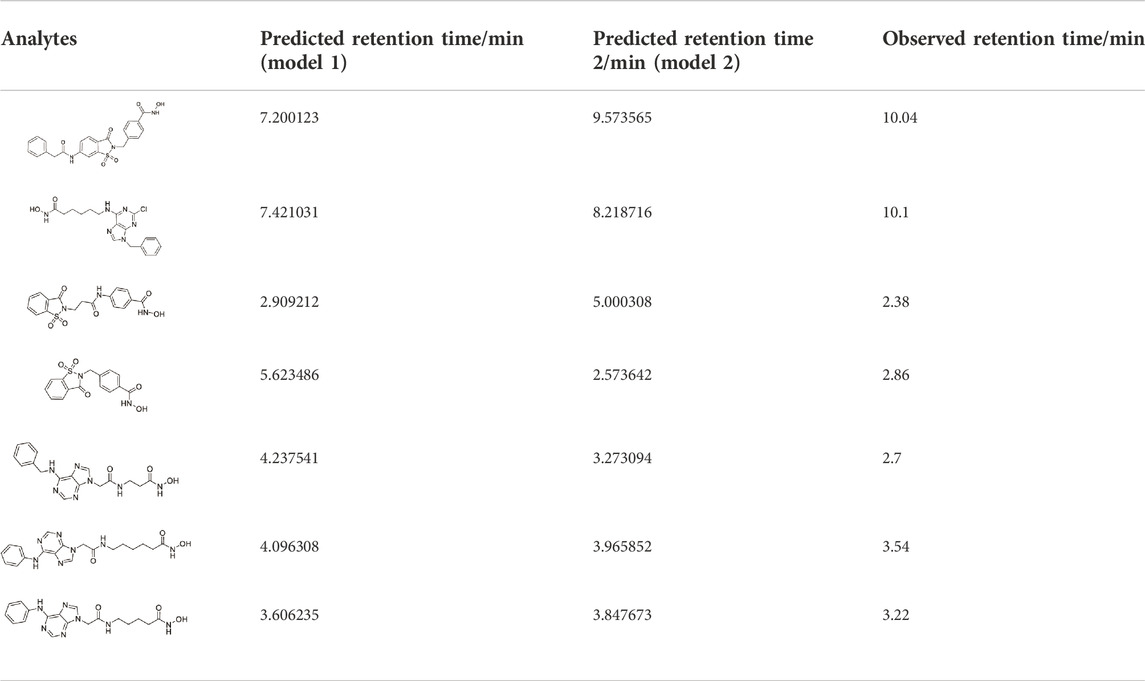
For the determination of the quality of QSRR-derived predictions, we calculated the following five values: ratio of the number of positive and negative errors (NPE/NNE), absolute (ABS) of average error (AE) with mean absolute error (MAE), mean positive error (MPE) with mean negative error (MNE). The data was shown in Table 7.
Recording to the reported criterions: 1) NPE/NNE >5 or NNE/NPE >5; 2) ABS(MPE/MNE) > 2 or ABS(MNE/MPE) > 2; 3) MAE - ABS(AE) < 0.5×MAE; 4) R2 (ith vs. (i-1)th residuals) > 0.5 for residuals sorted on Ypred; 5) R2(Y vs. residuals) > 0.5 [57], even if our models are not satisfy, in the future work, we need more analytes to improve, due to not satisfying the standard of number (at least 10).
PLS using docking scores
To investigate the relationship between molecular interaction-based features and retention time of compounds, we used molecular docking scores alone to run the PLS algorism in Matlab. Fifteen analytes were used as a training group to generate the coefficients of each type of docking score and the constant term. The simulation training and predicting of the test group were following (Figure 5). We found that a remarkable error existed between the predicted retention time and observed retention time. Our results suggested the regression using molecular interaction-based features alone to construct the QSRR model is unfeasible.
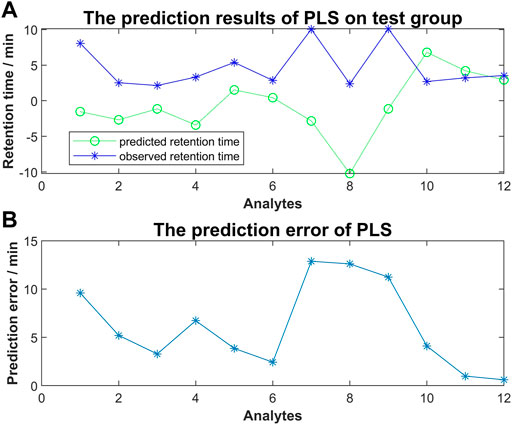
FIGURE 5. (A) The predicted retention time obtained by PLS method vs. observed retention time; (B) The prediction error of PLS for each analyte of the test group.
Analyze of the relevance between molecular interaction-based features and retention time
We took the molecular docking results of two analytes (analyte 6 and 23 are shown in Supplementary Table S1 and Figure 6), whose retention time is notably different (14.86 min vs 2.38 min), to investigate the relevance. The docking results are shown in Figures 6A,B. Obviously, analyte 6 could occupy larger area of ODS surface than analyte 23. As expected, the docking scores of analyte 6 are larger than that of analyte 23 (Figure 6C). Therefore, if the analytes could occupy more area of the material, it could generate more interaction force between these two things and have better docking result (larger minus) and large retention values. So, these molecular interaction-based features could be helpful to the prediction of analytes and improve the precision of QSRR models.
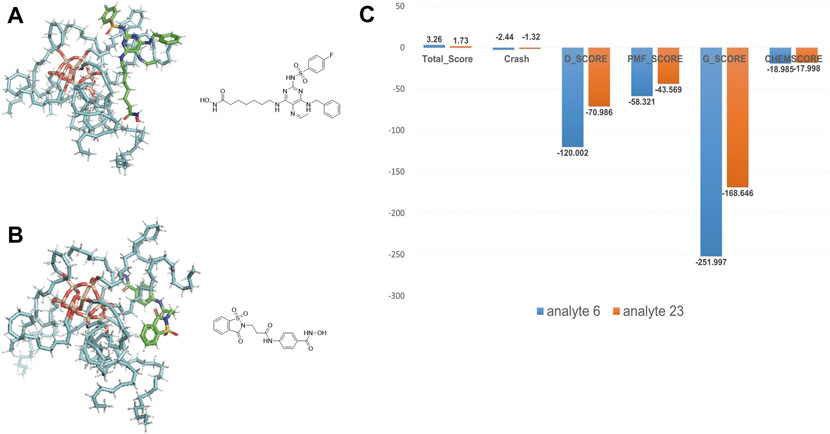
FIGURE 6. (A) The docking result of analyte 6. (B) The docking result of analyte 23. (C) Comparison of molecular docking scores (molecular interaction-based features) of analyte 6 and 23.
Conclusion
The PCA-GA-BP method was employed to establish QSRR models for hydroxamic acids and the double cross-validation approach using internal 5-fold cross validation guaranteed the reliability of training model and exploited finite training compounds sufficiently. The interaction between analytes and solid-phase materials was measured using molecular docking scores, which were introduced as new features in the QSRR model. These features could manifest the strength of interaction between analytes and solid-phase material (At least in the docking of drug molecules and proteins). As a new type of molecular descriptors, molecular interaction-based features (docking scores) could contribute to the dimension reduction, selection of hidden neurons, model selection and prediction of retention time. Our QSRR model could be used to predict the retention time of hydroxamic acids.
Data availability statement
The original contributions presented in the study are included in the article/Supplementary Materials, further inquiries can be directed to the corresponding authors.
Author contributions
YN: Methodology, Software, Validation, Investigation, Writing—original draft. JL: Validation, Resources. XY: Validation, Resources. XH: Conceptualization, Methodology, Resources, Writing—review and editing. HF: Conceptualization, Methodology, Resources, Writing—review and editing.
Funding
This work was supported by the National Nature Science Foundation of China (81874288, 92053105, and 82003590), the Shandong Provincial Natural Science Foundation (ZR2019LZL004 and ZR2020QH342).
Acknowledgments
We genuinely thank the Advanced Medical Research Institute, Shandong University, for their help in the experiments.
Conflict of interest
The authors declare that the research was conducted in the absence of any commercial or financial relationships that could be construed as a potential conflict of interest.
Publisher’s note
All claims expressed in this article are solely those of the authors and do not necessarily represent those of their affiliated organizations, or those of the publisher, the editors and the reviewers. Any product that may be evaluated in this article, or claim that may be made by its manufacturer, is not guaranteed or endorsed by the publisher.
Supplementary material
The Supplementary Material for this article can be found online at: https://www.frontiersin.org/articles/10.3389/fchem.2022.1056701/full#supplementary-material
References
Adekoya, O. C., Adekoya, G. J., Sadiku, E. R., Hamam, Y., and Ray, S. S. (2022). Application of DFT calculations in designing polymer-based drug delivery systems: An overview. Pharmaceutics 14 (9), 1972. doi:10.3390/pharmaceutics14091972
Alexander, D. L., Tropsha, A., and Winkler, D. A. (2015). Beware of R(2): Simple, unambiguous assessment of the prediction accuracy of QSAR and QSPR models. J. Chem. Inf. Model. 55 (7), 1316–1322. doi:10.1021/acs.jcim.5b00206
Bahmani, A., Tanzadehpanah, H., Hosseinpour Moghadam, N., and Saidijam, M. (2021). Introducing a pyrazolopyrimidine as a multi-tyrosine kinase inhibitor, using multi-QSAR and docking methods. Mol. Divers. 25 (2), 949–965. doi:10.1007/s11030-020-10080-8
Becke, A. D. (1993). A new mixing of Hartree–Fock and local density-functional theories. J. Chem. Phys. 98 (2), 1372–1377. doi:10.1063/1.464304
Becke, A. D. (1988). Density-functional exchange-energy approximation with correct asymptotic behavior. Phys. Rev. A . Coll. Park. 38 (6), 3098–3100. doi:10.1103/physreva.38.3098
Brambilla, R., Pires, G. P., dos Santos, J. H., Miranda, M. S. L., and Chornik, B. (2007). Octadecylsilane-modified silicas prepared by grafting and sol–gel methods. J. Electron Spectrosc. Relat. Phenom. 156-158, 413–420. doi:10.1016/j.elspec.2006.12.053
Calais, J.-L. (1993). Density-functional theory of atoms and molecules. R.G. Parr and W. Yang, oxford university press, New York, oxford, 1989. IX + 333 pp. Price £45.00. Int. J. Quantum Chem. 47 (1), 101. doi:10.1002/qua.560470107
Clark, M., Cramer, R. D., and Van Opdenbosch, N. (1989). Validation of the general purpose tripos 5.2 force field. J. Comput. Chem. 10 (8), 982–1012. doi:10.1002/jcc.540100804
Eldridge, M. D., Murray, C. W., Auton, T. R., Paolini, G. V., and Mee, R. P. (1997). Empirical scoring functions: I. The development of a fast empirical scoring function to estimate the binding affinity of ligands in receptor complexes. J. Comput. Aided. Mol. Des. 11 (5), 425–445. doi:10.1023/a:1007996124545
Fang, M., Zhu, Z., and Zhang, Z. (2022). Numerical simulation of closed plastic impeller molding process and its parameter optimization. Sci. Rep. 12 (1), 17335. doi:10.1038/s41598-022-22260-7
Frisch, M. J., Pople, J. A., and Binkley, J. S. (1984). Self-consistent molecular orbital methods 25. Supplementary functions for Gaussian basis sets. J. Chem. Phys. 80 (7), 3265–3269. doi:10.1063/1.447079
Fu, H., Han, L., Hou, X., Dun, Y., Wang, L., Gong, X., et al. (2015). Design, synthesis and biological evaluation of saccharin-based N-hydroxybenzamides as histone deacetylases (HDACs) inhibitors. Bioorg. Med. Chem. 23 (17), 5774–5781. doi:10.1016/j.bmc.2015.07.008
Ganesh, V., Poorna Basuri, P., Sahini, K., and Nalini, C. N. (2022). Retention behaviour of analytes in reversed-phase high-performance liquid chromatography-A review. Biomed. Chromatogr., e5482. doi:10.1002/bmc.5482
Gilson, M. K., Rashin, A., Fine, R., and Honig, B. (1985). On the calculation of electrostatic interactions in proteins. J. Mol. Biol. 184 (3), 503–516. doi:10.1016/0022-2836(85)90297-9
Ho, T. C. S., Chan, A. H. Y., and Ganesan, A. (2020). Thirty years of HDAC inhibitors: 2020 insight and hindsight. J. Med. Chem. 63 (21), 12460–12484. doi:10.1021/acs.jmedchem.0c00830
Jain, A. N. (2007). Surflex-Dock 2.1: Robust performance from ligand energetic modeling, ring flexibility, and knowledge-based search. J. Comput. Aided. Mol. Des. 21 (5), 281–306. doi:10.1007/s10822-007-9114-2
Jones, G., Willett, P., Glen, R. C., Leach, A. R., and Taylor, R. (1997). Development and validation of a genetic algorithm for flexible docking 1 1Edited by F. E. Cohen. J. Mol. Biol. 267 (3), 727–748. doi:10.1006/jmbi.1996.0897
Koch, W. H., and Holthausen, M. C. (2001). A chemist's guide to density functional theory. second ed. Weinheim, Germany: Wiley VCH.
Kuntz, I. D., Blaney, J. M., Oatley, S. J., Langridge, R., and Ferrin, T. E. (1982). A geometric approach to macromolecule-ligand interactions. J. Mol. Biol. 161 (2), 269–288. doi:10.1016/0022-2836(82)90153-x
Ledesma, E. B., and Wornat, M. J. (2000). QSRR prediction of chromatographic retention of ethynyl-substituted PAH from semiempirically computed solute descriptors. Anal. Chem. 72 (21), 5437–5443. doi:10.1021/ac000296r
Lee, C., Yang, W., and Parr, R. G. (1988). Development of the Colle-Salvetti correlation-energy formula into a functional of the electron density. Phys. Rev. B 37 (2), 785–789. doi:10.1103/physrevb.37.785
Li, X., Cheng, X., Wu, W., Wang, Q., Tong, Z., Zhang, X., et al. (2020). Forecasting of bioaerosol concentration by a Back Propagation neural network model. Sci. Total Environ. 698, 134315. doi:10.1016/j.scitotenv.2019.134315
Liang, B., Gao, L., Wang, F., Li, Z., Li, Y., Tan, S., et al. (2021). The mechanism research on the anti-liver fibrosis of emodin based on network pharmacology. IUBMB Life 73 (9), 1166–1179. doi:10.1002/iub.2523
Liu, R., Wang, J., Tang, W., and Fang, H. (2016). Design and synthesis of a new generation of substituted purine hydroxamate analogs as histone deacetylase inhibitors. Bioorg. Med. Chem. 24 (7), 1446–1454. doi:10.1016/j.bmc.2016.02.005
Luo, J., Hu, J., Wei, X., Li, L., and Huang, X. (2015). Excited states and photodebromination of selected polybrominated diphenyl ethers: Computational and quantitative structure--property relationship studies. Int. J. Mol. Sci. 16 (1), 1160–1178. doi:10.3390/ijms16011160
Mirrahimi, F., Salahinejad, M., and Ghasemi, J. B. (2016). QSPR approaches to elucidate the stability constants between β-cyclodextrin and some organic compounds: Docking based 3D conformer. J. Mol. Liq. 219, 1036–1043. doi:10.1016/j.molliq.2016.04.037
Motoc, I., Dammkoehler, R. A., Mayer, D., and Labanowski, J. (1986). Three-Dimensional quantitative structure-activity relationships I. General approach to the pharmacophore model validation. Quant. Struct. -Act. Relat. 5, 99–105. doi:10.1002/qsar.19860050305
Muegge, I., and Martin, Y. C. (1999). A general and fast scoring function for protein-ligand interactions: A simplified potential approach. J. Med. Chem. 42 (5), 791–804. doi:10.1021/jm980536j
Pan, Y., Jiang, J., and Wang, Z. (2007). Quantitative structure-property relationship studies for predicting flash points of alkanes using group bond contribution method with back-propagation neural network. J. Hazard. Mat. 147 (1-2), 424–430. doi:10.1016/j.jhazmat.2007.01.025
Prasad, P., Raut, P., Goel, S., Barnwal, R. P., and Bodhe, G. L. (2022). Electronic nose and wireless sensor network for environmental monitoring application in pulp and paper industry: A review. Environ. Monit. Assess. 194 (12), 855. doi:10.1007/s10661-022-10479-w
Purohit, D., Saini, V., Kumar, S., Kumar, A., and Narasimhan, B. (2020). Three-dimensional quantitative structure-activity relationship (3DQSAR) and molecular docking study of 2-((pyridin-3-yloxy)methyl) piperazines as α7 nicotinic acetylcholine receptor modulators for the treatment of inflammatory disorders. Mini Rev. Med. Chem. 20 (11), 1031–1041. doi:10.2174/1389557519666190904151227
Raja, M. A. Z., Sabati, M., Parveen, N., Awais, M., Awan, S. E., Chaudhary, N. I., et al. (2021). Integrated intelligent computing application for effectiveness of Au nanoparticles coated over MWCNTs with velocity slip in curved channel peristaltic flow. Sci. Rep. 11 (1), 22550. doi:10.1038/s41598-021-98490-y
Roberto Todeschini, V. C., and Consonni, V. (2000). Handbook of molecular descriptors. Methods Princ. Med. Chem. doi:10.1002/9783527613106
Roman, K. (2007). QSRR quantitative structure-(chromatographic) retention relationships. Chem. Rev. 107, 3212–3246. doi:10.1021/cr068412z
Roy, K., and Arnbure, P. (2016). The "double cross-validation" software tool for MLR QSAR model development. Chemom. Intelligent Laboratory Syst. 159, 108–126. doi:10.1016/j.chemolab.2016.10.009
Roy, K., Kar, S., and Ambure, P. (2015). On a simple approach for determining applicability domain of QSAR models. Chemom. Intelligent Laboratory Syst. 145, 22–29. doi:10.1016/j.chemolab.2015.04.013
Sakr, M. A. S., Sherbiny, F. F., and El-Etrawy, A. S. (2022). Hydrazone-based materials; DFT, TD-DFT, NBO analysis, fukui function, MESP analysis, and solar cell applications. J. Fluoresc. 32 (5), 1857–1871. doi:10.1007/s10895-022-03000-6
Sanyal, S., Amin, S. A., Banerjee, P., Gayen, S., and Jha, T. (2022). A review of MMP-2 structures and binding mode analysis of its inhibitors to strategize structure-based drug design. Bioorg. Med. Chem. 74, 117044. doi:10.1016/j.bmc.2022.117044
Schaal, J. B., Maretzky, T., Tran, D. Q., Tran, P. A., Tongaonkar, P., Blobel, C. P., et al. (2018). Macrocyclic θ-defensins suppress tumor necrosis factor-α (TNF-α) shedding by inhibition of TNF-α-converting enzyme. J. Biol. Chem. 293 (8), 2725–2734. doi:10.1074/jbc.ra117.000793
Sharp, K. A., and Honig, B. (1990). Electrostatic interactions in macromolecules: Theory and applications. Annu. Rev. Biophys. Biophys. Chem. 19, 301–332. doi:10.1146/annurev.bb.19.060190.001505
Singh, R. R., Rajnarayanan, R., and Aga, D. S. (2019). Binding of iodinated contrast media (ICM) and their transformation products with hormone receptors: Are ICM the new EDCs? Sci. Total Environ. 692, 32–36. doi:10.1016/j.scitotenv.2019.07.159
Stephens, P. J., Devlin, F. J., Chabalowski, C. F., and Frisch, M. J. (1994). Ab-initio calculation of vibrational absorption and circular-dichroism spectra using density-functional force-fields. J. Phys. Chem. 98 (45), 11623–11627. doi:10.1021/j100096a001
Stewart, J. J. (2013). Optimization of parameters for semiempirical methods VI: More modifications to the NDDO approximations and re-optimization of parameters. J. Mol. Model. 19 (1), 1–32. doi:10.1007/s00894-012-1667-x
SYBYL (2012). SYBYL® is available from Tripos Inc., S.L., MO 63144. St. Louis, USA: Tripos International.
Tomasi, J., and Persico, M. (1994). Molecular interactions in solution: An overview of methods based on continuous distributions of the solvent. Chem. Rev. 94 (7), 2027–2094. doi:10.1021/cr00031a013
Turner, M., Deeth, R. J., and Platts, J. A. (2017). Prediction of ligand effects in platinum-amyloid-β coordination. J. Inorg. Biochem. 173, 44–51. doi:10.1016/j.jinorgbio.2017.05.003
Waltho, J. P., Vinter, J. G., Davis, A., and Williams, D. H. (1988). Forces in molecular recognition: Comparison of experimental data and molecular mechanics calculations. J. Comput. Aided. Mol. Des. 2 (1), 31–41. doi:10.1007/bf01532051
Wang, C., Xiao, L., and Luo, R. (2017). Numerical interpretation of molecular surface field in dielectric modeling of solvation. J. Comput. Chem. 38 (14), 1057–1070. doi:10.1002/jcc.24782
Wang, J., Sun, F., Han, L., Hou, X., Pan, X., Liu, R., et al. (2014). Design, synthesis, and preliminary bioactivity studies of substituted purine hydroxamic acid derivatives as novel histone deacetylase (HDAC) inhibitors. MedChemComm 5 (12), 1887–1891. doi:10.1039/c4md00203b
White, D. N. J. (1977). The principles and practice of molecular mechanics calculations. Comput. Chem. 1 (3), 225–233. doi:10.1016/0097-8485(77)85014-6
Xie, Q., and Xue, Y. (2022). The prediction of public risk perception by internal characteristics and external environment: Machine learning on big data. Int. J. Environ. Res. Public Health 19 (15), 9545. doi:10.3390/ijerph19159545
Yang, X., Zhang, Z., Li, Q., and Cai, Y. (2021). Quantitative structure-activity relationship models for genotoxicity prediction based on combination evaluation strategies for toxicological alternative experiments. Sci. Rep. 11 (1), 8030. doi:10.1038/s41598-021-87035-y
Zhang, C., Zhang, R., Dai, Z., He, B., and Yao, Y. (2019). Prediction model for the water jet falling point in fire extinguishing based on a GA-BP neural network. PLoS One 14 (9), e0221729. doi:10.1371/journal.pone.0221729
Keywords: structure retention relationships, hydroxamic acids, HPLC, molecular docking, PCA, GA-BP, double cross-validation
Citation: Nie Y, Li J, Yang X, Hou X and Fang H (2022) Development of QSRR model for hydroxamic acids using PCA-GA-BP algorithm incorporated with molecular interaction-based features. Front. Chem. 10:1056701. doi: 10.3389/fchem.2022.1056701
Received: 30 September 2022; Accepted: 09 November 2022;
Published: 22 November 2022.
Edited by:
Kshatresh Dutta Dubey, Shiv Nadar University, IndiaReviewed by:
Marcus Scotti, Federal University of Paraíba, BrazilMaryam Salahinejad, Nuclear Science and Technology Research Institute (NSTRI), Iran
Copyright © 2022 Nie, Li, Yang, Hou and Fang. This is an open-access article distributed under the terms of the Creative Commons Attribution License (CC BY). The use, distribution or reproduction in other forums is permitted, provided the original author(s) and the copyright owner(s) are credited and that the original publication in this journal is cited, in accordance with accepted academic practice. No use, distribution or reproduction is permitted which does not comply with these terms.
*Correspondence: Xinying Yang, eGlueWluZ3lhbmdAc2R1LmVkdS5jbg==; Xuben Hou, aHhiQHNkdS5lZHUuY24=; Hao Fang, aGFvZmFuZ2NuQHNkdS5lZHUuY24=
 Yiming Nie
 Jia Li2
 Xuben Hou
 Hao Fang