 Fangyuan Ma
 Jingde Wang
 Wei Sun
- 1College of Chemical Engineering, Beijing University of Chemical Technology, Beijing, China
- 2Center of Process Monitoring and Data Analysis, Wuxi Research Institute of Applied Technologies, Tsinghua University, Beijing, China
The cracking furnace is the key equipment of the ethylene unit. Coking in furnace tubes results from the generation of coke during cracking, which will compromise the heat transfer efficiency and lead to shape change of tubes. In order to keep the cracking furnace operating economically and safely, the engineers need to decoke according to the surface temperature of the furnace tube. However, the surface temperature of the furnace tube is difficult to obtain in practice. Due to redundant instrumentation and the high level of process control in cracking furnaces, a large number of operation data have been collected, which makes it possible to predict the surface temperature of furnace tubes based on autocorrelation and cross correlation within and among variables. Traditional prediction methods rely on labeled data samples for training, ignoring the process information contained in a vast amount of unlabeled data. In this work, a data-driven semi-supervised soft-sensor method is proposed. Considering the nonlinear and dynamic relationship among variables, long short-term memory network (LSTM) autoencoder (AE), a deep neural network suitable for the feature extraction of long-term nonlinear series, is used for pre-training to extract process data features from unlabeled and labeled data. Then, principal component analysis (PCA) and mutual information (MI) are applied to remove feature correlation and select features related to target variables, respectively. Finally, the selected data features are utilized to establish a soft-sensor model based on artificial neural network (ANN). Data from an industrial cracking furnace of an ethylene unit is considered to validate the performance of the proposed method. The results show that the prediction error of furnace tube surface temperature is about 1% and successfully aid engineers in determining the optimal time for decoking.
1 Introduction
In the olefin industry, the cracking furnace is the most important piece of equipment (Zhao et al., 2011). Keeping it under a normal operating condition is critical to ensure the production of olefin. Coking in the furnace tube is a factor affecting the operation of the cracking furnace. In the cracking process, coke is generated and deposited on the inner surface of the furnace tube, which will compromise the heat transfer efficiency and lead to the shape change of tubes. Decoking is required to keep the cracking furnace operating economically and safely. In industrial production, the surface temperature of the furnace tube is an important indicator to reflect the degree of coking. In most facilities, tube surface temperature is manually measured by operators, usually every 6 or 8 days, which makes it hard for the operators to know the information in time.
Data-driven soft-sensor methods make it possible to obtain hard-to-measure variables in real time, such as the surface temperature of furnace tubes, and component concentration in streams. By extracting the relationship between online available measure variables and hard-to-measure variables, a regression model is established to realize online estimation of the latter (Souza et al., 2016; Curreri et al., 2021). Tian et al. (2017) proposed a soft-sensor method based on partial least squares (PLS) and applied it to predict the surface temperature of the furnace tube in real time. In addition, traditional soft-sensor methods, such as principal component regression (PCR), support vector regression (SVR), and vector autoregression (VAR), can also be utilized to forecast the surface temperature (Kaneko and Funatsu, 2011; Ge, 2014; Cheng and Liu, 2015). However, these soft-sensor methods require labeled data samples for training. It means that only online available measure process data matching the surface temperature measured values of furnace tube are utilized to establish a regression model. As mentioned earlier, in industrial processes, the surface temperature data are usually collected manually with limited numbers. If only limited labeled data is applied to construct a model, it may lead to poor soft-sensing performance (Shao et al., 2019). Meanwhile, rich latent information is contained in a large number of unlabeled samples, which is ignored by traditional soft-sensor methods. In this case, semi-supervised learning methods are proposed to solve the problem.
The main idea of semi-supervised learning methods is to construct a data model using both labeled and unlabeled data, with a focus on data feature extraction (Ge, 2021). Since most industrial processes are nonlinear, data features are difficult to accurately extract by traditional linear soft-sensor methods such as PCR and PLS (Shao et al., 2019). Artificial neural network (ANN) is a common method to deal with process non-linearity, which is widely applied in many fields such as speech recognition and image processing (LeCun et al., 2015; Schmidhuber, 2015). In recent years, ANN, such as long short-term memory (LSTM), convolutional neural network (CNN), and stacked autoencoder (SAE), has also been applied to establish soft-sensor models in industrial processes (Wang and Yan, 2018; Zhang et al., 2019; Yuan et al., 2020). Among them, SAE is a more suitable semi-supervised learning method due to its unsupervised layer-wise pre-training mechanism. Wang and Liu proposed a soft-sensor method based on SAE and applied it to predict the rotor deformation of air preheaters (Wang and Liu, 2018). The features of the input data are extracted using a SAE, and then a support vector regression (SVR) is applied to predict the target values. As only unlabeled data is used for pre-training, the data features extracted by SAE may be independent of the target variables, which may affect the performance of the soft sensor. In order to solve the problem, Yan et al., (2020) proposed to use mutual information analysis to evaluate the correlation between codes obtained from encoders and target variables to remove insignificant codes (Yan et al., 2020). On this basis, Lima and de Araujo (2021) proposed an MI-based weighted representative SAE. MI is utilized to assign varied weights to the codes obtained by pre-training, emphasizing codes associated with the target variable. However, there is a high degree of correlation between codes extracted by SAE. Useful information may still exist in some codes that have been removed. Furthermore, industrial processes are commonly dynamic, which is ignored by the aforementioned methods.
LSTM AE is a neural network developed based on LSTM, which can be used to extract process dynamic features. It is proposed by Srivastava et al. (2015) and applied to learn representations of video sequences. Recently, LSTM AE has also been utilized to extract temporal features of time series data in industrial processes. Mallak and Fathi (2021) proposed a process monitoring algorithm based on LSTM AE to realize fault detection and diagnosis for hydraulic machinery (Mallak and Fathi, 2021). However, with typical autoencoders, the data features extracted by LSTM AE could be highly correlated. Prediction performance may be affected by directly using these features to build a soft-sensor model. There is no report available to discuss this issue in literature yet. Principal component analysis (PCA) is a common method for dimensionality reduction, which can remove the correlation between variables through orthogonalization. If data obtained from LSTM AE are orthogonalized by PCA, better extraction of process dynamic features could be achieved.
In this work, a semi-supervised soft-sensor method based on LSTM AE and PCA (LAPSS) is proposed for feature extraction and applied to predictive maintenance of the industrial cracking furnace. In order to take full advantage of process information contained in a large number of unlabeled data, an unsupervised learning method, LSTM AE, is first used for pre-training to extract dynamic features of process from both labeled and unlabeled data. Then, PCA is applied to remove the correlation between codes obtained by LSTM AE. Based on MI values of the target variable and codes, codes are selected, which are strongly correlated with the target variable. Finally, these codes are utilized to establish a regression model, an ANN in this work. Data from an industrial cracking furnace is employed to test the performance of the proposed method.
The remainder of this article is organized as follows. In Section 2, methods utilized in the proposed method are briefly introduced. Section 3 introduces the proposed framework in detail. In Section 4, data from an industrial cracker are investigated to validate the proposed method. The main contributions of this work are summarized at the end.
2 Preliminary
In this section, LSTM, LSTM autoencoder, MI, PCA, and SVR are briefly introduced.
2.1 Long Short-Term Memory
Long short-term (LSTM) neural network is a deep learning method commonly used to describe the temporal dynamic behaviors of time sequential data (Yuan et al., 2019a). In recent years, it has been widely employed to extract dynamic features of industrial processes. Figure 1 shows the structure of the LSTM (Yuan et al., 2019b). It contains three gate controllers, which are input gate
where c represents the cell state,
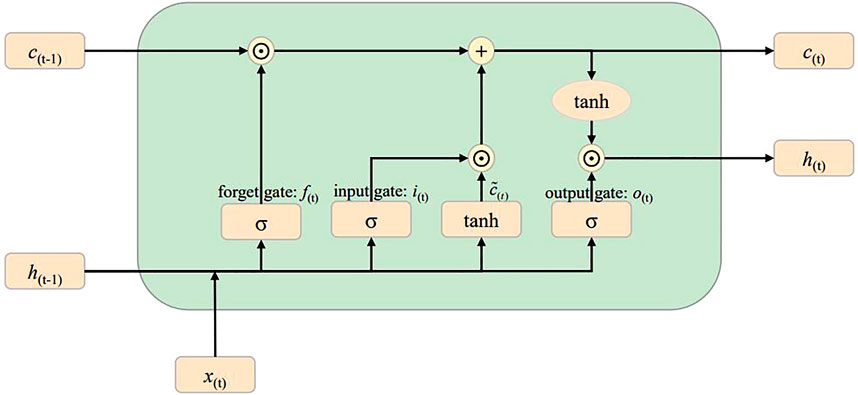
FIGURE 1. Structure of the LSTM.
2.2 LSTM Autoencoder
Traditional artificial neural network, such as CNN and LSTM, is a supervised learning method, which requires a large number of labeled data samples for training. However, it is very difficult to obtain a large number of labeled data samples in an industrial process. In order to solve the problem, an unsupervised neural network autoencoder (AE) is applied to industrial processes. As an unsupervised neural network, AE aims to learn representative data features by minimizing the reconstruction error of original input data. Generally, it consists of an input layer, an encoder neural network, a latent space, a decoder neural network, and an output layer (Nguyen et al., 2021). Among them, the encoder neural network is applied to compress input data into the latent space to generate codes. Then, by using the decoder neural network, the original input data is reconstructed from codes obtained previously. The backpropagation algorithm is usually employed for AE training. Commonly, mean square error (MSE) is used as a loss function to evaluate reconstruction error.
where x is the original input data,
2.3 Principal Component Analysis
Principal component analysis (PCA) is a typical dimensionality reduction method, which can be applied to decorrelate variables in a new orthogonal space. Let
By eigenvalue decomposing the covariance matrix C, the following equation can be obtained (Wold et al., 1987):
where P is an orthogonal matrix consisting of eigenvectors,
2.4 Correlation Measurement by Mutual Information
In order to obtain the optimal soft-sensor model, it is very important to select modeling variables related to the target variable. In information theory, mutual information (MI) is a measure of the interdependence between two random variables. It is defined as follows (Kraskov et al., 2004):
where x and y are two random variables,
Then, Eq. 11 can be transformed as follows (Kraskov et al., 2004):
where
Measurements collected from industrial processes have different degrees of correlation with hard-to-measure ones. A similar situation can also be found between codes and hard-to-measure variables. It can be believed that better prediction in soft sensoring can be obtained from more relevant variables or codes. Based on this consideration, MI is adopted to screen original variables and codes obtained from LSTM encoders.
According to the work of Wang and Yan (2018), 1,000 random vectors are generated by a uniform distribution in the range of [0, 1], which can be considered totally independent with the target variable. The dimension of each vector corresponds to the number of training data samples. Then, MI between each of the random vectors and the target variable is calculated. Among them, the 50th largest MI value is selected as the MI threshold. Thus, for certain original variables or codes, the variables or code has a certain causal relationship with the target variable at a 95% confidence level if its MI with the target variable is greater than the threshold obtained earlier.
3 Framework for the LAPSS
Traditional supervised soft-sensor methods require labeled data for training, which makes process information contained in a large number of unlabeled samples to be ignored. AE is an unsupervised method, which is commonly employed by semi-supervised learning methods to extract data features from unlabeled data in the pre-training stage. However, industrial processes are frequently dynamic. Typical AE is not suitable for the feature extraction of long-term nonlinear series. In addition, codes obtained by AE are non-orthogonal, which is not conducive to selecting the codes related to the target variable, in order to establish the optimal soft-sensor model.
To solve the aforementioned problems, a semi-supervised soft-sensor model based on LSTM and PCA (LAPSS) is proposed. The framework for LAPSS is illustrated in Figure 2. Its procedures include the offline modelling phase and the online prediction phase.
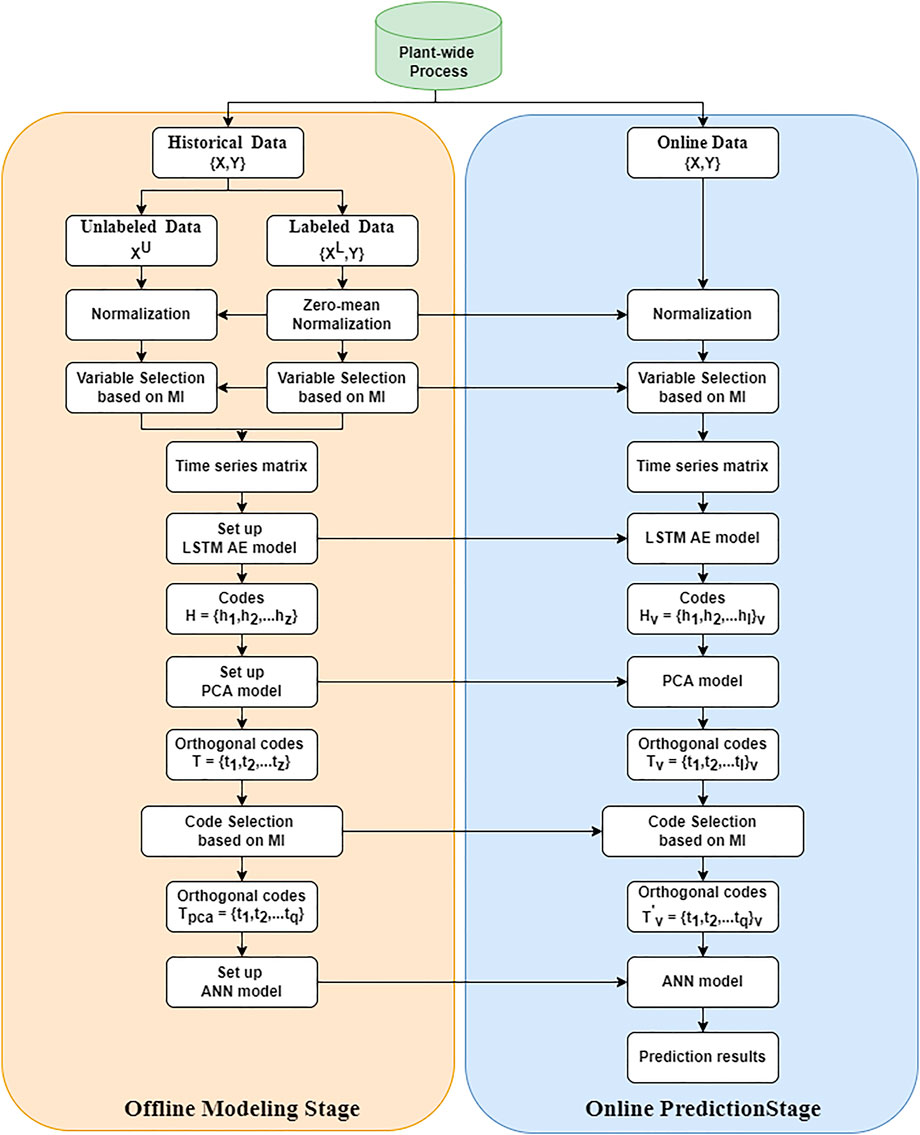
FIGURE 2. Framework for the LAPSS.
Offline modeling stage:
Step 1: historical data are collected to establish a soft-sensor model, including labeled data
Step 2: to ensure the performance of the soft-sensor model, the correlation measurement by MI is applied to choose the soft-sensor modeling variables. A window width l is applied to pre-process the data into a time series matrix. The LSTM AE model is constructed using both labeled and unlabeled data. The codes
Step 3: in order to remove the correlation between the codes, a PCA model is established. Then the codes
Step 4: to obtain a soft-sensor model, labeled data feature samples
Online prediction stage:
Step 1: online data are collected and normalized with the average and standard deviation of the labeled data
Step 2: as in the offline modeling stage, online data are pre-processed into a time series matrix. Codes
Step 3: codes
Step 4: codes in orthogonal space correlated with the target variables are input to the ANN model, and the output value is then inversely normalized to obtain the predicted value.
4 Case Study
In order to validate the performance of the proposed method, data from an industrial cracking furnace is investigated. The cracking furnace is mainly divided into two sections: convection and radiation. The main function of the convection section is material preheating and heat recovery. In the radiation section, the preheated hydrocarbon and steam are mixed for a cracking reaction at about 800°C to produce olefins, alkanes, and coke. The heat required for the cracking reaction is obtained from the external surface of the radiant furnace tubes by convective heat transfer. Coke as a by-product of the reaction deposits over the inner surface of the tubes, which will affect the heat transfer efficiency of the furnace tube. To maintain reaction temperature and conversion, it is necessary to increase fuel flow or reduce feed flow.
Based on the process characteristics of the cracking furnace, the process variables shown in Table 1 are selected to build a soft sensor for the surface temperature of the furnace tube. In the case study, data for five complete production cycles are collected, covering 8,700 samples with 1-h interval. During the period, only 67 sets of surface temperature data of furnace tubes are collected. Each set of data contains 12 temperature measurements located in the south and north sections with six groups of tubes in each section. In order to accurately predict the surface temperature of furnace tubes, temperature soft-sensor models are established for each group of furnace tubes separately. Data for four complete production cycle are applied to build the soft-sensor models, which included 5,000 samples of process variables and 55 sets of surface temperature measurements for furnace tubes.
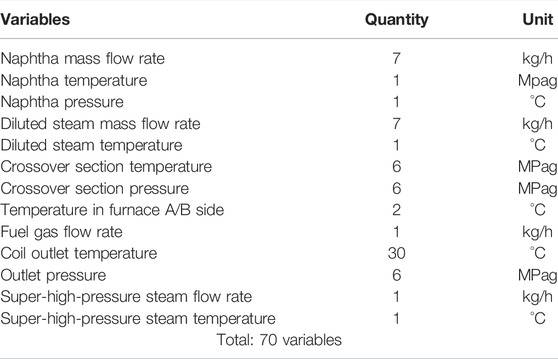
TABLE 1. Process variable information of the cracking furnace.
Data from one group of furnace tubes on the south side is taken to illustrate the modeling process. Online collected data are used as easy-to-measure variables to predict the surface temperature of furnace tubes. After the normalization, MI of each easy-to-measure variable with respect to the target variable is calculated to evaluate their correlation. As can be seen from Figure 3, the MI of 14 easy-to-measure variables with respect to the target variable fell below the MI threshold. It means that these variables are independent of the target variable in terms of mutual information point of view and will be removed from subsequent calculations. The remaining variables are pre-processed into a time series matrix. The width of the moving window is determined by considering the autocorrelation coefficient of each variable. Then, an LSTM AE model is established by using both labeled and unlabeled data. Among them, 3,500 samples are used as training data and 1,500 samples are used as validation data.
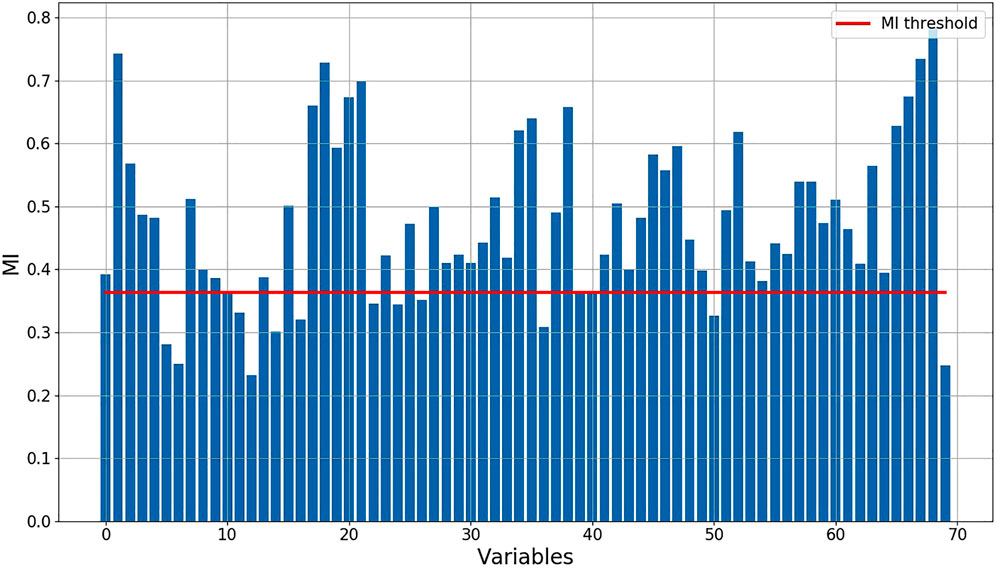
FIGURE 3. MI of each independent variable with the dependent variable and the value of the threshold.
After several trials, the number of codes for the LSTM AE is determined to be 35, under which the reconstruction error of the validation data reaches its minimum. A PCA model is established to remove correlation between data features obtained by the LSTM AE model, by which 35 unrelated orthogonal codes are obtained. The feature selection method based on MI is used to select orthogonal codes related to the dependent variable. As shown in Figure 4, the MI of seven data features and dependent variable are less than the MI threshold. Then, the remaining orthogonal codes whose MI with dependent variable exceeded the threshold are reserved to build an ANN-based regression model. The key parameters of the ANN-based regression model are obtained based on validation data, like the number of hidden layer neurons, activation functions, and the number of iterations.
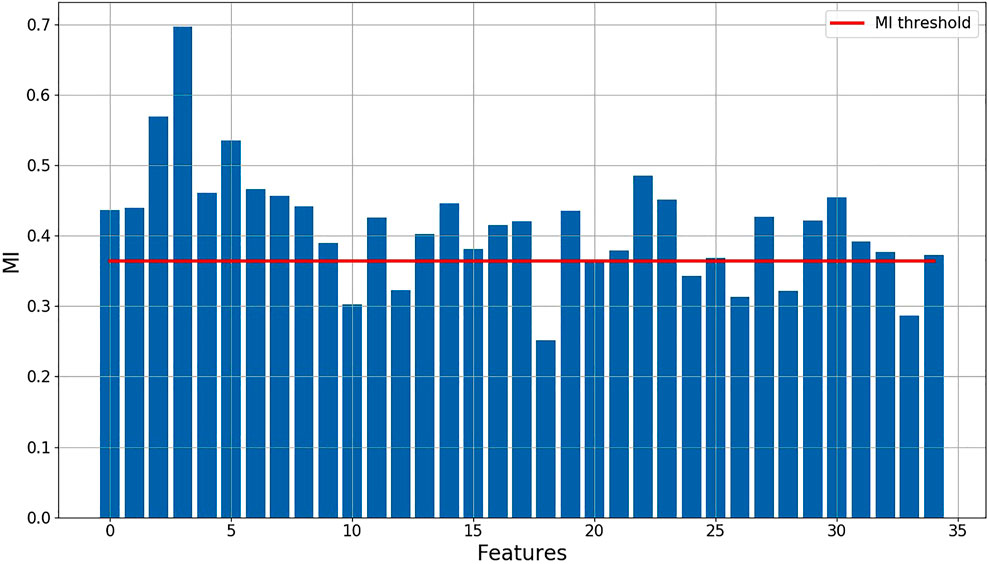
FIGURE 4. MI of each data feature with the dependent variable and the value of the threshold.
Apart from the proposed method, PLS, SVR, ANN, and SAE are established for comparison. The parameters set for PLS, SVR, ANN, SAE and proposed method can be found from Supplementary Material. Data from one production cycle are used to evaluate the predictive effectiveness of the soft-sensor model. To evaluate the prediction performance of different soft-sensor methods quantitatively, the mean relative error (MRE) and root mean square error (RMSE) of each model are calculated. Their mathematical definitions are given as follows:
where
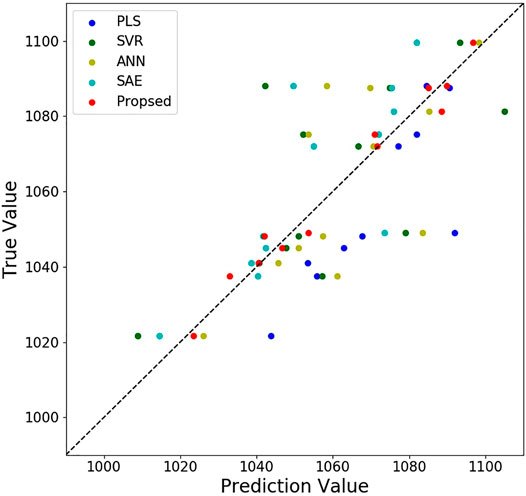
FIGURE 5. Prediction and true values of different soft-sensor methods on the test set.
Comparison for prediction performance of different soft-sensor methods is shown in Table 2. Obviously, the best prediction results for 12 groups of furnace tube surface temperature are obtained by the proposed method. As unlabeled data are employed for semi-supervised soft-sensor modeling in pre-training phase better prediction performance is achieved than that by PLS, SVR, and ANN. Compared with SAE, the LSTM AE and the PCA are used by the proposed method to extract process dynamic features and remove the correlation between codes from LSTM AE. The surface temperature prediction results for the first group of furnace tubes are shown in Figure 6. With the operation of the cracking furnace, the surface temperature of the furnace tube is constantly increasing. At the 748th sample and the 1065th sample, drops can be observed in the surface temperature prediction values of furnace tubes. By checking the history record of the cracking furnace operation, it can be found that the production load of the cracking furnace has been decreased at the 748th sample and the 1065th sample. The results show that the prediction values of the proposed method are consistent with the actual operating conditions. When the temperature approaches 1,100°C, it indicates decoking operation should start. Engineers can schedule decoking time based on the results of the soft-sensor model.
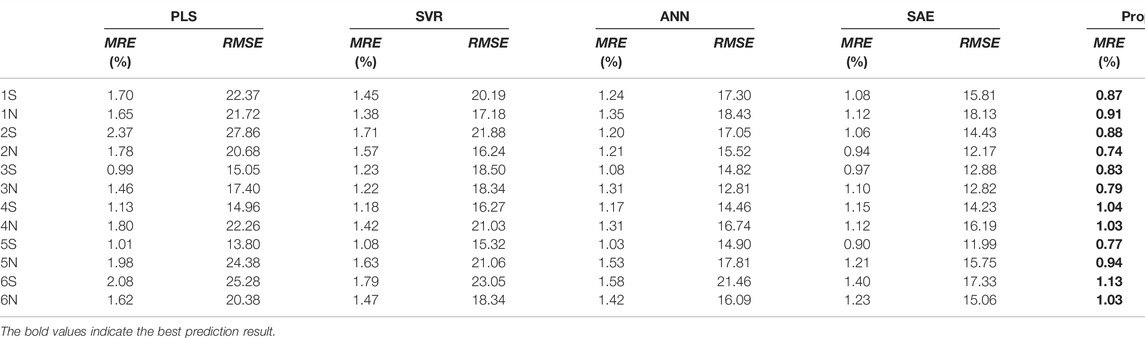
TABLE 2. Comparison of the prediction performance of different methods.
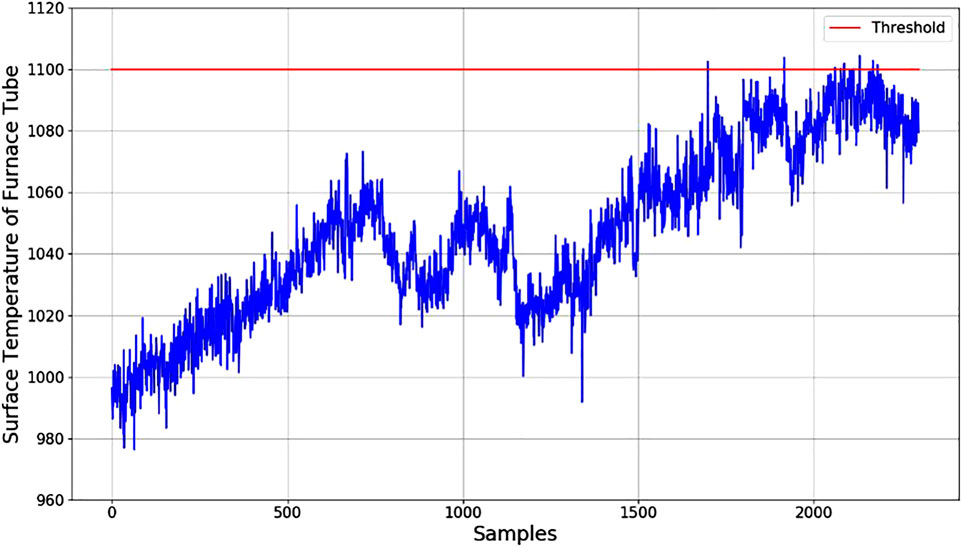
FIGURE 6. The surface temperature prediction results for the first group of furnace tubes.
5 Conclusion
In this work, a novel semi-supervised soft-sensor method is proposed and applied to predict the surface temperature of furnace tubes. Different from traditional supervised methods, which require labeled data samples for training, both labeled and unlabeled data samples are applied to extract process features by the proposed method, which makes the feature extraction not only based on less number of labeled data but also a huge number of unlabeled data. Considering the dynamic and nonlinear characteristics of industrial processes, the LSTM AE is used to extract process features for pre-training first. In order to eliminate the adverse influence of high correlation between codes for code selection, PCA is applied to obtain orthogonal codes. Then, the orthogonal codes relevant to the target variable are selected to establish an ANN-based prediction model based on the degree of correlation. To test the performance of the proposed method, an industrial cracking furnace is investigated. The results show that the surface temperature of furnace tubes can be well predicted, which can help engineers plan decoking time more effectively.
Data Availability Statement
The original contributions presented in the study are included in the article/Supplementary Material; further inquiries can be directed to the corresponding authors.
Author Contributions
Conceptualization, WS and JW; methodology, FM; software, FM; validation, FM and JW; formal analysis, FM; investigation, WS and JW; resources, WS and JW; data curation, WS and FM; writing—original draft preparation, FM; writing—review and editing, WS, JW, and FM; supervision, WS and JW; and project administration, WS and JW. All authors have read and agreed to the published version of the manuscript.
Conflict of Interest
The authors declare that the research was conducted in the absence of any commercial or financial relationships that could be construed as a potential conflict of interest.
Publisher’s Note
All claims expressed in this article are solely those of the authors and do not necessarily represent those of their affiliated organizations, or those of the publisher, the editors, and the reviewers. Any product that may be evaluated in this article, or claim that may be made by its manufacturer, is not guaranteed or endorsed by the publisher.
Supplementary Material
The Supplementary Material for this article can be found online at: https://www.frontiersin.org/articles/10.3389/fceng.2022.899941/full#supplementary-material
References
Cheng, Z., and Liu, X. (2015). Optimal Online Soft Sensor for Product Quality Monitoring in Propylene Polymerization Process. Neurocomputing 149, 1216–1224. doi:10.1016/j.neucom.2014.09.006
Curreri, F., Patanè, L., and Xibilia, M. G. (2021). Soft Sensor Transferability: A Survey. Appl. Sci. 11 (16), 7710. doi:10.3390/app11167710
Ge, Z. (2014). Active Learning Strategy for Smart Soft Sensor Development under a Small Number of Labeled Data Samples. J. Process Control 24 (9), 1454–1461. doi:10.1016/j.jprocont.2014.06.015
Ge, Z. (2021). Semi-Supervised Data Modeling and Analytics in the Process Industry: Current Research Status and Challenges. IFAC J. Syst. Control 16, 100150. doi:10.1016/j.ifacsc.2021.100150
Greff, K., Srivastava, R. K., Koutnik, J., Steunebrink, B. R., and Schmidhuber, J. (2016). LSTM: A Search Space Odyssey. IEEE Trans. Neural Netw. Learn Syst. 28 (10), 2222–2232. doi:10.1109/TNNLS.2016.2582924
Kaneko, H., and Funatsu, K. (2011). Maintenance-Free Soft Sensor Models with Time Difference of Process Variables. Chemom. Intell. Lab. Syst. 107 (2), 312–317. doi:10.1016/j.chemolab.2011.04.016
Kraskov, A., Stögbauer, H., and Grassberger, P. (2004). Estimating Mutual Information. Phys. Rev. E Stat. Nonlin Soft Matter Phys. 69, 066138. doi:10.1103/PhysRevE.69.066138
LeCun, Y., Bengio, Y., and Hinton, G. (2015). Deep Learning. Nature 521 (7553), 436–444. doi:10.1038/nature14539
Lima, J. M. M., and de Araujo, F. M. U. (2021). Ensemble Deep Relevant Learning Framework for Semi-Supervised Soft Sensor Modeling of Industrial Processes. Neurocomputing 462, 154–168. doi:10.1016/j.neucom.2021.07.086
Mallak, A., and Fathi, M. (2021). Sensor and Component Fault Detection and Diagnosis for Hydraulic Machinery Integrating LSTM Autoencoder Detector and Diagnostic Classifiers. Sensors 21 (2), 433. doi:10.3390/s21020433
Nguyen, H. D., Tran, K. P., Thomassey, S., and Hamad, M. (2021). Forecasting and Anomaly Detection Approaches Using LSTM and LSTM Autoencoder Techniques with the Applications in Supply Chain Management. Int. J. Inf. Manag. 57, 102282. doi:10.1016/j.ijinfomgt.2020.102282
Schmidhuber, J. (2015). Deep Learning in Neural Networks: An Overview. Neural Netw. 61, 85–117. doi:10.1016/j.neunet.2014.09.003
Shao, W., Ge, Z., Song, Z., and Wang, K. (2019). Nonlinear Industrial Soft Sensor Development Based on Semi-supervised Probabilistic Mixture of Extreme Learning Machines. Control Eng. Pract. 91, 104098. doi:10.1016/j.conengprac.2019.07.016
Souza, F. A. A., Araújo, R., and Mendes, J. (2016). Review of Soft Sensor Methods for Regression Applications. Chemom. Intell. Lab. Syst. 152, 69–79. doi:10.1016/j.chemolab.2015.12.011
Srivastava, N., Mansimov, E., and Salakhudinov, R. (2015). “Unsupervised Learning of Video Representations Using Lstms,” in International Conference on Machine Learning (ICML), Lille, France, July 6–11, 2015 (PMLR), 843–852.
Tian, S., Han, X., Romagnoli, J. A., Ma, L., and Sun, W. (2017). Coking Analysis Based on the Prediction of Coil Surface Temperature in Radiation Section of Ethylene Cracking Furnace. Chem. Eng. Trans. 61, 505–510. doi:10.3303/CET1761082
Wang, J., and Yan, X. (2018). Mutual Information-Weighted Principle Components Identified from the Depth Features of Stacked Autoencoders and Original Variables for Oil Dry Point Soft Sensor. IEEE Access 7, 1981–1990. doi:10.1109/ACCESS.2018.2886820
Wang, X., and Liu, H. (2018). Soft Sensor Based on Stacked Auto-Encoder Deep Neural Network for Air Preheater Rotor Deformation Prediction. Adv. Eng. Inf. 36, 112–119. doi:10.1016/j.aei.2018.03.003
Wold, S., Esbensen, K., and Geladi, P. (1987). Principal Component Analysis. Chemom. Intell. Lab. Syst. 2 (1-3), 37–52. doi:10.1016/0169-7439(87)80084-9
Yan, X., Wang, J., and Jiang, Q. (2020). Deep Relevant Representation Learning for Soft Sensing. Inf. Sci. 514, 263–274. doi:10.1016/j.ins.2019.11.039
Yuan, X., Ou, C., Wang, Y., Yang, C., and Gui, W. (2019b). A Layer-Wise Data Augmentation Strategy for Deep Learning Networks and its Soft Sensor Application in an Industrial Hydrocracking Process. IEEE Trans. Neural Netw. Learn Syst. 32 (8), 3296–3305. doi:10.1109/TNNLS.2019.2951708
Yuan, X., Li, L., and Wang, Y. (2019a). Nonlinear Dynamic Soft Sensor Modeling with Supervised Long Short-Term Memory Network. IEEE Trans. Industr. Inf. 16 (5), 3168–3176. doi:10.1109/TII.2019.2902129
Yuan, X., Ou, C., Wang, Y., Yang, C., and Gui, W. (2020). A Novel Semi-Supervised Pre-Training Strategy For Deep Networks and its Application for Quality Variable Prediction in Industrial Processes. Chem. Eng. Sci. 217 (35), 115509. doi:10.1016/j.ces.2020.115509
Zhang, X., Zou, Y., Li, S., and Xu, S. (2019). A Weighted Auto Regressive LSTM Based Approach for Chemical Processes Modeling. Neurocomputing 367, 64–74. doi:10.1016/j.neucom.2019.08.006
Keywords: decoking, ethylene unit, furnace tube, long short-term memory network, autoencoder
Citation: Ma F, Wang J and Sun W (2022) A Data-Driven Semi-Supervised Soft-Sensor Method: Application on an Industrial Cracking Furnace. Front. Chem. Eng. 4:899941. doi: 10.3389/fceng.2022.899941
Received: 19 March 2022; Accepted: 27 April 2022;
Published: 13 June 2022.
Edited by:
Leo Chiang, Dow Chemical Company, United StatesReviewed by:
Shachit Shankaran Iyer, The Dow Chemical Company, United StatesZhengbing Yan, Wenzhou University, China
Copyright © 2022 Ma, Wang and Sun. This is an open-access article distributed under the terms of the Creative Commons Attribution License (CC BY). The use, distribution or reproduction in other forums is permitted, provided the original author(s) and the copyright owner(s) are credited and that the original publication in this journal is cited, in accordance with accepted academic practice. No use, distribution or reproduction is permitted which does not comply with these terms.
*Correspondence: Jingde Wang, amluZ2Rld2FuZ0BtYWlsLmJ1Y3QuZWR1LmNu; Wei Sun, c3Vud2VpQG1haWwuYnVjdC5lZHUuY24=