 Ling Aye1†Xiaole Song1†Jingyi Yang1†Li Hu1Xicai Sun1Jiaying Zhou1Quan Liu1*Hongmeng Yu1,2*Dehui Wang1*
- 1Department of Otolaryngology, Eye & ENT Hospital, Fudan University, Shanghai, China
- 2Research Units of New Technologies of Endoscopic Surgery in Skull Base Tumor, Chinese Academy of Medical Sciences, Shanghai, China
Background: Head and neck squamous cell carcinoma (HNSCC) is one of the most common malignancies worldwide. Checkpoint blockade immunotherapy has made tremendous progress in the treatment of a variety of cancers in recent years. Costimulatory molecules constitute the foundation of cancer immunotherapies and are deemed to be promising targets for cancer treatment. This study attempted to evaluate the potential value of costimulatory molecule genes (CMGs) in HNSCC.
Materials and Methods: Based on The Cancer Genome Atlas (TCGA) and Gene Expression Omnibus (GEO) dataset, we identified the prognostic value of CMGs in HNSCC. Subsequently, CMGs-based signature (CMS) to predict overall survival of HNSCC patients was established and validated. The differences of downstream pathways, clinical outcomes, immune cell infiltration, and predictive immunotherapy responses between different CMS subgroups were investigated via bioinformatic algorithms. We also explored the biological functions of TNFRSF12A, one risk factor of CMS, by in vitro experiments.
Results: Among CMGs, 22 genes were related to prognosis based on clinical survival time in HNSCC. Nine prognosis-related CMGs were selected to establish CMS. CMS was an independent risk factor and could indicate the survival of HNSCC patients, the component of tumor-infiltrating lymphocytes, and the immunotherapy response rate. Functional enrichment analysis confirmed that CMS might involve immune-relevant processes. Additionally, TNFRSF12A was related to poor prognosis and enhanced malignant phenotype of HNSCC.
Conclusion: Collectively, CMS could accurately indicate prognosis, evaluate the tumor immune microenvironment, and predict possible immunotherapy outcomes for HNSCC patients.
Introduction
Head and neck cancer ranked as the seventh most common cancer overall (Bray et al., 2018), with an estimated 888,000 new cases globally in 2018. Head and neck squamous cell carcinoma (HNSCC) accounts for more than 90% of all head and neck tumors (Gupta et al., 2016). HNSCC is a disease with biological diversity and genomic heterogeneity, which originates from the squamous mucosa lining of the upper respiratory tract, including lip and mouth, nasal cavity, paranasal sinus, nasopharynx, oropharynx, larynx, and hypopharynx (Marur and Forastiere, 2016; Siegel et al., 2017).
More than 60% of HNSCC patients were diagnosed with cancerous lesions that were locally advanced or metastatic at the first visit. For patients suffering from locally advanced or metastatic disease, the 5-year overall survival (OS) rate is less than 50% (Lefebvre, 2005), with a local recurrence rate of 15–40% and a high risk of developing distant metastasis (Chow, 2020). Surgery remains the major treatment of choice for resectable HNSCC. For cases with unresectable tumors or in which surgery may lead to severe organ dysfunction, concurrent chemoradiotherapy is recommended as the standard treatment (Colevas et al., 2018). However, concurrent chemoradiotherapy may lead to serious long-term adverse events, including pharyngeal dysfunction, ototoxicity, neurotoxicity, and nephrotoxicity (Sklan and Collingridge, 2017).
As a new therapeutic pillar in various cancers, the PD-1 monoclonal antibody was approved by the FDA for the first-line treatment of unresectable recurrent or metastatic HNSCC in 2019 (Cohen et al., 2019). Since then, a new era of immunotherapy has begun. However, despite the advancements in cancer immunotherapies to date, there are still some unmet needs: the overall response rate was still suboptimal, and immunotherapeutic resistance also resulted in substantial barriers (Luke et al., 2017). In view of the status quo that current immunotherapy is largely based on affecting T cell function via costimulatory molecules (Waldman et al., 2020), a better understanding of the mechanisms and the roles of costimulatory molecules in these biological processes is needed to realize the full potential of this treatment approach.
Costimulatory molecules, which are composed of the B7-CD28 family (Zhang et al., 2018) and tumor necrosis factor (TNF) families (Ward-Kavanagh et al., 2016), constitute potential molecular targets for immunotherapeutic strategies (Shekarian et al., 2017). At present, 13 molecules are classified as B7-CD28 family members (Janakiram et al., 2015). The TNF family is comprised of the TNF ligand superfamily (TNFSF) and the TNF receptor superfamily (TNFRSF) with 48 molecules (Croft and Siegel, 2017). Nevertheless, the clinical significance and genome features of costimulatory molecule genes (CMGs) in HNSCC carcinogenesis were obscure yet.
In the current research, we systematically explored the expression pattern and prognostic significances of CMGs by bioinformatics analysis. The biological functions of TNFRSF12A were also investigated by in vitro experiments. Then the CMGs-based signature (CMS) was developed to predict prognosis, immunotherapy response, and immune cell infiltration for HNSCC patients.
Materials and Methods
Cell Culture and Transfection
The HNSCC cell line 6-10B and Tu 686 were purchased from the Cell Bank of the Chinese Academy of Sciences (Shanghai, China) and were grown under the recommended conditions. The vectors of plko-Puromycin-EGFP-shRNA-TNFRSF12A and plko-Puromycin-EGFP-NC were purchased from Ruoji Technology (Shanghai, China) and were transfected into 6-10B and Tu 686 cells. The shRNA1 sequences are GCAGGAGAGAGAAGTTCACCA(F) & CAAA TGCTGCAGTTCCTTAGT(R), and the shRNA2 sequences are AGGAGAGAGAAGTTCACCACC(F) & GGTGGTGAACTTC TCTCTCCT(R). These two target sequences were mixed with the same proportion. Subsequently, the cells with suitable fluorescence expression were screened with puromycin at a concentration of 4 μg/ml.
Real-Time PCR
Total RNA was purified using Mini BEST Universal RNA extraction KIT (TaKaRa, Japan) and cDNA was synthesized using the Prime-Script RT Master Mix (TaKaRa, Japan) according to the manufacturer’s instructions. Real-time PCR was performed using SYBR Green Realtime PCR Master Mix (Yeasen, China). Samples from each experiment were analyzed in triplicate. The primer sequences used in this study were as follows:
GAPDH: GGACTCATGACCACAGTCCA(F) & CCAGTAG AGGCAGGGATGAT(R);
TNFRSF12A: TTTGGTCTGGAGACGATGC(F) & GGCTCT AGAATGGATGAATGAA(R);
CXCL2: CTCGCTGCGCCGGTTGCTGC(F) & GCTGCAGC GCAGCCCAGGCA(R);
CXCL11: GACGCTGTCTTTGCATAGGC(F) & GGATTTA GGCATCGTTGTCCTTT(R);
CCL19: CTGCTGGTTCTCTGGACTTCC(F) & AGGGATG GGTTTCTGGGTCA(R);
CXCL17: TGCTGCCACTAATGCTGATGT(F) & CTCAGG AACCAATCTTTGCACT(R);
CXCL3: CGCCCAAACCGAAGTCATAG(F) & GCTCCCCT TGTTCAGTATCTTTT(R).
Enzyme-Linked Immunosorbent Assay (ELISA)
To detect the secreted CXCL2, CXCL11, and CCL19 levels, cell culture supernatants were harvested after 48 h and analyzed using CXCL2, CXCL11, and CCL19 Human enzyme-linked immunosorbent assay (ELISA) Kit (Yuanmin Biotechnology, Shanghai, China) according to the manufacturer’s protocols.
Western Blot
Werstern Blot was performed according to previous research (Song et al., 2016). Specifically, the antibodies utilized in this research were listed as follows:
TNFRSF12A (1:1000, abs137500, Absin, Shanghai, China);
GAPDH (1: 1000, AF1186, Beyotime, Shanghai, China);
HRP-conjugated secondary antibodies:(1:1000, A0208, Beyotime, Shanghai, China).
Cell Proliferation Assays and Migration Assays
Cell proliferation was detected by the cell counting kit-8 (CCK-8) and clone formation assays. In brief, cells were inoculated into 96-well plates (1000 cells/well). At each time point (1st, 2nd, 3rd, 4th, and 5th day), 10 μl of CCK-8 solution (Yeason, Shanghai, China) was added to the sextuplicate wells. The plates were incubated for 1.5 h and detected.
For clone formation assays, cells were seeded in a six-well plate (1000 cells/well) with the culture medium refreshed every 3 days for 2 weeks. Following the 2 weeks, the cells were washed with PBS, fixed, stained, and counted.
For migration assays, cells were incubated using 24-well transwell plates (8-μm pore size, Corning, NY, United States). Certain cells suspended in serum-free medium were plated in the upper chambers, and 0.6 ml of RPMI-1640 medium with 10% FBS was added to the lower chamber. After incubation for a suitable amount of time, the cells were fixed, stained, and counted under a microscope.
mRNA Expression Datasets and Clinical Information
The expression profile of HNSCC and corresponding clinical information were downloaded from the Cancer Genomics Browser of University of California Santa Cruz (UCSC). This prognostic feature was further validated based on an independent data set (GSE65858) from the Gene Expression Omnibus (GEO) database (Wichmann et al., 2015). For the genes with several probes, mean expression values were recognized as the expression data. The clinical characteristics of these patients from multiple institutions are summarized in Table 1.
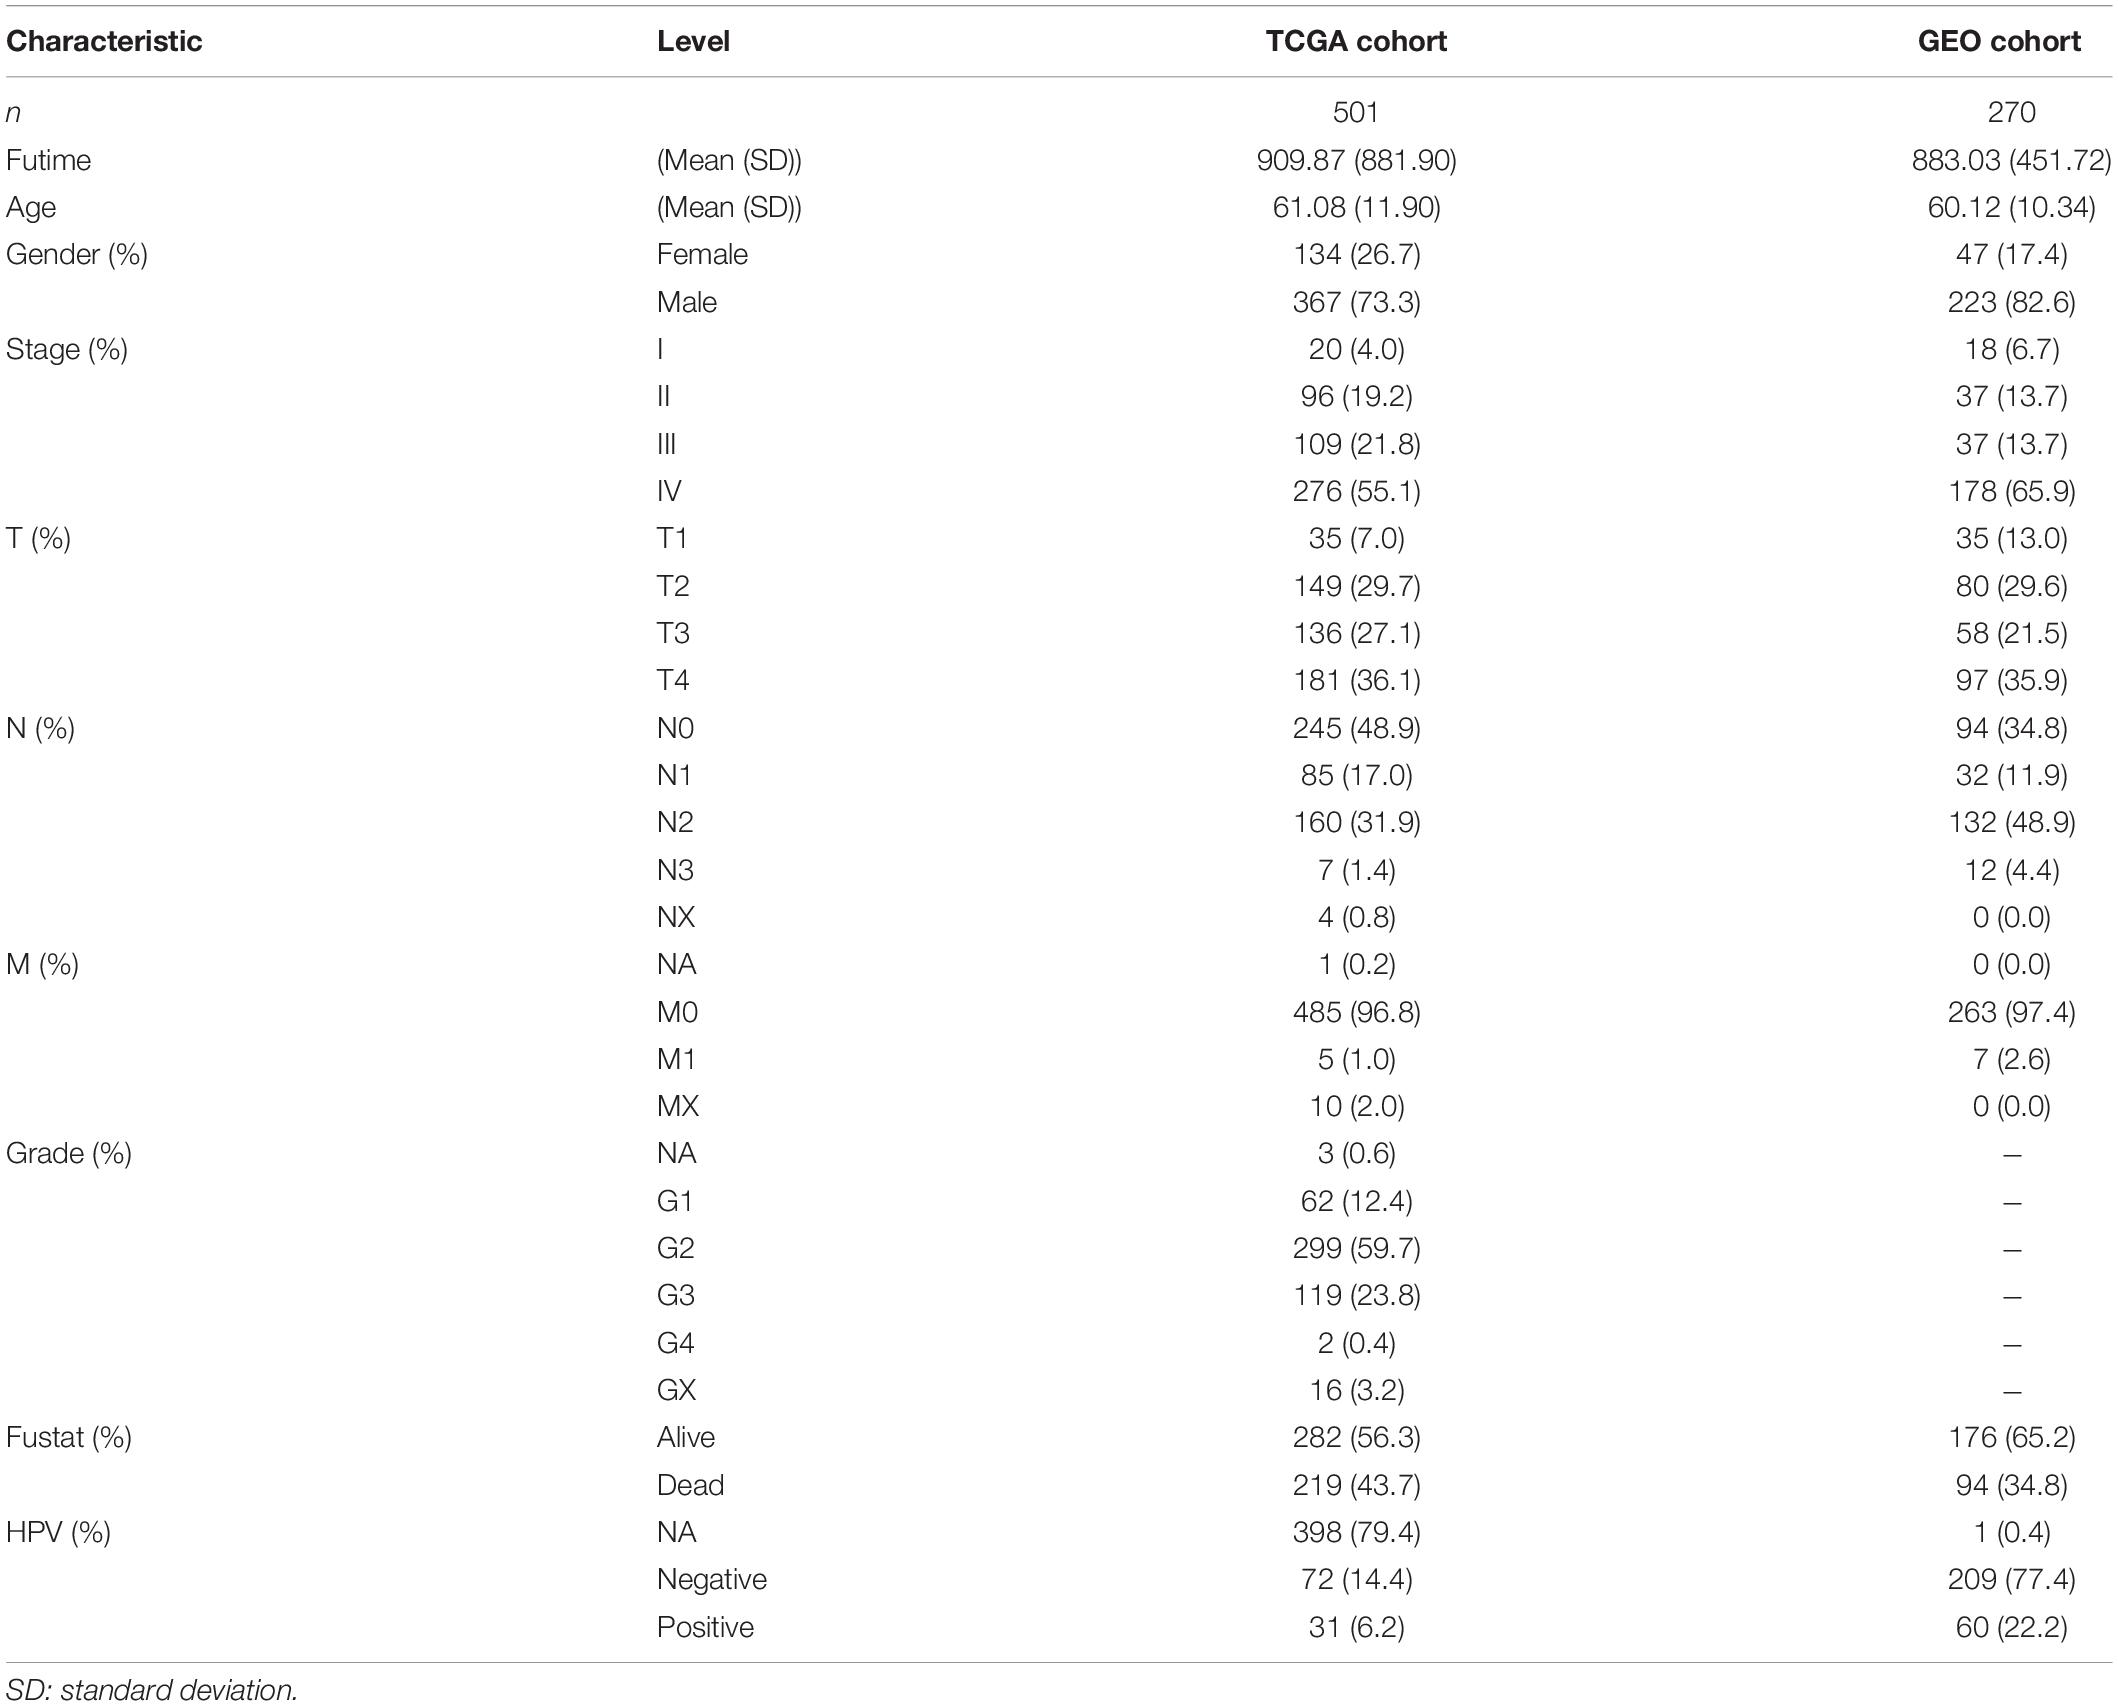
Table 1. Clinical characteristics of enrolled groups.
The cBio Cancer Genomics (Cerami et al., 2012), Gene Expression Profiling Interactive Analysis (GEPIA) (Tang et al., 2019), and Human Protein Atlas database (HPA) (Uhlén et al., 2015) were also used to validate DNA, mRNA, and protein expression level of CMGs in HNSCC.
Differentially Expressed Genes Analysis and Function Enrichment Analysis
By package limma (Ritchie et al., 2015), differentially expressed genes (DEGs) were screened out with the cutoff value p value < 0.05 and log2 (| fold change (FC)|) > 0.5. Principal component analysis (PCA) was also employed to demonstrate expression patterns of CMGs in different samples. Pathway and function enrichment analysis was performed via clusterProfiler (Yu et al., 2012). Kyoto Encyclopedia of Genes and Genomes (KEGG) (Kanehisa et al., 2017), Gene set enrichment analysis (GSEA) (Subramanian et al., 2005), and Gene Ontology (GO) enrichment analyses were employed.
Estimation of Immune Cell Infiltration and Immune Therapy Response
The tumor purity and immune infiltration level were analyzed via ESTIMATE (Yoshihara et al., 2013), leucocyte fraction (Thorsson et al., 2018), CIBERSORT (Newman et al., 2015), MCP-counter (Becht et al., 2016), EPIC (Racle et al., 2017), quanTIseq (Finotello et al., 2019), and TIMER (Li et al., 2017). Immunophenoscore (IPS) (Charoentong et al., 2017) algorithms were used to assess immunotherapy responses.
Mutation Analysis and Tumor Mutation Burden (TMB) Analysis
Somatic variants data of HNSCC samples were analyzed by maftools (Mayakonda et al., 2018). Then, the tumor mutation burden (TMB) of each patient (mutations per million bases) was calculated.
Signature Identification
CMGs-based signature was constructed using 9 CMGs with a linear combination of their expression values. These inputs were weighted with the regression coefficients from the stepwise Cox regression analyses.
Construction and Validation of a Prognostic Nomogram
Nomogram plotted by RMS package Before constructing the nomogram, 4 patients were excluded because of undefined pathological diagnosis. Then CMS and nomogram were tested by receiver operating characteristic (ROC) curves and calibration curves. And area under curve (AUC) values of ROC were also calculated.
Statistical Analysis
The results were expressed as the mean ± standard deviation. Student’s t-test or rank-sum test was used for comparisons between groups. Categorical data were analyzed by the chi-square test or Fisher’s exact test. Correlation between two groups was determined by analysis of Pearson’s or Spearman’s correlation coefficient. Survival differences between the two groups were assessed by Kaplan–Meier method and compared using log-rank statistical methods. All statistical tests were bilateral with p value < 0.05 being statistically significant. R software (4.0.4) and GraphPad Prism 7 were used for data analyses.
Results
Genomic Features and Prognostic Value of CMGs in HNSCC
After excluding TNFRSF6B for its low expression, a total of 59 CMGs were abstracted from The Cancer Genome Atlas (TCGA) HNSCC data, including 13 well-defined B7-CD28 family costimulatory molecules and 46 TNFRSF family costimulatory molecules (Table 2). The different expression levels of CMGs between HNSCC tumor and normal tissues were exhibited in Figure 1A and Table 2. Moreover, PCA exhibited that CMGs could obviously distinguish tumor samples from normal samples (Figure 1B). The correlation of CMGs was shown in Figure 1C. CMGs with genetic alterations rate >3% were demonstrated based on cBioPortal database (Supplementary Figure 1).
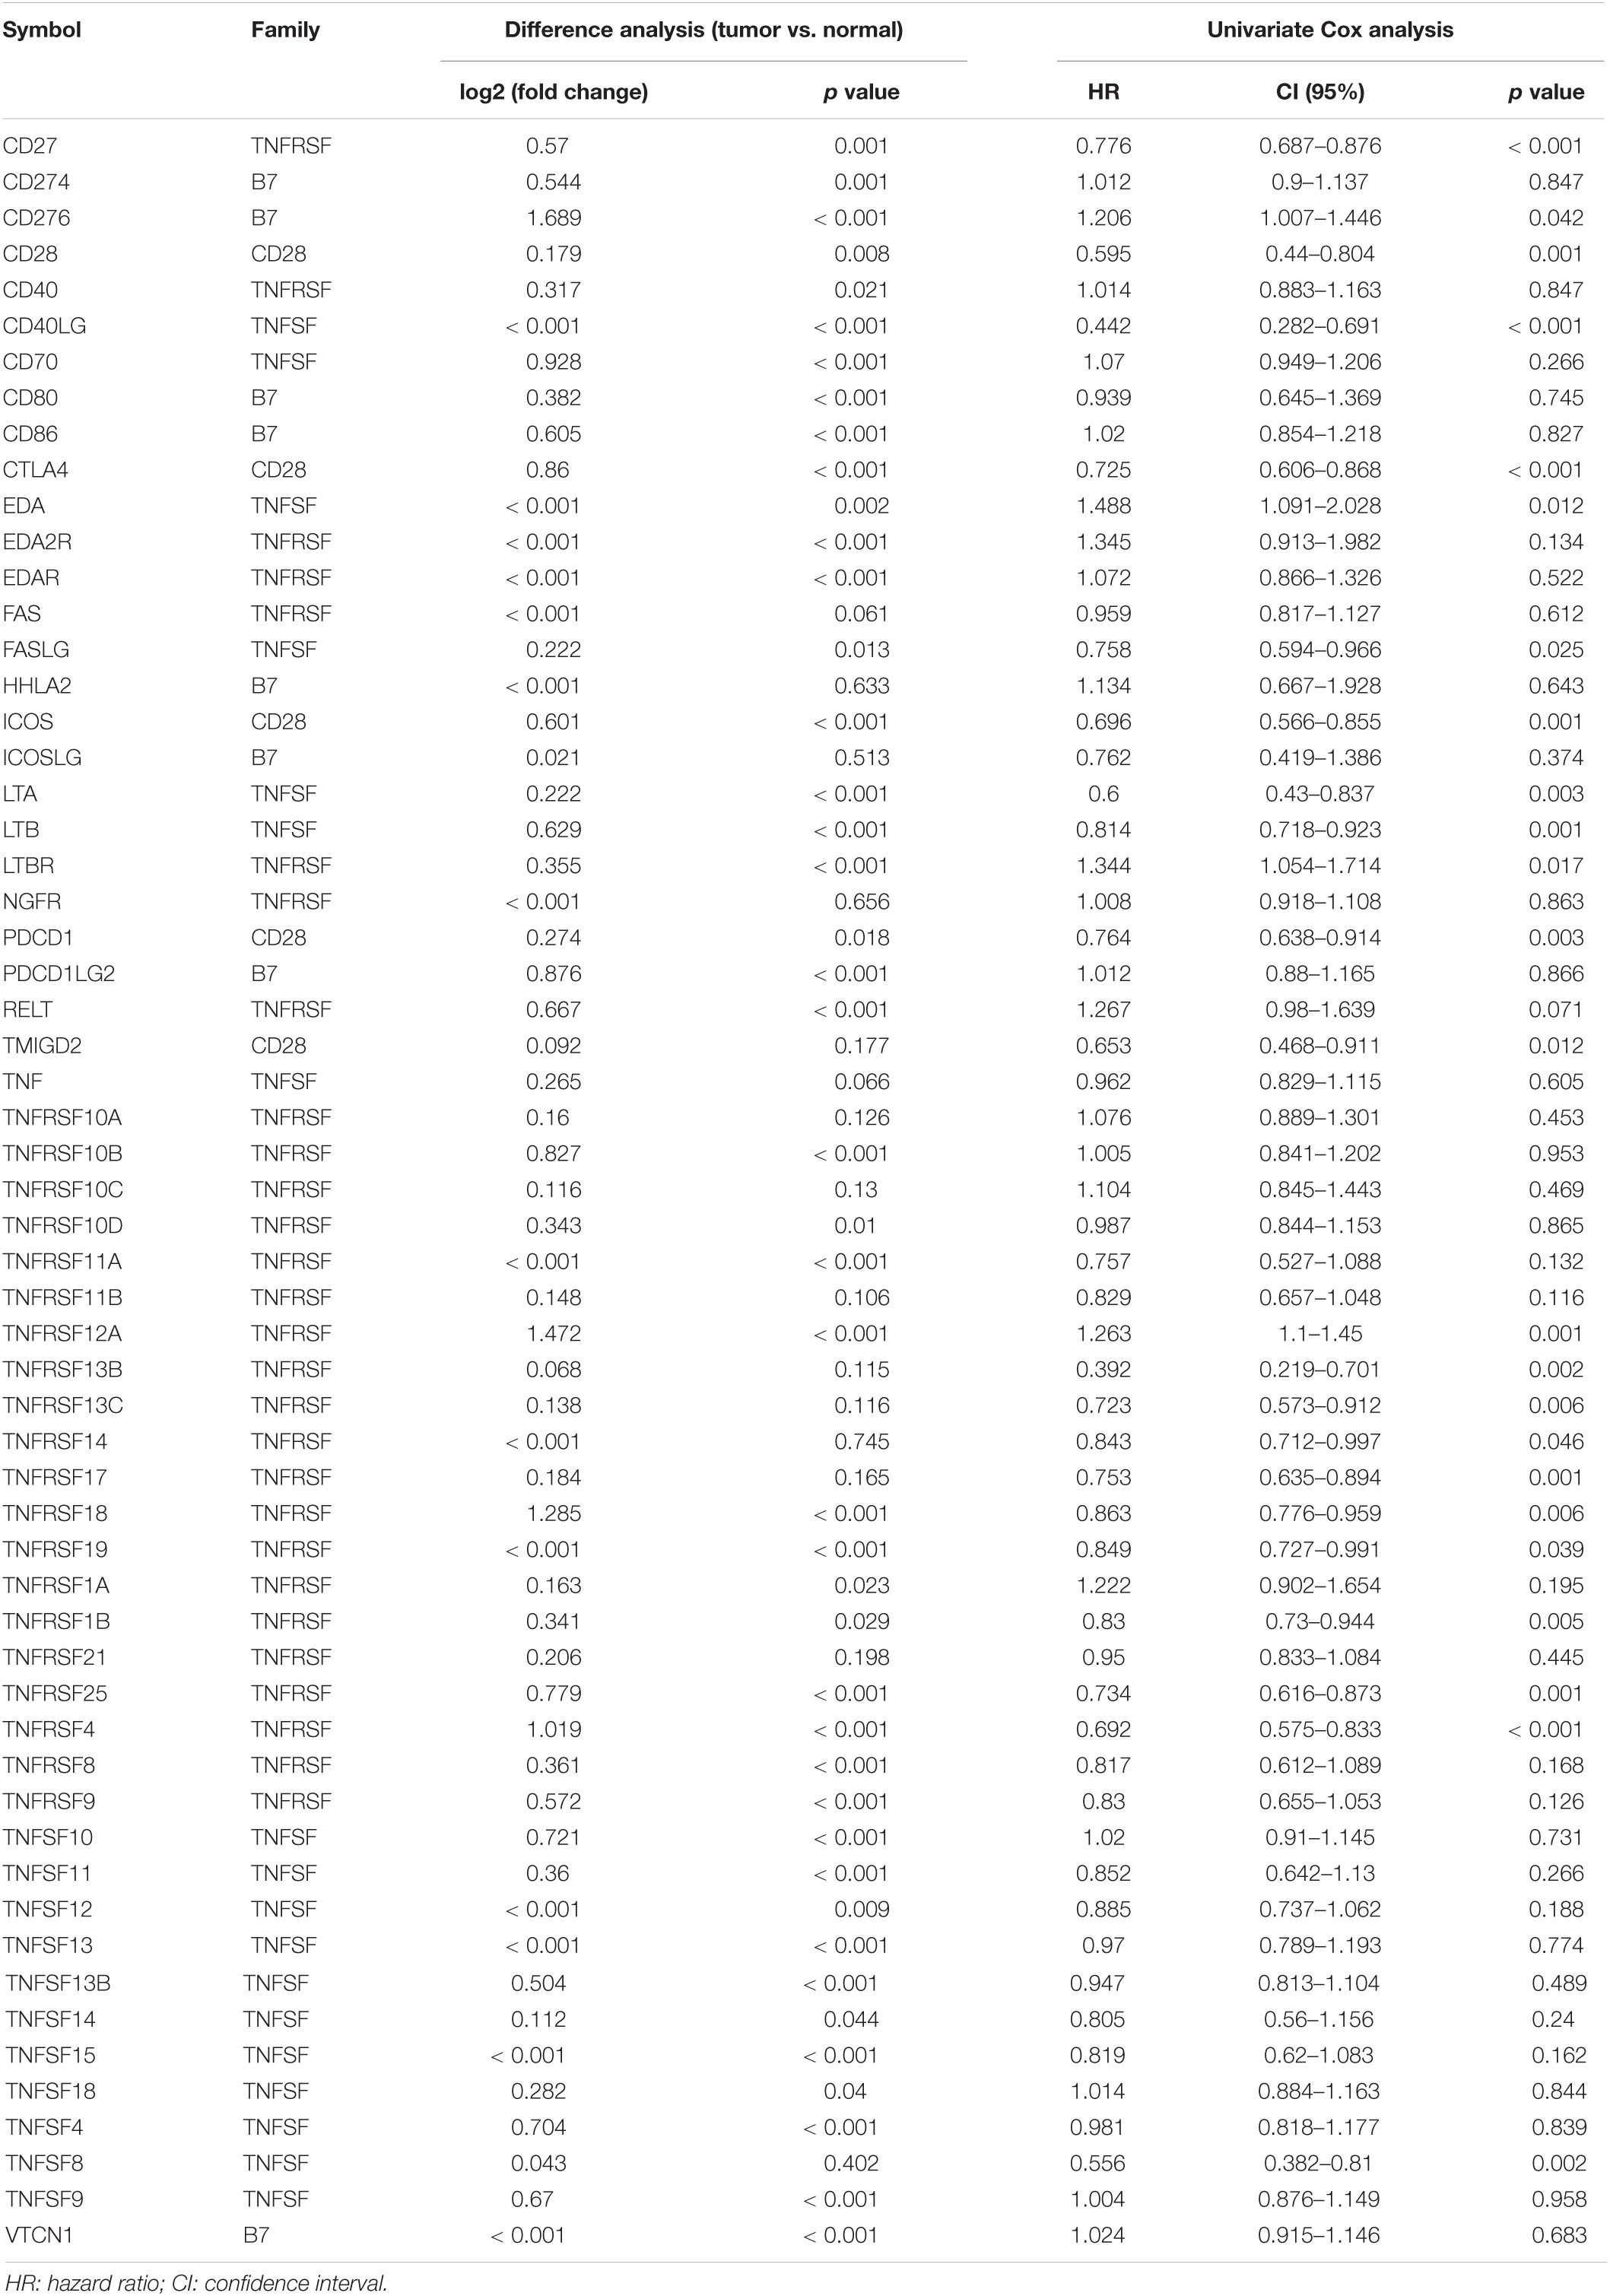
Table 2. Difference analysis and Cox analysis of costimulatory molecule genes in TCGA cohort.
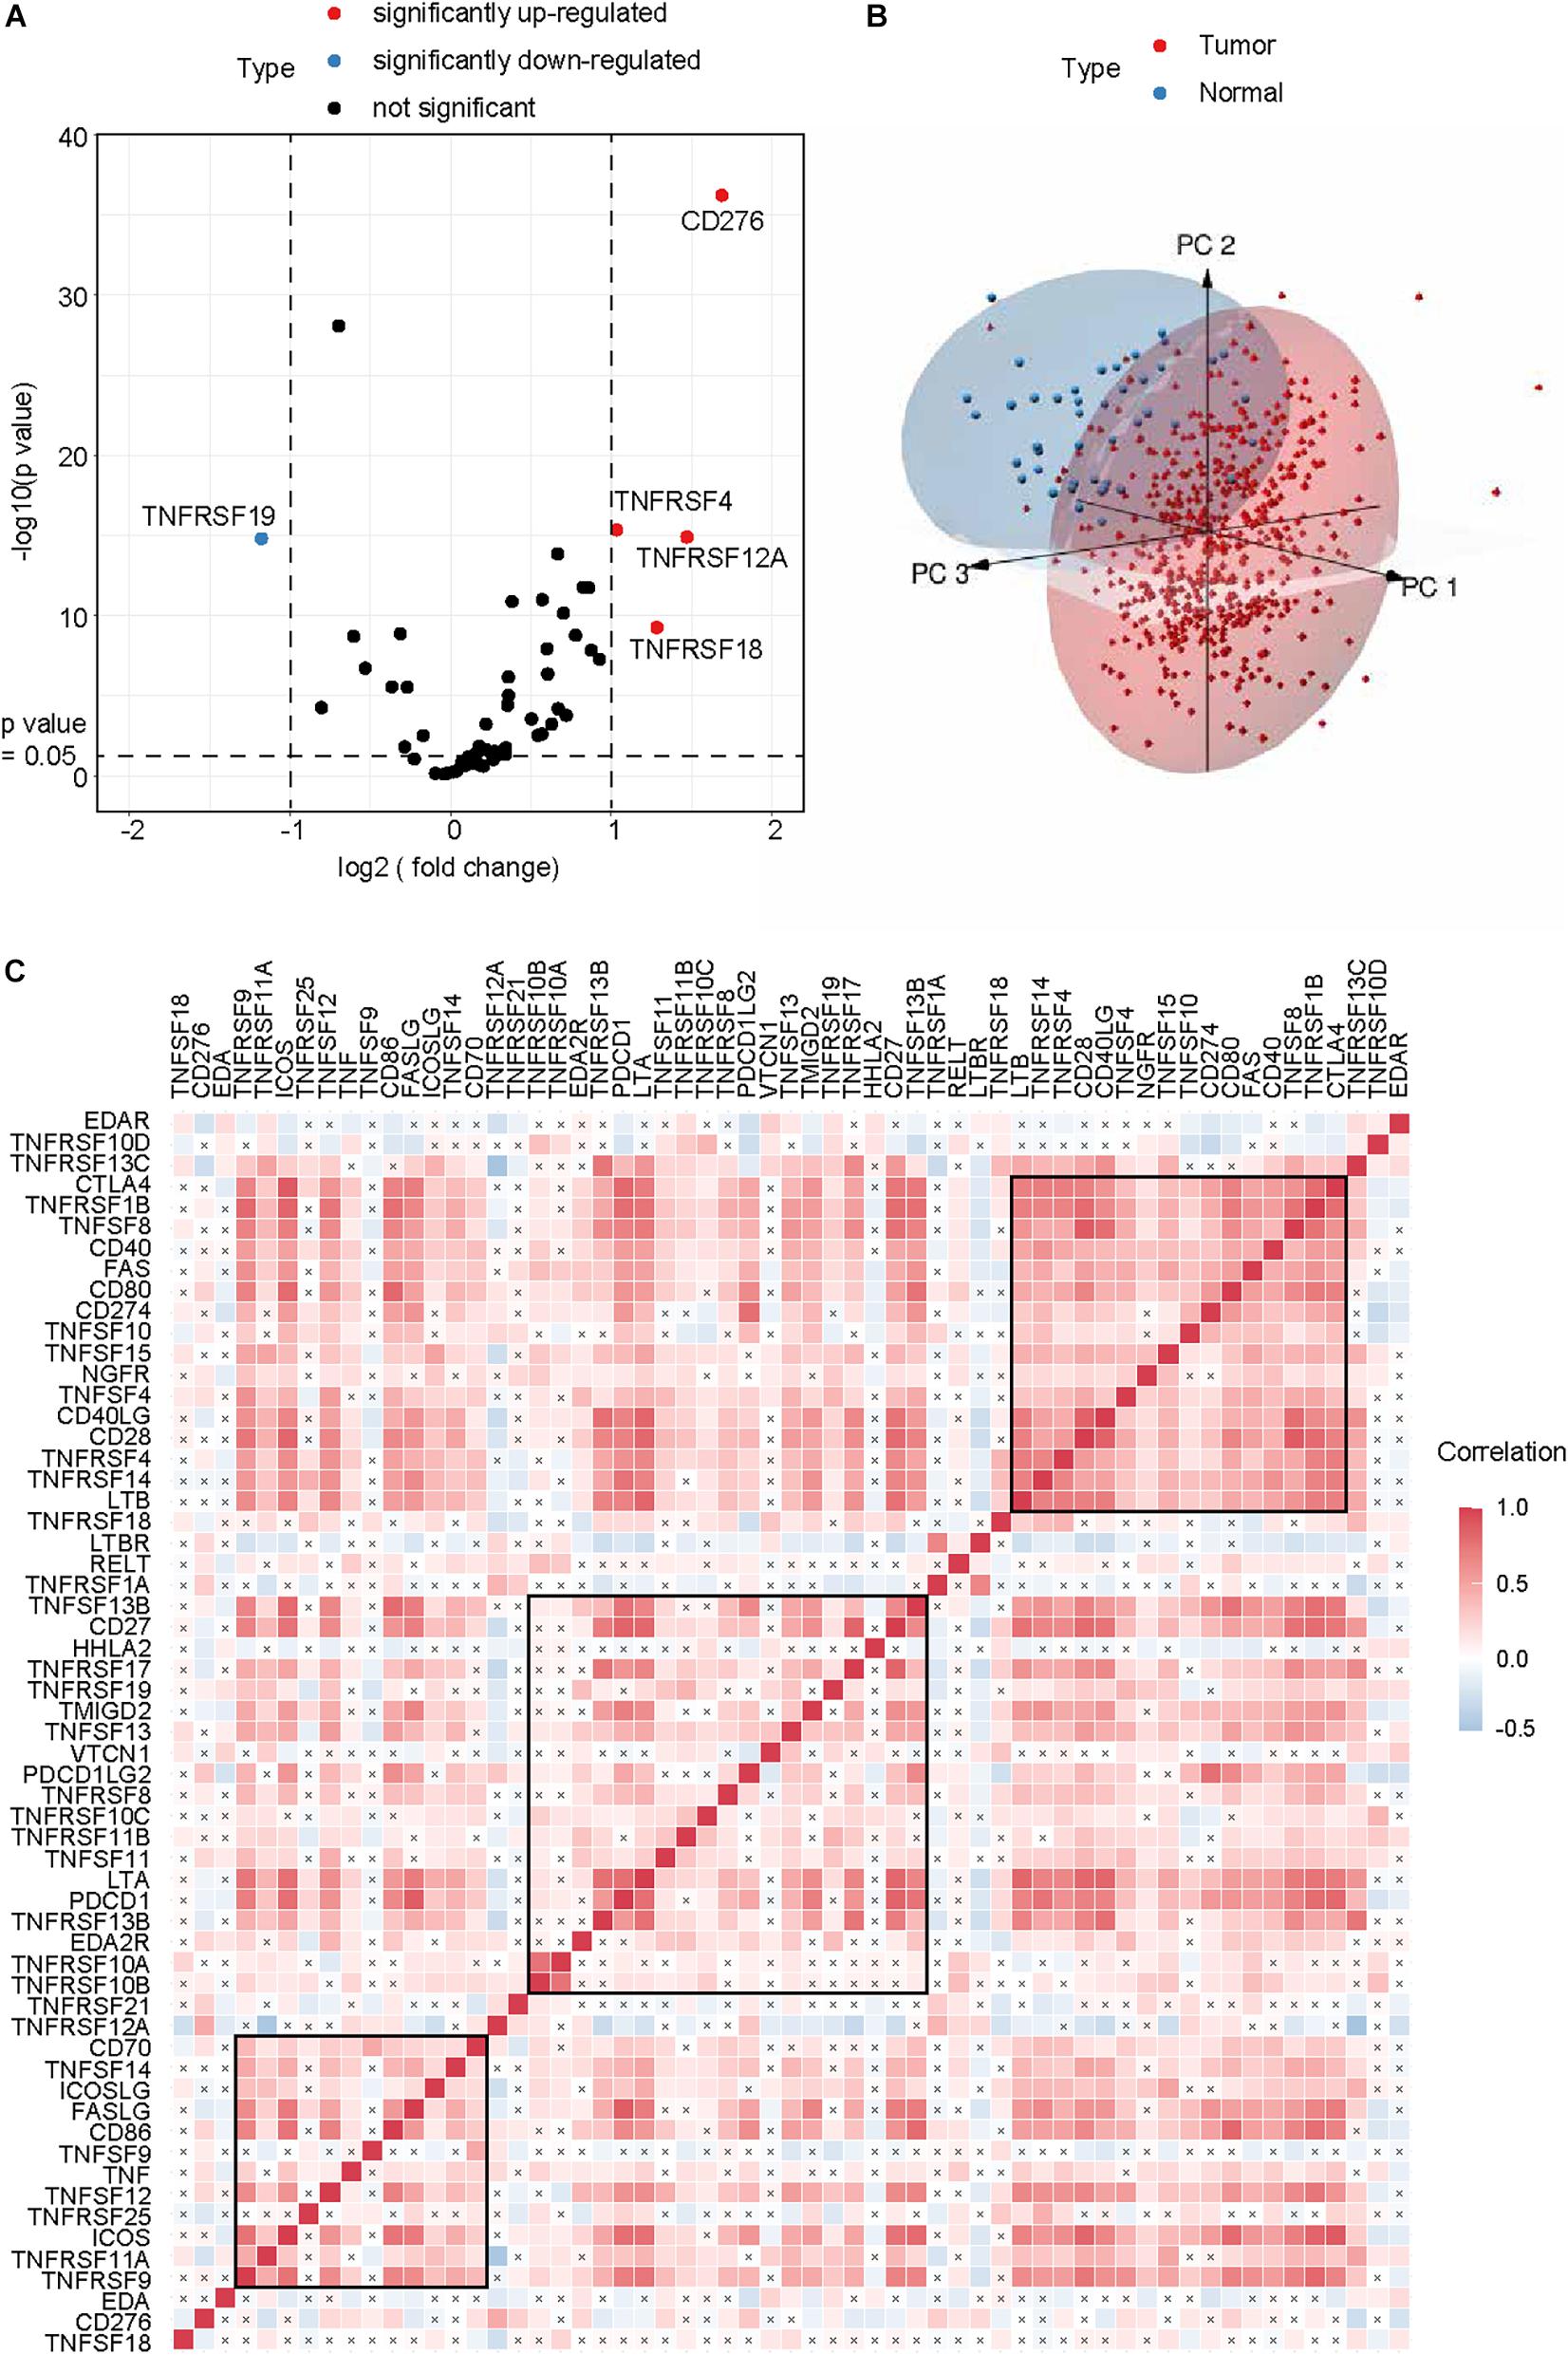
Figure 1. Genomic landscape of CMGs in HNSCC. (A) Volcano plot exhibited the different expression patterns of CMGs between HNSCC tumors and normal tissues. (B) PCA for the expression profiles of CMGs to distinguish HNSCC tumors from normal tissues. (C) Correlation analysis of CMGs in HNSCC by Spearman. The black cross represented the p value > 0.05.
Then, Cox regression analysis revealed that 22 genes were highly associated with OS (p < 0.05, Table 2). Among them, four genes had a high hazard ratio (HR > 1) and were defined as high-risk factors, while eighteen genes had a low hazard ratio (HR < 1) and were defined as protective factors.
Construction and Evaluation of a CMGs Based Risk Model
Following stepwise Cox proportional hazards regression analysis, nine genes were selected to construct CMS (Figure 2A). Then, we established a predictive model on the basis of coefficients and expressions.
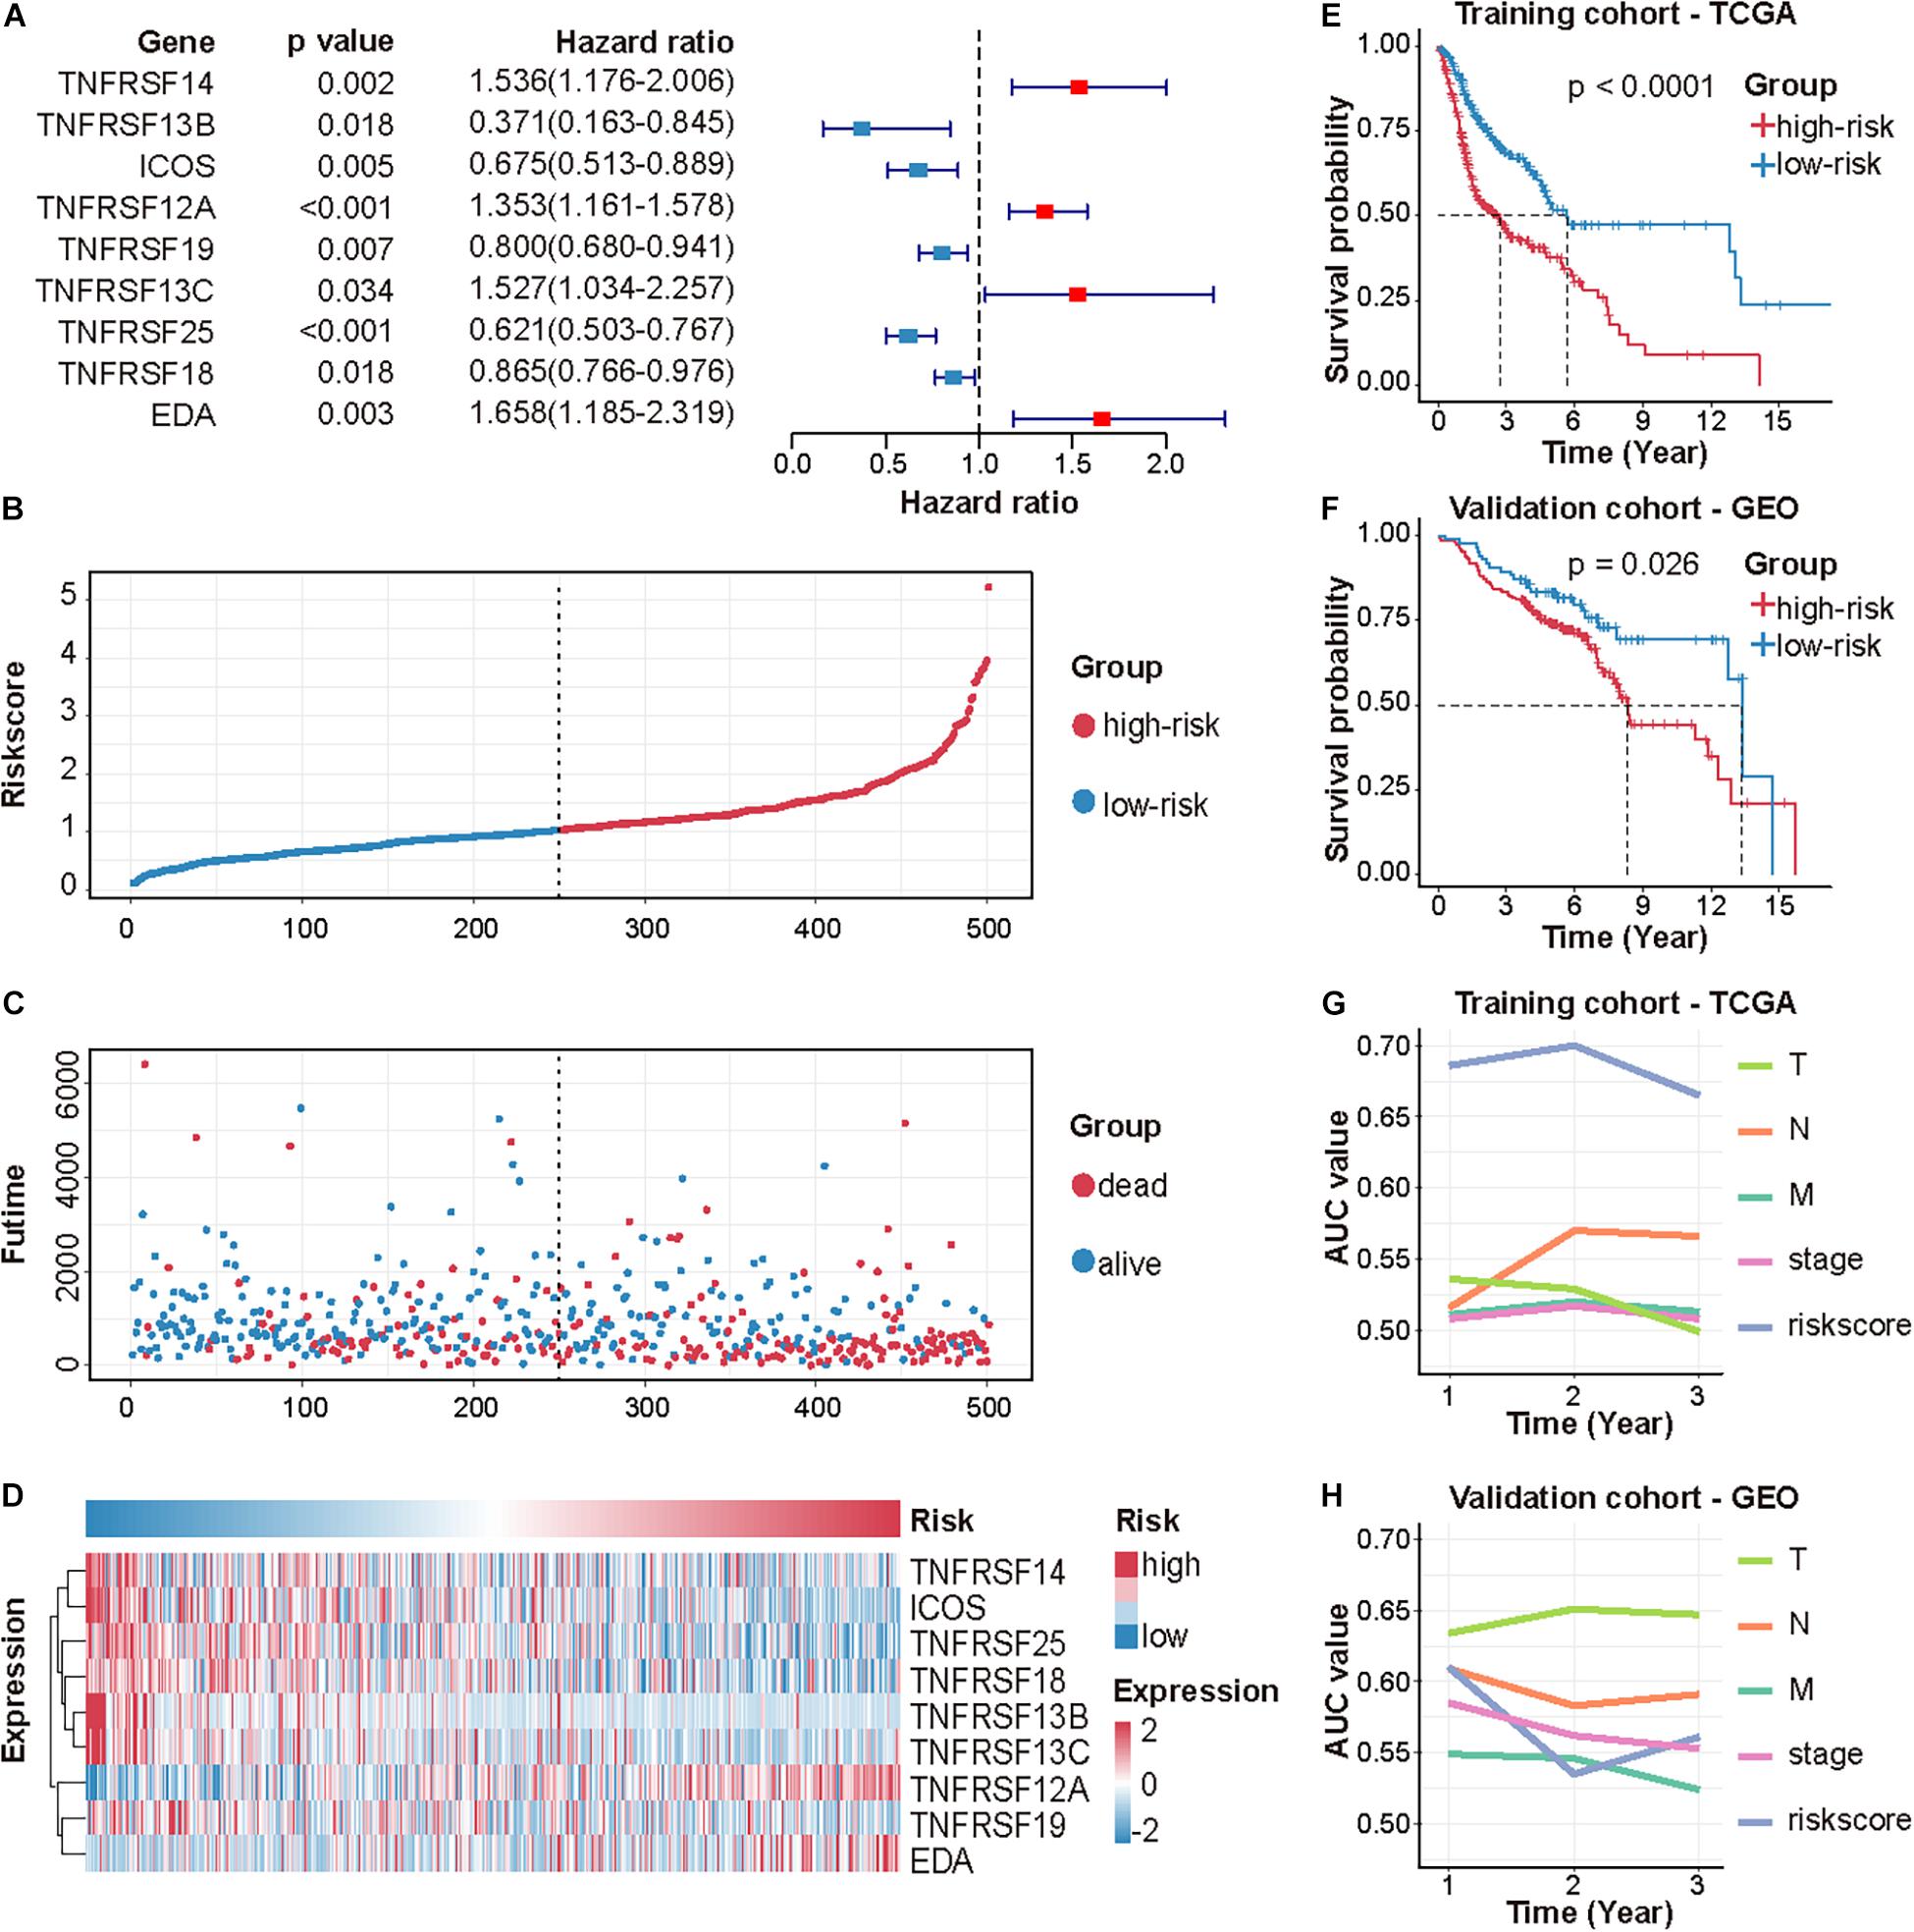
Figure 2. Identification and validation of CMS in HNSCC. (A) A forest plot of multivariate Cox regression analysis of 9 CMGs in HNSCC. The risk score distribution of each patient (B), the survival time and status of each patient (C), and the expression of 9 CMGs in each patient (D). (E,F) Survival analysis of CMS in the TCGA and GEO dataset by performing the log-rank test. (G,H) AUC values of CMS and other clinical indices were determined in the TCGA and GEO dataset by performing ROC curve analysis.
Patients were assigned to either high- or low-risk group using the median risk score as the cutoff value. The distribution of risk scores, survival status, and survival time of patients was exhibited by scatter plots (Figures 2B,C). The expressions of nine selected genes were visualized by a heat map (Figure 2D).
Differences in clinicopathologic features between the high-risk and low-risk subgroups were displayed in Table 3. Survival analysis indicated that patients in the high-risk group exhibited poorer OS (p < 0.0001; Figure 2E). The ROC curve for CMS and other clinical indices was shown in Figure 2G. Furthermore, the accuracy of CMS was validated in another independent GSE65858 cohort (Figures 2F,H).
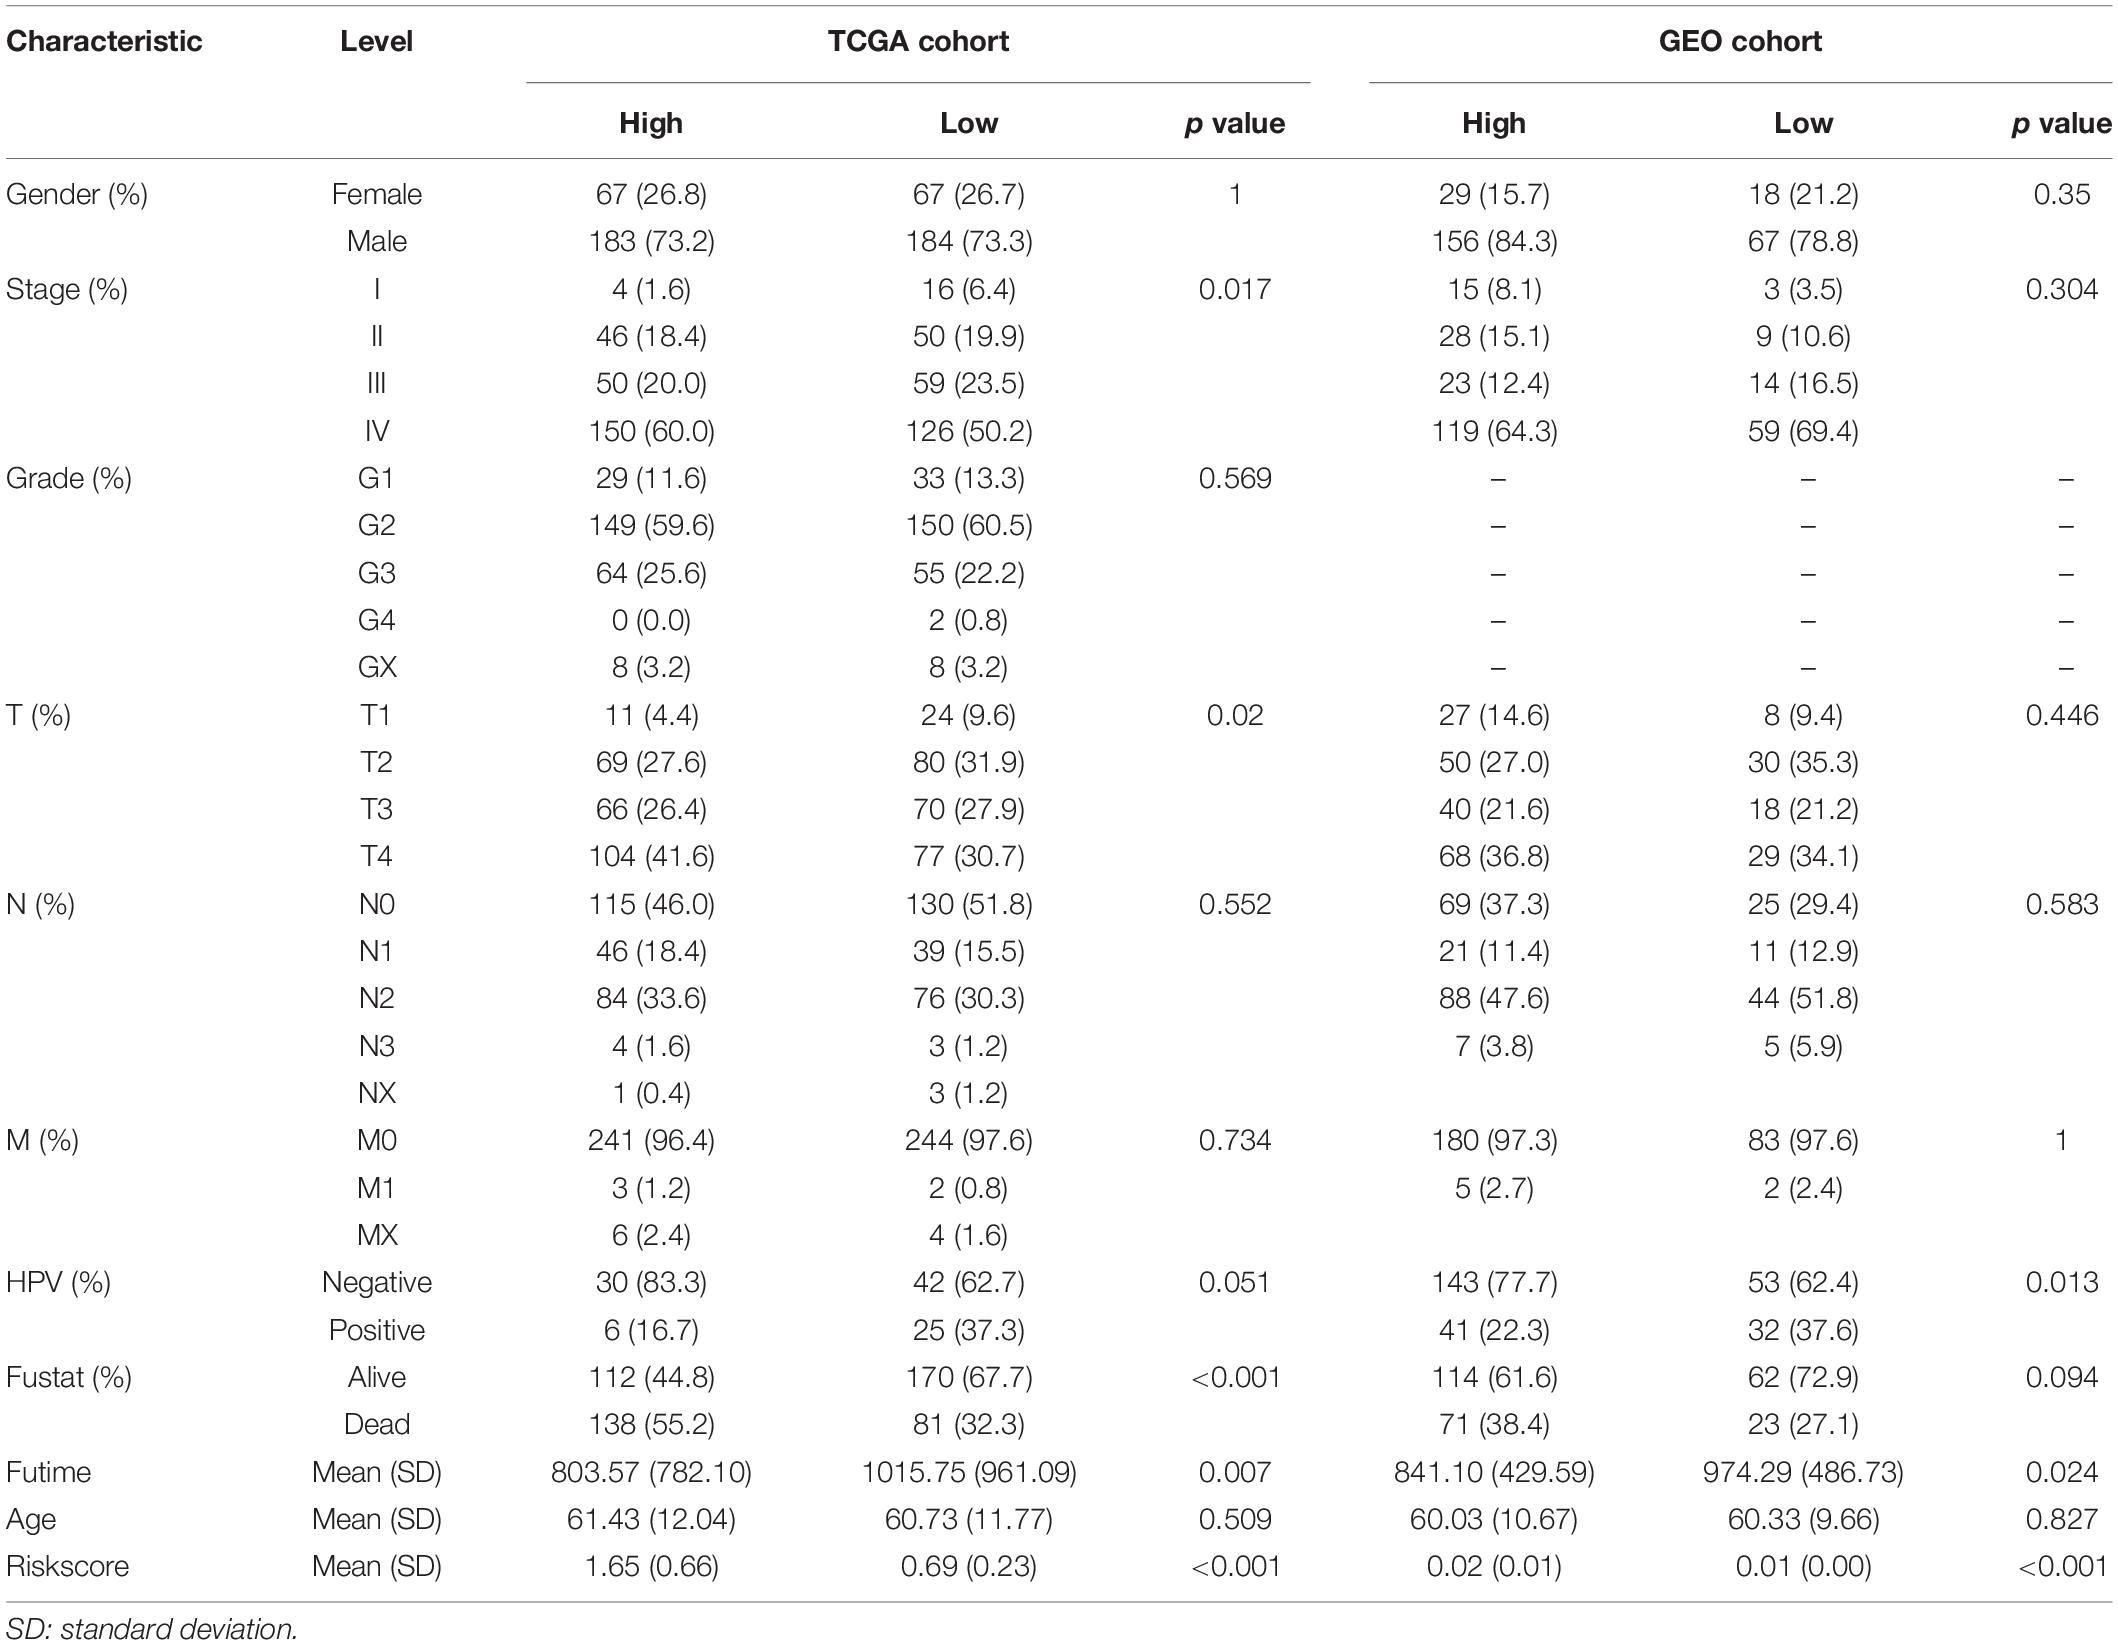
Table 3. Clinical characteristics of HNSCC patients by different CMS groups.
Meanwhile, we calculated the correlation between clinical features and the risk score on OS, as well. Log-rank analysis manifested that higher risk scores were associated with poor prognosis in most subgroups, which was in accordance to the results in the total cohort (Figure 3).
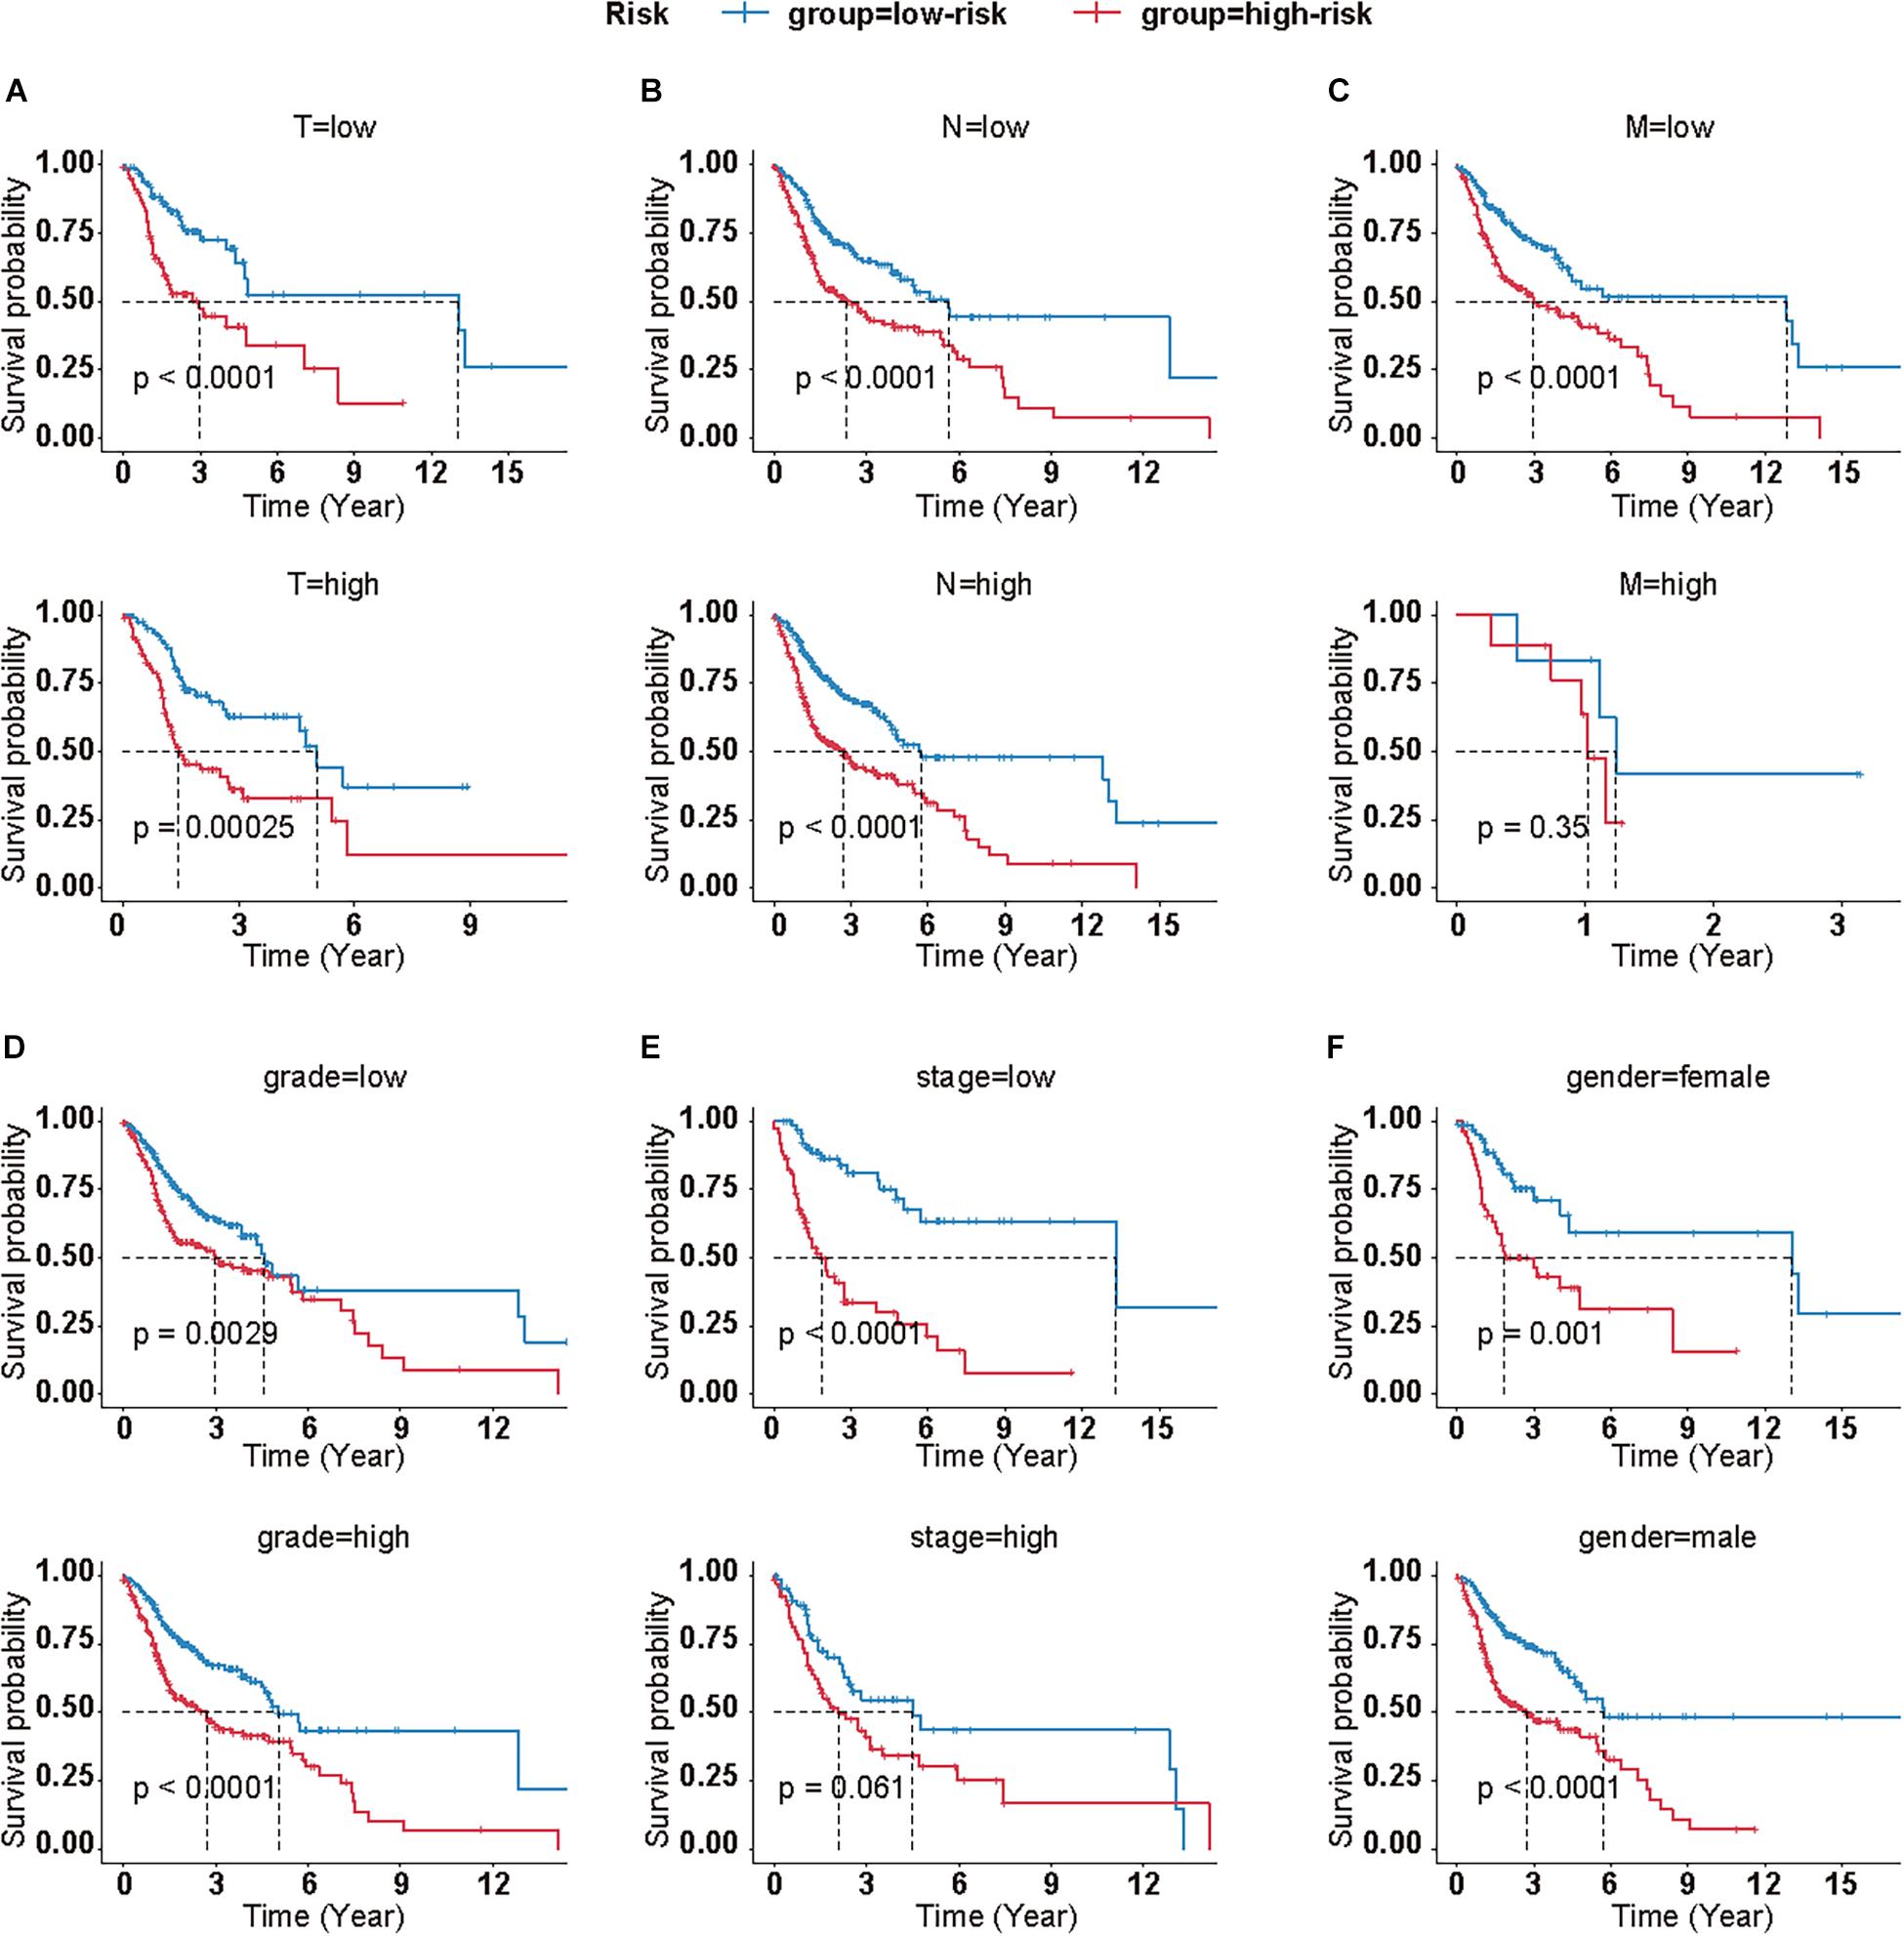
Figure 3. Clinical significance of CMS in different subgroups. Survival analyses of CMS in HNSCC patients with different T (A), N (B), M (C), grade (D), stage (E), and gender (F). (T low = T1+T2; T high = T2+T4; N low = N0+N1; N high = N2+N3+NX; M low = M0; M high = M1+MX; grade low = G1+G2; grade high = G3+G4+GX; stage low = I+II, stage high = III+IV).
CMS Was an Independent Predictor for HNSCC
Subsequently, univariate analysis was used to examine the prognostic value of risk score and several clinicopathological features (Figure 4A). Consequently, risk score (p < 0.001), age (p < 0.05), gender (p < 0.05), N (p < 0.05), and M stages (p < 0.05) were unfavorable factors for OS. To further verify the clinical implications of CMS, multivariate Cox regression analyses were performed (Figure 4B). Collectively, these results revealed that the novel prognostic model could work as an independent prognostic factor related to the OS of HNSCC (p < 0.001).

Figure 4. Establishment of a novel nomogram based on CMS. Forest plots exhibited univariate (A) and multivariate (B) Cox regression analysis of clinical features and risk score in the TCGA cohort. (C) The nomogram for predicting 1-, 2-, and 3-year OS in TCGA cohort. (D) Calibration curves of nomogram on consistency between predicted and observed 1-, 2-, and 3-year survival in TCGA cohort.
Establishment of a Novel Nomogram
To provide a more accurate estimation of survival rates for HNSCC patients, a prognostic nomogram was constructed based on statistically significant factors in univariable cox regression analysis (Figure 4C). What is more, the calibration curves of the prognostic nomogram suggested the satisfying consistency between prediction and actual 1-, 2-, and 3-year survival in the TCGA cohort (Figure 4D).
CMS Related Biological Processes and Pathways
We then explored the down-stream pathways in different CMS stratification. A total of 220 DEGs were screened out. Among them, 47 genes were upregulated, while 173 genes were downregulated in the high-risk group (Figure 5A).
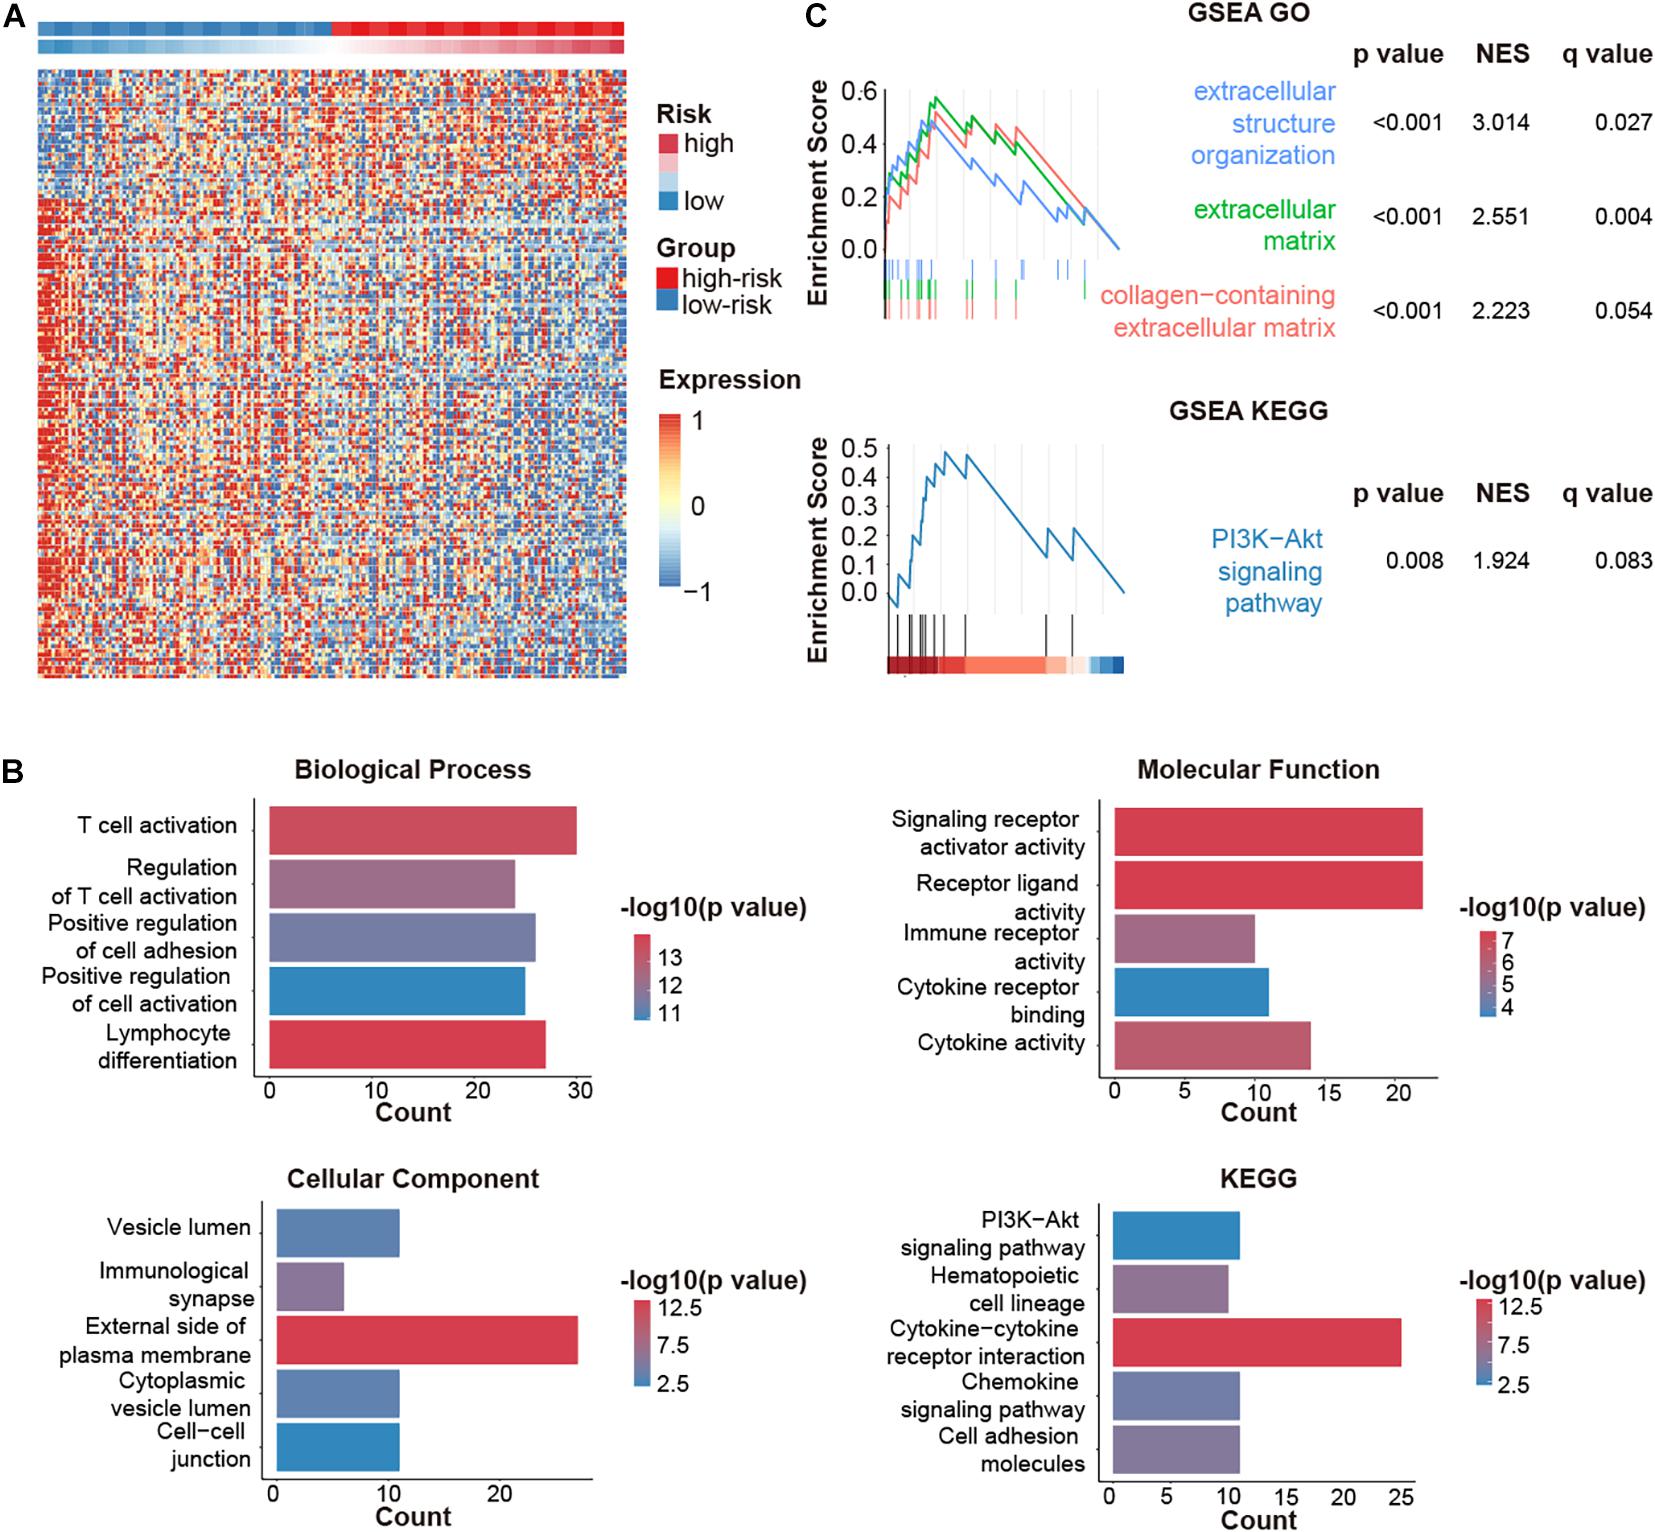
Figure 5. CMGs-based signature (CMS)-related biological pathways. (A) DEGs in different risk groups. (B) GO and KEGG analyses based on DEGs. (C) DEGs were analyzed by GSEA. NES: normalized enrichment score.
Gene ontology analysis revealed that DEGs were highly involved in immune-relevant responses (Figure 5B), especially immune cell activation, which was validated by GSEA (Figure 5C). Besides, KEGG and GSEA analysis jointly suggested that the PI3K-AKT pathway might be implicated during these biological processes.
CMS Predicted Immune Infiltration and Responses of Immunotherapy
Despite the great achievements of immune checkpoint inhibitors (ICIs), only a fraction of patients could expect to benefit from such burgeoning agents. The development of predictive indices is needed to optimize patients’ benefit and avoid toxicity risks (Topalian et al., 2016). Hence, we evaluated the association of CMS and immunotherapy responses by accessing several biomarkers. Collectively, we enrolled five indices, including IPS, TMB, tumor purity, infiltration levels of different immune cells, and immune signature genes, to obtain a more comprehensive prospect.
Using IPS, a machine learning-based scoring scheme to predict the responses of patients to ICIs, we found that the relative probabilities of responding to anti-PD-1/PD-L1 and anti-CTLA-4 treatment were higher in the group with low-risk scores (p < 0.05, Figure 6A). This indicated that patients with low-risk scores might receive more satisfactory clinical outcomes following immunotherapy. However, no significant differences between the groups were observed for TMB, which is a biomarker for immunotherapy (Chan et al., 2019; Figure 6B).
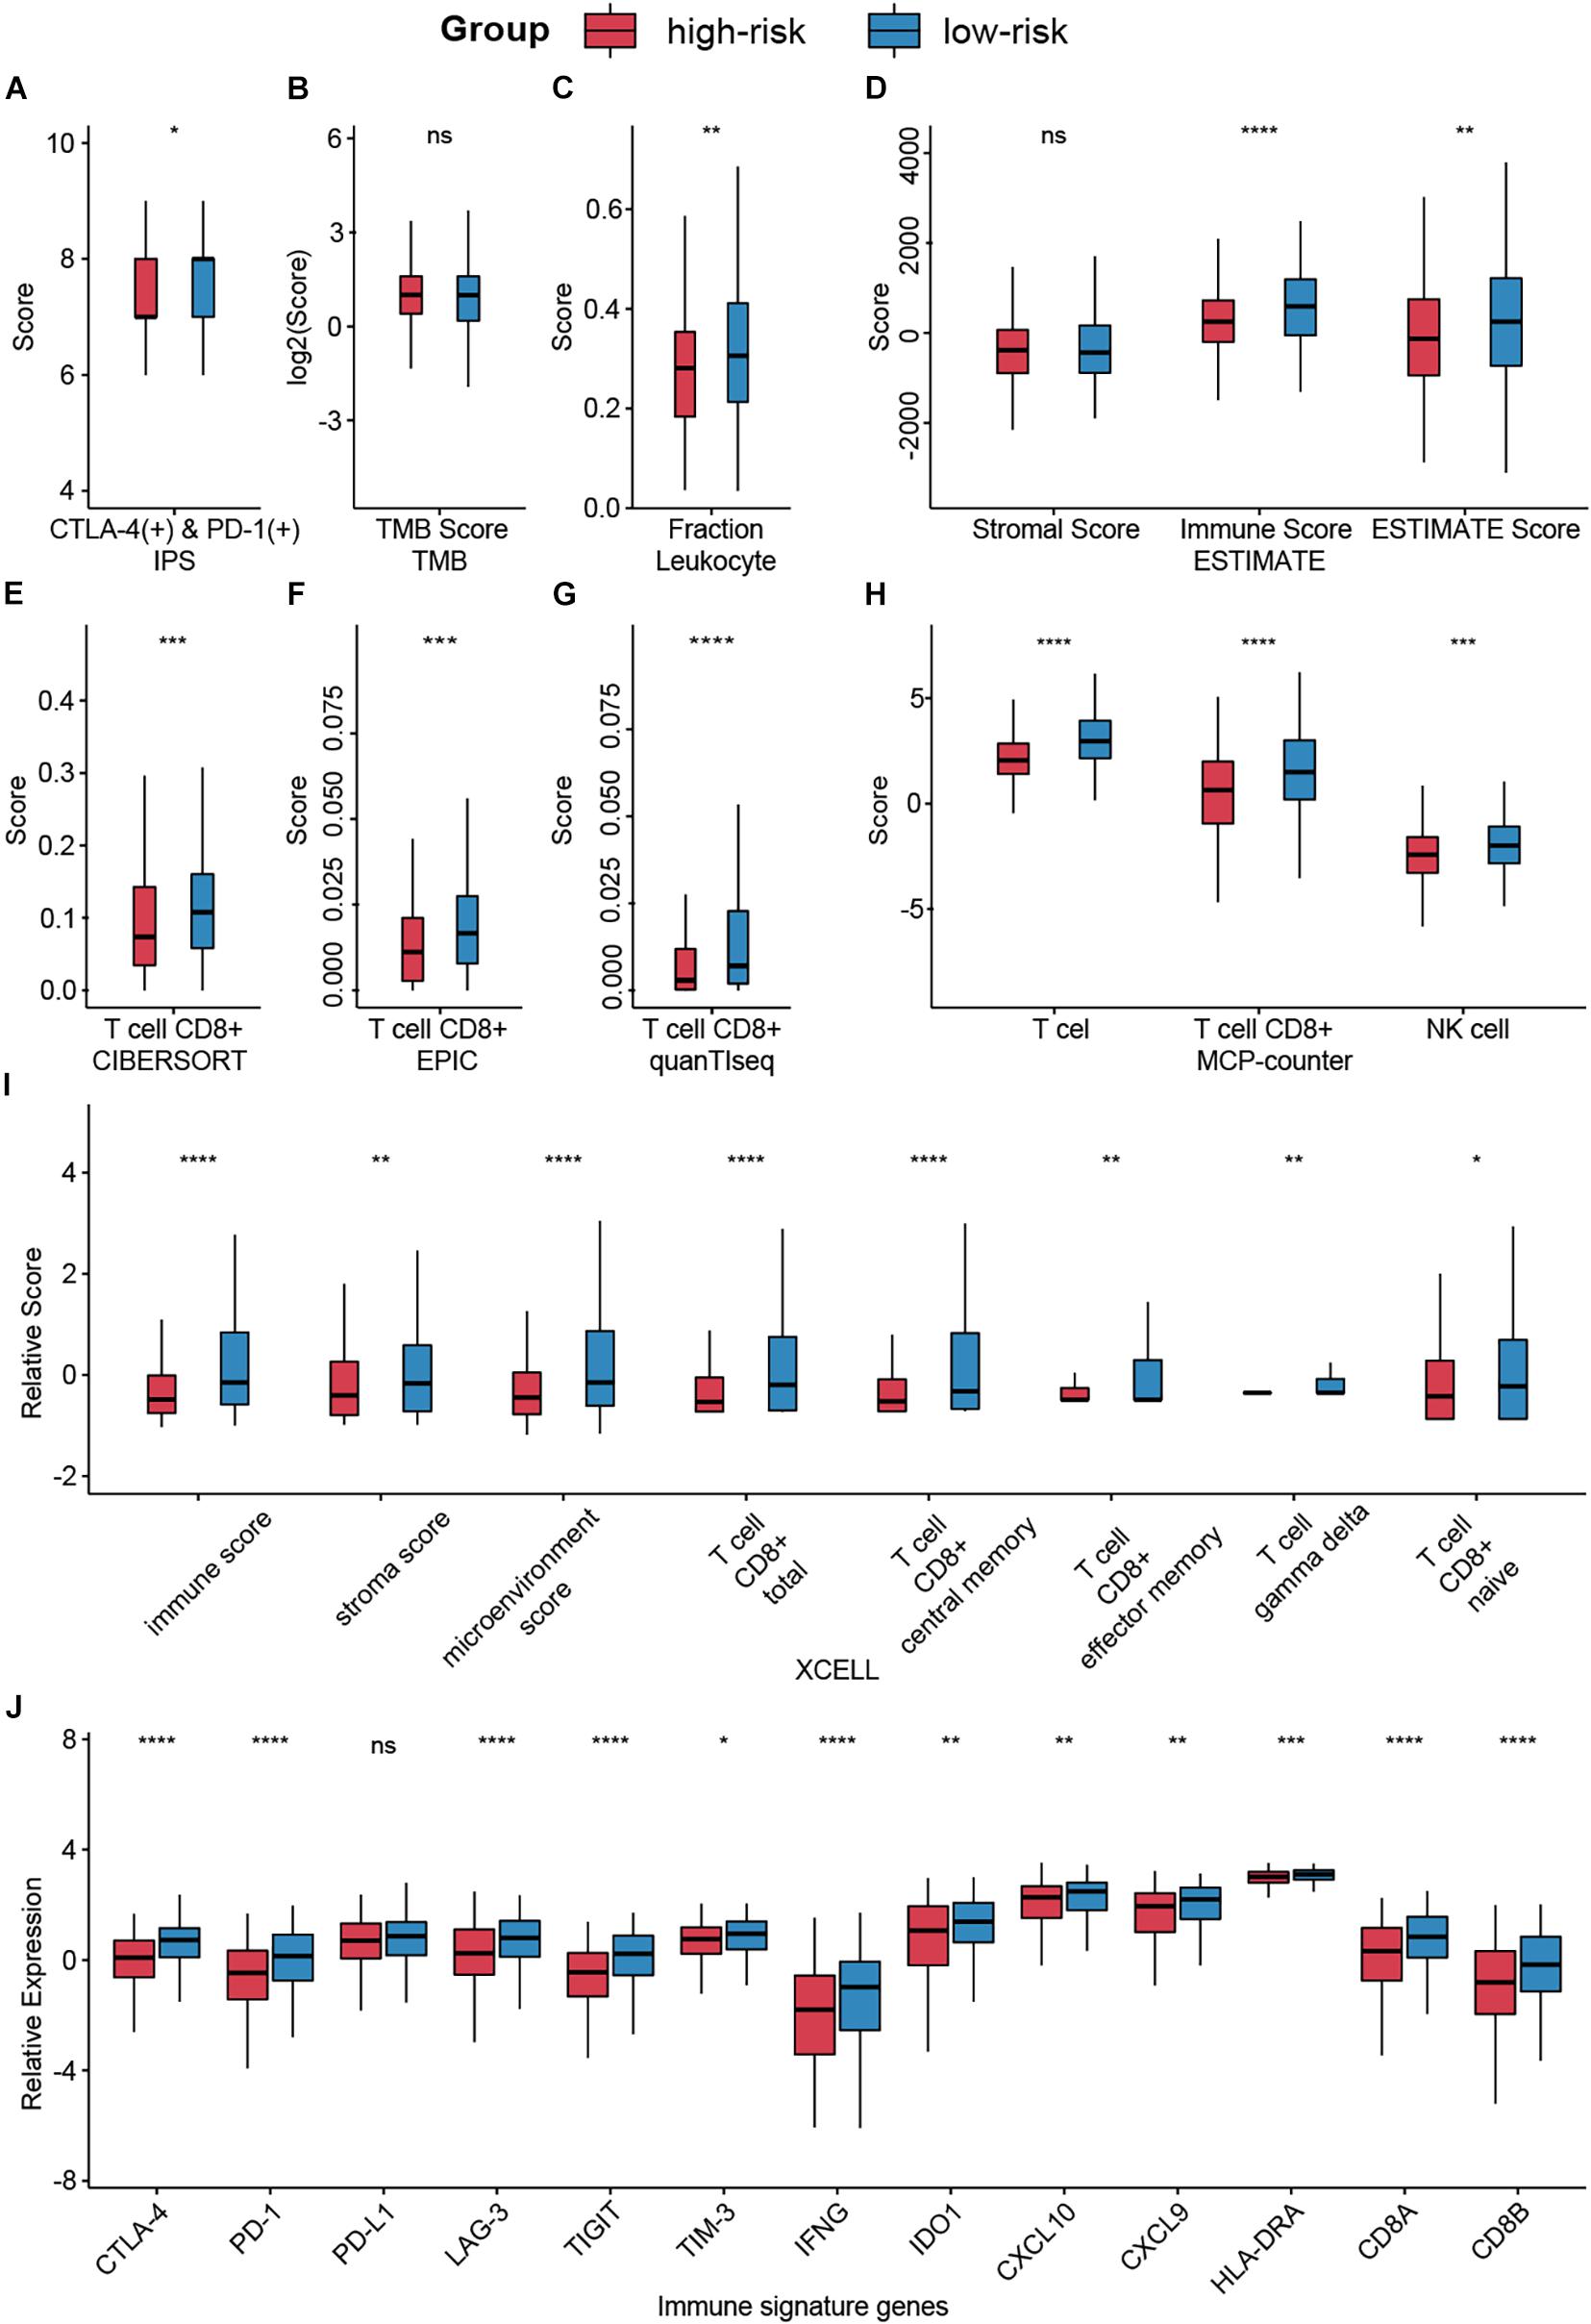
Figure 6. Analysis of immunotherapy responses in different risk groups. (A) The relationship between the risk groups and IPS. (B) TMB in different risk groups. (C,D) Leukocyte fraction and ESTIMATE score indicated that immune cells were highly enriched in the low-risk group. (E–I) Infiltrating immune cell in different groups was calculated by CIBERSORT, EPIC, quanTIseq, MCP-counter, and XCELL. (J) Expression levels of immune signature genes in different groups were exhibited by box plot. Ns: not significant, *p < 0.05, **p < 0.01, ***p < 0.001, ****p < 0.0001.
Lymphocyte infiltration, specifically CD8+ T cell and NK cell infiltration, has been documented to be associated with improved survival in various cancers (Galon et al., 2006). Based on several algorithms, such as ESTIMATE, CIBERSORT, and XCELL, infiltrating immune cells in the tumor microenvironment (TME) were calculated and exhibited in Supplementary Figure 2. Results indicated that immune cells, especially CD8+ T cell and NK cell, were highly enriched in the low-risk group (Figures 6C–I).
Besides, we compared the expression levels of immunotherapy-related genes between the high-risk score group and the low-risk score group (Figure 6J). Patients with low-risk scores had significantly elevated expression of PD-1 (p < 0.0001), CTLA-4 (p < 0.0001), and other signature genes.
TNFRSF12A Was a Tumor Promoter in HNSCC
To investigate the significance of our risk model, we then compared the expression levels of 9 factors in CMS and found TNFRSF12A demonstrated the most significant difference between tumor and normal tissues (Table 2 and Figure 1A). Its clinical implication was further validated by GEPIA and HPA database (Supplementary Figures 3A–C). Hence, we chose TNFRSF12A for further investigation.
Short-hairpin RNA (shRNA) was used to inhibit TNFRSF12A expression in two typical HNSCC cell lines to evaluate biological functions of TNFRSF12A. The transfection efficacies were validated by real-time PCR (Figures 7A,B) and Western Blot (Figures 7C,E). By performing CCK-8 (Figures 7D,F) and clone formation (Figures 7G–J) assays, we found that proliferation was dampened when the expression of TNFRSF12A was inhibited. Transwell assays verified that downregulation of TNFRSF12A reduced migration abilities of HNSCC cell lines in the sh-TNFRSF12A group compared to those in the negative control (NC) group (Figures 7K–N).
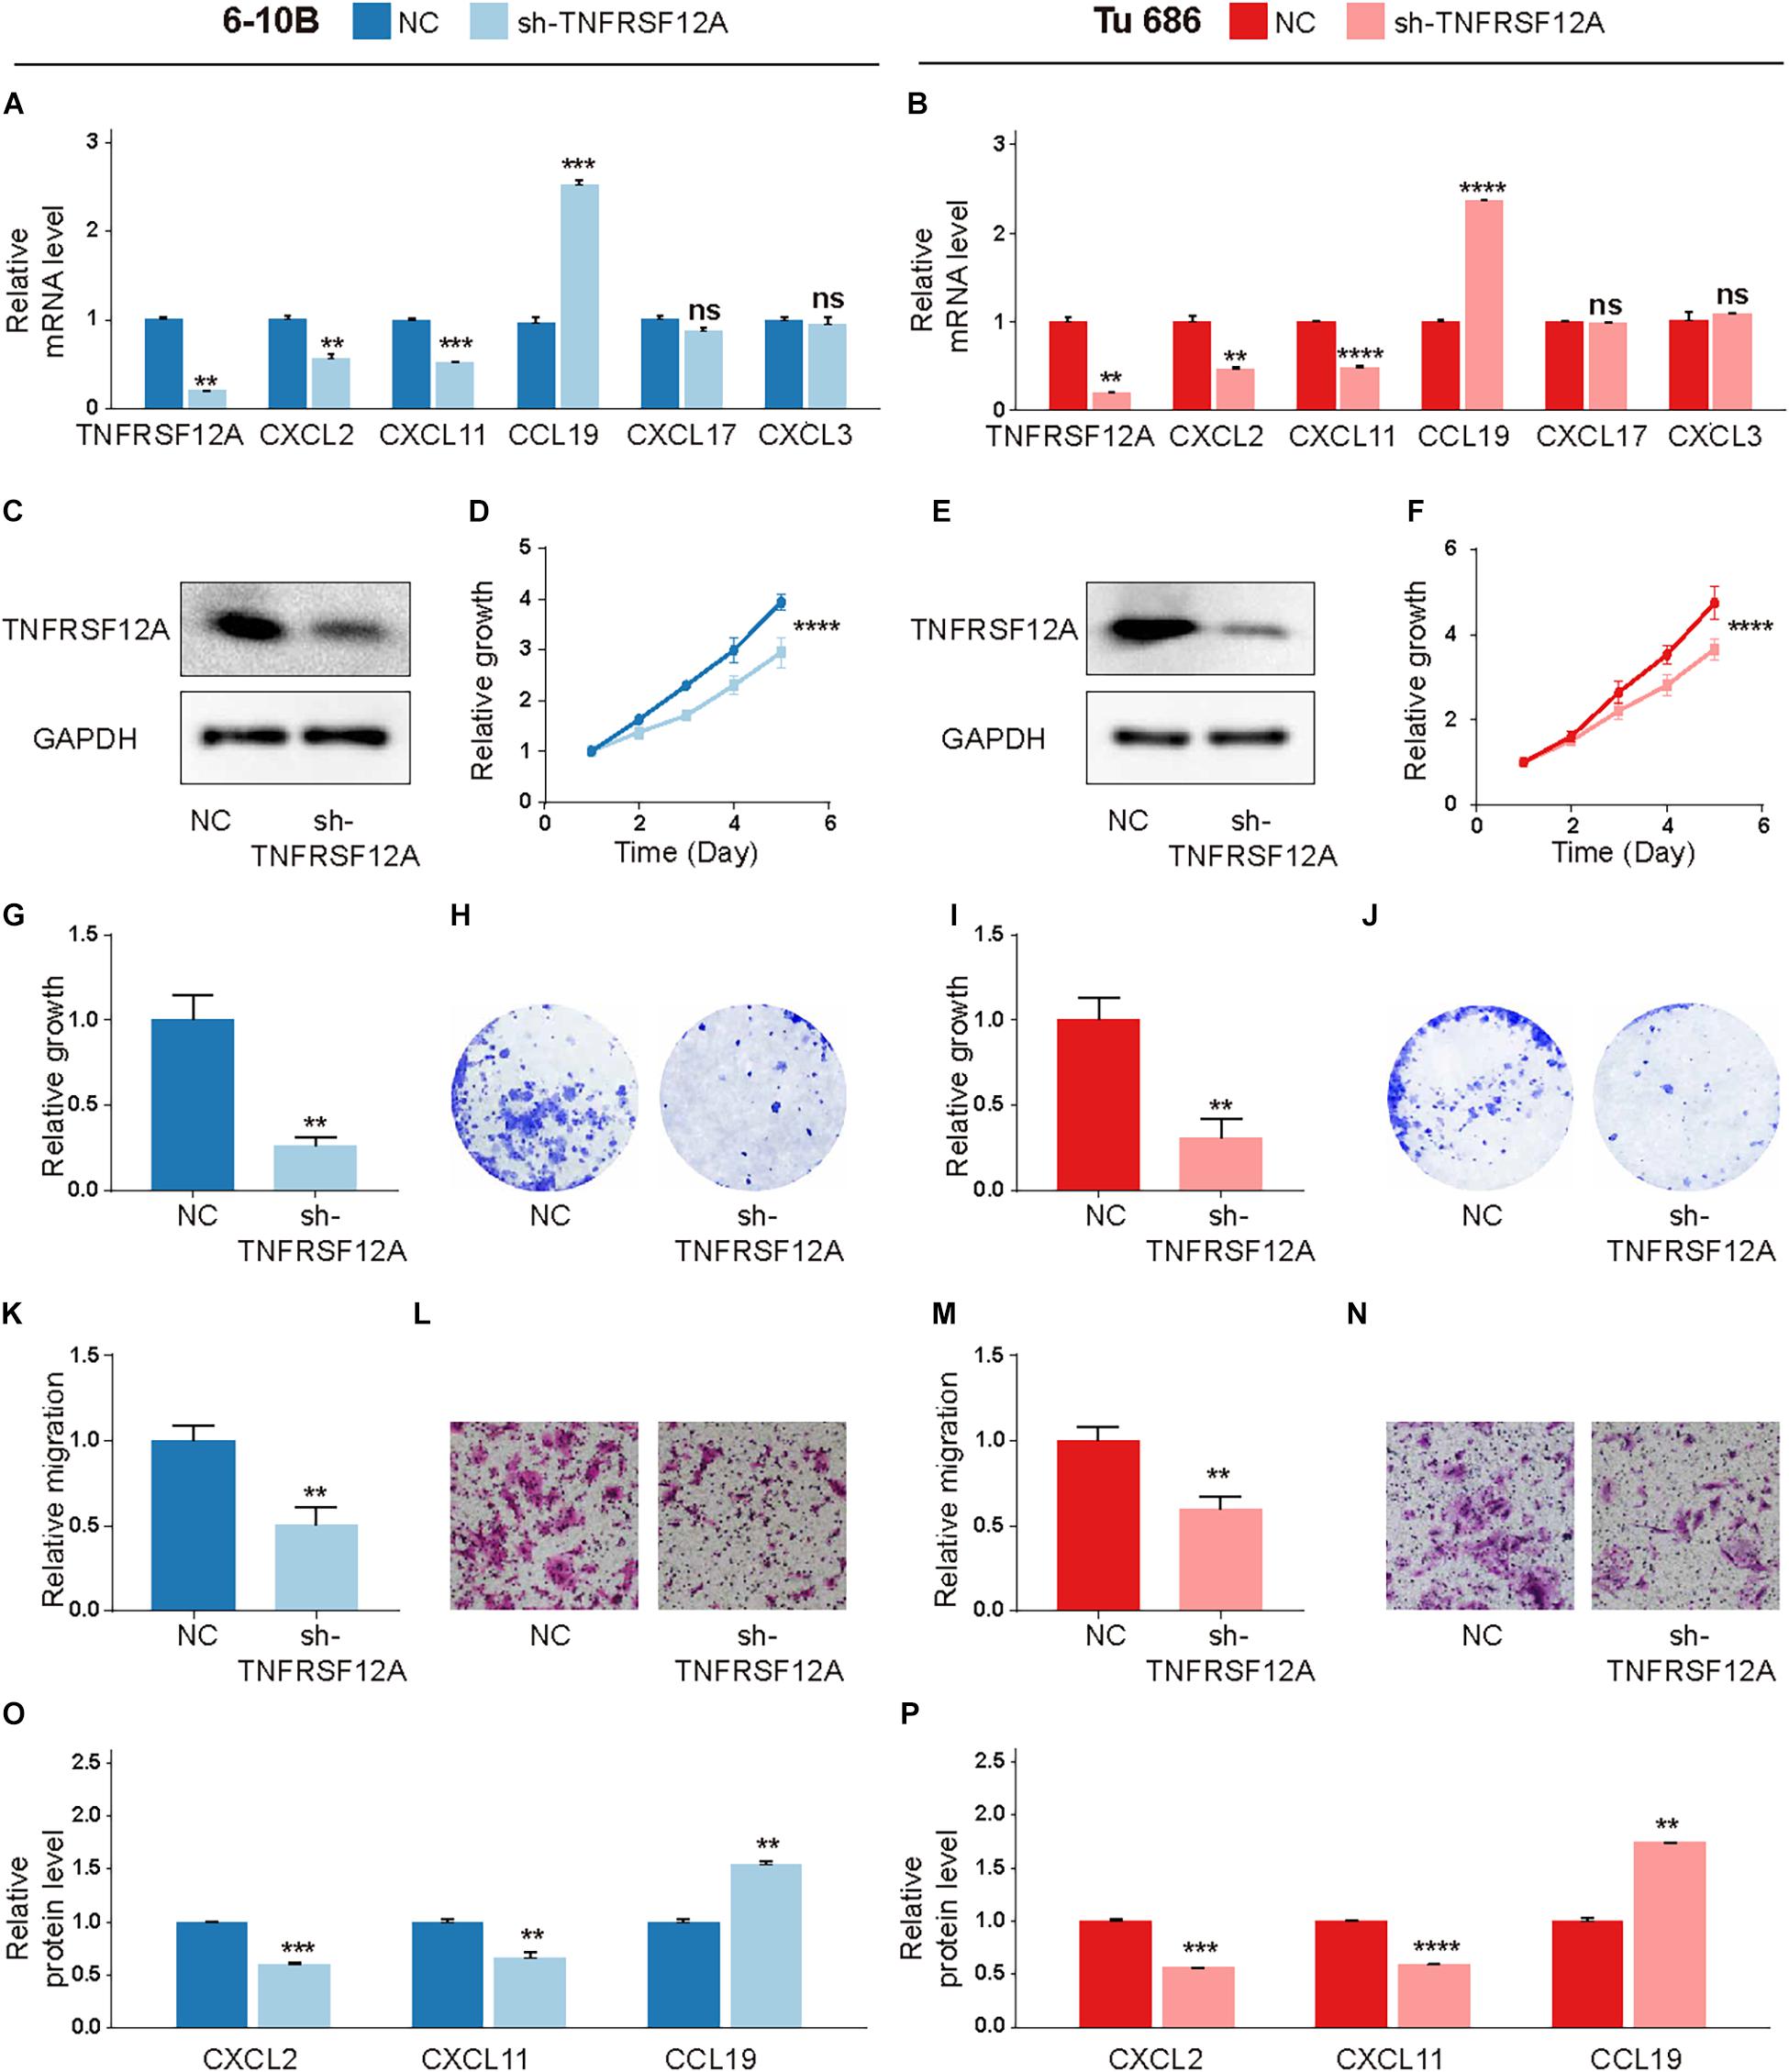
Figure 7. TNFRSF12A was a tumor promoter in HNSCC. (A,B) Expression levels of TNFRSF12A, CXCL2, CXCL11, CCL19, CXCL3, and CXCL17 were detected via real-time PCR. (C,E) Transfection efficacies were validated by Western Blot. (D,F) Knockdown of TNFRSF12A in HNSCC cell lines inhibited cell proliferation was determined by CCK-8. (G,I) Clone formation assays revealed the effects of TNFRSF12A down-regulation on proliferation. (H,J) Representative images of clone formation. (K,M) Tranwell assays detected migration abilities in different groups. (L,N) Representative images of the transwell (Scale bar = 100 μm). (O,P) ELISA exhibited that TNFRSF12A regulated expressions of CXCL2, CXCL11, and CCL19. n = 3/group for all assays; ns: not significant, **p < 0.01, ***p < 0.001, ****p < 0.0001.
Moreover, in order to further explore the relationship between TNFRSF12A and TME, we investigated the relevance between the expression levels of TNFRSF12A and chemokine genes, which were deemed to cast a crucial role in shaping TME and influence clinical outcomes of immunotherapy (Nagarsheth et al., 2017). Correlation analysis revealed that 5 chemokine genes, out of a total of 43 chemokine genes, exhibited significant correlations with TNFRSF12A (Supplementary Figure 3D). Among these 5 chemokine genes, CXCL2, CXCL3, and CXCL11 showed positive correlation with TNFRSF12A (R > 0.25, p < 0.05), while CXCL17 and CCL19 showed negative correlation (R < −0.25, p < 0.05). Real-time PCR revealed that TNFRSF12A could regulate expressions of CXCL2, CXCL11, and CCL19 (Figures 7A,B). ELISA further validated that TNFRSF12A was the up-stream regulator of CXCL2, CXCL11, and CCL19 (Figures 7O,P).
Discussion
Immune escape and T cell exhaustion are reckoned as features in the TME, closely associated with patients’ survival (Chen and Mellman, 2017). By inhibiting the immune checkpoints, immune cells could be rejuvenated to eliminate cancer cells, which becomes a potential target for cancer immunotherapy (O’Donnell et al., 2019).
In the current study, we synchronously inspected the genome landscape and prognostic value of 59 costimulatory molecules in HNSCC patients. Through TCGA RNAseq data, 22 CMGs were discovered to be related to prognosis. Most of these CMGs had been reported to be involved in various diseases, including cancer. For instance, TNFRSF12A could result in cancer, chronic autoimmune diseases, and acute ischemic stroke via the TWEAK-TNFRSF12A axis (Winkles, 2008). Overexpression of TNFSF14 could contribute to the expansion of functional T cells to prevent the growth of human papillomavirus 16-induced tumors (Kanodia et al., 2010). High expression of ICOS in leukemia was associated with poor prognosis and might contribute to tumor proliferation by assisting tumor cells in evading antitumor immune responses (Tamura et al., 2005).
Among 9 CMGs in CMS, TNFRSF12A showed the most notable difference between tumor and normal tissues. And two independent databases also verified its clinical manifestations. Thus, TNFRSF12A was chosen for subsequent experiments. By knocking down TNFRSF12A in two typical HNSCC cell lines, we found that reduced expression of TNFRSF12A significantly inhibited cellular proliferation in vitro. Simultaneously, downregulation of TNFRSF12A also dampened the migration ability of HNSCC cell lines, consolidating its role as a tumor promoter in HNSCC carcinogenesis. Moreover, we analyzed the association between TNFRSF12A and TME, from the perspective of chemokines. By correlation analysis, we found 5 chemokines were highly associated with TNFRSF12A in HNSCC tissues. What is more, real-time PCR and ELISA verified that TNFRSF12A could regulate CXCL2, CXCL11, and CCL19 expression, highlighting the role of TNFRSF12A in modulating TME.
Following this, the risk model based on CMGs was constructed by the TCGA data set and validated by the GEO data set. The survival analysis showed that patients with low-risk scores tended to have a higher OS rate in both validation and training cohorts. Similar results amongst HNSCC patients of different stages, grades, genders, and ages highlighted the CMS’s accuracy. Moreover, cox regression analysis confirmed the independent prognostic value of CMS, henceforth emphasizing the reliability of our risk model. To further enhance the accuracy of prognostic prediction, a novel nomogram combining clinical characteristics and CMS was constructed, which not only helped to predict the specific survival risk of specific patients but also contributed to individualized treatments for HNSCC patients. Then, pathway enrichment analyses were used to provide additional insights into the downstream pathways distinct in two groups. The GO and GSEA analyses jointly showed that DEGs were related to immune responses. And the KEGG analysis suggested that PI3K–AKT pathway, which has been reported to induce specific immune-inhibitory molecules’ expression (Pardoll, 2012), might be involved in these biological processes.
Preliminary data from trials of ICIs in the treatment of metastatic or recurrent HNSCC led to encouraging results (Ferris et al., 2016; Gillison et al., 2016; Mehra et al., 2018). Nevertheless, with the rapid augment in the utilization of ICIs, immune-related adverse events and the limited response rate for the majority of HNSCC ensued (Lyon et al., 2018; Postow et al., 2018). As a consequence of these results, biomarkers to guide patient selection for immunotherapy are attached to most priority (Bruni et al., 2020), which prompted us to investigate how our risk model would relate to immunotherapy response. Nevertheless, it is not feasible to accurately predict the response probability for ICI immunotherapy based on merely one parameter and without taking other factors into consideration (Havel et al., 2019). This is probably due to the heterogeneity of HNSCC and its TME. Thus, through integrating a series of promising indices in immunotherapy, including IPS, TMB (Samstein et al., 2019), tumor purity (Fridman et al., 2012), immune cell component (Galon et al., 2006), and immune genes (Andrews et al., 2017; Rowshanravan et al., 2018; Wolf et al., 2020), we came to the conclusion that patients with high-risk scores were inclined to acquire miserable therapeutic outcomes of ICI immunotherapy, in accordance to the results of OS.
However, there are some limitations in our study. Firstly, although an earnest endeavor was made to recruit as many HNSCC patients as possible to establish and validate this CMS model, especially considering the relatively low incidence rate of HNSCC compared to other cancers like colon cancer, this study was still a retrospective analysis. Secondly, because of the limited accessibility to acquire paired mRNA expression data from HNSCC samples before and after immunotherapy, the prediction of immunotherapy response based on CMS was estimated indirectly. The accuracy was remained restricted. Future prospective studies based on genome data could depict a more delicate landscape of the CMGs in HNSCC.
Conclusion
This study identified expression pattern and prognostic value of CMGs in HNSCC. TNFRSF12A was found to be a tumor promoter via in vitro experiments. A novel scoring system based on CMGs was established to predict the clinical outcomes of HNSCC patients. It could serve as a biomarker and immunotherapy indicator for doctors to assign individualized therapeutics for patients in future clinical practices.
Data Availability Statement
TCGA gene expression profiles and patients’ clinical data in this study are available at UCSC Xena (https://xena.ucsc.edu/). Gene mutation data could be acquired from TCGA data portal (https://portal.gdc.cancer.gov/). The patients’ IPS values are available in the Cancer Immunome Atlas (https://tcia.at/home). The immunohistochemistry results could be obtained from HPA (https://www.proteinatlas.org/). Part of genome analyses could be obtained from GEPIA (http://gepia2.cancer-pku.cn/), cBioPortal (https://www.cbioportal.org/), and Broad GDAC Firehose (http://gdac.broadinstitute.org/).
Author Contributions
LA performed the bioinformatics analysis, drafted the manuscript, and conducted the experiments. XSo and JY collected the related references and edited the manuscript. JZ, XSu, and LH participated in the discussion. QL, HY, and DW conceived and designed the study. All authors read and approved the final manuscript.
Funding
This work was supported by grants from Shanghai Shenkang Hospital Development Center (SHDC12018118), Clinical Research Plan of Shanghai Shenkang Hospital Development Center (SHDC2020CR2005A), Science and Technology Planning Project of Shanghai (20Y11902000), the Shanghai Municipal Commission of Health and Family Planning (201940143), Shanghai Science and Technology Committee Foundation (19411950600), and the New Technologies of Endoscopic Surgery in Skull Base Tumor: CAMS Innovation Fund for Medical Sciences (2019-I2M-5-003).
Conflict of Interest
The authors declare that the research was conducted in the absence of any commercial or financial relationships that could be construed as a potential conflict of interest.
Publisher’s Note
All claims expressed in this article are solely those of the authors and do not necessarily represent those of their affiliated organizations, or those of the publisher, the editors and the reviewers. Any product that may be evaluated in this article, or claim that may be made by its manufacturer, is not guaranteed or endorsed by the publisher.
Acknowledgments
We appreciate statisticians, mathematicians, and programmers for providing biologists and physicians with such plentiful genome analysis tools.
Supplementary Material
The Supplementary Material for this article can be found online at: https://www.frontiersin.org/articles/10.3389/fcell.2021.695533/full#supplementary-material
Supplementary Figure 1 | Genetic alternations of CMGs in HNSCC.
Supplementary Figure 2 | Estimation of tumor-infiltrating lymphocytes in HNSCC.
Supplementary Figure 3 | Clinical significance of TNFRSF12A and its correlation with chemokine genes. Clinical significance of TNFRSF12A was validated via GEPIA (A) and HPA (B). (C) Representative images of immunohistochemistry of TNFRSF12A in HNSCC tissues via HPA (Scale bar = 200 μm). (D) Volcano plot exhibited correlation between TNFRSF12A and chemokines in HNSCC tissues by Spearman analysis.
Abbreviations
HNSCC, head and neck squamous cell carcinoma; CMGs, costimulatory molecule genes; TCGA, The Cancer Genome Atlas; GEO, Gene Expression Omnibus; CMS, CMGs-based signature; ICIs, immune checkpoint inhibitors; TNF, tumor necrosis factor; TNFSF, TNF ligand superfamily; TNFRSF, TNF receptor superfamily; ROC, receiver operating characteristic; DEGs, differentially expressed genes; GO, Gene ontology; GSEA, gene set enrichment analysis; KEGG, Kyoto Encyclopedia of Genes and Genomes; IPS, immunophenoscore; TMB, tumor mutation burden; shRNA, short-hairpin RNA; CCK-8, cell counting kit-8; NC, negative control; OS, overall survival; HR, hazard ratio; FC, fold change; PCA, principal component analysis; TME, tumor microenvironment; ELISA, enzyme-linked immunosorbent assay; AUC, area under curve; NES, normalized enrichment score.
References
Andrews, L. P., Marciscano, A. E., Drake, C. G., and Vignali, D. A. A. (2017). LAG3 (CD223) as a cancer immunotherapy target. Immunol. Rev. 276, 80–96. doi: 10.1111/imr.12519
Becht, E., Giraldo, N. A., Lacroix, L., Buttard, B., Elarouci, N., Petitprez, F., et al. (2016). Estimating the population abundance of tissue-infiltrating immune and stromal cell populations using gene expression. Genome Biol. 17:218.
Bray, F., Ferlay, J., Soerjomataram, I., Siegel, R. L., Torre, L. A., and Jemal, A. (2018). Global cancer statistics 2018: GLOBOCAN estimates of incidence and mortality worldwide for 36 cancers in 185 countries. CA Cancer J. Clin. 68, 394–424. doi: 10.3322/caac.21492
Bruni, D., Angell, H. K., and Galon, J. (2020). The immune contexture and Immunoscore in cancer prognosis and therapeutic efficacy. Nat. Rev. Cancer 20, 662–680. doi: 10.1038/s41568-020-0285-7
Cerami, E., Gao, J., Dogrusoz, U., Gross, B. E., Sumer, S. O., Aksoy, B. A., et al. (2012). The cBio cancer genomics portal: an open platform for exploring multidimensional cancer genomics data. Cancer Discov. 2, 401–404. doi: 10.1158/2159-8290.CD-12-0095
Chan, T. A., Yarchoan, M., Jaffee, E., Swanton, C., Quezada, S. A., Stenzinger, A., et al. (2019). Development of tumor mutation burden as an immunotherapy biomarker: utility for the oncology clinic. Ann. Oncol. 30, 44–56. doi: 10.1093/annonc/mdy495
Charoentong, P., Finotello, F., Angelova, M., Mayer, C., Efremova, M., Rieder, D., et al. (2017). Pan-cancer immunogenomic analyses reveal genotype-immunophenotype relationships and predictors of response to checkpoint blockade. Cell Rep. 18, 248–262. doi: 10.1016/j.celrep.2016.12.019
Chen, D. S., and Mellman, I. (2017). Elements of cancer immunity and the cancer-immune set point. Nature 541, 321–330. doi: 10.1038/nature21349
Chow, L. Q. M. (2020). Head and neck cancer. New Engl J. Med. 382, 60–72. doi: 10.1056/NEJMra1715715
Cohen, E. E. W., Bell, R. B., Bifulco, C. B., Burtness, B., Gillison, M. L., Harrington, K. J., et al. (2019). The Society for Immunotherapy of Cancer consensus statement on immunotherapy for the treatment of squamous cell carcinoma of the head and neck (HNSCC). J. Immunother. Cancer 7:184. doi: 10.1186/s40425-019-0662-5
Colevas, A. D., Yom, S. S., Pfister, D. G., Spencer, S., Adelstein, D., Adkins, D., et al. (2018). NCCN guidelines insights: head and neck cancers version 1.2018. J Natl. Compr. Canc. Netw. 16, 479–490. doi: 10.6004/jnccn.2018.0026
Croft, M., and Siegel, R. M. (2017). Beyond TNF: TNF superfamily cytokines as targets for the treatment of rheumatic diseases. Nat. Rev. Rheumatol. 13, 217–233. doi: 10.1038/nrrheum.2017.22
Ferris, R. L., Blumenschein, G. R., Fayette, J., Guigay, J., Colevas, A. D., Licitra, L. F., et al. (2016). Further evaluations of nivolumab (nivo) versus investigator’s choice (IC) chemotherapy for recurrent or metastatic (R/M) squamous cell carcinoma of the head and neck (SCCHN): checkmate 141. J. Clin. Oncol. 34(15_suppl), 6009–6009. doi: 10.1200/JCO.2016.34.15_suppl.6009
Finotello, F., Mayer, C., Plattner, C., Laschober, G., Rieder, D., Hackl, H., et al. (2019). Molecular and pharmacological modulators of the tumor immune contexture revealed by deconvolution of RNA-seq data. Genome Med. 11:34. doi: 10.1186/s13073-019-0638-6
Fridman, W. H., Pagès, F., Sautès-Fridman, C., and Galon, J. (2012). The immune contexture in human tumours: impact on clinical outcome. Nat. Rev. Cancer 12, 298–306. doi: 10.1038/nrc3245
Galon, J., Costes, A., Sanchez-Cabo, F., Kirilovsky, A., Mlecnik, B., Lagorce-Pagès, C., et al. (2006). Type, density, and location of immune cells within human colorectal tumors predict clinical outcome. Science (New York, NY) 313, 1960–1964. doi: 10.1126/science.1129139
Gillison, M. L., Blumenschein, G., Fayette, J., Guigay, J., Colevas, A. D., Licitra, L., et al. (2016). Abstract CT099: nivolumab (nivo) vs investigator's choice (IC) for recurrent or metastatic (R/M) head and neck squamous cell carcinoma (HNSCC): CheckMate-141. Cancer Res 76(14 Supplement):CT099. doi: 10.1158/1538-7445.AM2016-CT099
Gupta, B., Johnson, N. W., and Kumar, N. (2016). Global epidemiology of head and neck cancers: a continuing challenge. Oncology 91, 13–23. doi: 10.1159/000446117
Havel, J. J., Chowell, D., and Chan, T. A. (2019). The evolving landscape of biomarkers for checkpoint inhibitor immunotherapy. Nat. Rev. Cancer 19, 133–150. doi: 10.1038/s41568-019-0116-x
Janakiram, M., Chinai, J. M., Zhao, A., Sparano, J. A., and Zang, X. (2015). HHLA2 and TMIGD2: new immunotherapeutic targets of the B7 and CD28 families. Oncoimmunology 4:e1026534. doi: 10.1080/2162402x.2015.1026534
Kanehisa, M., Furumichi, M., Tanabe, M., Sato, Y., and Morishima, K. (2017). KEGG: new perspectives on genomes, pathways, diseases and drugs. Nucleic Acids Res. 45, D353–D361. doi: 10.1093/nar/gkw1092
Kanodia, S., Da Silva, D. M., Karamanukyan, T., Bogaert, L., Fu, Y.-X., and Kast, W. M. (2010). Expression of LIGHT/TNFSF14 combined with vaccination against human papillomavirus Type 16 E7 induces significant tumor regression. Cancer Res. 70, 3955–3964. doi: 10.1158/0008-5472.CAN-09-3773
Lefebvre, J. L. (2005). Current clinical outcomes demand new treatment options for SCCHN. Ann. Oncol. 16 Suppl:6.
Li, T., Fan, J., Wang, B., Traugh, N., Chen, Q., Liu, J. S., et al. (2017). TIMER: a web server for comprehensive analysis of tumor-infiltrating immune cells. Cancer Res. 77, e108–e110. doi: 10.1158/0008-5472.CAN-17-0307
Luke, J. J., Flaherty, K. T., Ribas, A., and Long, G. V. (2017). Targeted agents and immunotherapies: optimizing outcomes in melanoma. Nat. Rev. Clin. Oncol. 14, 463–482. doi: 10.1038/nrclinonc.2017.43
Lyon, A. R., Yousaf, N., Battisti, N. M. L., Moslehi, J., and Larkin, J. (2018). Immune checkpoint inhibitors and cardiovascular toxicity. Lancet Oncol. 19, e447–e458. doi: 10.1016/S1470-2045(18)30457-1
Marur, S., and Forastiere, A. A. (2016). Head and neck squamous cell carcinoma: update on epidemiology, diagnosis, and treatment. Mayo Clin. Proc. 91, 386–396. doi: 10.1016/j.mayocp.2015.12.017
Mayakonda, A., Lin, D.-C., Assenov, Y., Plass, C., and Koeffler, H. P. (2018). Maftools: efficient and comprehensive analysis of somatic variants in cancer. Genome Res. 28, 1747–1756. doi: 10.1101/gr.239244.118
Mehra, R., Seiwert, T. Y., Gupta, S., Weiss, J., Gluck, I., Eder, J. P., et al. (2018). Efficacy and safety of pembrolizumab in recurrent/metastatic head and neck squamous cell carcinoma: pooled analyses after long-term follow-up in KEYNOTE-012. Br. J. Cancer 119, 153–159. doi: 10.1038/s41416-018-0131-9
Nagarsheth, N., Wicha, M. S., and Zou, W. (2017). Chemokines in the cancer microenvironment and their relevance in cancer immunotherapy. Nat. Rev. Immunol. 17, 559–572. doi: 10.1038/nri.2017.49
Newman, A. M., Liu, C. L., Green, M. R., Gentles, A. J., Feng, W., Xu, Y., et al. (2015). Robust enumeration of cell subsets from tissue expression profiles. Nat. Methods 12, 453–457. doi: 10.1038/nmeth.3337
O’Donnell, J. S., Teng, M. W. L., and Smyth, M. J. (2019). Cancer immunoediting and resistance to T cell-based immunotherapy. Nat. Rev. Clin. Oncol. 16, 151–167. doi: 10.1038/s41571-018-0142-8
Pardoll, D. M. (2012). The blockade of immune checkpoints in cancer immunotherapy. Nat. Rev. Cancer 12, 252–264. doi: 10.1038/nrc3239
Postow, M. A., Sidlow, R., and Hellmann, M. D. (2018). Immune-related adverse events associated with immune checkpoint blockade. New Engl. J. Med. 378, 158–168. doi: 10.1056/NEJMra1703481
Racle, J., de Jonge, K., Baumgaertner, P., Speiser, D. E., and Gfeller, D. (2017). Simultaneous enumeration of cancer and immune cell types from bulk tumor gene expression data. Elife 6:e26476. doi: 10.7554/eLife.26476
Ritchie, M. E., Phipson, B., Wu, D., Hu, Y., Law, C. W., Shi, W., et al. (2015). limma powers differential expression analyses for RNA-sequencing and microarray studies. Nucleic Acids Res. 43:e47. doi: 10.1093/nar/gkv007
Rowshanravan, B., Halliday, N., and Sansom, D. M. (2018). CTLA-4: a moving target in immunotherapy. Blood 131, 58–67. doi: 10.1182/blood-2017-06-741033
Samstein, R. M., Lee, C.-H., Shoushtari, A. N., Hellmann, M. D., Shen, R., Janjigian, Y. Y., et al. (2019). Tumor mutational load predicts survival after immunotherapy across multiple cancer types. Nat. Genet. 51, 202–206. doi: 10.1038/s41588-018-0312-8
Shekarian, T., Valsesia-Wittmann, S., Brody, J., Michallet, M. C., Depil, S., Caux, C., et al. (2017). Pattern recognition receptors: immune targets to enhance cancer immunotherapy. Ann. Oncol. 28, 1756–1766. doi: 10.1093/annonc/mdx179
Siegel, R. L., Miller, K. D., and Jemal, A. (2017). Cancer statistics, 2017. CA Cancer J. Clin. 67, 7–30. doi: 10.3322/caac.21387
Sklan, A., and Collingridge, D. (2017). Treating head and neck cancer: for better or for worse? Lancet Oncol. 18, 570–571. doi: 10.1016/S1470-2045(17)30269-3
Song, G., Xu, S., Zhang, H., Wang, Y., Xiao, C., Jiang, T., et al. (2016). TIMP1 is a prognostic marker for the progression and metastasis of colon cancer through FAK-PI3K/AKT and MAPK pathway. J. Exp. Clin. Cancer Res. CR 35:148. doi: 10.1186/s13046-016-0427-7
Subramanian, A., Tamayo, P., Mootha, V. K., Mukherjee, S., Ebert, B. L., Gillette, M. A., et al. (2005). Gene set enrichment analysis: a knowledge-based approach for interpreting genome-wide expression profiles. Proc. Natl. Acad. Sci. U.S.A. 102, 15545–15550. doi: 10.1073/pnas.0506580102
Tamura, H., Dan, K., Tamada, K., Nakamura, K., Shioi, Y., Hyodo, H., et al. (2005). Expression of functional B7-H2 and B7.2 costimulatory molecules and their prognostic implications in de novo acute myeloid leukemia. Clin. Cancer 11, 5708–5717. doi: 10.1158/1078-0432.ccr-04-2672
Tang, Z., Kang, B., Li, C., Chen, T., and Zhang, Z. (2019). GEPIA2: an enhanced web server for large-scale expression profiling and interactive analysis. Nucleic Acids Res. 47, W556–W560. doi: 10.1093/nar/gkz430
Thorsson, V., Gibbs, D. L., Brown, S. D., Wolf, D., Bortone, D. S., Ou Yang, T.-H., et al. (2018). The immune landscape of cancer. Immunity 48, 812–830.e14. doi: 10.1016/j.immuni.2018.03.023
Topalian, S. L., Taube, J. M., Anders, R. A., and Pardoll, D. M. (2016). Mechanism-driven biomarkers to guide immune checkpoint blockade in cancer therapy. Nat. Rev. Cancer 16, 275–287. doi: 10.1038/nrc.2016.36
Uhlén, M., Fagerberg, L., Hallström, B. M., Lindskog, C., Oksvold, P., Mardinoglu, A., et al. (2015). Proteomics. Tissue-based map of the human proteome. Science (New York, NY) 347:1260419. doi: 10.1126/science.1260419
Waldman, A. D., Fritz, J. M., and Lenardo, M. J. (2020). A guide to cancer immunotherapy: from T cell basic science to clinical practice. Nat. Rev. Immunol. 20, 651–668. doi: 10.1038/s41577-020-0306-5
Ward-Kavanagh, L. K., Lin, W. W., Šedı, J. R., and Ware, C. F. (2016). The TNF receptor superfamily in Co-stimulating and Co-inhibitory responses. Immunity 44, 1005–1019. doi: 10.1016/j.immuni.2016.04.019
Wichmann, G., Rosolowski, M., Krohn, K., Kreuz, M., Boehm, A., Reiche, A., et al. (2015). The role of HPV RNA transcription, immune response-related gene expression and disruptive TP53 mutations in diagnostic and prognostic profiling of head and neck cancer. Int. J. Cancer 137, 2846–2857. doi: 10.1002/ijc.29649
Winkles, J. A. (2008). The TWEAK-Fn14 cytokine-receptor axis: discovery, biology and therapeutic targeting. Nat. Rev. Drug Discov. 7, 411–425. doi: 10.1038/nrd2488
Wolf, Y., Anderson, A. C., and Kuchroo, V. K. (2020). TIM3 comes of age as an inhibitory receptor. Nat. Rev. Immunol. 20, 173–185. doi: 10.1038/s41577-019-0224-6
Yoshihara, K., Shahmoradgoli, M., Martínez, E., Vegesna, R., Kim, H., Torres-Garcia, W., et al. (2013). Inferring tumour purity and stromal and immune cell admixture from expression data. Nat. Commun. 4:2612. doi: 10.1038/ncomms3612
Yu, G., Wang, L.-G., Han, Y., and He, Q.-Y. (2012). clusterProfiler: an R package for comparing biological themes among gene clusters. OMICS 16, 284–287. doi: 10.1089/omi.2011.0118
Keywords: immunotherapy, head and neck squamous cell carcinoma, prognosis, risk model, costimulatory molecule, tumor microenvironment
Citation: Aye L, Song X, Yang J, Hu L, Sun X, Zhou J, Liu Q, Yu H and Wang D (2021) Identification of a Costimulatory Molecule Gene Signature to Predict Survival and Immunotherapy Response in Head and Neck Squamous Cell Carcinoma. Front. Cell Dev. Biol. 9:695533. doi: 10.3389/fcell.2021.695533
Received: 15 April 2021; Accepted: 19 July 2021;
Published: 09 August 2021.
Edited by:
Shu-Heng Jiang, Shanghai Cancer Institute, ChinaReviewed by:
Diego A. Pereira-Martins, University of Groningen, NetherlandsStephen B. Keysar, University of Colorado Anschutz Medical Campus, United States
Copyright © 2021 Aye, Song, Yang, Hu, Sun, Zhou, Liu, Yu and Wang. This is an open-access article distributed under the terms of the Creative Commons Attribution License (CC BY). The use, distribution or reproduction in other forums is permitted, provided the original author(s) and the copyright owner(s) are credited and that the original publication in this journal is cited, in accordance with accepted academic practice. No use, distribution or reproduction is permitted which does not comply with these terms.
*Correspondence: Quan Liu, liuqent@163.com; Hongmeng Yu, hongmengyush@fudan.edu.cn; Dehui Wang, wangdehuient@sina.com
†These authors have contributed equally to this work and share first authorship