 Thando Nqasha
 Mulemwa Akombelwa1
94% of researchers rate our articles as excellent or good
Learn more about the work of our research integrity team to safeguard the quality of each article we publish.
Find out more
ORIGINAL RESEARCH article
Front. Built Environ. , 07 January 2025
Sec. Earthquake Engineering
Volume 10 - 2024 | https://doi.org/10.3389/fbuil.2024.1524618
The 2014 Orkney earthquake caused significant damage to unreinforced masonry buildings in the surrounding townships. After the earthquake, field surveys were conducted to assess the extent of damage in the affected areas. This study reviews data collected from the 2014 Orkney earthquake to investigate damage patterns, evaluate building safety for occupancy, and support fragility curve construction. Damage was quantified based on the European Macroseismic Scale (EMS-98) to assess building safety and conduct regression analysis. The results indicate that the collected data is suitable for investigating damage patterns and determining building safety for occupancy. However, it is not suitable for constructing fragility curves. Empirical fragility curves are typically developed using logistic regression, but this study found the data unsuitable for regression analysis due to sampling errors and limited data quantity. This study recommends the use of first-order approximation methods to supplement the dataset, reducing sampling errors and increasing data quantity.
After an earthquake, surveys are carried out to assess the impact and destruction caused by the seismic event. The main purpose of these post-earthquake damage surveys is to ensure the safety of buildings for occupation, but the information gathered is also used for other purposes such as assessing structural vulnerability (Pavic et al., 2019), creating fragility curves (Li and Gardoni, 2023; Biglari and Formisano, 2020), and investigating damage patterns (Valente, 2023; Okada and Takai, 2000). While there are specialized tools available for conducting these studies, they are usually not accessible in regions with less advanced seismic monitoring and analysis systems.
The Orkney area in the North-West Province, South Africa experienced a 5.5 local magnitude (ML) earthquake on 5 August 2014, which was believed to have been caused by mining activities. The tremor was felt as far as Cape Town in South Africa, Maputo in Mozambique, and Gaborone in Botswana (Midzi et al., 2015). It resulted in significant damage to buildings in Orkney and the neighbouring areas of Khuma, Kanana, and Jouberton. Following the earthquake, field assessments were carried out by Midzi et al. (2015) and Khoyratty (2016) to assess the extent of the damage. Over 600 buildings were impacted in the North West province of South Africa, with Khuma Township, near Stilfontein, bearing the brunt of the damage (Midzi et al., 2015). Additionally, the earthquake caused destruction to three clinics and two schools in the North West province and caused considerable damage to low-cost housing (Khoyratty, 2016; Midzi et al., 2015). This study aims to evaluate the collected damage dataset from the Orkney earthquake of 5 August 2014 to determine its suitability for assessing building safety for occupation, developing fragility curves, and investigating damage patterns.
To date, the seismic vulnerability of unreinforced masonry buildings in South Africa is poorly understood. This is due to the lack of historic damage data and the fact that analytical approaches are not suitable for assessing the seismic vulnerability of non-engineering structures such as unreinforced masonry (URM) buildings (Shabani et al., 2021). This assessment will help ascertain the potential utility of historic earthquake damage data for future studies, including the development of fragility curves that could enhance the planning and design of unreinforced masonry buildings in South Africa.
Situated in an intraplate region, South Africa experiences low levels of seismic activity compared to interplate regions. Despite this, the country has a moderate history of seismicity, with nearly 400 seismic events of local magnitudes (ML) equal to or greater than 4 recorded between 1920 and 2022. Most of the earthquakes in South Africa occur at shallow depths ranging from 3 km to 20 km, as noted by Mangongolo et al. (2017). It is important to note that approximately 90% of the seismic events in South Africa are related to mining activities, as highlighted by Uzoegbo and Li (2002), Davies and Kijko (2003), and Du Plessis et al. (2015). Areas that are notably affected by mine-induced seismicity are the deep-level gold mining areas of Orkney, Klerksdorp, and Carletonville in the North West, as well as the gold mining areas around Welkom in the Free State and the iron ore mining areas of the Northern Cape, along with the gold mining areas in Gauteng. The remaining earthquakes are natural geological occurrences stemming from tectonic activity along fault lines, mainly happening in the Western Cape and the northern part of KwaZulu-Natal.
The 1969 Ceres-Tulbagh earthquake, which is the most powerful and destructive earthquake in South Africa in the 20th and 21st centuries, had a local magnitude (ML) of 6.3 on the Richter scale and a maximum felt intensity measure level (IML) of IX on the Modified Mercalli intensity (MMI) scale (Green and Bloch, 1971). It caused an estimated economic damage of $24 million (Terblanche, 2018). Some other significant natural geological earthquakes include the 14 April 1970 Tulbagh earthquakes, the 31 October 2019 earthquake near Port Shepstone, and the 5 November 2022 earthquake 23 km from Umvoti local municipality in KwaZulu-Natal.
While natural geological earthquakes have a higher magnitude, their frequency of occurrence is very low compared to that of induced seismicity. Acid mine water drainage is the cause of mine-related earthquakes. According to Liebenberg et al. (2017), even though mining activities have decreased in the Witwatersrand area, the number of seismic events seems to be increasing, which is attributed to the issue of acid mine drainage. It is possible that the seismic activities in Orkney are caused by the same acid mine drainage phenomena observed in non-operating mining areas as in the Witwatersrand area. A seismic hazard map of South Africa produced by the Council for Geoscience (CGS) shows that gold mining towns such as Orkney, Klerksdorp, Stilfontein, and Carletonville in the North West province, as well as Welkom in the northern Free State, are more susceptible to mine-induced seismic events due to mining activities in these regions. Examples of seismic activities linked to mining activities include the Welkom earthquakes of 8 December 1976 and 26 September 1990 in the Free State province (Durrheim et al., 2006), the 2005 Stilfontein earthquake, the 2014 Orkney earthquake in the Northwest province (Manzunzu et al., 2017; Midzi et al., 2015; Du Plessis et al., 2015; Liebenberg et al., 2017), and the 11 June 2023 Boksburg-Alberton earthquake in Gauteng (Njilo, 2023).
The strongest earthquake in South Africa in the last decade occurred on 5 August 2014 in the Orkney region. At approximately 12:22 p.m. local time, a 5.5 ML earthquake with a focal depth of 5 km struck the Orkney region in the Northwest province of South Africa. The earthquake’s effects were felt up to 600 km away from the epicentre, impacting areas across South Africa and neighbouring countries such as Lesotho, Eswatini (Swaziland), Botswana, and Mozambique (Figure 1). With an intensity of up to VIII near the epicentre according to the European macro-seismic scale (EMS-98) (Figure 1). The earthquake caused damage to over 600 structures in the Northwest province, particularly affecting low-cost unreinforced masonry (URM) buildings in the townships of Khuma, Kanana, and Jourberton. Tragically, the earthquake resulted in the death of one man when a building wall collapsed on him. The earthquake revealed the susceptibility of URM buildings to earthquake damage, emphasizing that they are more at risk of damage compared to well-built buildings situated close to the epicentre, which sustained no damage (Khoyratty, 2016; Midzi et al., 2015). The vulnerability of URM buildings to earthquakes has been recorded worldwide (Debnath et al., 2022; Deneko and Bilgin, 2024; Rosti et al., 2021).
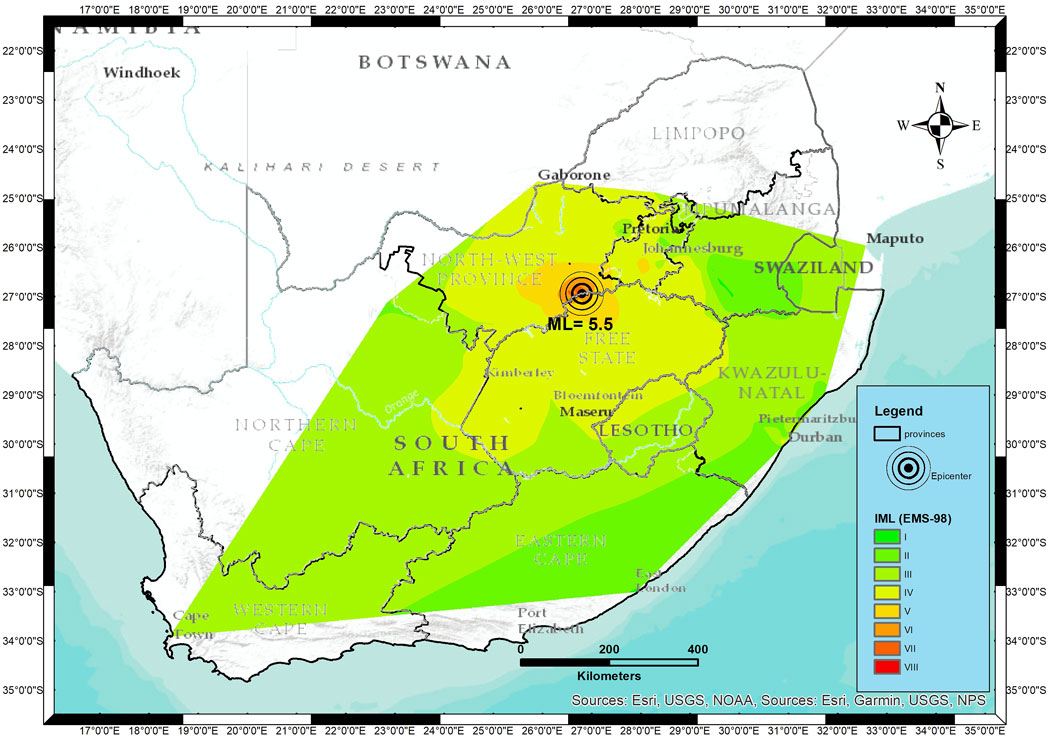
Figure 1. Effect of the 2014 Orkney earthquake according to EMS-98.
Low-cost, URM buildings have been around for a long time and can be found in various regions worldwide, including Latin America, the Himalayas, Africa, Eastern Europe, the Indian subcontinent, and Asia. There is a wide range of low-cost URM buildings across the globe. In South Africa, the predominant low-cost, URM buildings are rectangular in shape, made of 140 mm thick brick walls with wooden-frame doors and windows. These structures are typically constructed by the government for mass housing using inexpensive masonry materials and a simple architectural style. They generally measure about 7 m by 5 m with a base height of 2.5 m, featuring one external door, three interior doors, four exterior windows, and a total of four rooms (Figure 2). The foundation of these buildings extends a meter deep; 925 mm of the foundation is made of gravel filling, while 75 mm is an unreinforced concrete cast sheet with pressure of 10 MPa (Figure 2). These are the most common buildings in the study area, and they were also the ones most severely affected by the 2014 Orkney earthquake.

Figure 2. Structural layout of a common unreinforced masonry building in South Africa, top left) floor plan; top right) side elevation; bottom left) front elevation; and bottom right) cross section of the foundation and roof structure.
These buildings were built from 1998 to 2006, following the building standards outlined in the South African Bureau of standards (1982). These regulations, established in the 1970s, addressed various aspects of construction and safety such as structural design, materials, and building practices but did not include specific provisions for seismic activities. In South Africa, Pule et al. (2015) pointed out that many buildings and structures are at risk from seismic activities due to their inadequate design to withstand even minor seismic events. Most architects, engineers, and builders in the country do not typically prioritize seismic resistance as a fundamental design requirement. Although SABS 1200 continues to serve as the main construction reference in the country, the building standards framework in South Africa has progressed over time, leading to the introduction of newer standards. In 2011, the South African Bureau of standards (2011) 10,160-4, which offers strategies and guidance for designing buildings that may encounter seismic forces, primarily aimed at mitigating significant structural failures and preventing loss of life.
During an earthquake, ground acceleration is the main reason for damage. When an earthquake occurs, the ground shifts in the X, Y, and Z directions and shakes unpredictably along each of these axes. Typically, buildings are engineered to resist vertical forces, so the vertical shaking caused by earthquakes is addressed through safety measures incorporated into the design to withstand vertical loads. The structure’s performance relies on horizontal shaking in the X and Y directions as it creates inertia forces and lateral displacement. Therefore, it is essential to ensure there is a proper load transfer path in place to mitigate any negative impact on the structure.
In the event of an earthquake, the building’s foundation moves in sync with the ground, while the roof initially stays stationary due to the building’s inertia. However, because the walls and columns are linked to the roof, it is pulled along with the foundation. The building’s tendency to remain motionless due to inertia can result in shearing forces that place stress on weak walls or connections, potentially leading to failure or complete collapse (Figure 3). Damage to shear walls and wall connections is one of the most common documented damages to buildings during an earthquake (Kaya et al., 2023; Gallardo et al., 2021; Ma et al., 2021; Vásquez et al., 2021; Kuwano et al., 2014). The inertial forces are a significant factor in seismic activity that negatively impacts the structure. Lastly, greater mass results in higher inertia forces, which is why lighter structures such as shacks handle earthquake tremors more effectively. During the 2014 Orkney earthquake, there were no reported damages to shacks, even though they are very common in the area. The type of shaking is determined by the building’s structure. Lower frequencies pose a greater risk to tall buildings, while higher frequencies are more of a concern for low-rise buildings (Panzera et al., 2018; Jeong and Iwan, 1988). Every building has a specific resonance frequency that is unique to its structure.
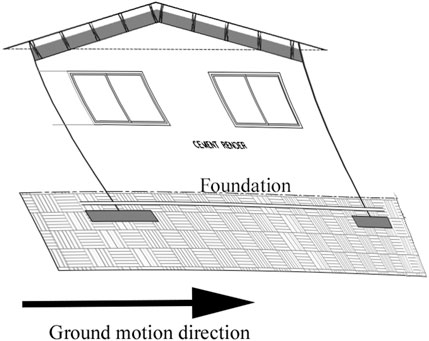
Figure 3. Effect of building inertia during an earthquake.
The materials and design of a building determine its ability to accommodate the displacement difference between its foundation and roof. Some structures use materials that can flex to account for this difference (Kwiecień, 2019; Hazarika et al., 2015), while others are equipped with seismic base isolation systems like seismic dampers to counteract ground movements (Beirami Shahabi et al., 2020; Chouw, 2014; Ghasemi and Talaeitaba, 2020; Sheikh et al., 2022; Wang et al., 2023; Wang, 2002). Base isolation systems are usually used for critical infrastructure such as hospital buildings (Beirami Shahabi et al., 2020; Wang et al., 2023). A well-designed floor slab, walls, columns, and their connections can create an effective path for transferring inertia forces. It is important to note that walls and columns are key in transferring these forces. It is evident that stiff and weak masonry walls can create weak points in the inertia force transfer path, making unreinforced masonry structures highly susceptible to earthquake damage.
During an earthquake, low-rise URM building walls can generally experience either in-plane or out-of-plane forces (Nochebuena-Mora et al., 2023). When the movement is in-plane, shear walls may develop diagonal cracking (Figure 4 left). If these cracks extend to the corners and create a kinematic mechanism, the situation can become critical and lead to failure (Ortega et al., 2018). For out-of-plane motion, the response is similar to the response of during wind loading, tension cracks are observed in form of vertical cracks (Figure 4 right), if the loading is significant, the walls may fall out (Ortega et al., 2018). In areas with scarce resources or old buildings that were constructed prior to the 1970s, the structures are often not designed to withstand the strains caused by earthquakes, leading to the collapse of masonry-style construction and resulting in thousands of fatalities (Işık, 2023; Vlachakis et al., 2020). Unreinforced masonry is considered the most unsuitable type of structure for earthquake-prone regions.
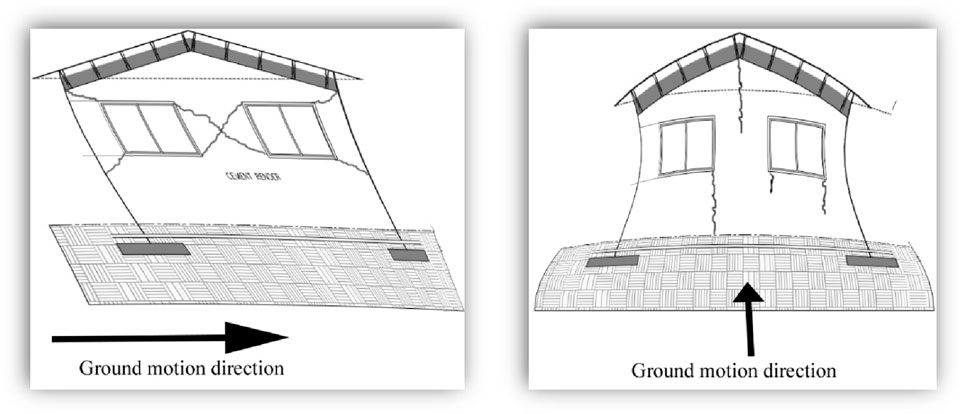
Figure 4. Typical deformation of masonry building walls due to earthquake loading: left) in-plane deformations; and right) Out-of-plane deformations.
Certain features make URM buildings vulnerable to earthquake damage, including poor mortar, weak load and non-load bearing walls, lack of vertical confining elements, poorly supported wall openings, inadequate brick strength, and heavy and stiff structural design. The weight of the roofs and roof beams of these buildings is supported by brick walls (Figure 2). During an earthquake, masonry walls have to transfer the earthquake load from the foundation to the roof. If the load-bearing walls of the building are stiff and weak, then the building will most likely experience damage (Kaya et al., 2023; Ma et al., 2021). This is typically depicted by pushover curves; these curves depict the relationship between base shear and roof displacement in a structure (Figure 5). These curves are instrumental in assessing how a structure responds to seismic forces and evaluating the seismic vulnerability of unreinforced masonry (URM) buildings. Common damage patterns associated with seismic vulnerability include diagonal and vertical cracking (Figures 4, 6) (El-Maissi et al., 2022). Structures exhibiting significant diagonal and vertical cracks are often deemed unsafe for occupancy after an earthquake, as they may continue to deteriorate, posing risks of injury or fatalities to residents (Deneko and Bilgin, 2024; Mahdizadeh, 2009; Yön et al., 2017). This is consistent with damage descriptions in widely used intensity scales such as the European Macroseismic Scale (EMS-98) and the Modified Mercalli Intensity (MMI).
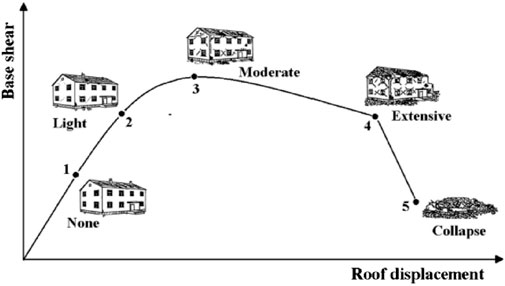
Figure 5. Typical pushover curve of URM buildings (Azizi, 2019).
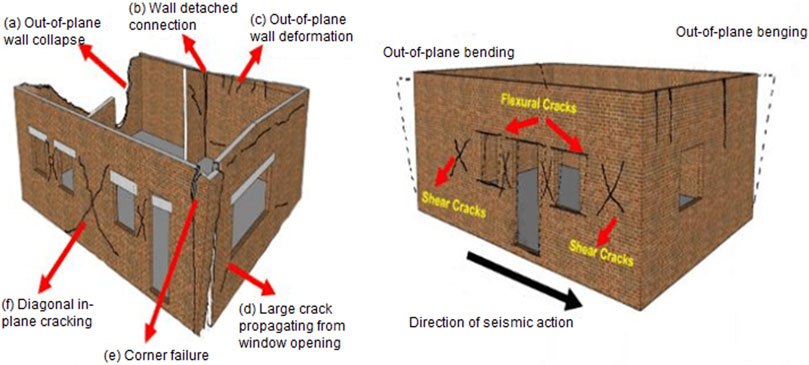
Figure 6. Common URM building failure mechanism (El-Maissi et al., 2022).
Weak binding elements, such as weak mortar, result in an increase in the seismic vulnerability of URM buildings. Weak binding elements can lead to damages such as plaster detachment, weak wall connections, and inadequate connections between walls and window/door frames (Figure 6). According to the EMS-98 and MMI intensity scales, buildings exhibiting these types of damage are typically classified as heavily damaged and require further assessment to determine their safety for occupancy. One of the most notable types of damage during the 1989 Santa Cruz Loma Prieta earthquake was the falling of plaster (Bruneau, 1994). Sorrentino et al. (2019) established that the buildings had inadequate structural connections due to weak mortar, which resulted in more severe damage in these buildings. During the 2010 Darfield earthquake in New Zealand, significant damage in URM buildings was caused by the shearing of the bearing elements (Ingham and Griffith, 2010). During the 2014 Orkney earthquake, Khoyratty (2016) reported that the lack of confining elements worsened the damage in URM buildings.
Poorly unsupported wall openings such as windows and doors present unavoidable weak points, and that is where most of the damage starts to occur (Figures 4, 6). Doğangün et al. (2008) noticed a pattern of damage in URM buildings in Turkey caused by earthquakes between 1992 and 2004. Most of the damages were cracks propagating from structural openings such aswindows and doors. When the actual stresses in bricks exceed their design strength, then these brick units become weak points of the structure and may fail when subject to earthquake loading.
Low-cost URM buildings are vulnerable to earthquake damage; even minor earthquakes can damage them (Shabani et al., 2021). In North America, Bruneau (1994) established that old URM buildings suffered considerable damage from minor to moderate earthquakes. In central Italy, Sorrentino et al. (2019) reported that most URM buildings had severe damage from minor to moderate shaking after the 2016 earthquake.
The ground acceleration is typically greater closer to the epicentre, and the impact decreases as the distance increases. Therefore, the greatest amount of damage is anticipated near the epicentre. Nonetheless, it is important to consider that other factors like directivity effects, geological formations, and soil type can influence ground motion.
Fragility curves specifically outline the likelihood of reaching or surpassing a particular damage state index (DSI) at a defined intensity measure level (IML). Fragility curves can be developed using three methods: analytical methods, empirical methods, and hybrid approaches, as noted by Shabani et al. (2021). The analytical method involves utilizing precise structural parameters and seismic hazard or simulation tools to create fragility curves. Several studies, including those by Ahmad et al. (2011), Domaneschi et al. (2021), Marasco et al. (2021), Sansoni (2021), and Singh et al. (2013) have successfully employed this method. It is especially useful when there is no available damage data from previous earthquakes, but it does require seismic hazard calculation tools or well-established ground motion models (GMMs) for accurate hazard estimation. Additionally, creating analytical fragility curves is a time-consuming process that demands substantial computational resources and it is not suitable for non-engineered structures such as URM buildings (Ahmad et al., 2011; Kassem et al., 2020; Roy and Choudhury, 2021; Shabani et al., 2021). Empirical methods use the relationship between seismic intensity and the resulting damage. This method analyses the damage caused by previous earthquakes to establish vulnerability through fragility curves (Biglari and Formisano, 2020). The hybrid approach includes calibrating fragility curves from the empirical method with the curves from analytical methods (Kassem et al., 2020; Roy and Choudhury, 2021; Shabani et al., 2021; Yepes-Estrada et al., 2017).
The analytical method and hybrid approach both require calculating or simulating seismic hazard in the studied area and using ground motion models (GMMs). South Africa currently lacks well-established GMMs due to the lack of historical ground motion data. In contrast, the empirical method can be utilized in underdeveloped regions without advanced technologies for earthquake simulation and established GMMs. This method is especially suitable for non-engineering structures constructed with materials of uncertain strength, making it difficult to calculate their earthquake resistance, such as URM structures.
Following an earthquake, field surveys are conducted to determine the effects of the earthquake and the damage it caused. This data is essential in determining the vulnerability of structures, understanding earthquake damage patterns; determining safety of the buildings for occupation and constructing fragility curves. Rapid surveys, remotely sensed surveys, in-depth engineering surveys, and reconnaissance team surveys are the four primary survey techniques used for post-earthquake damage assessment. Surveys for a quick evaluation of a building’s usability are known as rapid surveys. These surveys are appropriate for all kinds of buildings and produce sizable sample sizes, but they are regarded as less reliable due to their significant errors (Lulić et al., 2021). Remotely sensed surveys are done through the use of data such as aerial imagery to assess damage. This technique yields a large sample size and is generally appropriate for all types of buildings; however, it is limited to capturing damage that is distinct and visible in the imagery (Stone et al., 2018). Reconnaissance team surveys and detailed engineering surveys are reliable, detailed, and suitable for any kind of building. These surveys typically yield small sample sizes, though they can yield large ones as well, depending on the availability of resources (Rossetto et al., 2014).
The study employs quantitative methods and utilizes secondary data sourced from post-field assessment surveys and literature from the 2014 Orkney earthquake. This data includes completed damage survey questionnaires, which provided detailed descriptions of the damage; photographs offering a visual representation of the damage; and the coordinates of the investigated buildings, supplying spatial information about their locations. The decision to use secondary data was primarily driven by project budget limitations. Additionally, considering that the earthquake occurred in 2014, it is likely that most of the affected buildings had already undergone repairs, potentially distorting the accuracy of any damage data collected. This study will characterize and review the damage observed after the earthquake to determine if it is suitable for determining damage patterns, and building safety for occupation, suitability for constructing the fragility curves.
Following the 2014 Orkney earthquake, a team of Land Surveying students from University of the KwaZulu-Natal carried out field assessments after the earthquake to investigate the damage impact on low-cost URM buildings in the townships in close proximity to the epicentre. The students had a background in surveying and mapping, and they were additionally trained by structural engineers on what to observe while conducting the surveys. The assessment was conducted by team reconnaissance surveys. As explained in Section 1.5, this approach is considered to be quite reliable and provides comprehensive damage data. However, it demands a significant investment of time and resources, and in cases of limited resources, it might lead to a small sample size. The team, comprising of five members, had a timeframe of just 3 days to assess more than 3,000 ha of land containing over 75,000 buildings. Due to time and resource limitations, it was impossible to survey every single building within the area. Consequently, the survey focused solely on buildings that were identified as damaged in the municipal database.
Prior to the field assessment, the survey team consulted structural engineers from the University of KwaZulu-Natal to prepare a questionnaire for assessing post-earthquake damage. The survey was conducted within 25 km from the epicenter, where there was a highest concentration of damaged buildings. The field survey specifically targeted buildings that were reported in the municipal database as damaged. During the field survey, for each building, the address, 2D coordinates (latitude and longitude) of the buildings were captured, description of damage and pictures of damage were captured. A total of 61 buildings were surveyed over a period of 3 days.
The captured pictures of damage were used to study the damage patterns. This was achieved by observing and documenting the common earthquake damages, as discussed in Section 1.3, for all the damaged buildings. The questionnaires that were used to capture details about the damage and pictures were used to quantify the damage. Earthquake damage in URM buildings can be quantified using various scales. The most commonly used scales are the MMI scale and EMS-98 (Borg et al., 2010; Grünthal and Musson, 2020). In this study the European macro-seismic damage scale (EMS-98) damage scale was used (Table 1). Full description of EMS-98 damage scale for unreinforced masonry buildings is highlighted by Borg et al. (2010).
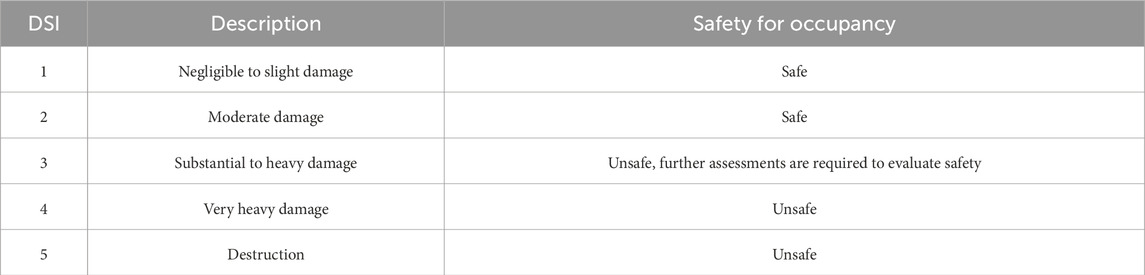
Table 1. Classification of damage to unreinforced masonry buildings according to EMS-98 damage scale.
The measured damage was used for determine building safety for occupancy, this is to ensure that the buildings will not experience further damage which might be hazardous to occupants. According to EMS-98 damage scale buildings with DS 1 to 2 have negligible to moderate strcurural damage and are considered safe for occupation. Buildings with DS 3 have heavy structural damage but are not considered safe for occupation without further assessments. Buildings with DS4 to 5 have heavy to very heavy structural damage to total destruction and are considered not safe for occupation.
The measure damage was also used to determine relationship between IML and the DSI. Fragility curves depends on the statistical relationship between seismic intensity and observed damage and the number of buildings reaching or exceeding damage state (DSI) for a given IML. The quantified damage data was prepared for fragility curve construction by creating binary responses. Buildings with damage equal to or exceeding the DSI were assigned a value of 1, while those with less damage than DSI were assigned a value of 0. This data is utilized to construct fragility curves through logistic regression, a statistical technique used to analyze the relationship between two variables. This relationship is then employed to predict the probability of reaching or exceeding a DSI on a scale from 0 to 1 (Ioannou et al., 2012; Kiani et al., 2019; LaValley, 2008; Miano et al., 2020). A minimum of 100 data points is recommended for reliable fragility curve construction, with these points distributed across all IML values. This ensures the reliability of the fragility curve and justifies the significance of the observed trend (Ioannou et al., 2012; Rossetto et al., 2014; Miano et al., 2020). The construction of fragility curves also depends on the quality and quantity of data (Rossetto et al., 2014), this study will review the data collected after the 2014 Orkney earthquake in South Africa to determine if it can be used for constructing fragility curves of URM buildngs by reviewing the requirements for fragility curve construction such the relationship between the seismic hazard (IML) and the observed damage (DSI); minimum number of data points; distribution of data points and number of buildings reaching or exceeding DSI.
After these questionnaires that were used to capture details about the damage and images were analysed, the most observed types of damages captured following the 2014 Orkney earthquake included, diagonal cracks (Figures 7, 8), horizontal cracks (Figure 9), vertical cracks (Figure 10), cracks at window/ door frames and cracks between the walls and the roof (Figures 7–10). The most observed type of damage were damages between the roof and walls. Some of the buildings were un-plastered and some were plastered; most of the damages were observed in unplastered buildings.
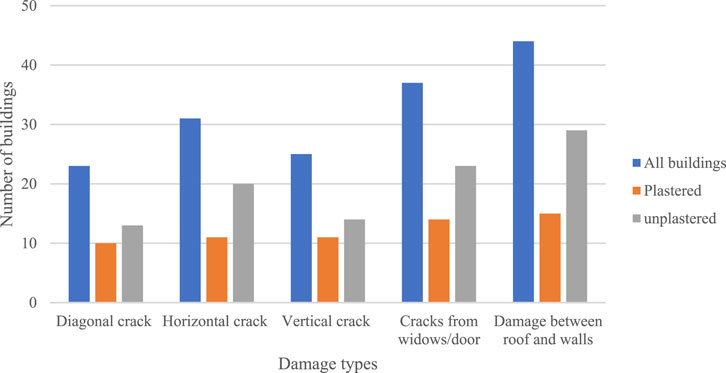
Figure 7. Common observed damages after the 2014 Orkney earthquake.
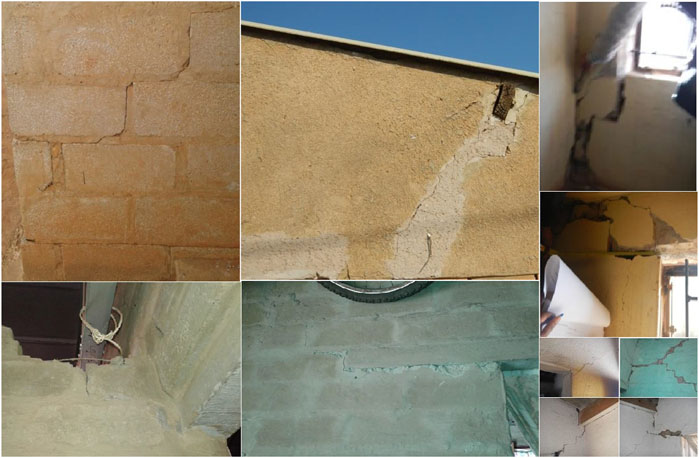
Figure 8. Diagonal cracks observed in low-cost URM buildings after the 2014 Orkney earthquake.
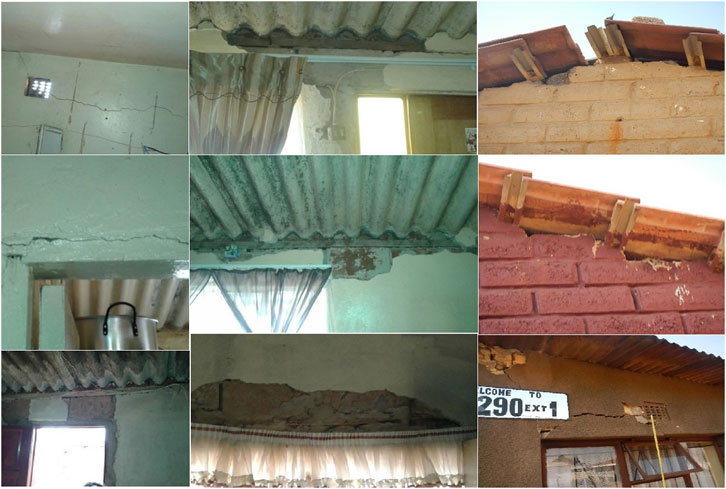
Figure 9. Horizontal cracks observed in low-cost URM buildings after the 2014 Orkney earthquake.
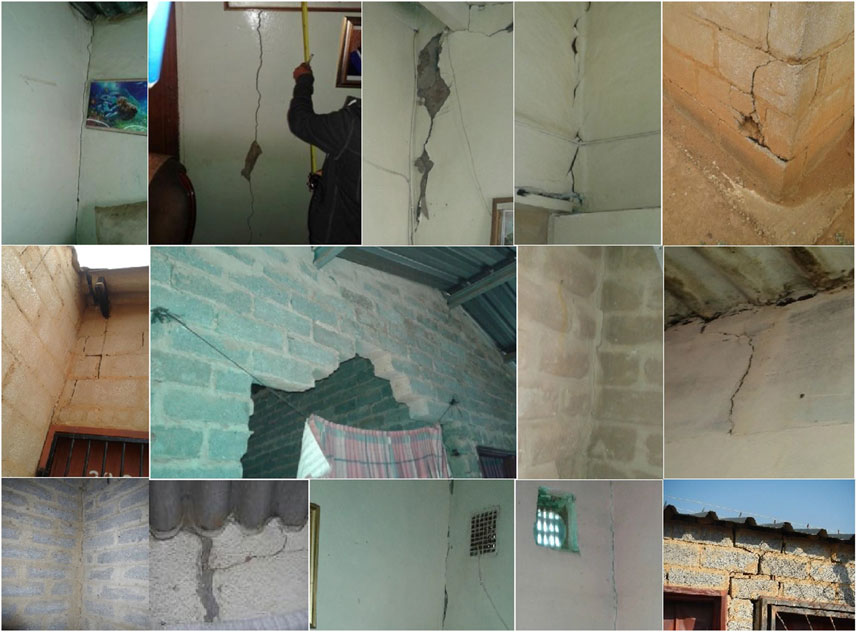
Figure 10. Vertical cracks observed in low-cost URM buildings after the 2014 Orkney earthquake.
The observed damages were measured using the EMS-98 damage scale. After the damage was assigned using the EMS damage scale, the majority of buildings had a damage state index (DSI) of 2, while the maximum damage had a DSI of 5 (Figure 11). As stated in Chapter 2, buildings with DSI of 1 and 2 are considered safe for occupation; hence, a total of 44 buildings are safe for occupation while 12 buildings would need further investigation and a total of 5 buildings are considered unsafe for occupation.
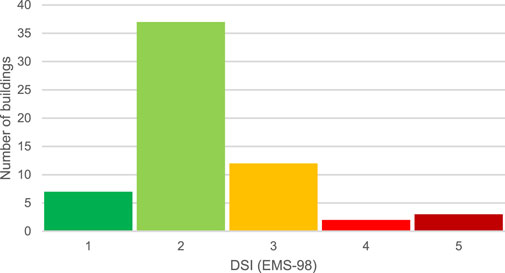
Figure 11. Distribution of damaged buildings according to damage state index.
Figure 12 outlines the epicentre and damaged buildings; from this figure the damaged buildings were located in 3 townships namely; Khuma, Kanana and Jourberton. The Khuma township is closest to the epicentre. As discussed in Section 1, buildings in this township suffered the most damage and 3 buildings that experienced total damage were located in this township. All the damaged buildings were within 25 km from the epicentre (Figure 13). Overall, the relationship between DSI and epicentral distance is indirectly proportional; the increase in epicentral distance results in lower DSI. This trend is also exaggerated because it excludes buildings with a DSI of 0, which significantly reduces the reliability and validity of the trendline. As shown in Figure 12, numerous other buildings with similar typology in the three townships were not reported as damaged, there are other types of structures, highlighted with a white shade, that are closer to the epicentre that had no reported damage.

Figure 12. The propagation direction of an earthquake from the epicentre to the damaged buildings in the townships surrounding Orkney.
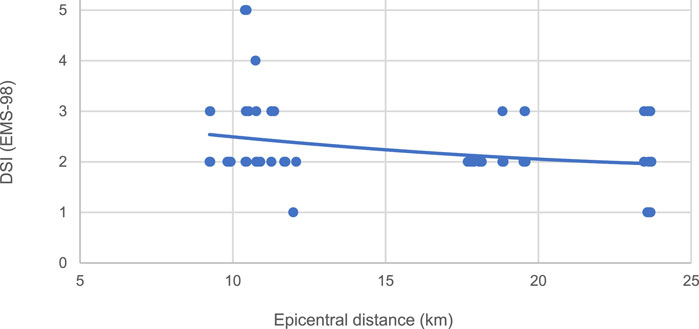
Figure 13. Effects of epicentral distance level on damage state index.
The IML ranged between V and VIII within 25 km from the epicentre, where VIII is observed closest to the epicentre and dissipates with increasing distance from the epicentre, and VI is observed further from the epicentre (Figure 14). The distribution of IML and DSI is plotted in Figures 14, 15 to gain understanding of seismic shaking on observed damage in URM buildings. Buildings that had higher IML experienced significantly higher damage; all the buildings that collapsed (DSI = 5) had an IML range of VII-VIII (Figures 14, 15). Overall increases in IML results is an increase in DSI. However, similar to Figure 13, this trend does not account for buildings that were not damaged, which significantly reduces the reliability and validity of the trendline.
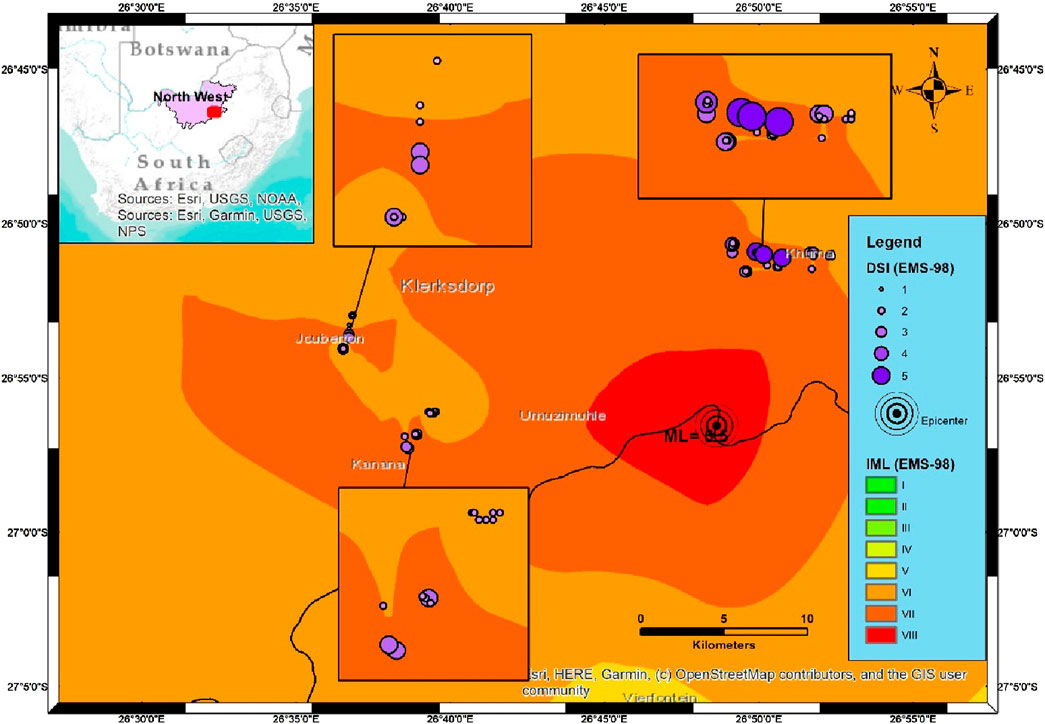
Figure 14. Spatial representation of damage and intensity measure level.

Figure 15. Graphical representation of IML and DSI.
As detailed in the methodology section, constructing fragility curves requires a minimum of 100 data points distributed across all IML values, a relationship between DSI and IML, and the number of buildings reaching or exceeding a specific damage state for a given IML. The data used for constructing the fragility curves included 61 damaged buildings, which were not evenly distributed across all IML values (Table 2). According to Table 2, most damaged buildings had a DSI of 2 and an IML of VI. Figure 16A illustrates the relationship between IML and mean DSI, showing that an increase in IML resulted in a corresponding increase in mean DSI. A strong correlation between these two variables is evident, as indicated by the high R-squared value. However, the weighted mean damage is significantly inflated because the data used did not include buildings that were not damaged. Including data for undamaged buildings, which would all have a DSI of 0, would have significantly reduced the weighted mean damage. Figure 16B, derived from Table 2, shows the cumulative number of damaged buildings reaching or exceeding each DSI. The figure indicates higher numbers of buildings reaching a DSI for most IML values; for instance, all buildings reached or exceeded DSI 1. This is because the data does not include buildings with a DSI of 0, which might result in an inflated probability of exceedance. Figures 16A, B were used in the construction of fragility curves.
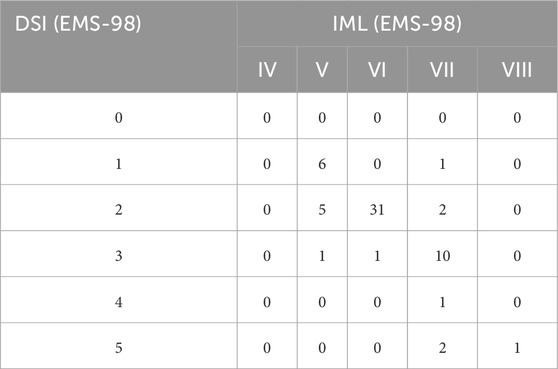
Table 2. Damaged buildings arranged according to DSI and IML.
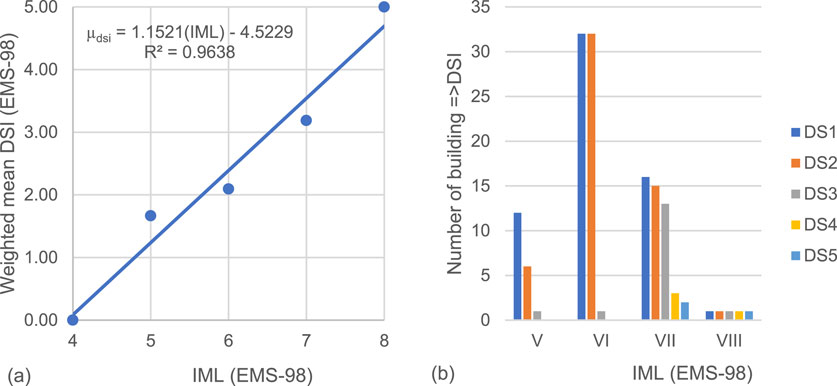
Figure 16. (A) Weighted mean DSI per IML (B) Accumulative of number of buildings reaching or exceeding DSI for all IML.
The effect of the weighted mean per IML, combined with the exclusion of buildings with a DSI of 0, resulted in significantly higher probabilities of exceedance (Figure 17). The probability of exceedance increased with increasing IML for all DSI levels. According to Figure 17, the probability of reaching or exceeding DS1 reaches 1 at IML 5, indicating that all buildings with an IML of 5 will have at least DS1. Similarly, the probability of reaching or exceeding DS2 reaches 1 at IML 7. Maximum probabilities are observed at IML 8 for all DSI levels, suggesting that all buildings experiencing seismic shaking at IML 8 will undergo total collapse. However, this can be cross-verified with Figures 12, 14. These figures show numerous buildings with an IML of 7 that were not reported as damaged. According to the generated fragility curves, these buildings should have at least DS2, indicating that the fragility curves are unreliable and invalid. This highlights the importance of including all buildings in the study area, including undamaged ones, for constructing reliable fragility curves.
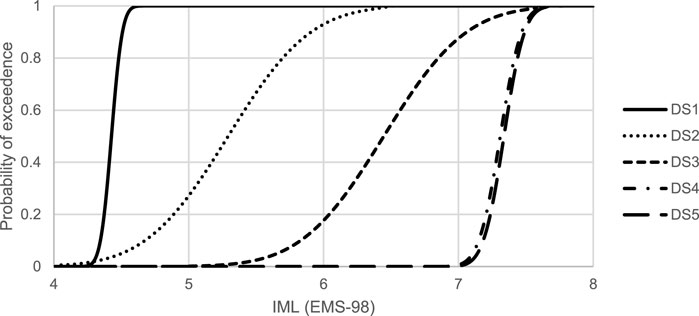
Figure 17. Constructed fragility curves of URM buildings in South Africa using the data collected after the 2014 Orkney earthquake.
This study reviewed the damage observed after the 2014 Orkney earthquake in South Africa to determine if it is suitable for determining damage patterns, and building safety for occupation, suitability for constructing the fragility curves.
The results indicate that the data is suitable for investigating damage patterns. The data used in this study was collected using team reconnaissance surveys. As explained in Section 1.5, this approach is considered to be quite reliable and provides detailed damage data. Hence it was detailed enough to investigate damage patterns. The main types of damage observed in the buildings include diagonal, horizontal, and vertical cracks, as well as cracks at window and door frames, and between walls and the roof. Horizontal, vertical, and diagonal cracks are common forms of earthquake damage worldwide, and these types of cracks can lead to structural collapse (Kaya et al., 2023; Gallardo et al., 2021; Ma et al., 2021; Vásquez et al., 2021; Kuwano et al., 2014). Horizontal and diagonal cracks typically result from in-plane responses to seismic forces, while vertical cracks stem from out-of-plane responses (Ortega et al., 2018). The most commonly observed damages were cracks between walls and roofs, and around window and door frames, indicating weak connections between building elements (Bruneau, 1994; Sorrentino et al., 2019).
A primary use of post-earthquake damage data is to determine building safety for occupancy. The determination of building safety after an earthquake depends on the type of post-earthquake survey method (Kalantoni et al., 2013; Kassaras et al., 2015; Marshall et al., 2013). The damage data captured after the 2014 Orkney earthquake was detailed enough to accurately determine the damage state index (DSI) of each building using EMS-98. This was then used to assess building usability post-earthquake. Therefore, this data was suitable for determining building safety for occupation.
Earthquake damage data can be combined with seismic hazard data to construct fragility curves for the affected buildings (Rossetto et al., 2014). The reliability of these fragility curves is heavily influenced by the quality and quantity of the damage and intensity data, which in turn depend on the survey method. Therefore, the accuracy of fragility curves relies on the chosen survey method. For fragility curves to be reliable, they require an accurate depiction of the relationship between damage and intensity.
While the available data shows a relationship between seismic hazard and damage, this relationship may be exaggerated because the data does not include undamaged buildings. Including undamaged buildings in the dataset would provide a more realistic representation of this relationship (Biglari and Formisano, 2020; Cabrera et al., 2024; Nqasha et al., 2024; Rosti et al., 2021). Constructing fragility curves requires comprehensive damage data from the entire study area or sample, covering both damaged and undamaged buildings, with a minimum sample size of 100 buildings (Rossetto et al., 2014). Although the survey provided detailed, high-quality observations, it only included damaged buildings and did not account for undamaged buildings, leading to a sampling error known as exclusion bias. Additionally, the dataset contains only 61 data points, making it unsuitable for fragility curve construction in its current form.
Post-earthquake data has a variety of applications, such as determining the safety of buildings for occupation, assessing structural vulnerability, creating fragility curves, and investigating damage patterns. This data is especially useful with regions that are prone to seismic activities but have less advanced seismic monitoring and analysis systems, such as South Africa. While South Africa is situated in an intraplate region, it has a moderate history of seismicity. Most of the earthquakes in South Africa are related to mining activities, as highlighted by the 2014 Orkney earthquake. Following the 2014 Orkney earthquake, post-earthquake field surveys were conducted to determine the damage in URM buildings within 25 km from the epicenter. This study evaluated the collected damage dataset from the Orkney earthquake of 5 August 2014 to determine its suitability for assessing building safety for occupation, developing fragility curves, and investigating damage patterns. The results indicated that the study was detailed enough to be able to use for damage pattern investigation; noted damages included diagonal, horizontal, and vertical cracks, as well as cracks at window and door frames and between walls and the roof. The data was detailed enough to be used for determining building safety for occupancy. This is because the survey method employed during the post-earthquake surveys was reconnaissance team surveys; this survey method yields reliable and detailed damage data.
The data was not suitable for constructing fragility curves, primarily due to sampling errors and the limited number of data points. While reconnaissance team surveys are effective for collecting reliable and detailed damage information, they often result in smaller sample sizes, which reduce the overall quantity of collected data. In this case, the post-earthquake field surveys included only damaged buildings, resulting in a dataset of just 61 structures. This small sample size led to inflated mean damage values, which in turn produced significantly higher and invalid fragility curves.
To address these limitations, this study recommends that post-earthquake damage surveys include all buildings in the study or sample area, regardless of whether they sustained damage. While the current dataset is not suitable for fragility curve construction due to the issues mentioned, it can be supplemented using techniques such as first-order approximations. Such methods can expand the dataset by accounting for undamaged buildings, thereby reducing sampling bias.
Furthermore, the fragility curves developed with supplemented data can be validated by comparing them with fragility curves from other studies. For cases where historical damage data is unavailable or incomplete, analytical methods can be used as an alternative approach to construct fragility curves. These analytically derived curves can then serve as benchmarks to calibrate fragility curves developed using first-order approximations, ensuring greater reliability and accuracy. When constructed successfully these fragility curves will be essential for planning and the design of URM buildings developments in South Africa.
The data analyzed in this study is subject to the following licenses/restrictions: Datasets may be provided upon request and with approval from the University of KwaZulu-Natal. Requests to access these datasets should be directed to Thando Nqasha: bnFhc2hhdEB1a3puLmFjLnph.
TN: Conceptualization, Data curation, Formal Analysis, Funding acquisition, Investigation, Methodology, Project administration, Resources, Software, Validation, Visualization, Writing–original draft, Writing–review and editing. MA: Supervision, Writing–review and editing. MS: Supervision, Validation, Writing–review and editing. AK: Supervision, Writing–review and editing.
The author(s) declare that no financial support was received for the research, authorship, and/or publication of this article.
The authors declare that the research was conducted in the absence of any commercial or financial relationships that could be construed as a potential conflict of interest.
The author(s) declare that no Generative AI was used in the creation of this manuscript.
All claims expressed in this article are solely those of the authors and do not necessarily represent those of their affiliated organizations, or those of the publisher, the editors and the reviewers. Any product that may be evaluated in this article, or claim that may be made by its manufacturer, is not guaranteed or endorsed by the publisher.
Ahmad, N., Crowley, H., and Pinho, R. (2011). Analytical fragility functions for reinforced concrete and masonry buildings and buildings aggregates of Euro-Mediterranean regions—UPAV methodology. Dep. Struct. Mech. Univ. Pavia. WP3-Task 3.
Azizi, H. (2019). Irregular masonry buildings, torsional effects and the N2-method - histructural. SAHC. Available at: https://blog.msc-sahc.org/irregular-masonry-buildings-torsional-effects-and-the-n2-method/ (Accessed December 02, 2024).
Beirami Shahabi, A., Zamani Ahari, G., and Barghian, M. (2020). Base isolation systems–A state of the art review according to their mechanism. J. Rehabilitation Civ. Eng. 8 (2), 37–61.
Biglari, M., and Formisano, A. (2020). Damage probability matrices and empirical fragility curves from damage data on masonry buildings after Sarpol-e-zahab and bam earthquakes of Iran. Front. built Environ. 6, 2. doi:10.3389/fbuil.2020.00002
Borg, R. P., Indirli, M., Rossetto, T., and Kouris, L. A. (2010). “L’Aquila earthquake April 6th, 2009: the damage assessment methodologies,” in Proc. COST action C26 “urban habitat constructions under catastrophic events”, final conference, 16–18.
Bruneau, M. (1994). State-of-the-art report on seismic performance of unreinforced masonry buildings. J. Struct. Eng. 120, 230–251. doi:10.1061/(asce)0733-9445(1994)120:1(230)
Cabrera, T., Hube, M. A., María, H. S., Silva, V., Martins, L., Yepes-Estrada, C., et al. (2024). Empirical fragility curves for houses in Chile using damage data from two earthquakes. Bull. Earthq. Eng. 22 (11), 5619–5638. doi:10.1007/s10518-024-01933-w
Chouw, N. (2014). “Low-damage earthquake-resistant structures achieved through movability and ductility,” in Construction materials and structures (Johannesburg, South Africa: IOS Press), 27–34.
Davies, N., and Kijko, A. (2003). Seismic risk assessment: with an application to the South African insurance industry. South Afr. Actuar. J. 3, 1–28. doi:10.4314/saaj.v3i1.24494
Debnath, P., Halder, L., and Dutta, S. C. (2022). Damage survey and seismic vulnerability assessment of unreinforced masonry structures in low-intensity Ambasa earthquake of northeast India. Structures 44, 372–388. doi:10.1016/j.istruc.2022.08.005
Deneko, E., and Bilgin, H., 2024. Observed failure modes in existing URM buildings after November 26, 2019 earthquake in Albania.
Doğangün, A., Ural, A., and Livaoğlu, R. (2008) “Seısmıc performance of masonry buıldıngs durıng recent earthquakes in Turkey,” in 14th world conference on earthquake engineering (14WCEE). Beijing.
Domaneschi, M., Noori, A. Z., Pietropinto, M. V., and Cimellaro, G. P. (2021). Seismic vulnerability assessment of existing school buildings. Comput. and Struct. 248, 106522. doi:10.1016/j.compstruc.2021.106522
Du Plessis, I., Liebenberg, K., Smit, A., Coetzee, S., and Kijko, A. (2015). Preliminary investigation into the cause of acid mine water induced seismicity in Johannesburg. South Afr. J. Geomatics 4, 299–308. doi:10.4314/sajg.v4i3.10
Durrheim, R. J., Anderson, R. L., Cichowicz, A., Ebrahim-Trolloped, R., Hubert, G., Kijko, A., et al. (2006) “The risks to miners, mines, and the public posed by large seismic events in the gold mining districts of South Africa,” in Proceedings of the third international seminar on deep and high stress mining. Quebec City, Canada: Université Laval. 2-4 October.
El-Maissi, A. M., Kassem, M. M., Tan, C. G., Fikri, R., and Nazri, F. M. (2022). Damage index seismic assessment methodologies of URM buildings: a state-of-the-art review. Eng. J. 26 (1), 39–53. doi:10.4186/ej.2022.26.1.39
Gallardo, J. A., de la Llera, J. C., Santa María, H., and Chacon, M. F. (2021). Damage and sensitivity analysis of a reinforced concrete wall building during the 2010, Chile earthquake. Eng. Struct. 240, 112093. doi:10.1016/j.engstruct.2021.112093
Ghasemi, M., and Talaeitaba, S. B. (2020). On the effect of seismic base isolation on seismic design requirements of RC structures. Structures 28, 2244–2259. doi:10.1016/j.istruc.2020.09.063
Green, R., and Bloch, S. (1971). The Ceres, South Africa, earthquake of September 29, 1969: I. Report on some aftershocks. Bull. Seismol. Soc. Am. 61, 851–859. doi:10.1785/bssa0610040851
Grünthal, G., and Musson, R. M. (2020). Earthquakes, intensity. Encycl. Solid Earth Geophys., 1–7. doi:10.1007/978-3-030-10475-7_23-1
Hazarika, H., Pradhan, K. H., Fukumoto, Y., Yasufuku, N., Ishikura, R., and Hirayu, N. (2015). “Protection of seawall against earthquake and tsunami using flexible material,” in Computer methods and recent advances in geomechanics: proceedings of the 14th international conference of international association for computer methods and recent advances in geomechanics, 2014 (IACMAG 2014) (Fukuoka, Japan: Taylor and Francis Books Ltd.), 1897–1902.
Ingham, J., and Griffith, M. (2010). Performance of unreinforced masonry buildings during the 2010 Darfield (Christchurch, NZ) earthquake. Aust. J. Struct. Eng. 11, 207–224. doi:10.1080/13287982.2010.11465067
Ioannou, I., Rossetto, T., and Grant, D. N. (2012). “Use of regression analysis for the construction of empirical fragility curves,” in Proceedings of the 15th world conference on earthquake engineering.
Işık, E. (2023). Structural failures of adobe buildings during the February 2023 Kahramanmaraş (Türkiye) earthquakes. Appl. Sci. 13 (15), 8937. doi:10.3390/app13158937
Jeong, G. D., and Iwan, W. D. (1988). The effect of earthquake duration on the damage of structures. Earthq. Eng. and Struct. Dyn. 16 (8), 1201–1211. doi:10.1002/eqe.4290160808
Kalantoni, D., Pomonis, A., Kassaras, I., Kouskouna, V., Pavlou, K., Vassilopoulou, S., et al. (2013). “Vulnerability assessment in Lefkada old town (W. Greece) with the use of EMS-98; comparison with the 14-8-2003, Mw= 6.2, earthquake effects. First results,” in Proceedings of Vienna congress on recent advances in earthquake engineering and structural dynamics VEESD 2013. Editors C. Adam, R. Heuer, W. Lenhardt, and C. Schranz, 28–30.
Kassaras, I., Kalantoni, D., Pomonis, A., Kouskouna, V., Karababa, F., and Makropoulos, K. (2015). Development of seismic damage scenarios in Lefkada old town (W. Greece): part I—vulnerability assessment of local constructions with the use of EMS-98. Bull. Earthq. Eng. 13, 799–825. doi:10.1007/s10518-014-9643-8
Kassem, M. M., Nazri, F. M., and Farsangi, E. N. (2020). The seismic vulnerability assessment methodologies: a state-of-the-art review. Ain Shams Eng. J. 11 (4), 849–864. doi:10.1016/j.asej.2020.04.001
Kaya, A., Adanur, S., Bello, R. A., Genç, A. F., Okur, F. Y., Sunca, F., et al. (2023). Post-earthquake damage assessments of unreinforced masonry (URM) buildings by shake table test and numerical visualization. Eng. Fail. Anal. 143, 106858. doi:10.1016/j.engfailanal.2022.106858
Khoyratty, Z. (2016). Seismic vulnerability investigation of RDP homes in the city of Matlosana, North West province, South Africa. Master of science. Durban, South Africa: University of KwaZulu-Natal.
Kiani, J., Camp, C., and Pezeshk, S. (2019). On the application of machine learning techniques to derive seismic fragility curves. Comput. and Struct. 218, 108–122. doi:10.1016/j.compstruc.2019.03.004
Kuwano, J., Miyata, Y., and Koseki, J. (2014). Performance of reinforced soil walls during the 2011 Tohoku earthquake. Geosynth. Int. 21 (3), 179–196. doi:10.1680/gein.14.00008
Kwiecień, A. (2019). Reduction of stress concentration by polymer flexible joints in seismic protection of masonry infill walls in RC frames. In IOP Conference Series: materials Science and Engineering. IOP Publ. 474 (1), 012003. doi:10.1088/1757-899x/474/1/012003
LaValley, M. P. (2008). Logistic regression. Circulation 117 (18), 2395–2399. doi:10.1161/circulationaha.106.682658
Li, S. Q., and Gardoni, P. (2023). Empirical seismic vulnerability models for building clusters considering hybrid intensity measures. J. Build. Eng. 68, 106130. doi:10.1016/j.jobe.2023.106130
Liebenberg, K., Smit, A., Coetzee, S., and Kijko, A. (2017). A GIS approach to seismic risk assessment with an application to mining-related seismicity in Johannesburg, South Africa. Acta Geophys. 65, 645–657. doi:10.1007/s11600-017-0052-7
Lulić, L., Ožić, K., Kišiček, T., Hafner, I., and Stepinac, M. (2021). Post-earthquake damage assessment—case study of the educational building after the zagreb earthquake. Sustainability 13, 6353. doi:10.3390/su13116353
Ma, P., Xin, R., and Yao, J. (2021). Assessment of failure mode and seismic performance of damaged masonry structures retrofitted with grout-injected ferrocement overlay reinforcement (GFOR). Constr. Build. Mater. 305, 124778. doi:10.1016/j.conbuildmat.2021.124778
Mangongolo, A., Strasser, F. O., Saunders, I., and Rathod, G. W. (2017). Depths of earthquakes in South Africa. Seismol. Res. Lett. 88, 1078–1088. doi:10.1785/0220170046
Manzunzu, B., Midzi, V., Mangongolo, A., and Essrich, F. (2017). The aftershock sequence of the 5 August 2014 Orkney earthquake (ML 5.5), South Africa. J. Seismol. 21, 1323–1334. doi:10.1007/s10950-017-9667-z
Marasco, S., Noori, A. Z., Domaneschi, M., and Cimellaro, G. P. (2021). A computational framework for large-scale seismic simulations of residential building stock. Eng. Struct. 244, 112690. doi:10.1016/j.engstruct.2021.112690
Marshall, J. D., Jaiswal, K., Gould, N., Turner, F., Lizundia, B., and Barnes, J. C. (2013). Post-earthquake building safety inspection: lessons from the Canterbury, New Zealand, earthquakes. Earthq. Spectra 29 (3), 1091–1107. doi:10.1193/1.4000151
Miano, A., Jalayer, F., Forte, G., and Santo, A. (2020). Empirical fragility assessment using conditional GMPE-based ground shaking fields: application to damage data for 2016 Amatrice Earthquake. Bull. Earthq. Eng. 18 (15), 6629–6659. doi:10.1007/s10518-020-00945-6
Midzi, V., Zulu, B. S., Manzunzu, B. M., Mulabisana, T., Pule, T., Myendeki, S., et al. (2015). Macroseismic survey of the ML5. 5, 2014 Orkney earthquake. J. Seismol. 19, 741–751. doi:10.1007/s10950-015-9491-2
Njilo, N. (2023). Gauteng residents jolted by strongest quake in years. Dly. Maverick 11 June. Available at: https://www.dailymaverick.co.za/article/2023-06-11-strong-earthquake-jolts-gauteng/#:∼:text=The%20earthquake%20occurred%20around%202.38,National%20Seismograph%20Network%20 (Accessed: July 07, 2024).
Nochebuena-Mora, E., Mendes, N., Calixto, V., and Oliveira, S. (2023). Explicit method in the seismic assessment of unreinforced masonry buildings through plane stress elements. Appl. Sci. 13 (19), 10602. doi:10.3390/app131910602
Nqasha, T., Khoyratty, Z., Akombelwa, M., Singh, M., and Kijko, A. (2024). First-order approximation towards empirical seismic vulnerability assessment of low-cost unreinforced masonry buildings in South Africa. Geomatics, Nat. Hazards Risk 15 (1), 2300837. doi:10.1080/19475705.2023.2300837
Okada, S., and Takai, N. (2000) “Classifications of structural types and damage patterns of buildings for earthquake field investigation,” in Proceedings of the 12th world conference on earthquake engineering, 30. Auckland, New Zealand.
Ortega, J., Vasconcelos, G., Rodrigues, H., and Correia, M. (2018). Assessment of the influence of horizontal diaphragms on the seismic performance of vernacular buildings. Bull. Earthq. Eng. 16, 3871–3904. doi:10.1007/s10518-018-0318-8
Panzera, F., Lombardo, G., Imposa, S., Grassi, S., Gresta, S., Catalano, S., et al. (2018). Correlation between earthquake damage and seismic site effects: the study case of Lentini and Carlentini, Italy. Eng. Geol. 240, 149–162. doi:10.1016/j.enggeo.2018.04.014
Pavic, G., Bulajic, B., and Hadzima-Nyarko, M. (2019). The vulnerability of buildings from the osijek database. Front. Built Environ. 5, 66. doi:10.3389/fbuil.2019.00066
Pule, T., Fourie, C., Kijko, A., and Midzi, V. (2015). Comparison and quantitative study of vulnerability/damage curves in South Africa. South Afr. J. Geol. 118, 335–354. doi:10.2113/gssajg.118.4.335
Rossetto, T., Ioannou, I., Grant, D. N., and Maqsood, T., (2014). Guidelines for the empirical vulnerability assessment.
Rosti, A., Rota, M., and Penna, A. (2021). Empirical fragility curves for Italian URM buildings. Bull. Earthq. Eng. 19, 3057–3076. doi:10.1007/s10518-020-00845-9
Roy, N. S., and Choudhury, S. (2021). “Seismic vulnerability assessment methods: a review,” in International conference on advances in structural mechanics and applications (Cham: Springer International Publishing), 282–300.
Sansoni, C. (2021). Seismic vulnerability assessment of exiting URM structures through a simplified analytical method. Rome, Italy: Sapienza University of Rome.
Shabani, A., Kioumarsi, M., and Zucconi, M. (2021). State of the art of simplified analytical methods for seismic vulnerability assessment of unreinforced masonry buildings. Eng. Struct. 239, 112280. doi:10.1016/j.engstruct.2021.112280
Sheikh, H., Van Engelen, N. C., and Ruparathna, R. (2022). A review of base isolation systems with adaptive characteristics. Structures 38, 1542–1555. doi:10.1016/j.istruc.2022.02.067
Singh, Y., Lang, D. H., Prasad, J. S. R., and Deoliya, R. (2013). An analytical study on the seismic vulnerability of masonry buildings in India. J. Earthq. Eng. 17 (3), 399–422. doi:10.1080/13632469.2012.746210
Sorrentino, L., Cattari, S., Da Porto, F., Magenes, G., and Penna, A. (2019). Seismic behaviour of ordinary masonry buildings during the 2016 central Italy earthquakes. Bull. Earthq. Eng. 17, 5583–5607. doi:10.1007/s10518-018-0370-4
South African Bureau of standards (1982). SABS 1200, Specifications for Civil engineering construction. 1st ed. Pretoria: SABS Standards Division.
South African Bureau of standards (2011). SABS 10160-4, Seismic actions and general requirements for buildings. 4th ed. Pretoria: SABS Standards Division.
Stone, H., Putrino, V., and D'Ayala, D. (2018). Earthquake damage data collection using omnidirectional imagery. Front. Built Environ. 4, 51. doi:10.3389/fbuil.2018.00051
Terblanche, M. (2018). The earthquake of 29 september 1969 in Tulbagh. South Africa. Stellenbosch: Stellenbosch University.
Uzoegbo, H., and Li, K. (2002) Mine induced seismic events and its effect on nearby settlements in South Africa, 5, 01–16. Retrieved on.
Valente, M. (2023). Earthquake response and damage patterns assessment of two historical masonry churches with bell tower. Eng. Fail. Anal. 151, 107418. doi:10.1016/j.engfailanal.2023.107418
Vásquez, J. A., Jünemann, R., de la Llera, J. C., Hube, M. A., and Chacón, M. F. (2021). Three-dimensional nonlinear response history analyses for earthquake damage assessment: a reinforced concrete wall building case study. Earthq. Spectra 37 (1), 235–261. doi:10.1177/8755293020944180
Vlachakis, G., Vlachaki, E., and Lourenço, P. B. (2020). Learning from failure: damage and failure of masonry structures, after the 2017 Lesvos earthquake (Greece). Eng. Fail. Anal. 117, 104803. doi:10.1016/j.engfailanal.2020.104803
Wang, B., Chen, P., Zhu, S., and Dai, K. (2023). Seismic performance of buildings with novel self-centering base isolation system for earthquake resilience. Earthq. Eng. and Struct. Dyn. 52 (5), 1360–1380. doi:10.1002/eqe.3820
Wang, Y. P. (2002) “Fundamentals of seismic base isolation,” in International training programs for seismic design of building structures hosted by National Certer of Research on Earthquake Engineering. Taiwan.
Yepes-Estrada, C., Silva, V., Valcárcel, J., Acevedo, A. B., Tarque, N., Hube, M. A., et al. (2017). Modeling the residential building inventory in South America for seismic risk assessment. Earthq. spectra 33 (1), 299–322. doi:10.1193/101915eqs155dp
Keywords: seismic vulnerability assessment, 2014 Orkney earthquake, earthquake damage, unreinforced masonry buildings, fragility curves, South Africa
Citation: Nqasha T, Akombelwa M, Singh M and Kijko A (2025) Review and characterization of the 2014 Orkney damage datasets for damage pattern mapping and fragility curve construction. Front. Built Environ. 10:1524618. doi: 10.3389/fbuil.2024.1524618
Received: 07 November 2024; Accepted: 16 December 2024;
Published: 07 January 2025.
Edited by:
Kenji Fujii, Chiba Institute of Technology, JapanReviewed by:
David Koren, University of Ljubljana, SloveniaCopyright © 2025 Nqasha, Akombelwa, Singh and Kijko. This is an open-access article distributed under the terms of the Creative Commons Attribution License (CC BY). The use, distribution or reproduction in other forums is permitted, provided the original author(s) and the copyright owner(s) are credited and that the original publication in this journal is cited, in accordance with accepted academic practice. No use, distribution or reproduction is permitted which does not comply with these terms.
*Correspondence: Thando Nqasha, bnFhc2hhdGhhbmRvQGdtYWlsLmNvbQ==
Disclaimer: All claims expressed in this article are solely those of the authors and do not necessarily represent those of their affiliated organizations, or those of the publisher, the editors and the reviewers. Any product that may be evaluated in this article or claim that may be made by its manufacturer is not guaranteed or endorsed by the publisher.
Research integrity at Frontiers
Learn more about the work of our research integrity team to safeguard the quality of each article we publish.