- 1Department of Civil Engineering, Covenant University, Ota, Nigeria
- 2Department of Building Engineering, Energy Systems and Sustainability Science, Faculty of Engineering and Sustainable Development, University of Gävle, Gävle, Sweden
- 3Escuela Professional de Ingenieria Cvil, Universidad Cesar Vallejo, SJL, Peru
- 4Department of Information Technology, Birjand University of Medical Sciences, Birjand, Iran
- 5Azad University-Birjand Branch, Birjand, Iran
- 6Department of Civil and Environmental Engineering, Incheon National University, Incheon, Republic of Korea
- 7Incheon Disaster Prevention Research Center, Incheon National University, Incheon, Republic of Korea
Soft computing techniques have become popular for solving complex engineering problems and developing models for evaluating structural material properties. There are limitations to the available methods, including semi-empirical equations, such as overestimating or underestimating outputs, and, more importantly, they do not provide predictive mathematical equations. Using gene expression programming (GEP) and artificial neural networks (ANNs), this study proposes models for estimating recycled aggregate concrete (RAC) properties. An experimental database compiled from parallel studies, and a large amount of literature was used to develop the models. For compressive strength prediction, GEP yielded a coefficient of determination (R2) value of 0.95, while ANN achieved an R2 value of 0.93, demonstrating high reliability. The proposed predictive models are both simple and robust, enhancing the accuracy of RAC property estimation and offering a valuable tool for sustainable construction.
1 Introduction
1.1 Background
Our society is currently grappling with the challenge of sustainable development. To address this, the United Nations introduced the sustainable development goals (SDGs), aimed at driving significant progress in the efficient use of natural resources and tackling related global issues.
For instance, some natural resources (such as limestone, clay, shale, magnesite [used in chalk production], sand, bauxite, and iron ore) are not optimally utilized in cement production. As such, it has become a key challenge for sustainable development because cement production is the third largest source of man-made carbon dioxide emissions globally (Awoyera, 2018; Belaïd, 2022; Zhai et al., 2023).
Although the demand for such natural resources is growing, the supply is limited. Both the expense and the environmental effect of transportation and consumption rise when these resources are used. As a society, the aim is to mitigate the negative impact of the construction industry on the environment. Concrete is known to be one of the most used materials in the construction industry and a natural target for the conservation of resources (Ezema, 2019).
Timber, concrete rubble, sand, bricks, metals, cardboard, paper, and plastics are typical types of construction and demolition (C&D) wastes. Concrete rubbles highly dominate C&D waste. Once C&D waste has been processed by removing debris, it can be graded and utilized as a partial replacement of conventional aggregates.
Contrasting natural aggregate (NA) and recycled concrete aggregate (RCA), research shows that mortar adheres to NA more than it does to RCA. This results in higher water absorption, higher porosity, lower density, and lower wear resistance in RCA. These characteristics culminate in negative effects on concrete prepared with RCA, such as a decrease in modulus of elasticity and compressive strength of RAC compared to natural aggregate concrete (NAC). As such, the use of RCA to replace NA in structural concrete is limited to a maximum of 20% by regulations, such as EHE-08 (López-Uceda et al., 2016; Babalola et al., 2020).
In design applications, predicting the mechanical properties of concrete is a critical task. An accurate model for predicting the mechanical properties can efficiently generate the necessary design data, saving time and money in developing alternative structural component designs (Wang, Xia, Wang, et al., 2023; Wang, Xia, Chen, et al., 2023). However, because of the aforementioned differences in the attributes of RAC and NAC, models developed for predicting the mechanical properties of NAC will generally not be reliable and accurate for predicting the mechanical properties of RAC (Behnood et al., 2015). Various studies have been carried out to tackle this problem on different machine learning models such as M5 model trees, ICA-XGBoost models, gray theory, multiple nonlinear regressions, GeneXpro models, and artificial neural network (ANN) (Alipour et al., 2014; Behnood et al., 2015; Mansouri et al., 2018; Farzampour et al., 2019; Liu et al., 2021; Shrivastava and Shrivastava, 2023). Although many of these studies achieved satisfactory accuracy, none of them were designed to predict compressive strength, split tensile strength, modulus of elasticity, and flexural strength of RAC, while not only considering the effect of recycled coarse aggregate but that of recycled fine aggregate as well.
The main interest of this research is to explore which of the two soft computing techniques, ANN and GeneXproTools 5.0, would accurately predict the mechanical properties of concrete in which (coarse and fine) RCA is used. Unlike conventional concrete, with common materials and properties, RAC incorporates numerous constituents that modify its performance. Thus, ANN and GEP were considered in this study as they are popular for data modeling. However, they have not been fully utilized for recycled concrete. This research adopted a robust database of several experimental studies. The study includes parametric studies and the development of predictive models for estimating the mechanical properties of RAC. Moreover, it compared the performance of the two models and recommended the most suitable model for RAC.
This study is novel as it adopted two cutting-edge soft computing approaches to forecast the mechanical properties of RAC. Moreover, the study incorporated both types of recycled aggregates into a thorough predictive model, in contrast to earlier studies that concentrated on recycled coarse or fine aggregates independently. The research aims to solve the shortcomings of existing models, which frequently fail to precisely predict the features of RAC due to its unique composition, by leveraging a solid database from various experimental experiments. This development is essential to improving the performance and utilization of recycled materials in concrete, which will increase its sustainability.
1.2 Previous models for strength prediction of RAC
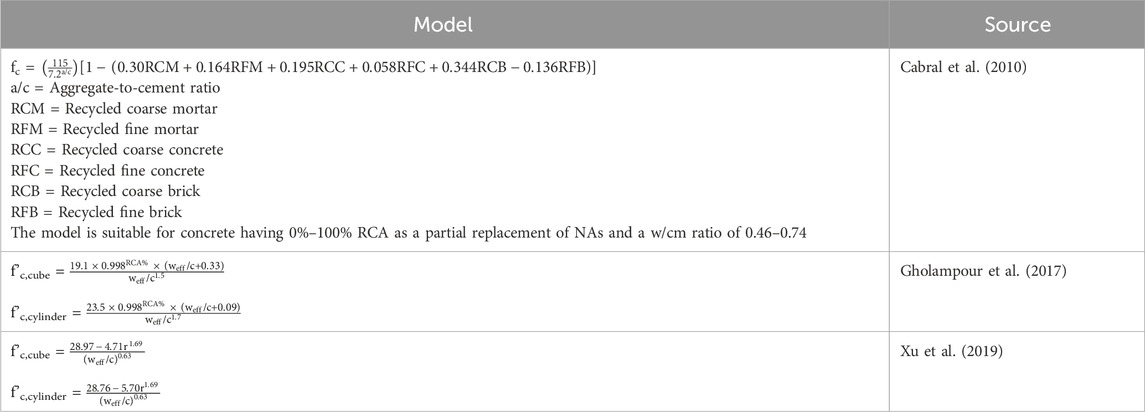
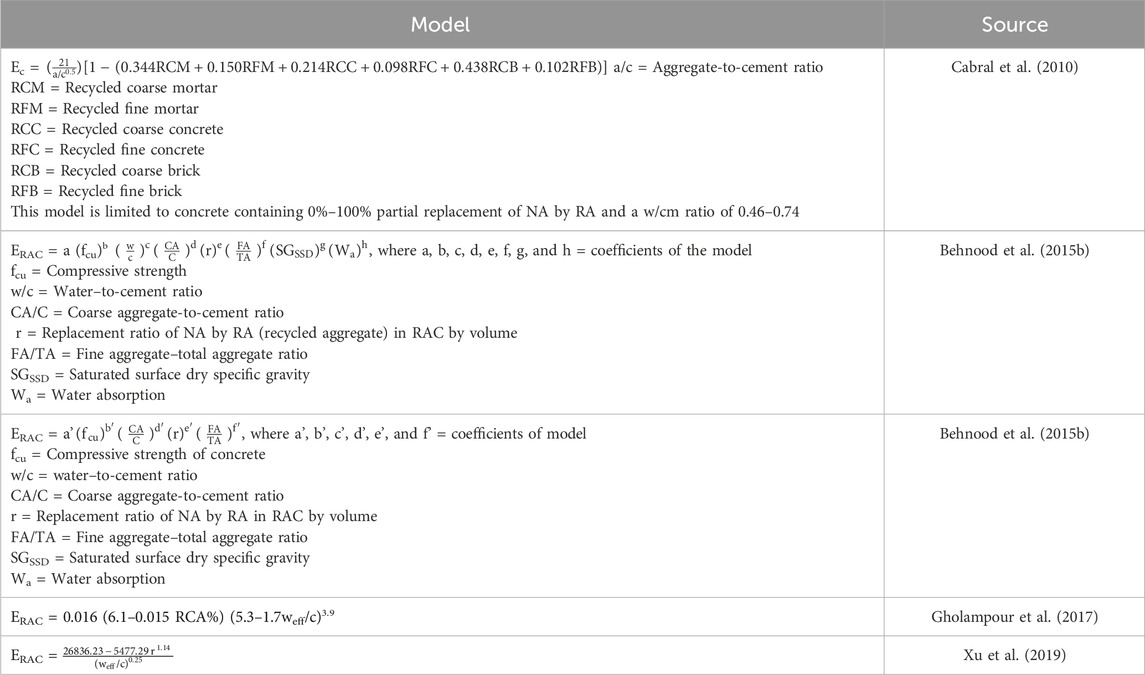
Over the years, models have been proposed for solving or estimating the RAC performance and eventually help manage cost and ensure safety on the field (Wang et al., 2024). Tables 1–4 list equations derived from existing models gleaned from various studies in the literature.
However, the model’s development for estimating the properties of RAC (constructed from RCAs from various suppliers) has at least two key challenges:
- Whether the model can perform like an expert system, that is, it should be able to accurately understand the relationships between the factors that alter the RAC performance. These factors include the water-to-cement ratio, cement content, cement type, aggregate-to-cement ratio, and aggregate size distribution.
- Whether optimal combination of RCA properties should be considered for the model’s development so that it can predict several forms of RCA.
Several attempts have been made to estimate the mechanical properties of RAC precisely based on the prior works, as reviewed above, to contribute to sustainable development. Despite numerous advancements in applying machine learning to concrete, it is still very relevant to further explore the machine learning training models and their challenges to accurately estimate strength characteristics and modulus of elasticity simultaneously while also considering the recycled aggregate effects. Hence, based on the available review, this work is unique in achieving sustainability and cost-effectiveness in using RAC.
2 Methodology
This section contains the extensive dataset used to prepare the models employed in this article. The research analyzes the effects of factors on the RAC performance, comprising the volume of aggregates (fine and coarse portions), water-to-cement ratio, water content, aggregate-to-cement ratio, cement content, and RCA.
Fine aggregates are typically made of sand or crushed stone with particle sizes less than 5 mm. In contrast, coarse aggregates are made up of larger particles, usually gravel or crushed stone, with sizes ranging from 5 mm to 20 mm or more. The volume of aggregates significantly impacts the concrete properties, including strength, durability, and workability.
The water-to-cement ratio is an important factor in the concrete mix design. It is the mass ratio of water to cementitious materials (cement and pozzolans) in a concrete mix. This ratio considerably influences the workability, strength, and durability of concrete. A lower water-to-cement ratio generally increases the strength and durability, but it can also affect the workability of the mix. In this study, the used water-to-cement ratio ranged from 0.34 to 0.7.
Controlling the water content in concrete is critical to achieving the desired workability and strength of concrete.
The aggregate-to-cement ratio is another important consideration in the concrete mix design. It is the volume of aggregates divided by the volume of cementitious materials in the mix. This ratio influences the strength, durability, and cost-effectiveness of the concrete mix. A higher aggregate-to-cement ratio usually results in lower strength, but it can improve the workability and decrease costs. The aggregate-to-cement ratio adopted in this study ranged from 3.5 to 5.0.
Cement content refers to the amount of cementitious materials (typically Portland cement) used in a concrete mix. Cement is the adhesive that holds aggregates together in concrete. The cement content influences the concrete strength, durability, and shrinkage properties. A higher cement content generally results in greater strength but also increases the costs and environmental impact. Finally, RCA is produced by crushing waste concrete to replace NAs in concrete mixtures. Using RCA in concrete mixes can help reduce the demand for natural resources, landfill waste, and the environmental impact of concrete production. However, the properties of RCA can vary depending on factors such as the original concrete composition, crushing process, and contamination, all of which can have an impact on the performance of the final concrete mix. More details about the dataset are presented in Table 5.
Thus, it is possible to make a comparison on the model accuracy. In this study, output parameters are the mechanical properties of concrete, such as the compressive strength, split tensile strength, modulus of elasticity, and flexural strength. The models employed in this article are based on ANN and GEP. This section enumerates the steps to analyze the collected data and develop the models.
The performance of the predicted model and test data were assessed according to the studies by Citakoglu (2021); Uncuoglu et al. (2022); and Bayram and Çıtakoğlu (2022), using mean absolute percentage error (MAPE), root mean square error (RMSE), coefficient of determination (R2), relative root mean square error (RRMSE), Nash–Sutcliffe efficiency (NSE), and Kling–Gupta efficiency (KGE).
2.1 Model dataset
This study obtained a rich dataset from the published literature containing information about the compressive strength, split tensile strength, modulus of elasticity, and flexural strength of RAC to train and test two machine learning models. The data comprised 56 inputs gathered from the open literature (Gholampour et al., 2017; Zhou and Chen, 2017; Sridhar et al., 2023; Duan et al., 2018). The input parameters were w/cm ratio, cement content, NA content (fine and coarse), water, and RCA (fine and coarse constituents). As in typical models, the dataset was divided into training, validation, and testing datasets. The training dataset was utilized to build and train the model, and the testing dataset was used to assess its performance. To avoid overfitting, the validating dataset was employed to determine model generality and to stop training when the error increases (ben Chaabene et al., 2020; Bartlett et al., 2023). The dataset was split into training (70%), validation (15%), and testing (15%) sets. We used k-fold cross-validation to ensure model robustness, with k set to 10. This method improves the reliability of the results by ensuring that each data point is used for validation at least once.
2.2 Data pre-processing
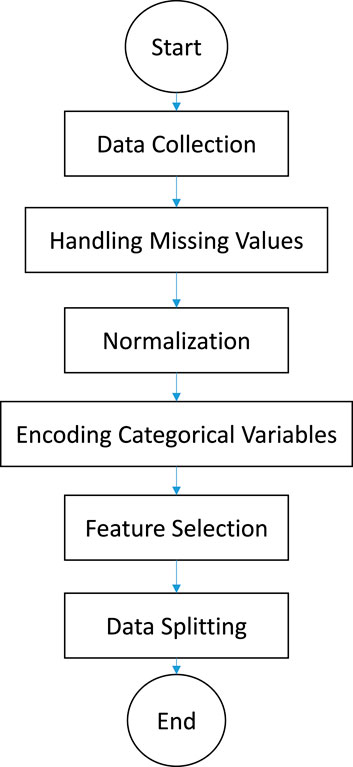
Data pre-processing is a crucial step to ensure the quality and reliability of the input data before they are fed into the predictive models. The steps taken during the pre-processing phase, as shown in Figure 1, are as follows:
1. Data collection: The dataset was compiled from experimental studies and literature sources. The dataset includes input parameters such as the type and proportion of recycled aggregates, mix proportions, and curing conditions.
2. Handling missing values: Missing values were addressed using multiple methods. For numerical data, missing values were imputed utilizing the mean of the available data. However, the most frequent category was employed for the categorical data.
3. Normalization: All numerical input parameters were normalized to a standard range (typically 0–1) using min–max normalization. This step ensures that all input features contribute equally to the model training process and prevents any single feature from dominating the predictions due to scale differences.
4. Encoding categorical variables: Categorical variables were encoded utilizing one-hot encoding. This method creates binary columns for each category, ensuring the model can interpret these variables correctly without assuming any ordinal relationship.
5. Feature selection: Feature selection was performed to identify the most relevant input parameters for the models. Correlation analysis and feature importance scores from preliminary models were used to select the final set of input features.
6. Data splitting: The dataset was split into training (70%), validation (15%), and testing (15%) sets. This division ensures that the models are trained on diverse data, validated during the training process, and tested on unseen data to evaluate their performance.
2.3 ANN
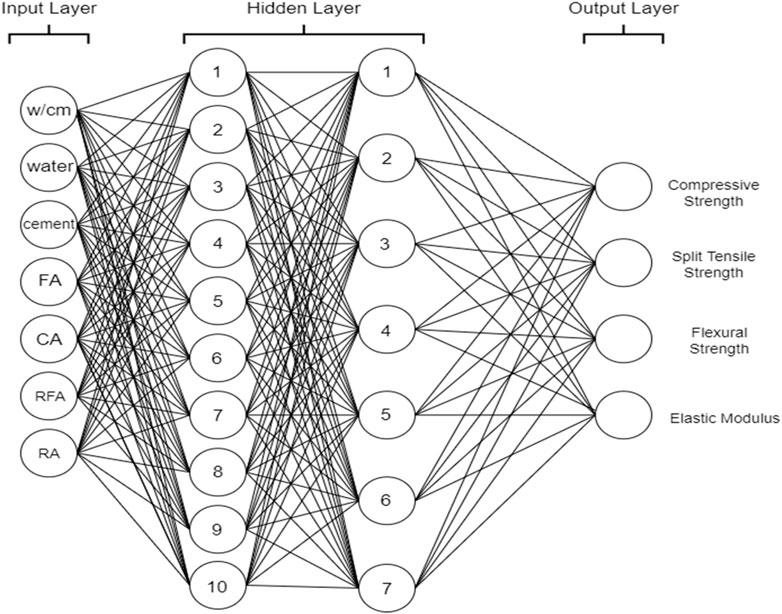
ANN is well known and has been widely employed as a modeling tool for years and has greater capabilities in modeling more complicated interactions (Duan et al., 2018). ANN has recently indicated to be an effective method for predicting the mechanical properties of concrete. This model is based on the biological nervous system and has been optimized for use in deep learning techniques. The most basic ANN is made up of artificial neurons that are linked together. The neurons are typically clustered into three layers: the input layer, the hidden layer, and the output layer. Signals are transmitted through the connections between neurons (called synapses). The neurons receive and process signals before transmitting them to the neurons to which they are linked. In training, ANNs learn from observational data and then predict unknown outcomes (Vasanthalin et al., 2021; Xue, Shao and Burlion, 2021). A general ANN architecture is illustrated in Figure 2. This study conducted an ANN analysis using MATLAB software, which preinstalled the ANN tool.
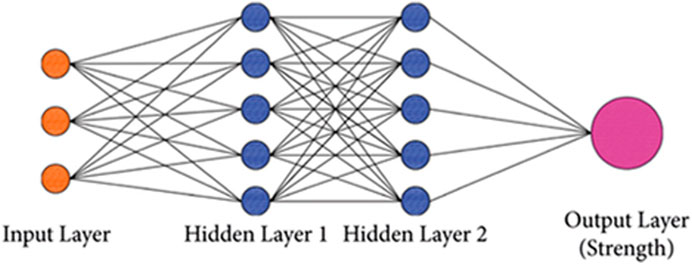
Figure 2. General structure of ANN (Sridhar et al., 2023).
The initial dataset was separated into three groups (datasets for training, testing, and validating the model). When the test results are satisfactory, then the training is considered complete. This is all done within the software interface.
The five basic parts of the neural network-based modeling process are as follows:
1. data collection, analysis, and problem representation;
2. determination of network architecture;
3. determination of learning process;
4. network training; and
5. testing of network and generalization evaluation.
The ANN model was developed utilizing MATLAB software. The model was developed utilizing error backpropagation and a training and recall algorithm (Awoyera et al., 2020), and this yielded a sigmoid/sum function (sigmoid). It is known to ultimately influence the output(s). Many studies (Meenakshi et al., 2023; Abellan-Garcia et al., 2023; Yu et al., 2023; de-Prado-Gil et al., 2024) reported that this method can solve problems with multiple variables employing a feed-forward–back propagation model based on the Levenberg–Marquardt (LM) multilayer method available in MATLAB.
This model uses 7 input parameters in the input layer, as well as 2 hidden layers with 10 neurons in the first layer and 7 neurons in the second layer, and finally, the output layer will predict the compressive strength, split tensile strength, modulus of elasticity, and flexural strength of RAC. The data utilized for training are 70% of the 356 datasets, 15% for validation, and 15% for testing.
In this study, variables were created, such as Xtrain, where the “input” variables would be inserted w/cm ratio, cement content, NA content (fine and coarse), water, and RCA (fine and coarse constituents).
2.4 GeneXProTools 5.0 models
Ferreira established GEP from the popular genetic programming (GP), which is built on the following basic components: terminal set, function set, fitness function, terminal condition, and control parameters. The multigenic nature of GEP enables the creation of complicated and nonlinear programs with multiple subprograms (Citakoglu et al., 2020; Uncuoglu et al., 2022).
The development of chromosomes is a crucial component of GEP. Based on the Karva language, chromosome arrangement is easily interpreted using expression trees (ETs). From the model, ETs and subtrees are formed with the chromosomes. The transformation of the Karva expression (K-expression) to an ET begins at the root of ET, the initial position in the K-expression, and continues through the string. ET is inversely translated to the K-expression utilizing the node record from the root layer to the deepest layer to construct the string.
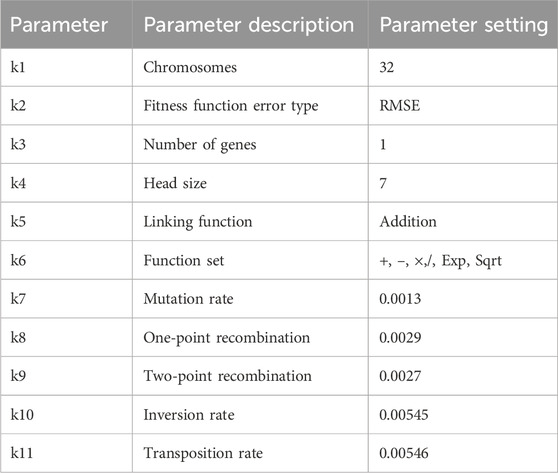
Generally, the database used was randomly divided into three subsets, namely, learning, testing, and validation, which helped improve the accuracy of the developed models. The data for learning, testing, and validation were employed for genetic development, determining the GEP model accuracy, and final model selection, respectively, with reference to the unused model data in the structure (Gholampour et al., 2017). GEP information and parameter settings are presented in Table 6. A combination of domain expertise, trial-and-error, and experimental tuning was utilized to determine the values for these parameters. As such, the goal was to determine the optimal settings for the situation or available resources.
3 Results and discussion
This section discusses the performance of the machine learning models. The results from the two models (MATLAB and GEP) are then compared based on their R2 value and a recommendation on the most suitable one for obtaining the most accurate prediction of the compressive strength, flexural strength, split tensile strength, and modulus of elasticity.
R2 is the preferred way of evaluating a given model as it yields a better picture of the quality of the regression model than MSE. This is because the accuracy of the MSE value can be affected if the values of the response variable are not scaled. Generally, an R2 value greater than 70% is desired.
3.1 ANN modeling results
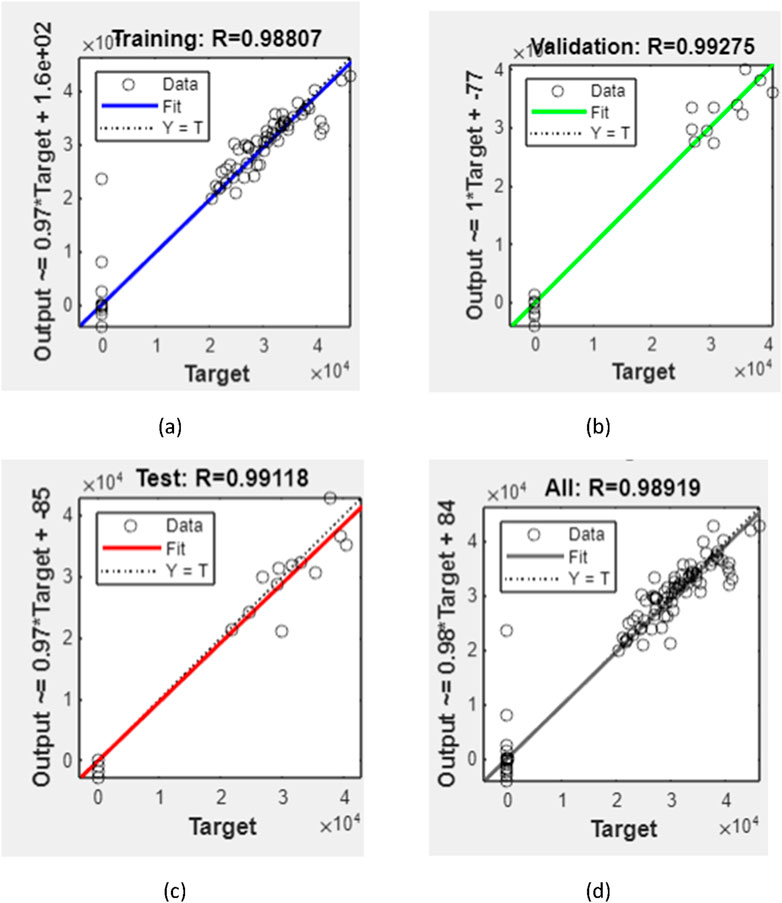
A trial-and-error method developed a suitable model to predict the compressive strength, split tensile strength, flexural strength, and modulus of elasticity of RAC using ANN. The input data include the water–to-cement ratio, aggregate-to-cement ratio, water content (kg/m3), cement content (kg/m3), fine aggregate content (kg/m3), coarse aggregate content (kg/m3), and RCA (kg/m3), while the output data include the compressive strength, split tensile strength, flexural strength, and modulus of elasticity of RAC on day 28. The training results of the ANN model with the lowest error (MSE) value and best coefficient of correlation are displayed in Figure 3. The model has 7 input neurons, 10 hidden layer neurons, and 4 output neurons.
3.1.1 Fitting line plot
The term “regression” refers to a curve or line that passes through all the necessary data points on an X–Y plot so that the gap between the vertical line and all the data points is minimal. A regression equation is an algebraic representation of the regression line demonstrating the relationship between the dependent and independent variables. The distance between these x and y points and the lines indicates whether the sample has a strong link, and it is then referred to as a correction. Figure 4 shows the ANN regression plots.
3.2 GEP model results
In this study, four models were developed on GEP to investigate the compressive strength, flexural strength, split tensile strength, and modulus of elasticity of RAC. The developed models were deduced by writing out the parameters from ETs from left to right and also from bottom left to right.
A typical model ET obtained for the compressive strength is illustrated in Figure 5.
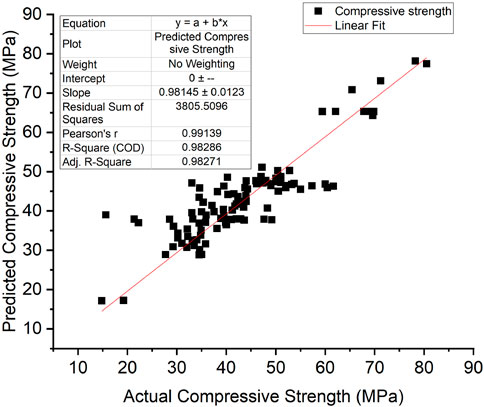
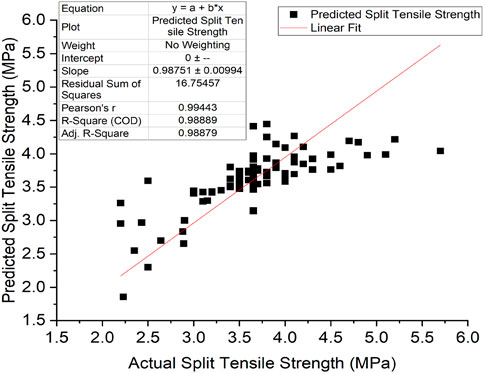
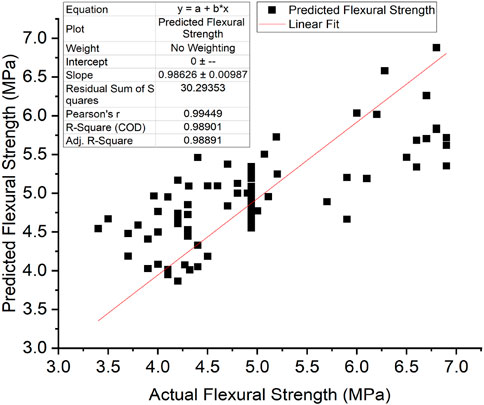
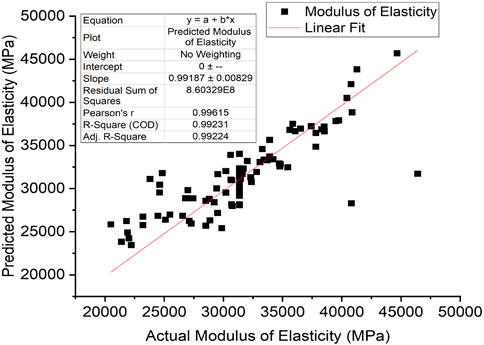
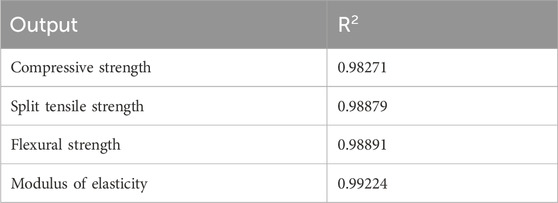
The model accuracy was based on the comparison of predicted and actual datasets of the compressive strength, split tensile strength, flexural strength, and modulus of elasticity of RAC, and the results are given in Figures 6–9, respectively. These figures indicate that there is a reasonable correlation between the model-predicted values and the actual values obtained from experiments recorded in the existing literature. This is also apparent from the achieved R and R2 values, as outlined in Table 7.
In formulating expressions from ETs generated by GEP for the compressive strength, split tensile strength, flexural strength, and modulus of elasticity, the following notations were adopted:
fc = compressive strength, MPa
fst = split tensile strength, MPa
fT = flexural strength, MPa
Ec = modulus of elasticity, MPa
a/c = aggregate-to-cement ratio
w/cm = water–to-cementitious material ratio
W = water, kg/m3
C = cement, kg/m3
CNA = coarse natural aggregate, kg/m3
FNA = fine natural aggregate, kg/m3
CRA = coarse recycled aggregate, kg/m3
FRA = fine recycled aggregate, kg/m3
The models developed from ETs for the compressive strength, split tensile strength, flexural strength, and modulus of elasticity are presented below.
3.2.1 Compressive strength
3.2.2 Split tensile strength
3.2.3 Flexural strength
3.2.4 Modulus of elasticity
4 Performance evaluation of developed predictive models
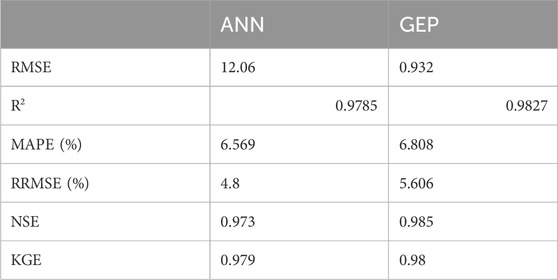
The statistical methods used to evaluate the predictive capacity of the models (GEP and ANN) in this article are the R-value (correlation coefficient) and R2 value (coefficient of determination). The experimental data and predicted data obtained from the models are compared. Figures 10A–D demonstrate the result compared to the literature for the assessed data. The correlation coefficient is between −1 and 1, indicating the strength and direction of a relationship between the experimental and predicted data. A correlation coefficient of −1 displays a perfect negative relationship between variables. This means that the variables change together in opposite directions. However, a correlation value of 0 means that no relationship was found between the variables. A correlation coefficient of +1 displays that the variables are perfectly related to each other in the same direction. The R and R2 values obtained from the two models, given in Table 8, show that the ANN predictive model values (with the R value of 0.98919) have the strongest correlation with the actual experimental values compared to the GEP predictive model values (with the average R value of 0.79262). The same is observed for the GEP coefficient of determination (R2 value). The R2 value of a model exhibits the proportion of variance of the values and ranges from 0 to 1. An R2 value of 0 signifies that the dependent variable cannot be predicted successfully from the independent variable. The closer this value is to 1, the stronger the correlation, and the more accurate the model. As such, both the ANN model (with an R2 value of 0.9785) and GEP (with an R2 value of 0.9827) can be said to predict the RAC performance accurately. However, an R2 value of 1 is not always desirable. It could point out that information leaked during the testing stage, or the problem was fairly easy for the model to learn.
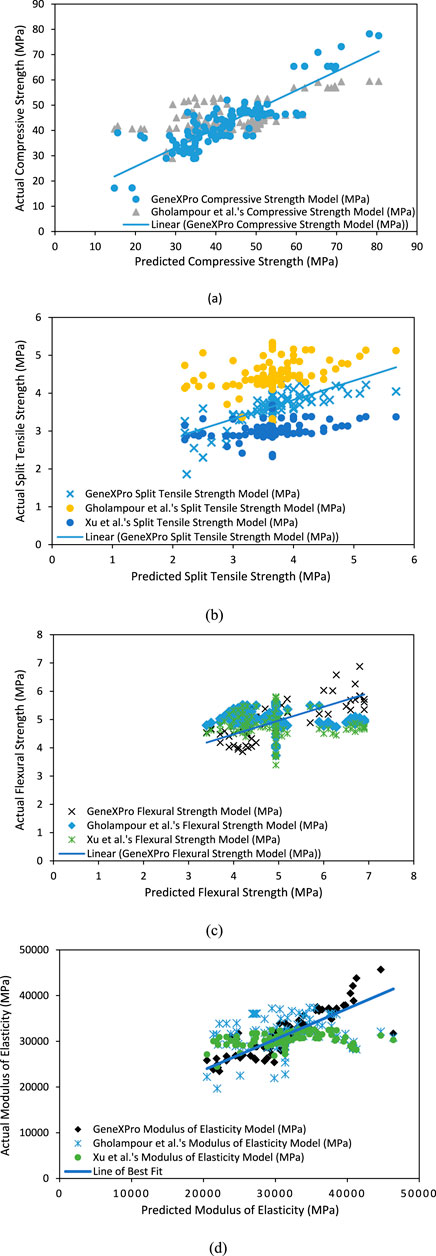
Figure 10. Comparison of experimentally observed and predicted values: (A) compressive strength, (B) split tensile strength, (C) flexural strength, and (D) modulus of elasticity.
Based on the error values obtained for modeling of the RAC performance using ANN and GEP and according to the studies by Görkemli et al. (2022) and Özbayrak et al. (2023), the following assertion is made: a lower RMSE demonstrates improved model performance. In this case, GEP has a significantly lower RMSE than ANN, revealing that GEP is a better fit for the data.
R2 measures how much of the variance in the dependent variable is predictable from the independent variables. Both models have high R2 values, indicating that they account for a significant portion of the variance in the data. However, GEP has a slightly higher R2 value, indicating that it may provide a better fit to the data.
MAPE calculates the mean absolute percentage difference between the predicted and actual values. Both models have low MAPE values, illustrating high prediction accuracy. ANN has a lower MAPE value, implying slightly better performance in the absolute percentage error.
RRMSE is the ratio of RMSE to the mean of the observed values. Lower RRMSE values show improved model performance. ANN has a lower RRMSE, displaying slightly better performance than the mean of the observed values.
NSE compares the model predicted values to the observed mean. Both models have high NSE values, which present good predictive performance. GEP has a higher NSE value, indicating a better fit between the predicted and observed values.
KGE is a metric that considers the correlation, bias, and variability of the modeled and observed data. Both models have high KGE values, which exhibit good model performance. However, GEP has a slightly higher KGE value, demonstrating a slightly better agreement between the modeled and observed data.
The prediction performance of the generated model is compared to existing models extracted from the literature (Gholampour et al., 2017; Xu et al., 2019).
Finally, the figures indicate that the predictions from the proposed GEP models are closer to the actual results than the predictions from the models proposed by Gholampour et al. (2017) and Xu et al. (2019).
Furthermore, the Kruskal–Wallis test was used to determine whether the estimated and measured data distributions were similar. A statistical significance test was carried out on the results of the two techniques. Table 9 shows that the Ho hypothesis for estimating experimental and predicted datasets utilizing the ANN and GEP methods was rejected. Thus, it was an indication that there was no considerable difference between the means of the output values of the actual and predicted datasets, revealing that the estimated experimental and natural datasets were reliable.
5 Conclusion
This study examined the relationship between the w/cm ratio, water (kg/m3), cement (kg/m3), natural fine aggregate (kg/m3), natural coarse aggregate (kg/m3), coarse RCA (kg/m3), and fine RCA (kg/m3) to accurately predict the strength parameters (compressive strength, split tensile strength, flexural strength, and modulus of elasticity) of RAC. The study demonstrated that the ANN model predicts the strength parameters of RAC more efficiently than the GEP model.
The following conclusions were drawn from the study:
• Both ANN and GEP models are effective at modeling the performance of RAC. However, based on the provided error values, GEP appeared to have a slight performance advantage over ANN across multiple evaluation metrics.
• The input considerations used in creating the GEP model were sufficient only to train the model to predict the compressive strength of RAC, but not the split tensile strength, flexural strength, and modulus of elasticity of RAC. However, these input parameters were sufficient to produce a highly accurate model of all the considered strength parameters by ANN.
• In the model developed using GEP and ANN, the compressive strength, split tensile strength, flexural strength, and modulus of elasticity were compared based on their R2 value. The results demonstrated that the GEP and ANN models developed for RAC are reliable and can predict the concrete properties at over 50% confidence level. Overall, the ANN model is more accurate in predicting the compressive strength, flexural strength, split tensile strength, and modulus of elasticity. However, GEP has an advantage providing a mathematical expression for solving the investigated strength parameters.
• By predicting the RAC properties accurately, these models can help reduce the environmental impact and construction costs, promoting the use of recycled materials in construction.
Data availability statement
The raw data supporting the conclusion of this article will be made available by the authors, without undue reservation.
Author contributions
PA: conceptualization, investigation, methodology, project administration, validation, writing–original draft, and writing–review and editing. AB: conceptualization, formal analysis, investigation, methodology, project administration, resources, validation, writing–original draft, and writing–review and editing. CO: investigation and writing–original draft. LB: validation and writing–review and editing. EM: investigation and writing–original draft. JM: conceptualization and writing–review and editing. JH: investigation, methodology, and writing–review and editing.
Funding
The author(s) declare that financial support was received for the research, authorship, and/or publication of this article. This research work was supported by the Korea Agency for Infrastructure Technology Advancement grant funded by the Ministry of Land, Infrastructure, and Transport (Grant 21CFRP-C163381-01).
Conflict of interest
The authors declare that the research was conducted in the absence of any commercial or financial relationships that could be construed as a potential conflict of interest.
Publisher’s note
All claims expressed in this article are solely those of the authors and do not necessarily represent those of their affiliated organizations, or those of the publisher, the editors, and the reviewers. Any product that may be evaluated in this article, or claim that may be made by its manufacturer, is not guaranteed or endorsed by the publisher.
References
Abellan-Garcia, J., Fernández-Gómez, J., Iqbal Khan, M., Abbas, Y. M., and Pacheco-Bustos, C. (2023). ANN approach to evaluate the effects of supplementary cementitious materials on the compressive strength of recycled aggregate concrete. Constr. Build. Mater. 402, 132992. doi:10.1016/j.conbuildmat.2023.132992
Alipour, A., Yarahmadi, J., and Mahdavi, M. (2014). Comparative study of M5 model tree and artificial neural network in estimating reference evapotranspiration using MODIS products alvarez, I. J. Climatol. 2014, 839205. doi:10.1155/2014/839205
Awoyera, P. O. (2018). Predictive models for determination of compressive and split-tensile strengths of steel slag aggregate concrete. Mater. Res. Innovations 22 (5), 287–293. doi:10.1080/14328917.2017.1317394
Awoyera, P. O., Kirgiz, M. S., Viloria, A., and Ovallos-Gazabon, D. (2020). Estimating strength properties of geopolymer self-compacting concrete using machine learning techniques. J. Mater. Res. Technol. 9 (4), 9016–9028. doi:10.1016/j.jmrt.2020.06.008
Babalola, O. E., Awoyera, P., Tran, M., Olalusi, O., Viloria, A., and Ovallos-Gazabon, D. (2020). Mechanical and durability properties of recycled aggregate concrete with ternary binder system and optimized mix proportion. J. Mater. Res. Technol. 9 (3), 6521–6532. doi:10.1016/j.jmrt.2020.04.038
Bartlett, C. W., Bossenbroek, J., Ueyama, Y., McCallinhart, P., Peters, O. A., Santillan, D. A., et al. (2023). Invasive or more direct measurements can provide an objective early-stopping ceiling for training deep neural networks on non-invasive or less-direct biomedical data. SN Comput. Sci. 4 (2), 161. doi:10.1007/s42979-022-01553-8
Bayram, S., and Çıtakoğlu, H. (2022). Modeling monthly reference evapotranspiration process in Turkey: application of machine learning methods. Environ. Monit. Assess. 195 (1), 67. doi:10.1007/s10661-022-10662-z
Behnood, A., Olek, J., and Glinicki, M. A. (2015). Predicting modulus elasticity of recycled aggregate concrete using M5′ model tree algorithm. Constr. Build. Mater. 94, 137–147. doi:10.1016/j.conbuildmat.2015.06.055
Belaïd, F. (2022). How does concrete and cement industry transformation contribute to mitigating climate change challenges? Resour. Conservation and Recycl. Adv. 15, 200084. doi:10.1016/j.rcradv.2022.200084
ben Chaabene, W., Flah, M., and Nehdi, M. L. (2020). Machine learning prediction of mechanical properties of concrete: critical review. Constr. Build. Mater. 260, 119889. doi:10.1016/j.conbuildmat.2020.119889
Cabral, A. E. B., Schalch, V., Molin, D. C. C. D., and Ribeiro, J. L. D. (2010a). Mechanical properties modeling of recycled aggregate concrete. Constr. Build. Mater. 24 (4), 421–430. doi:10.1016/j.conbuildmat.2009.10.011
Catherina Vasanthalin, P., and Chella Kavitha, N. (2021). “Prediction of compressive strength of recycled aggregate concrete using artificial neural network and cuckoo search method,” in Materials today: proceedings (Elsevier Ltd), 8480–8488.
Citakoglu, H. (2021). Comparison of multiple learning artificial intelligence models for estimation of long-term monthly temperatures in Turkey. Arabian J. Geosciences 14 (20), 2131. doi:10.1007/s12517-021-08484-3
Citakoglu, H., Babayigit, B., and Haktanir, N. A. (2020). Solar radiation prediction using multi-gene genetic programming approach. Theor. Appl. Climatol. 142 (3), 885–897. doi:10.1007/s00704-020-03356-4
de-Prado-Gil, J., Martínez-García, R., Jagadesh, P., Juan-Valdés, A., Gónzalez-Alonso, M. I., and Palencia, C. (2024). To determine the compressive strength of self-compacting recycled aggregate concrete using artificial neural network (ANN). Ain Shams Eng. J. 15 (2), 102548. doi:10.1016/j.asej.2023.102548
Duan, Z., Hou, S., Poon, C. S., Xiao, J., and Liu, Y. (2018). Using neural networks to determine the significance of aggregate characteristics affecting the mechanical properties of recycled aggregate concrete. Appl. Sci. Switz. 8 (11), 2171. doi:10.3390/app8112171
Ezema, I. C. (2019). “Chapter 9 - materials,” in Sustainable construction technologies. Editors V. W. Y. Tam, and K. N. Le (Butterworth-Heinemann), 237–262.
Farzampour, A., Mansouri, I., Mortazavi, S. J., and Hu, J. W. (2019) “Force-displacement relationship of a butterfly-shaped beams based on gene expression programming,” in 10th international symposium on steel structures (Korea: Jeju), 10–13.
Gholampour, A., Gandomi, A. H., and Ozbakkaloglu, T. (2017). New formulations for mechanical properties of recycled aggregate concrete using gene expression programming. Constr. Build. Mater. 130, 122–145. doi:10.1016/j.conbuildmat.2016.10.114
Görkemli, B., Citakoglu, H., Haktanir, T., and Karaboga, D. (2022). A new method based on artificial bee colony programming for the regional standardized intensity–duration‒frequency relationship. Arabian J. Geosciences 15 (3), 272. doi:10.1007/s12517-021-09377-1
Liu, Y., Zhang, S., Zhang, J., Tang, L., and Bai, Y. (2021). Assessment and comparison of six machine learning models in estimating evapotranspiration over croplands using remote sensing and meteorological factors. Remote Sens. 13 (19), 3838. doi:10.3390/rs13193838
López-Uceda, A., Ayuso, J., López, M., Jimenez, J., Agrela, F., and Sierra, M. (2016). Properties of non-structural concrete made with mixed recycled aggregates and low cement content. Materials 9 (2), 74. doi:10.3390/ma9020074
Mansouri, I., Azmathulla, H. M., and Hu, J. W. (2018). Gene expression programming application for prediction of ultimate axial strain of FRP-confined concrete. Electron. J. Fac. Civ. Eng. Osijek-e-GFOS 16, 64–76. doi:10.13167/2018.16.6
Meenakshi, B. S., Indradevi, P., Dhilp kumar, A., Harish Natarajan, T., Sathyasheelan, S., and Kathirvel, V. (2023). ANN model using MATLAB in CFS -concrete. Mater. Today Proc. doi:10.1016/j.matpr.2023.05.103
Özbayrak, A., Ali, M. K., and Çıtakoğlu, H. (2023). Buckling load estimation using multiple linear regression analysis and multigene genetic programming method in cantilever beams with transverse stiffeners. Arabian J. Sci. Eng. 48 (4), 5347–5370. doi:10.1007/s13369-022-07445-6
Plaza, P., Sáez del Bosque, I., Frías, M., Sánchez de Rojas, M., and Medina, C. (2021). Use of recycled coarse and fine aggregates in structural eco-concretes. Physical and mechanical properties and CO2 emissions. Constr. Build. Mater. 285, 122926. doi:10.1016/j.conbuildmat.2021.122926
Shrivastava, S., and Shrivastava, T. (2023). Prediction of concrete’s compressive strength using machine learning algorithms. Mater. Today Proc. doi:10.1016/j.matpr.2023.08.252
Sridhar, J., Balaji, S., Jegatheeswaran, D., and Awoyera, P. (2023). Prediction of the mechanical properties of ibre-reinforced quarry dust concrete using response surface and artificial neural network techniques. Advances in Civil Engineering, 13. doi:10.1155/2023/8267639
Uncuoglu, E., Citakoglu, H., Latifoglu, L., Bayram, S., Laman, M., Ilkentapar, M., et al. (2022). Comparison of neural network, Gaussian regression, support vector machine, long short-term memory, multi-gene genetic programming, and M5 Trees methods for solving civil engineering problems. Appl. Soft Comput. 129, 109623. doi:10.1016/j.asoc.2022.109623
Wang, S., Xia, P., Chen, K., Gong, F., Wang, H., Wang, Q., et al. (2023b). Prediction and optimization model of sustainable concrete properties using machine learning, deep learning and swarm intelligence: a review. J. Build. Eng. 80, 108065. doi:10.1016/j.jobe.2023.108065
Wang, S., Xia, P., Gong, F., Zeng, Q., Chen, K., and Zhao, Y. (2024). Multi objective optimization of recycled aggregate concrete based on explainable machine learning. J. Clean. Prod. 445, 141045. doi:10.1016/j.jclepro.2024.141045
Wang, S., Xia, P., Wang, Z., Meng, T., and Gong, F. (2023a). Intelligent mix design of recycled brick aggregate concrete based on swarm intelligence. J. Build. Eng. 71, 106508. doi:10.1016/j.jobe.2023.106508
Xu, J., Zhao, X., Yu, Y., Xie, T., Yang, G., and Xue, J. (2019). Parametric sensitivity analysis and modelling of mechanical properties of normal- and high-strength recycled aggregate concrete using grey theory, multiple nonlinear regression and artificial neural networks. Constr. Build. Mater. 211, 479–491. doi:10.1016/j.conbuildmat.2019.03.234
Xue, J., Shao, J. F., and Burlion, N. (2021). Estimation of constituent properties of concrete materials with an artificial neural network based method. Cem. Concr. Res. 150, 106614. doi:10.1016/j.cemconres.2021.106614
Yu, P., Qiu, H., He, S., Qin, Y., and Zhou, Y. (2023). Pore structure and prediction of mechanical properties by ANN of concrete mixed MK and SF under hydrochloric acid corrosion. Constr. Build. Mater. 409, 133665. doi:10.1016/j.conbuildmat.2023.133665
Keywords: modeling, recycled aggregate concrete, artificial neural network, gene expression programming, strength properties
Citation: Awoyera PO, Bahrami A, Oranye C, Bendezu Romero LM, Mansouri E, Mortazavi J and Hu JW (2024) Modeling properties of recycled aggregate concrete using gene expression programming and artificial neural network techniques. Front. Built Environ. 10:1447800. doi: 10.3389/fbuil.2024.1447800
Received: 12 June 2024; Accepted: 28 August 2024;
Published: 10 October 2024.
Edited by:
Zengping Zhang, Chang’an University, ChinaReviewed by:
Fuyuan Gong, Zhejiang University, ChinaMohammad Khajehzadeh, Islamic Azad University, Anar, Iran
Copyright © 2024 Awoyera, Bahrami, Oranye, Bendezu Romero, Mansouri, Mortazavi and Hu. This is an open-access article distributed under the terms of the Creative Commons Attribution License (CC BY). The use, distribution or reproduction in other forums is permitted, provided the original author(s) and the copyright owner(s) are credited and that the original publication in this journal is cited, in accordance with accepted academic practice. No use, distribution or reproduction is permitted which does not comply with these terms.
*Correspondence: Alireza Bahrami, YWxpcmV6YS5iYWhyYW1pQGhpZy5zZQ==; Jong Wan Hu, am9uZ3AyNEBpbnUuYWMua3I=
†Present address: Paul O. Awoyera, Department of Civil Engineering, Prince Mohammad Bin Fahd University, Dhahran, Saudi Arabia
Chukwufumnanya Oranye, Department of Civil Engineering, Covenant University, Ota, Nigeria
Lenin M. Bendezu Romero, Department of Civil Engineering, Universidad Peruana de Ciencias Aplicadas, Lima, Peru
 Paul O. Awoyera
 Alireza Bahrami
 Chukwufumnanya Oranye1†
 Ehsan Mansouri
 Javad Mortazavi