- 1Maseeh Department of Civil, Architectural and Environmental Engineering, The University of Texas at Austin, Austin, TX, United States
- 2Department of Civil and Coastal Engineering, University of Florida, Gainesville, FL, United States
- 3Community and Regional Planning Program, The University of Texas at Austin, Austin, TX, United States
Assessing building damage in coastal communities after a hurricane event is crucial for reducing both immediate and long-term disaster impacts, as well as for enhancing resilience planning and disaster preparedness. Despite the extensive data collection efforts of the post-hurricane reconnaissance teams, some information on the structural features of damaged buildings is often missing due to various reasons, like the absence of relevant documents or severe building damage, thereby limiting our comprehensive understanding of building resilience to natural disasters. This study introduces a machine learning approach based on extreme gradient boosting (XGBoost) to reconstruct missing structural features of the damaged buildings from four types of data (known structural, geospatial, hazard, and damage level information). XGBoost models were trained based on the reconnaissance datasets collected from four regions affected by Hurricanes. For each region, we analyzed the model’s performance depending on the missing structural features. We also demonstrated the importance of including geospatial, hazard, and damage level data by showing improved performance of XGBoost models compared to those trained only on known structural data. Furthermore, we examined how the accuracy of the XGBoost approach changes if multiple structural features are missing. This XGBoost approach has the potential to support post-hurricane building damage assessments by providing missing building details, enabling comprehensive post-disaster analysis.
1 Introduction
Coastal communities in the United States face significant vulnerability to hurricane impacts, particularly during the Atlantic hurricane season, which spans half of the year. As coastal populations expand and more buildings and infrastructure are constructed, these communities are increasingly at risk (Freeman and Ashley, 2017; Klotzbach et al., 2018; Pielke et al., 2008). Moreover, losses from hurricanes have exhibited increases in recent decades as the frequency of hurricanes making landfall and major hurricanes have shown trends of increase due to changing climate (Balaguru et al., 2023; Kim and Peiser, 2020). Exposing ever-growing critical infrastructure in coastal communities further escalates the risk associated with hurricanes and storm surges (Klotzbach et al., 2018; Weinkle et al., 2018).
To better understand the current vulnerabilities of the coastal communities and minimize future building and infrastructure damage, it is important to comprehensively assess the structural damage of buildings caused by hurricane winds and storm surges (Wartman et al., 2020). Over the past decade, significant progress has been made in rapidly collecting time-sensitive building damage data following major hurricane events (Lenjani et al., 2020). This effort, led by organizations like the Natural Hazards Engineering Research Infrastructure (NHERI), including the Structural Extreme Events Reconnaissance (StEER) Network under the CONVERGE node, has provided valuable reconnaissance datasets (e.g., Kijewski-Correa et al., 2018a; Kijewski-Correa et al., 2018b; Roueche et al., 2018; 2020; 2021). The datasets contain a combination of ‘field’ observations, obtained by the personnel on site shortly after the hurricane, such as door-to-door assessments and street-level panoramas, and “virtual” observations obtained by remote personnel, such as aerial and street-level imagery collected by unmanned aerial systems, satellites, and lidar scans (e.g., Alidoost and Arefi, 2018; Berman et al., 2020; Buyukdemircioglu et al., 2021; Lenjani et al., 2020; Mohajeri et al., 2018; Ro et al., 2024) (Applied Research Associates, 2017a; Applied Research Associates, 2017b; Applied Research Associates, 2018; Applied Research Associates, 2020).
However, obtaining detailed information about a building’s structure from “virtual” data can be challenging due to factors such as low resolution, weather interference, and areas obscured by shadows. Similarly, getting this information from “field” observations becomes tricky when buildings are severely damaged or totally destroyed. In some cases, these structural features are unavailable in public records, thereby further limiting data collection. As a result, when we examined NSF-funded StEER and Geotechnical Extreme Events Reconnaissance (GEER) Association reconnaissance data from 3,796 single-family houses affected by four major hurricanes (Applied Research Associates, 2017a; Applied Research Associates, 2017b; Applied Research Associates, 2018; Applied Research Associates, 2020), approximately 1,200 of them lacked at least one piece of building information. The lack of data limits our ability to understand how building structures interact with hazards, emphasizing the necessity to reconstruct missing structural information for a clearer understanding of their response to such events.
To address this issue, several methods have been proposed to impute missing structure-related data from combinations of known structural, geospatial, hazard, and building damage level information. For instance, Pita et al. (2011) suggested using Bayesian belief networks and classification/regression trees to impute a missing structural feature (roof type) based only on known structural features (e.g., exterior wall type, year built, roof cover, building value, and number of stories). Massarra et al. (2020) developed models based on predictive mean matching and multiple imputation logistic regression to impute two missing structural features (foundation type and number of stories) using hazard information (e.g., maximum wind speed and maximum water depth). The NHERI SimCenter developed a machine-learning model called the “Spatial Uncertainty Research Framework” (SURF) that estimates missing structural features using known structural and geospatial information of neighboring buildings (Yu et al., 2019; Wang, 2021). Macabuag et al. (2016) applied the multiple imputation technique to estimate a missing structural feature (building material) from structural (e.g., footprint area), hazard (e.g., inundation depth), and damage level data. While there is a study that introduced cluster-based and decision tree-based imputation techniques to estimate road segment status after an earthquake using structural (e.g., road type), geospatial (e.g., grid location), hazard (e.g., distance to the epicenter), and nearby building damage level information (Yagci Sokat et al., 2018), to the best of our knowledge, no study has incorporated all four types of data (structural, geospatial, hazard, and damage level information) into a single framework for imputing missing structural features of damaged buildings. Including all four types of information is important considering that the damage levels result not only from structural features (vulnerability) but also from geospatial characteristics (exposure) and hazard intensity (Klepac et al., 2022).
In this study, we introduce a new methodology to impute missing structural features of damaged buildings using four types of data: structural, geospatial, hazard, and damage level information (Section 2). Our approach employs XGBoost, a machine-learning algorithm from the ensemble learning category (Section 3). The study is unique for the following reasons:
• This is the first study to use four distinct types of data (structural, geospatial, hazard, and damage level information) to reconstruct missing structural features.
• We consider a larger set of structural features (a total of 11) and regions affected by hazard events (four hurricanes) compared to existing studies.
• We analyze the impact of geospatial, hazard, and damage level information by comparing the performance of the XGBoost model trained with all four data types against the XGBoost model trained solely on known structural information (Section 4).
• We investigate cases where more than one structural feature is missing, which is common in buildings that are severely damaged (Section 4).
2 Data collection and feature representation
In the context of hurricane damage to buildings, informative features include resistance capacities of a given structure, load-mitigating features of the surrounding environment, and loading imparted by hurricane hazards. These categories are represented by four types of datasets: structural data, geospatial data, hazard data, and damage level data. In this study, we gathered those four types of reconnaissance datasets from public sources, covering 3,796 single-family houses affected by hurricanes (Applied Research Associates, 2017a; Applied Research Associates, 2017b; Applied Research Associates, 2018; Applied Research Associates, 2020) (1,815 houses near Galveston, Texas from Harvey, 1,004 houses in the Florida Peninsula and Keys from Irma, 574 houses in the Florida Panhandle from Michael, and 403 houses in Southwest Louisiana from Laura).
2.1 Structural data
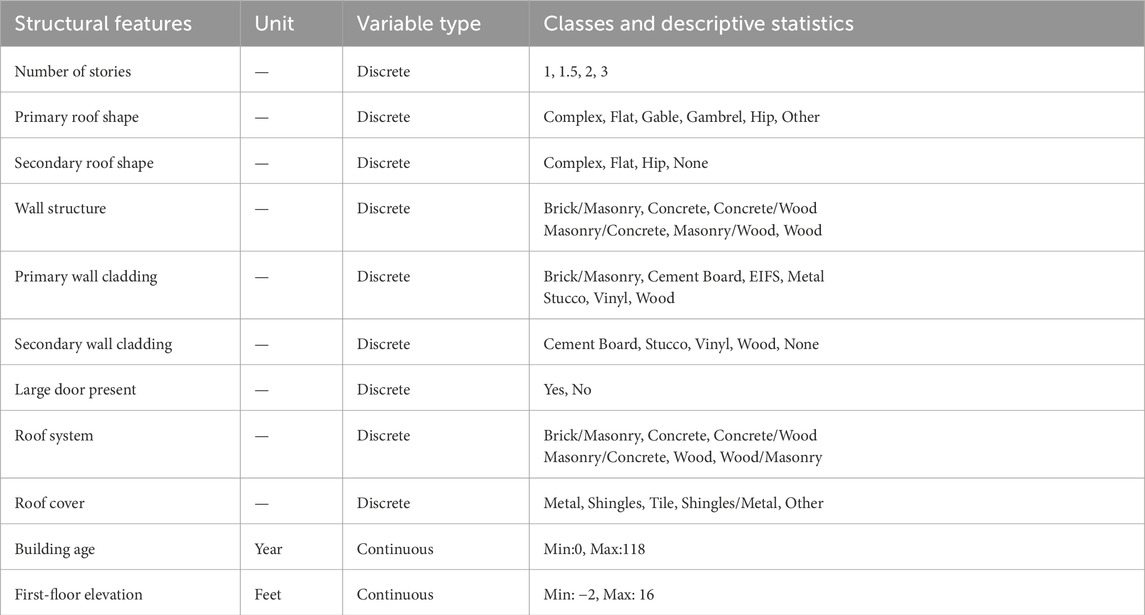
Structural data were obtained from NSF-funded StEER and GEER reconnaissance datasets (Kijewski-Correa et al., 2018a; Kijewski-Correa et al., 2018b; Roueche et al., 2018; 2020; 2021). These datasets contain building-specific, qualitative damage ratings for buildings throughout the respective hurricane impact areas in addition to each building’s structural parameters: number of stories (integer, where 1.5 indicates a second story over part of the house), roof shape (where the primary shape covers the majority of the house and secondary, if any, covers the remainder), wall structure (structural wall framing material or combination of materials), wall cladding (outermost wall covering material, where the primary is the predominant material and secondary, if any, are other claddings present on the building), large door presence (typically a garage door), roof system (roof framing material), roof cover (outermost covering material on the roof), building age, and first-floor elevation (relative to ground elevation). Table 1 provides a comprehensive list of 11 structural features, including the data type associated with each variable, the classes within each discrete variable, and descriptive statistics for each continuous variable. Supplementary Figures S12–S22 show the distribution of all structural features and the construction patterns of the four regions (Galveston, Texas, Florida Peninsula and Keys, Florida Panhandle, and Southwest Louisiana). The Southwest Louisiana region affected by Hurricane Laura exhibits more skewed data distribution compared to the other regions, indicating a more homogeneous construction pattern (Supplementary Figures S12D–S22D). Additionally, secondary roof shape and wall cladding for three regions (except the Southwest Louisiana region) exhibit a more homogeneous construction pattern than primary roof shape and wall cladding (Supplementary Figures S13–S17).
2.2 Geospatial data
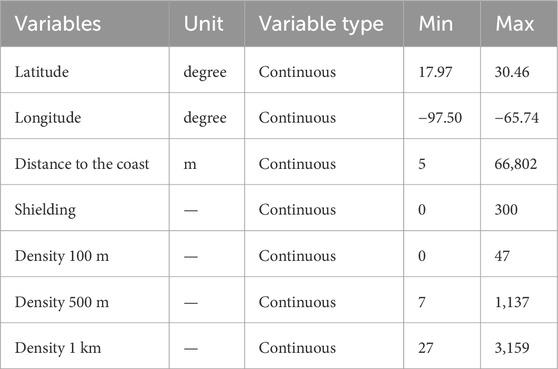
Geospatial data representing houses’ extent of exposure were calculated using geographic information system (GIS) software. Geospatial features include house coordinates, the distance from each house to the nearest coastline point, building density as a count of other buildings within 100 m, 500 m, and 1 km of a given house, and the count of “shielding” buildings whose footprints intersect a linear path between a house’s footprint and the nearest point along the coastline. Building footprints from the Federal Emergency Management Agency (FEMA) USA Structures dataset (FEMA, 2022) were used to produce the geospatial features. Table 2 provides a comprehensive list of seven geospatial data, including the data type associated with each variable and descriptive statistics.
2.3 Hazard data
Hazard data represent hurricane-induced winds and storm surges at the house location. Hazard features consist of surge-induced water depth, design wind speed exceedance, and duration of 17.5, 25.7, and 32.9 m/s (34, 54, and 64 kt) sustained wind speeds. Design wind speed exceedance was calculated as the difference between American Society of Civil Engineers (ASCE) ASCE (2017) Risk Category II design wind speed at each house location and the observed peak 3-s gust obtained from Applied Research Associates (ARA) observed windfield maps for the respective hurricane (Applied Research Associates, 2017a; Applied Research Associates, 2017b; Applied Research Associates, 2018; Applied Research Associates, 2020). This calculation was conducted for the design wind speed of 2005, 2010, and 2016 revisions of ASCE 7, yielding three variables: Design exceeded 7–05, 7–10, and 7–16. The durations that each house experienced various sustained wind speeds, reported in six-hour increments, were determined by analyzing hurricane tracks and wind speed radii given in the National Hurricane Center (NHC) HURDAT2 dataset (Landsea and Franklin, 2013). Surge-induced water depth relative to ground level at each house location was collected from FEMA observation-corrected depth models (FEMA, 2017a; FEMA, 2017b; FEMA, 2018). Table 3 provides a comprehensive list of seven hazard data, including the data type associated with each variable and descriptive statistics.
2.4 Damage level data
Damage level data were obtained from the StEER and GEER reconnaissance datasets for each region (Kijewski-Correa et al., 2018a; Kijewski-Correa et al., 2018b; Roueche et al., 2018; 2020; 2021). The damage data describe qualitative damage states of the houses following the five damage state criteria of Vickery et al. (2006): 0-“no damage or very minor damage,” 1-“minor damage,” 2-“moderate damage,” 3-“severe damage,” and 4-“destroyed.” A house’s damage state (DS) is determined during reconnaissance based on the extent of damage to roof and wall cover, windows and doors, roof and wall sheathing, roof structure, and wall structure (Roueche et al., 2019). DS-0 indicates no damage to any of these attributes. DS-1 has limited damage to roof and wall covers or doors and windows. DS-2 represents a greater extent of damage to the assets covered in DS-1 and/or damage to roof or wall sheathing. DS-3 indicates greater extent of damage to the assests covered in DS-2 or any damage to the roof structure. DS-4 has a greater extent of damage to the assets covered in DS-3 or any damage to the all structure. Thresholds to distinguish between the damage states are detailed in Roueche et al. (2019).
3 Methods
For each region, we developed XGBoost models that can estimate one missing structural feature from four types of datasets described in Section 2. Figure 1 outlines the process of training and testing the XGBoost models.
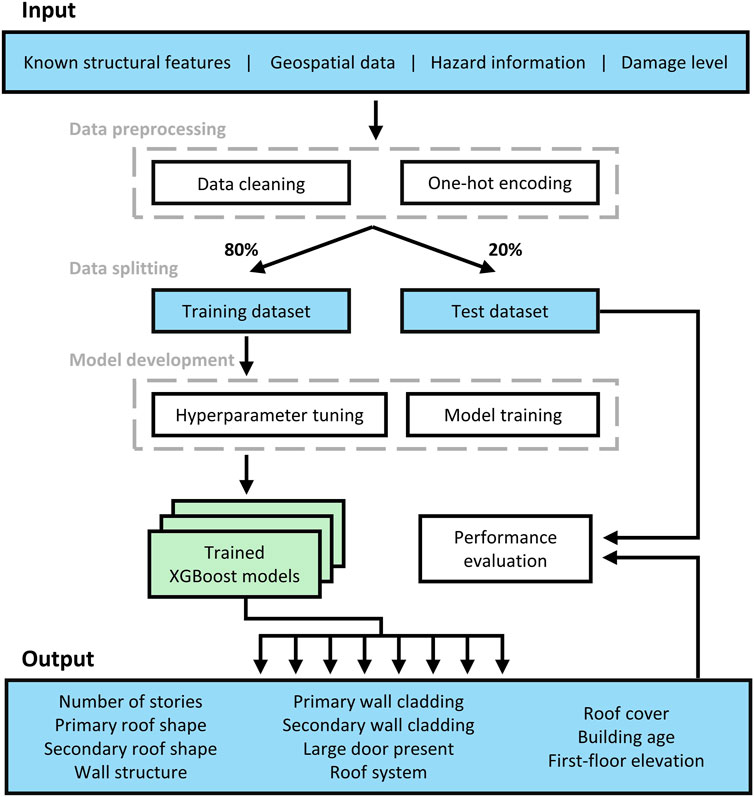
Figure 1. A flowchart of structural features XGBoost model. The blue box represents the dataset, the white box represents the data science pipeline which includes data preprocessing, model development, and performance evaluation, and the green box represents the trained XGBoost models. All these processes were conducted for four different regions, each impacted by a different hurricane.
3.1 Machine-learning algorithm
We chose extreme gradient boosting (XGBoost) because (1) the reconnaissance dataset contains both discrete and continuous variables, (2) the variables do not adhere to a normal distribution, and (3) the reconnaissance datasets are imbalanced—In structural features, there is an imbalance in the number of data points among classes, with one class containing a larger portion of the data while the other classes have relatively fewer data points. XGBoost is one of the machine-learning algorithms using the ensemble learning category, recognized for its capacity to enhance weak learners’ performance through advanced optimization techniques and algorithmic improvements. It is particularly designed for scalability and efficiency in tree optimization, making it highly effective for both regression and classification tasks (Chen and Guestrin, 2016; Yuan et al., 2023). Originating as a distinct approach to applied gradient boosting, XGBoost integrates the predictions of multiple weak learners using additive training strategies, resulting in a robust machine-learning model. This methodology not only significantly reduces the risk of overfitting but also bolsters computational efficiency, despite its potentially high demand on resources for large datasets or complex models (Alshboul et al., 2022). Additionally, this method is highly effective at dealing with imbalanced data and data that do not follow a normal distribution. This is because tree-based models, developed based on decision trees, such as random forest, gradient boosting, and XGBoost, partition data based on features at each node, thereby allowing them to flexibly handle data regardless of its distribution (Chen, 2018). XGBoost’s robustness and efficiency have made it a popular choice for tackling complex data structures and imputing missing features in numerous predictive modeling applications (e.g., Deng and Lumley, 2023; Shi et al., 2022).
3.2 Data preprocessing
We cleaned the 3,796 single-family house data based on two criteria. First, observations containing incomplete feature information were eliminated since XGBoost models require complete data for training. Secondly, to implement 5-fold cross-validation, each target discrete structural feature (the output in Figure 1) must have a minimum of five observations for each class. Therefore, if this requirement is not met, we exclude those observations from the training set. This cleaning process was performed independently for each target variable, resulting in a different number of removed observations for each region and target variable. After the data cleaning process, the number of remaining data was as follows: for Galveston, Texas affected by Hurricane Harvey, 1,286 to 1,294; for Florida Peninsula and Keys affected by Hurricane Irma, 440 to 445; for Florida Panhandle affected by Hurricane Michael, 419 to 425; and for Southwest Louisiana affected by Hurricane Laura, 387 to 391. After cleaning the data, one-hot encoding was applied for the discrete inputs since the XGBoost model does not have a preset encoding mechanism for handling categorical data. This method converts each class of a given discrete variable into a binary variable (Hancock and Khoshgoftaar, 2020). It can preserve the information of discrete variables and generally plays an important role in improving the performance of XGBoost models (Yu et al., 2022). We performed one-hot encoding using a pandas (Python data analysis library) function, get_dummies, when the input dataset contained discrete structural features. For the outputs, ordinal encoding was utilized to convert categorical structural features into integers, as XGBoost models cannot directly handle string variables. Note that scaling and normalization were not applied to the input variables. Unlike machine-learning approaches that utilize proximity-based algorithms like neural networks and support vector machines, the XGBoost model operates independently for each decision tree. As a result, it is less affected by the range of values within individual features. Therefore, excluding scaling and normalization does not detrimentally affect the model’s performance and simplifies preprocessing by eliminating unnecessary steps.
3.3 Model training
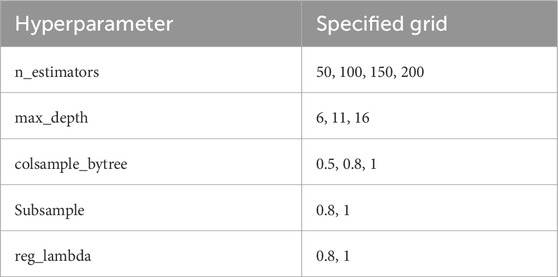
In this study, we developed site-specific XGBoost models based on reconnaissance data collected from four regions, each affected by a different hurricane. Note that we chose to develop site-specific models for each region instead of a generalized model because the site-specific models performed better, likely due to distinct structural feature trends in each region that make it difficult to create an accurate generalized model (Supplementary Table S1). A total of 220 XGBoost models were trained, considering 5-fold cross-validation with 11 structural features for four regions. For each XGBoost model, optimal hyperparameters were selected by performing grid searching based on the hyperparameter values listed in Table 4. Note that the range of each hyperparameter was selected based on preliminary tests that demonstrated high performance. The “n_estimators” represents the number of decision trees within XGBoost, and the ‘max_depth’ represents the maximum depth of each decision tree. The “colsample_bytree” and “subsample” determine the ratio of features and training data respectively when training each decision tree. The “reg_lambda” regulates L2 regularization by applying a penalty proportional to the square of the model’s weights, thus controlling the model’s complexity to prevent overfitting. During hyperparameter tuning, we chose not to use the balanced class weight option to assign equal importance to every observation. The optimal hyperparameters were selected based on the F1 score for the discrete variables and the
We employed a 5-fold cross-validation to mitigate potential bias in model evaluation. In other words, we partitioned the training set by randomly choosing 80% of the data, while allocating the remaining 20% of the data as the test set for each fold. Within the training dataset, 80% of the data was used for model training, and 20% of the training set was used as a validation set for hyperparameter tuning. The test dataset was used to evaluate the performance of the trained XGBoost models. Note that while there is no strict rule of thumb for the number of folds, 5-fold cross-validation is widely accepted and commonly used in similar studies due to its ability to provide a reliable estimate of model performance while not being overly computationally intensive. The sensitivity test on the number of folds confirmed that the XGBoost model performance did not vary significantly (Supplementary Tables S2, S3).
3.4 Performance evaluation
Once the XGBoost models were trained, we evaluated the model performance based on the test set, which was never used for training. For discrete structural features, the F1 score was used as a metric, one of the widely used indicators to measure the performance of binary and multiclass classification problems. F1 score represents the harmonic mean of precision and recall and is calculated with the following formula (Equations 1–3):
where TP represents the number of true positives, FP is the number of false positives, and FN is the number of false negatives. F1 score is calculated as a value between 0 and 1, and the model performance increases as it approaches 1. To calculate the F1 score for multiple classes, we aggregated the TP, FP, and FN values for all classes to compute the micro F1 score, which focuses on evaluating the overall model performance rather than the performance of individual classes. For continuous structural features,
where,
4 Results and discussion
4.1 XGBoost model performance
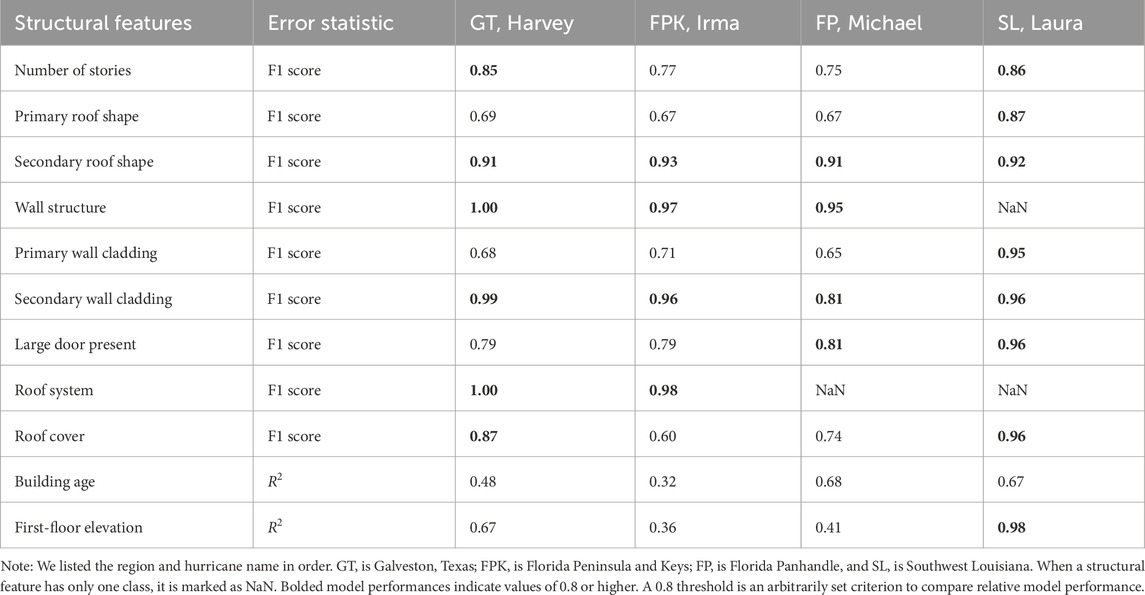
The performances of XGBoost models for each region affected by the four hurricanes are shown in Table 5. Among the discrete structural features, the secondary roof shape and the secondary wall cladding show high performance with F1 scores exceeding 0.8 for all regions (see bold numbers in Table 5). There were performance differences in XGBoost models depending on the region. Overall, the XGBoost models for Southwest Louisiana affected by Hurricane Laura outperformed those for the other regions, achieving F1 scores of 0.86 or higher for all discrete structural features. Note that the XGBoost models could not be trained for the wall structure and roof system for Southwest Louisiana because only one class was present. Similarly, the first-floor elevation of buildings in Southwest Louisiana shows an
Some of the results of Table 5 appear to be driven by common construction practices throughout the regions impacted by each hurricane. Homogeneous house archetypes resulting from common construction practices in specific regions make some features easier to predict. For example, for all regions except Southwest Louisiana, the model performance was higher for secondary roof shape and wall cladding compared to primary roof shape and wall cladding. This is related to the skewness of the dataset. While primary roof shape and wall cladding show a relatively diverse distribution across multiple classes without extreme skewness towards any single category (Supplementary Figures S13, S16), secondary roof shape and wall cladding are predominantly concentrated in the None class (Supplementary Figures S14, S17). Primary roof shape and primary wall cladding in Southwest Louisiana exhibited relatively homogeneous construction patterns compared to the other three regions (Supplementary Figures S13D, S16D). Consequently, these homogeneous patterns led to higher model performance. Furthermore, the model’s performance in estimating first-floor elevation was notably higher for Southwest Louisiana compared to other regions. Skewness of first-floor elevation data for Galveston, Texas, and the Florida Peninsula and Keys was relatively low (0.48 and 0.19, respectively; see Supplementary Figures S22A, S22B), whereas skewness for the Florida Panhandle and Southwest Louisiana was considerably higher (2.55 and 2.62, respectively; see Supplementary Figures S22C, S22D). This indicates that the most skewed distribution in Southwest Louisiana (where 89% of houses had slab on grade—a flat and horizontal concrete surface positioned at nearly the same level as the ground) contributed to the superior model performance among the four regions. However, even if the Florida Panhandle also had high skewness, the model performance was lower. This is likely due to differences in regional construction practices. In Southwest Louisiana, the model performance showed that the predominant use of slab on grade was strongly correlated with other building features, enabling the model to effectively learn and estimate first-floor elevation based on these patterns. Conversely, construction practices in the Florida Panhandle may lack similar uniformity, with slab on grade showing weaker associations with other structural features. This lack of clear relationships could hinder the model’s ability to accurately leverage skewness in estimating first-floor elevation, leading to observed lower performance despite high skewness. Therefore, the model performance of this study is influenced by the skewness of the target structural feature.
On top of that, the spatial distribution of building data introduces variability in house archetypes, affecting the model performance of certain features. The Florida Peninsula and Keys dataset was collected across the entire state of Florida, thus blending styles from the Florida Keys and both the East and West coasts of the peninsula—Detailed information about all reconnaissance data points was presented in Klepac et al. (2022). This creates variation in the distribution of construction styles, increasing the complexity of the model and resulting in relatively lower model performance. In comparison, the Galveston, Texas and Florida Panhandle datasets are relatively more concentrated in smaller coastal and inland areas with greater consistency in construction styles. The Laura dataset is even more concentrated along the southwest coast of Louisiana, where many buildings exhibit highly homogeneous construction features, which can be associated with the highest model performance.
4.2 Importance of geospatial, hazard, and damage level data
The geospatial, hazard, and damage level data were included as inputs for the XGBoost models, along with the known structural features. This inclusion is based on the hypothesis that these data can help estimate the missing structural features, as damage levels result not only from structural features (vulnerability) but also from geospatial characteristics (exposure) and hazard intensity. To validate this hypothesis, we trained an additional set of XGBoost models using only known structural features (referred to as “structural-only models”). We then compared the performance of these structural-only models with that of the XGBoost models (Table 5) that utilized all four types of data (referred to as “all-considered models”). As shown in Table 6, we found that the all-considered models outperformed the structural-only models for most of the structural features. Among all the discrete structural features, the F1 score for the number of stories improved significantly. For Southwest Louisiana, in particular, the F1 score increased noticeably from 0.70 to 0.86. For the continuous structural features, the building age demonstrated significant performance increases across all four regions in terms of
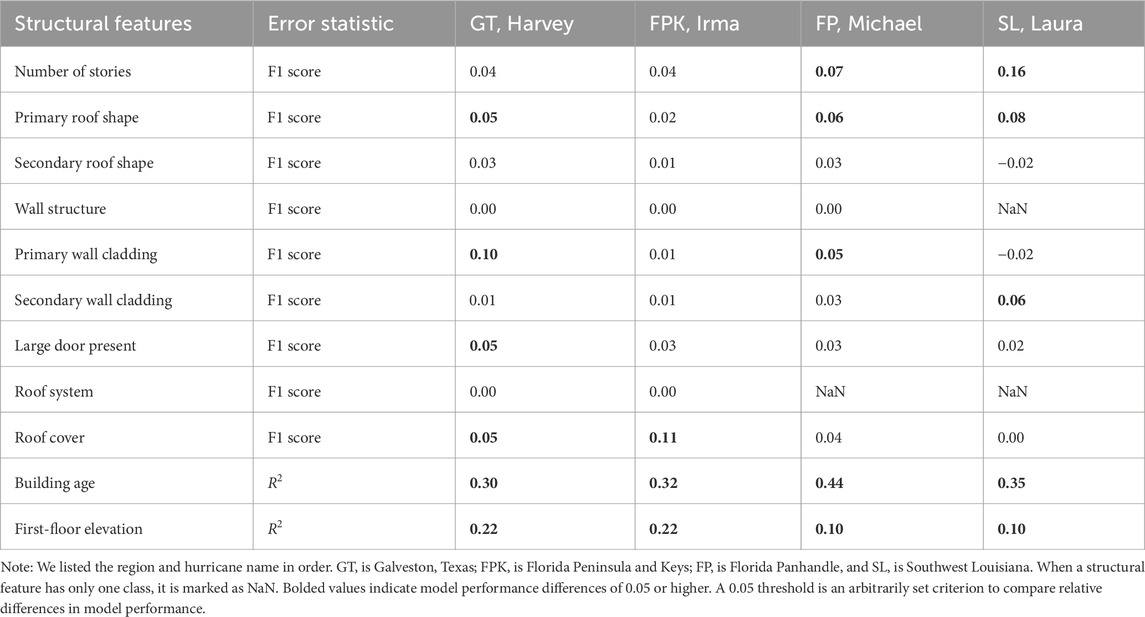
Table 6. Performance difference between the all-considered models and the structural-only models. All error statistics are calculated by subtracting the value of the structural-only model from the value of the all-considered model.
Figure 2 shows the confusion matrices and scatter plots for two structural features that demonstrated significant performance increases: the number of stories in Southwest Louisiana affected by Hurricane Laura and the building age in the Florida Panhandle affected by Hurricane Michael. For the number of stories, the proportion of incorrectly estimating a 1st-floor house (class: 1) as a second story over part of the house (class: 1.5) has decreased significantly after including the geospatial, hazard, and damage level data (see Figures 2A, B). For the building age, the estimated values of the all-considered model are more aligned to the 1:1 line than the estimated values of the structural-only model (see Figures 2C, D).
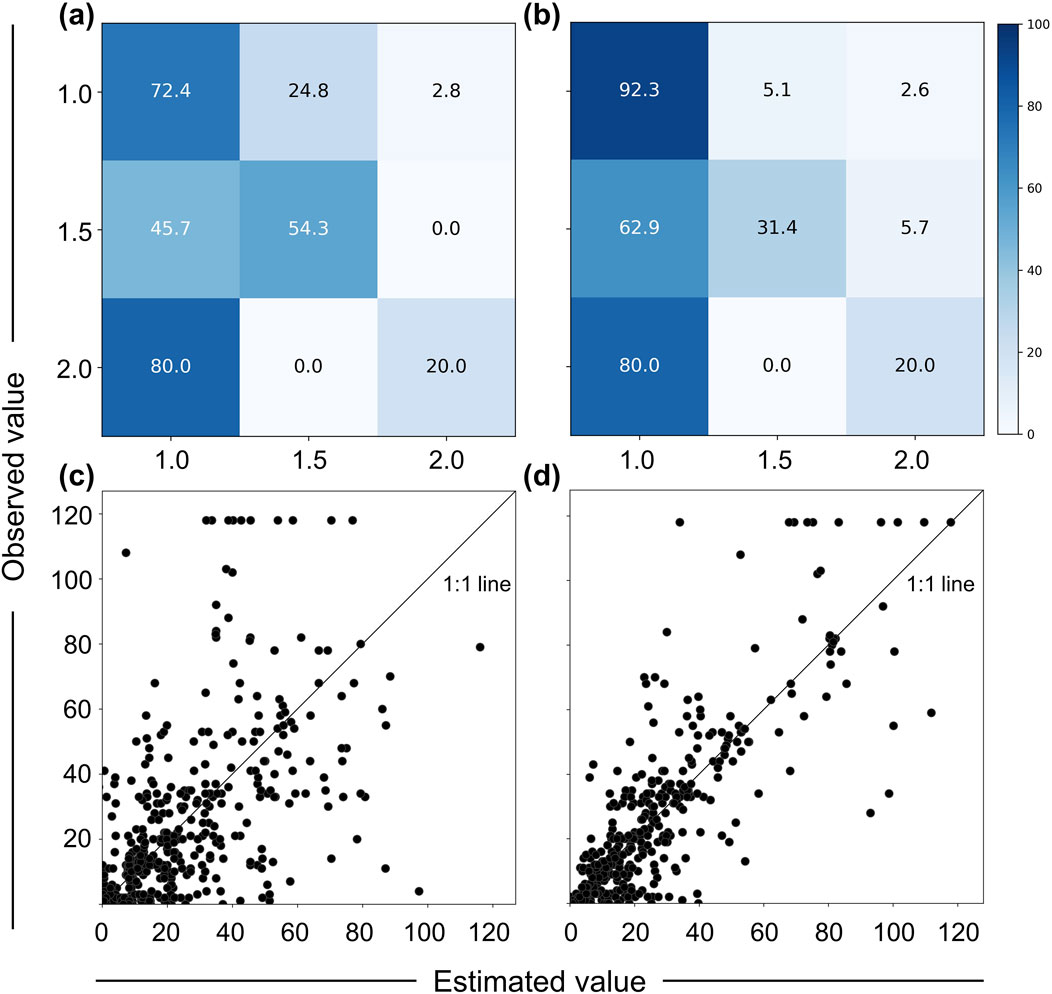
Figure 2. Comparison of performance between the structural-only models and the all-considered models. Upper: Confusion matrices for the “number of stories” of buildings in Southwest Louisiana: (A) structural-only model (F1 score: 0.7), and (B) all-considered model (F1 score: 0.86). Lower: Scatter plots for the “building age” of Florida Panhandle: (C) structural-only model (
However, not all structural features showed better performance with the all-considered models. No performance improvement was observed in the wall structure and roof system for all regions and in the roof cover of buildings in Southwest Louisiana. Additionally, the performance of the all-considered models was slightly lower than that of the structural-only models for the secondary roof shape and primary wall cladding of buildings in Southwest Louisiana affected by Hurricane Laura, with an F1 score difference of 0.02. This indicates that adding additional features does not always guarantee an increase in XGBoost model performance.
To evaluate the impact of the geospatial, hazard, and damage level data, we performed a feature importance analysis based on the all-considered models (Figure 3). After quantifying the importance of each feature, we aggregated the importance values for all geospatial, hazard, and damage level features. The feature importance was averaged across five cross-validations. Note that if the gross feature importance of the geospatial, hazard, and damage level data exceeds 50% (see the gray horizontal line in Figure 3), it indicates that these data types have a greater influence on the XGBoost model’s prediction process than the known structural features because the sum of the feature importance values equals one. The feature importance analysis results show that “building age” had the highest average feature importance and was the only feature to exceed 50% for the two regions. For “building age,” we observed similar trends in the degree of feature importance, along with the increased performance when geospatial, hazard, and damage level data were included (see Table 6). However, we did not find any other clear correlations between the performance differences shown in Table 6 and the feature importance analysis results. For example, the feature importance of the “wall structure” of the Florida Panhandle exceeds 50% but the performance of the all-considered model was the same as that of the structural-only model. The features that showed the lowest mean feature importance were “wall structure” and “roof system,” indicating that the geospatial, hazard, and damage level data are relatively less important for estimating these structural features. This result is supported by Table 6, which shows no performance improvement for “wall structure” and “roof system” after considering the geospatial, hazard, and damage level data.
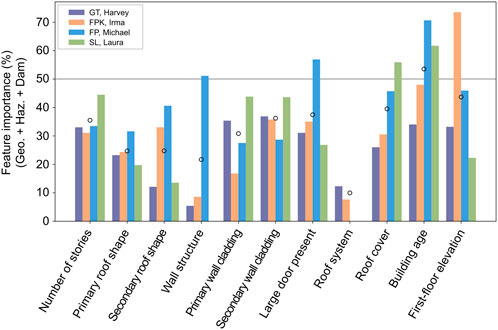
Figure 3. Gross feature importance of geospatial characteristics, hazard information, and damage level. The gray line represents a 50% feature importance. Note that the feature importance is zero for certain cases when there is only one class for the structural feature. The hollow dots represent the mean gross feature importance across the four regions. We listed the region and hurricane name in order. GT is Galveston, Texas, FPK is Florida Peninsula and Keys, FP is Florida Panhandle, and SL is Southwest Louisiana.
4.3 Multiple missing structural features
The proposed XGBoost modeling approach assumed that only one structural feature is missing and the other ten structural features are given, even though in reality, there could be two or more missing. In this section, we examined the frequency of missing structural features across all 3,796 reconnaissance datasets and assessed if our machine-learning approach can handle scenarios where multiple structural features are missing in a couple of cases. Note that the number of missing geospatial and hazard information was not considered as they could be quantified for any location using GIS software or published hazard observations and therefore did not have missing features.
The following analysis was performed to find the most dominant case where multiple structural features were missing. First, we examined the frequency distributions of the number of missing structural features for each region to determine the most common number of missing features (Figure 4). We found that the absence of a single structural feature is the most prevalent scenario. Among the observed data points with at least one missing feature, approximately 84.6%, 53.0%, and 58.3% had only one missing feature in Galveston, Texas, Florida Panhandle, and Southwest Louisiana, respectively. In contrast, the reconnaissance dataset in Florida Peninsula and Keys showed that approximately 74.4% of the data points (around 400 observations) had two missing structural features, making it the most dominant scenario. Therefore, we chose data collected in Florida Peninsula and Keys for subsequent analysis due to its distinctive characteristics compared to the other regions. Second, we analyzed the unique combinations of two missing structural features and their frequency for Florida Peninsula and Keys. The results show that the most dominant combination was the missing of both the “wall structure” and the “roof system,” accounting for 94.5% of the cases (Table 7).
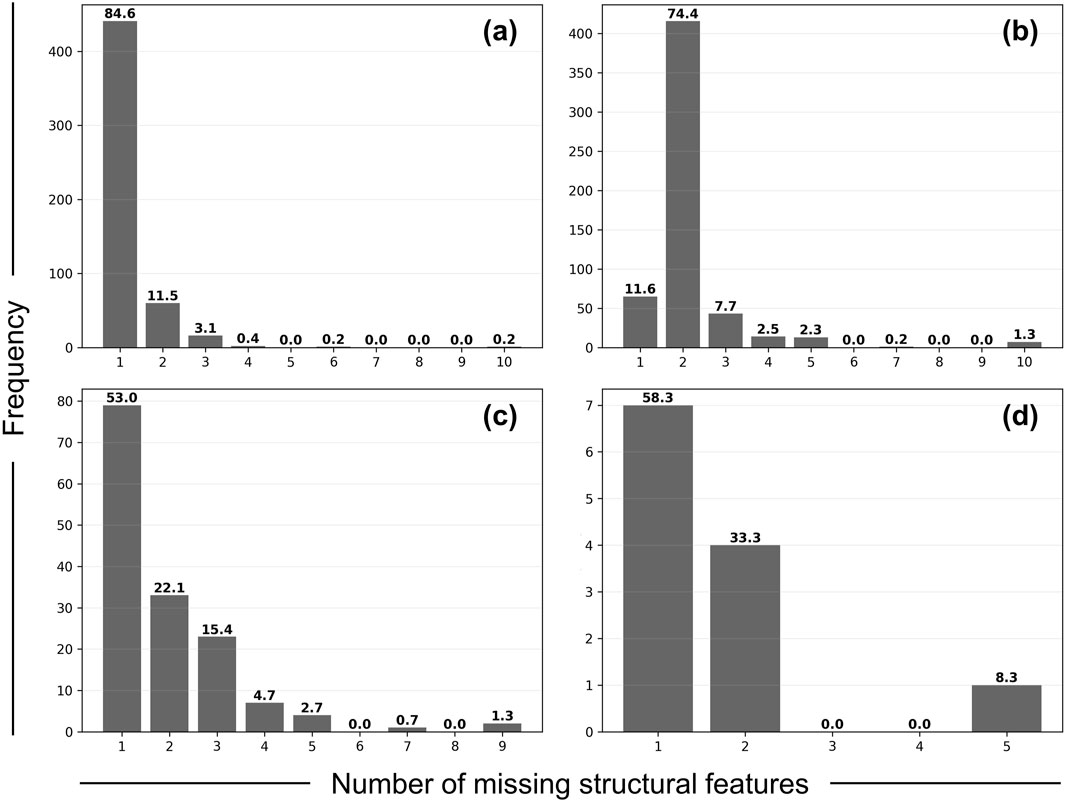
Figure 4. Frequency distributions of the number of missing structural features for four retions: (A) Galveston, Texas affected by Hurricane Harvey, (B) Florida Peninsula and Keys affected by Hurricane Irma, (C) Florida Panhandle affected by Hurricane Michael, and (D) Southwest Louisiana affected by Hurricane Laura. The numbers held on the histogram represent the relative percentage of frequency in percentage based on datasets that have a certain number of missing structural features.

Table 7. Unique combination of two missing structural features of buildings in Florida Peninsula and Keys affected by Hurricane Irma and their frequency.
For this dominant combination, we trained two XGBoost models, each aimed at estimating one of the missing structural features. All training processes, such as performing 5-fold cross-validation and grid search to determine the optimal hyperparameters for each model, were conducted as described in Section 3. The only difference from the XGBoost models developed in Section 3 is that another structural feature (either “wall structure” or “roof system”) is further removed from the input dataset. Once the models were trained, we analyzed how much XGBoost model performance deteriorates when there are two missing data compared to when there is only one (Table 8). The results indicate that the absence of the roof system significantly affects the estimation of the wall structure, leading to a 0.22 decrease in the F1 score. Similarly, when estimating the roof system, the absence of the wall structure has a notable impact, resulting in a 0.23 decrease in the F1 score.
To explain the difference in XGBoost model performance when an additional structural feature is missing (either “wall structure” or “roof system” for Florida Peninsula and Keys), we conducted a SHAP (SHapley Additive exPlanations) analysis (Shapley, 1953). This analysis assigns each feature an importance value, known as the SHAP value, representing its contribution to the prediction. Figure 5 presents one example of the SHAP analysis results in a waterfall plot, which illustrates the combined effect of all features on the prediction. The plot starts from the average model output and adds the SHAP values for each feature step-by-step. Positive SHAP values increase the probability of the given class being true in classification tasks. The y-axis illustrates the top nine classes that contribute the most to estimating each of the following wall structure classes: (a) Brick/Masonry, (b) Concrete/Wood, (c) Masonry/Concrete, (d) Masonry/Wood, and (e) Wood. We confirmed that input variables generally increase the probability of estimating the “Brick/Masonry” of wall structure as true for a given house, leading to a final probability of 0.99. On the other hand, when estimating the other four wall structure classes, most variables reduced the probability of these classes being estimated as true, resulting in all final probabilities being less than 0.18. The results show that the roof system classes had the most significant impact across all five classes of building wall structures (see red boxes in Figure 5). Similar results observed across the entire dataset indicate that the roof system plays a crucial role in accurately estimating the wall structure. Likewise, the estimation of the roof system was significantly influenced by the wall structure (see red box in Supplementary Figure S23).
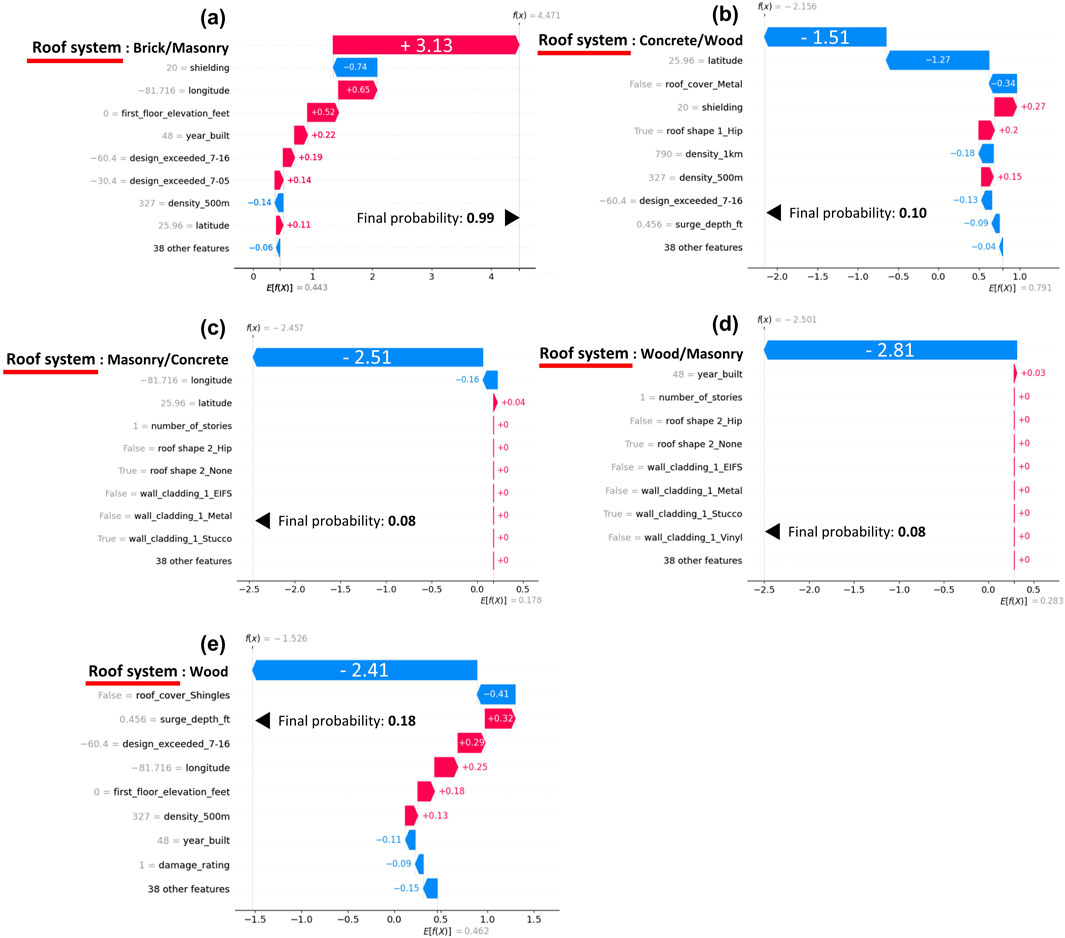
Figure 5. SHAP waterfall plots illustrating the prediction process of XGBoost models for five wall structure classes ((A) Brick/Masonry, (B) Concrete/Wood, (C) Masonry/Concrete, (D) Masonry/Wood, and (E) Wood). The x-axis represents the log-odds values, which are the natural logarithms of the ratio of the probability of an event occurring to the probability of it not occurring. The red bars show features that made the model more likely to predict the class as true, while the blue bars show features that made the model more likely to predict the class as false.
These results indicate that the wall structure and roof system significantly influence each other in the XGBoost prediction process, leading to a drop in model performance when both features are missing (Table 8). The significant influence between wall structure and roof system appears to be driven by common construction practices across the US, observed in all four regions affected by each hurricane. The wall structure and roof system predominantly use wood-frame construction. Additionally, it would be very unlikely (less than 5% of houses in a single dataset, and less than 1% among all datasets) that a house with wood-framed walls would not also have a wood-framed roof. These two features are inherently linked in US construction practices, demonstrating consistent characteristics that do not significantly vary in US single-family houses. Therefore, special care must be taken when applying this XGBoost modeling approach with more than one missing structural feature, as performance is unlikely to be as high as when only one structural feature is missing.
4.4 Impact of fully destroyed cases
Structural features of buildings with severe damage in reconnaissance data are sometimes difficult to collect accurately due to debris and other remnants, leading to an increase in data uncertainty (Xia et al., 2023). To determine whether excluding data from severely damaged buildings, which tends to have higher uncertainty, improves model performance, we trained XGBoost models without the fully destroyed cases and compared their performance to models trained on the full dataset (Supplementary Table S4). Out of 41 XGBoost models, only six showed a trivial performance improvement of 0.01 in the F1 score after excluding the fully destroyed cases. Otherwise, there was no performance change, and in some cases, performance worsened. These results suggest that the inclusion of destroyed properties did not negatively impact the model performance.
4.5 Study limitations
Building structural features are important in determining building damage and loss during hurricanes. However, some of these features such as primary roof shape, primary wall cladding, and building age, exhibit distributions with a relatively wider range of classes and values, which still pose challenges in accurately predicting missing features. Including these structural features, all the model performances presented in this study can be further enhanced through future research. One possible improvement is to enhance the hyperparameter tuning process. In this study, 220 XGBoost models were individually tuned using a simple grid search with 144 hyperparameter combinations. Despite setting the range of each hyperparameter based on preliminary tests showing high performance, the global optimum may have been missed. Future studies should explore a wider range of hyperparameters with tighter grids. Additionally, other hyperparameter tuning approaches, such as random search and Bayesian optimization, should be tested to reduce the computational cost of hyperparameter tuning.
Another potential improvement is to explore different machine learning algorithms, as this study only considered XGBoost. For example, a recent study introduced mixgb, an XGBoost-based multiple imputation method that combines subsampling and predictive mean matching to manage missing data in large, complex datasets, accurately reflecting model uncertainty and generating reliable imputations Deng and Lumley (2023). Furthermore, incorporating ensemble methods of various machine learning models to enhance the generalization performance of the model is also a significant direction for future research.
The goal of this study was to develop site-specific machine learning models and evaluate the combined influence of geospatial, hazard, and damage level data. Accordingly, our analysis focused on assessing the performance of the XGBoost model with respect to construction practices (Section 4.1) and the significance of geospatial, hazard, and damage level data (Section 4.2), rather than analyzing intercorrelations between individual features. Future research should investigate the impact of feature intercorrelations on model performance and assess feature independence. This analysis would aid feature engineering to improve model accuracy, reduce training time by lowering input dimensionality, and mitigate overfitting.
In this study, the trained models did not address all possible cases of missing structural features. We analyzed only one case with two missing structural features. However, the frequency distribution of missing structural features in the current dataset shows that 41.3% of the cases have two missing structural features, while 11.0% have three or more missing structural features among the data that have at least one missing value. This indicates a significant prevalence of multiple missing structural features. To reflect this, a more comprehensive modeling approach is necessary. For example, predicting two missing structural features requires considering all 55 combinations from the 11 structural features. If three structural features are missing, 165 combinations need to be considered. Therefore, research is needed to effectively develop models for these various missing combinations. Moreover, to improve the accuracy of each model, effective feature engineering should be conducted. Future research directions should include developing models that consider different missing combinations and identifying the optimal variables to maximize model performance.
5 Conclusion
We introduced an XGBoost approach to estimate missing structural features of damaged buildings from the reconnaissance datasets. A total of 220 XGBoost models were trained, considering four regions, 11 structural features, and 5-fold cross-validation. The results showed F1 scores between 0.65 and 1.00 for nine discrete structural features and
1. Although the same XGBoost modeling approach was applied, the performance of the XGBoost models varied depending on each region. The XGBoost models for Southwest Louisiana affected by Hurricane Laura outperformed others, achieving F1 scores above 0.86 for all discrete structural features. This is because datasets of Southwest Louisiana showed more homogeneous construction patterns.
2. Including geospatial, hazard, and damage level data in the training set improved XGBoost model performance, increasing the F1 score by up to 0.16 for discrete features and
3. Feature importance analysis revealed that geospatial, hazard, and damage level data contributed between 10% and 54% on average to reconstructing missing structural features among four regions.
4. SHAP analysis revealed that if structural features that significantly influence each other are missing simultaneously, the performance of the XGBoost model can decrease.
5. While this XGBoost approach may not accurately predict all missing structural features, we believe it has the potential to support post-hurricane building damage assessments by suggesting the most likely values for building details that are not present in the reconnaissance data.
Data availability statement
The original contributions presented in the study are included in the article/Supplementary Material, further inquiries can be directed to the corresponding author.
Author contributions
HY: Conceptualization, Methodology, Resources, Writing–original draft, Writing–review and editing, Data curation, Formal Analysis, Investigation, Validation, Visualization. J-WL: Conceptualization, Methodology, Resources, Writing–original draft, Writing–review and editing, Funding acquisition, Project administration, Supervision. SK: Data curation, Writing–review and editing. AUS: Data curation, Writing–review and editing. AS: Writing–review and editing. JJ: Writing–review and editing.
Funding
The author(s) declare that financial support was received for the research, authorship, and/or publication of this article. This research is supported by the Good Systems Grand Challenge at the University of Texas at Austin and the University of Texas at Austin Startup Grant. Additional funding for student support in data processing comes from the National Oceanographic Partnership Program (NOPP) (Project Grant N00014-21-1-2203).
Acknowledgments
The authors acknowledge the Texas Advanced Computing Center (TACC) at The University of Texas at Austin for providing HPC resources that have contributed to the research results reported within this paper (URL: http://www.tacc.utexas.edu). The authors gratefully acknowledge the NSF-funded Natural Hazard Engineering Research Infrastructure (NHERI) DesignSafe for hosting most of the data utilized in this study (URL: https://designsafe-ci.org/), and the Structural Extreme Events Reconnaissance (StEER) network for providing information on the reconnaissance data production.
Conflict of interest
The authors declare that the research was conducted in the absence of any commercial or financial relationships that could be construed as a potential conflict of interest.
Publisher’s note
All claims expressed in this article are solely those of the authors and do not necessarily represent those of their affiliated organizations, or those of the publisher, the editors and the reviewers. Any product that may be evaluated in this article, or claim that may be made by its manufacturer, is not guaranteed or endorsed by the publisher.
Supplementary material
The Supplementary Material for this article can be found online at: https://www.frontiersin.org/articles/10.3389/fbuil.2024.1444001/full#supplementary-material
References
Alidoost, F., and Arefi, H. (2018). A CNN-based approach for automatic building detection and recognition of roof types using a single aerial image. PFG–Journal Photogrammetry, Remote Sens. Geoinformation Sci. 86, 235–248. doi:10.1007/s41064-018-0060-5
Alshboul, O., Shehadeh, A., Almasabha, G., and Almuflih, A. S. (2022). Extreme gradient boosting-based machine learning approach for green building cost prediction. Sustainability 14, 6651. doi:10.3390/su14116651
Applied Research Associates (2017a). Hurricane Harvey rapid response windfield estimate. Available at: https://www.nhc.noaa.gov/data/tcr/AL092017_Harvey.pdf (Accessed September 1, 2017).
Applied Research Associates (2017b). Hurricane Irma rapid response windfield estimate. Available at: https://en.wikipedia.org/wiki/Hurricane_Irma (Accessed September 13, 2017).
Applied Research Associates (2018). Hurricane Michael rapid response windfield estimate. Available at: https://en.wikipedia.org/wiki/Hurricane_Michael (Accessed October 10, 2018).
Applied Research Associates (2020). Hurricane Laura rapid response windfield estimate. Available at: https://storymaps.arcgis.com/stories/87129878b5b242a68bbec8f5729cfd1b (Accessed August 27, 2020).
ASCE (2017). Minimum design loads and associated criteria for buildings and other structures, 7-16. Reston, VA: American Society of Civil Engineers.
Balaguru, K., Xu, W., Chang, C.-C., Leung, L. R., Judi, D. R., Hagos, S. M., et al. (2023). Increased US coastal hurricane risk under climate change. Sci. Adv. 9, eadf0259. doi:10.1126/sciadv.adf0259
Berman, J. W., Wartman, J., Olsen, M., Irish, J. L., Miles, S. B., Tanner, T., et al. (2020). Natural hazards reconnaissance with the NHERI RAPID facility. Front. Built Environ. 6, 573067. doi:10.3389/fbuil.2020.573067
Buyukdemircioglu, M., Can, R., and Kocaman, S. (2021). Deep learning based roof type classification using very high resolution aerial imagery. Int. Archives Photogrammetry, Remote Sens. Spatial Inf. Sci. 43, 55–60. doi:10.5194/isprs-archives-xliii-b3-2021-55-2021
Chen, T., and Guestrin, C. (2016). XGBoost: a scalable tree boosting system. Proc. 22nd acm sigkdd Int. Conf. Knowl. Discov. data Min., 785–794. doi:10.1145/2939672.2939785
Chen, Z. (2018). The application of tree-based model to unbalanced German credit data analysis. MATEC Web Conf. 232, 01005. doi:10.1051/matecconf/201823201005
Deng, Y., and Lumley, T. (2023). Multiple imputation through XGBoost. J. Comput. Graph. Statistics 33, 352–363. doi:10.1080/10618600.2023.2252501
FEMA (2017a). Hurricane Harvey FEMA coastal surge depth grid. Available at: http://www.hydroshare.org/resource/e8768f4cb4d5478a96d2b1cbd00d9e85 (Accessed September 10, 2017).
FEMA (2017b). Hurricane Irma FEMA coastal surge depth grid. Available at: https://data.amerigeoss.org/dataset/hurricane-irma-depth-grid-download (Accessed August 17, 2017).
FEMA (2018). Hurricane Michael preliminary FEMA coastal surge depth grid. Available at: https://view.officeapps.live.com/op/view.aspx?src=https%3A%2F%2Fs3.amazonaws.com%2Ffema-femadata%2FNationalDisasters%2F2018%2FHurricaneMichael%2FData%2FFEMA_ModeledSurge%2FMichael_Preliminary_CoastalDepthGridProduction_Documentation_Draft_20181012.docx&wdOrigin=BROWSELINK (Accessed October 12, 2018).
FEMA (2022). USA structures. Available at: https://gis-fema.hub.arcgis.com/pages/usa-structure (Accessed March 28, 2022).
Freeman, A. C., and Ashley, W. S. (2017). Changes in the US hurricane disaster landscape: the relationship between risk and exposure. Nat. hazards 88, 659–682. doi:10.1007/s11069-017-2885-4
Hancock, J. T., and Khoshgoftaar, T. M. (2020). Survey on categorical data for neural networks. J. Big Data 7, 28–41. doi:10.1186/s40537-020-00305-w
Kijewski-Correa, T., Gong, J., Womble, A., Kennedy, A., Cai, S. C., Cleary, J., et al. (2018a). Hurricane Harvey (Texas) supplement – collaborative research: Geotechnical extreme events reconnaissance (GEER) association: turning disaster into knowledge. doi:10.17603/DS2Q38J
Kijewski-Correa, T., Roueche, D., Pinelli, J.-P., Prevatt, D., Zisis, I., Gurley, K., et al. (2018b). RAPID: a coordinated structural engineering response to Hurricane Irma (in Florida). doi:10.17603/DS2TX0C
Kim, S. K., and Peiser, R. B. (2020). The implication of the increase in storm frequency and intensity to coastal housing markets. J. Flood Risk Manag. 13, e12626. doi:10.1111/jfr3.12626
Klepac, S., Subgranon, A., and Olabarrieta, M. (2022). A case study and parametric analysis of predicting hurricane-induced building damage using data-driven machine learning approach. Front. Built Environ. 8, 1015804. doi:10.3389/fbuil.2022.1015804
Klotzbach, P. J., Bowen, S. G., Pielke, R., and Bell, M. (2018). Continental US hurricane landfall frequency and associated damage: observations and future risks. Bull. Am. Meteorological Soc. 99, 1359–1376. doi:10.1175/bams-d-17-0184.1
Landsea, C. W., and Franklin, J. L. (2013). Atlantic hurricane database uncertainty and presentation of a new database format. Mon. Weather Rev. 141, 3576–3592. doi:10.1175/mwr-d-12-00254.1
Lenjani, A., Dyke, S. J., Bilionis, I., Yeum, C. M., Kamiya, K., Choi, J., et al. (2020). Towards fully automated post-event data collection and analysis: pre-event and post-event information fusion. Eng. Struct. 208, 109884. doi:10.1016/j.engstruct.2019.109884
Macabuag, J., Rossetto, T., Ioannou, I., Suppasri, A., Sugawara, D., Adriano, B., et al. (2016). A proposed methodology for deriving tsunami fragility functions for buildings using optimum intensity measures. Nat. Hazards 84, 1257–1285. doi:10.1007/s11069-016-2485-8
Massarra, C. C., Friedland, C. J., Marx, B. D., and Dietrich, J. C. (2020). Binary building attribute imputation, evaluation, and comparison approaches for hurricane damage data sets. J. Perform. Constr. Facil. 34, 04020036. doi:10.1061/(ASCE)CF.1943-5509.0001433
Mohajeri, N., Assouline, D., Guiboud, B., Bill, A., Gudmundsson, A., and Scartezzini, J.-L. (2018). A city-scale roof shape classification using machine learning for solar energy applications. Renew. Energy 121, 81–93. doi:10.1016/j.renene.2017.12.096
Pielke, R. A., Gratz, J., Landsea, C. W., Collins, D., Saunders, M. A., and Musulin, R. (2008). Normalized hurricane damage in the United States: 1900–2005. Nat. hazards Rev. 9, 29–42. doi:10.1061/(asce)1527-6988(2008)9:1(29)
Pita, G., Francis, R., Liu, Z., Mitrani-Reiser, J., Guikema, S., and Pinelli, J.-P. (2011). Statistical tools for populating/predicting input data of risk analysis models. Vulnerability, Uncertain. Risk Analysis, Model. Manag., 468–476. doi:10.1061/41170(400)57
Ro, S. H., Li, Y., and Gong, J. (2024). A machine learning approach for post-disaster data curation. Adv. Eng. Inf. 60, 102427. doi:10.1016/j.aei.2024.102427
Roueche, D., Kameshwar, S., Vorce, M., Kijewski-Correa, T., Marshall, J., Mashrur, N., et al. (2021). Field assessment structural teams: FAST-1, FAST-2, FAST-3. doi:10.17603/DS2-DHA4-G845
Roueche, D., Kijewski-Correa, T., Cleary, J., Gurley, K., Marshall, J., Pinelli, J.-P., et al. (2020). StEER field assessment structural team (FAST). doi:10.17603/DS2-5AEJ-E227
Roueche, D., Kijewski-Correa, T., Mosalam, K., Prevatt, D. O., and Robertson, I. (2019). Virtual assessment structural team (VAST) handbook: data enrichment and quality control (DE/QC) for US windstorms version 2.0. Steer. Netw., 24–25.
Roueche, D. B., Lombardo, F. T., Krupar, I. I. I., Richard, J., and Smith, D. J. (2018). Collection of perishable data on wind- and surge-induced residential building damage during hurricane Harvey (TX). doi:10.17603/DS2DX22
Shapley, L. S. (1953). “A value for n-person games,” in Contributions to the theory of games. Editors H. Kuhn, and A. Tucker (Princeton University Press), 307–317.
Shi, N., Li, Y., Wen, L., and Zhang, Y. (2022). Rapid prediction of landslide dam stability considering the missing data using XGBoost algorithm. Landslides 19, 2951–2963. doi:10.1007/s10346-022-01947-y
Vickery, P. J., Skerlj, P. F., Lin, J., Twisdale, L. A., Young, M. A., and Lavelle, F. M. (2006). HAZUS-MH hurricane model methodology. II: damage and loss estimation. Nat. Hazards Rev. 7, 94–103. doi:10.1061/(asce)1527-6988(2006)7:2(94)
Wang, C. (2021). Nheri-simcenter/surf: v1.0. Available at: https://zenodo.org/records/4521805 (Accessed February 9, 2021).
Wartman, J., Berman, J. W., Bostrom, A., Miles, S., Olsen, M., Gurley, K., et al. (2020). Research needs, challenges, and strategic approaches for natural hazards and disaster reconnaissance. Front. Built Environ. 6, 573068. doi:10.3389/fbuil.2020.573068
Weinkle, J., Landsea, C., Collins, D., Musulin, R., Crompton, R. P., Klotzbach, P. J., et al. (2018). Normalized hurricane damage in the continental United States 1900–2017. Nat. Sustain. 1, 808–813. doi:10.1038/s41893-018-0165-2
Xia, H., Wu, J., Yao, J., Zhu, H., Gong, A., Yang, J., et al. (2023). A deep learning application for building damage assessment using ultra-high-resolution remote sensing imagery in Turkey earthquake. Int. J. Disaster Risk Sci. 14, 947–962. doi:10.1007/s13753-023-00526-6
Yagci Sokat, K., Dolinskaya, I. S., Smilowitz, K., and Bank, R. (2018). Incomplete information imputation in limited data environments with application to disaster response. Eur. J. Operational Res. 269, 466–485. doi:10.1016/j.ejor.2018.02.016
Yu, L., Zhou, R., Chen, R., and Lai, K. K. (2022). Missing data preprocessing in credit classification: one-hot encoding or imputation? Emerg. Mark. Finance Trade 58, 472–482. doi:10.1080/1540496x.2020.1825935
Yu, Q., Wang, C., Cetiner, B., Yu, S., Mckenna, F., Taciroglu, E., et al. (2019). Building information modeling and classification by visual learning at a city scale. doi:10.5281/ZENODO.3996808
Keywords: natural hazard, reconnaissance, coastal region, structural features, machine-learning
Citation: Yang H, Lee J-W, Klepac S, Santos Cruz AU, Subgranon A and Jiao J (2024) Reconstructing missing data of damaged buildings from post-hurricane reconnaissance data using XGBoost. Front. Built Environ. 10:1444001. doi: 10.3389/fbuil.2024.1444001
Received: 04 June 2024; Accepted: 05 December 2024;
Published: 23 December 2024.
Edited by:
Nobuhito Mori, Kyoto University, JapanReviewed by:
Tracy Lynn Kijewski-Correa, University of Notre Dame, United StatesKenneth E. Okedu, Melbourne Institute of Technology, Australia
Takuya Miyashita, Kyoto University, Japan
Copyright © 2024 Yang, Lee, Klepac, Santos Cruz, Subgranon and Jiao. This is an open-access article distributed under the terms of the Creative Commons Attribution License (CC BY). The use, distribution or reproduction in other forums is permitted, provided the original author(s) and the copyright owner(s) are credited and that the original publication in this journal is cited, in accordance with accepted academic practice. No use, distribution or reproduction is permitted which does not comply with these terms.
*Correspondence: Jun-Whan Lee, anVud2hhbmxlZUBhdXN0aW4udXRleGFzLmVkdQ==
 Hyunje Yang
 Jun-Whan Lee
 Steven Klepac
 Armando Ulises Santos Cruz1
 Arthriya Subgranon