 Van Qui Lai1,2
 Kongtawan Sangjinda3
 Suraparb Keawsawasvong3*
 Alireza Eskandarinejad4
 Vinay Bhushan Chauhan5Worathep Sae-Long6
 Suchart Limkatanyu7
- 1Faculty of Civil Engineering, Ho Chi Minh City University of Technology (HCMUT), Ho Chi Minh City, Vietnam
- 2Vietnam National University Ho Chi Minh City (VNU-HCM), Ho Chi Minh City, Vietnam
- 3Department of Civil Engineering, Thammasat School of Engineering, Thammasat University, Bangkok, Thailand
- 4Department of Civil Engineering, Faculty of Engineering, Golestan University, Gorgan, Iran
- 5Civil Engineering Department, Madan Mohan Malaviya University of Technology, Gorakhpur, India
- 6Civil Engineering Program, School of Engineering, University of Phayao, Muang Phayao, Thailand
- 7Department of Civil and Environmental Engineering, Faculty of Engineering, Prince of Songkla University, Songkhla, Thailand
In this study, the Multivariate Adaptive Regression Splines (MARS) model is employed to create a data-driven prediction for the bearing capacity of a strip footing on rock mass subjected to an inclined and eccentric load. The strengths of rock masses are based on the Hoek-Brown failure criterion. To develop the set of training data in MARS, the lower and upper bound finite element limit analysis (FELA) is carried out to obtain the numerical results of the bearing capacity of a strip footing with the width of B. There are six considered dimensionless variables, including the geological strength index (GSI), the rock constant/yield parameter (mi), the dimensionless strength (γB/σci), the adhesion factor (α), load inclined angle from the vertical axis (β), and the eccentricity of load (e/B). A total of 5,120 FELA solutions of the bearing capacity factor (P/σciB) are obtained and used as a training data set. The influences of all dimensionless variables on the bearing capacity factors and the failure mechanisms are investigated and discussed in detail. The sensitivity analysis of these dimensionless variables is also examined.
Introduction
The bearing capacity factors of vertically loaded foundations on Mohr-Coulomb (MC) soil is determined using Terzaghi’s bearing capacity equation (Terzaghi, 1943), which combines the effects of soil cohesion and soil unit weight, and surcharge. However, it is an idealistic example and a massive simplification to imagine a foundation with simply a vertical force acting on it at its center. Generally, in addition to the vertical load from the self-weight of multistory buildings, the horizontal load from wind or suspended slab floors can be transmitted to foundations. In addition, the position of load might not be precisely applied in the middle of the foundation. As a result, the considerations of both inclination and eccentricity of applied load should be taken into account, especially for uncommon structures that are commonly subjected to a lateral force with an eccentric length such as the foundations of offshore platforms, transmission towers, bridges, or wind turbines.
The previous classic works considering the bearing capacity of foundations subjected to eccentric and inclined loads were introduced by Meyerhof (1953; 1963), Hansen (1970), and Vesic (1975) by modifying the basic Terzaghi’s bearing capacity equation. These previous studies analyzed the inclination and eccentricity factors by employing the limit-equilibrium or slip-line methods. With the development of computational techniques, various numerical methods such as Finite Element Analysis (FEA) were carried out by Taiebat and Carter (2002) and Loukidis et al. (2008) to propose the solutions to the bearing capacity factor for footings under eccentric loading on cohesive and cohesionless soils, respectively. Zheng et al. (2019a) employed the discontinuity layout optimization procedure to solve the bearing capacity solutions for strip foundations on two-layered soils subjected to inclined load. Another numerical technique, Finite Element Limit Analysis (FELA), was also used by Hjiaj et al. (2004) to investigate the bearing capacity of foundations on cohesive-frictional soils by accounting for the effects of both inclination and eccentricity factors. Krabbenhoft et al. (2012; 2014) employed the same numerical technique to evaluate the lower bound solutions of footings on cohesionless soils under eccentrical loading.
It is well-known that the MC failure criterion was developed by utilizing the linear function of the major and minor effective principal stresses (σ1 and σ3). However, for various types of rock masses, the linear equation of the MC model is quite not applicable to capture the nonlinear relationship between σ1 and σ3. Even though fitting an average linear relationship of the MC model to the nonlinear curve of tested intact rocks may be capable of creating an approximation of straight lines with a tension cut-off to capture the nonlinear curve of tested rock data, a large discrepancy between the fitting linear MC plot and the nonlinear curve of tested intact rocks can be commonly observed. The nonlinear failure criterion developed by Hoek and Brown (1980) and upgraded by Hoek et al. (2002) is generally known as Hoek-Brown (HB) failure criterion. Several researchers have widely employed this HB criterion to produce various stability solutions for many rock engineering problems in the past. For the studies of vertically loaded foundations on rock masses, the bearing capacity solutions to this problem have been proposed by many previous studies (e.g., Serrano and Olalla, 1994; Serrano and Olalla, 1998a; Serrano and Olalla, 1998b; Serrano et al., 2000; Yang and Yin, 2005; Merifield et al., 2006; Saada et al., 2008; Birid and Choudhury, 2021; Keawsawasvong, 2021; Yodsomjai et al., 2021; Keawsawasvong et al., 2022a; Jaiswal and Chauhan 2022; Roy and Koul, 2022). Nevertheless, investigating the bearing capacity factors for footings on rock masses under inclined and eccentric loading is quite limited. To the best of authors’ knowledge, only Chihi and Saada (2022) and Keawsawasvong et al. (2021) considered this problem by employing the kinematic approach of limit analysis theory and the FELA to perform the results of footings on rock masses under inclined and eccentric loading. The influence of the adhesion factor, which is responsible for lowering the shear strength at the interface between footings and rocks, has not been looked into or explored in their studies, though. In addition, the full possible range of the ratio between rock strengths and rock unit weight has never been considered in Chihi and Saada (2022) and Keawsawasvong et al. (2021).
The problem definition of a strip footing resting on rock mass under inclined and eccentric loading is shown in Figure 1. The footing is rigid, has a width of B, and is subjected to the ultimate load (P) with an inclination angle, β (measured from vertical axis) and an eccentric length of e. The rock is set to obey the HB failure criterion and has a unit weight of γ. The strength parameters for the HB model are described later in the next section. At the contact area between footing and rock, the adhesion factor is typically defined at the interface and ranges from 0 (smooth) to 1 (rough). After computing all results, some selected results of bearing capacity solutions and predicted failure mechanisms are presented in this paper to portray the effects of dimensionless HB strength parameters, the inclination angle, the eccentric length, and the adhesion factor. Due to the complex coupling effects among multi-design parameters, it is useful for practical engineering to know the impact of each input parameter on output results. An innovative machine learning regression approach is established based on the Multivariate Adaptive Regression splines (MARS) model to analysis the sensitivity of the input parameters. Moreover, an empirical design equation for predicting the bearing capacity factors is developed from the proposed MARS model. These two things can be the theory guideline and convenient tool for geotechnical practitioners. On another hand, compare to using the numerical model which requires a mount of money for software and a certain knowledge for running computer software, the results from MARS in this paper is so quick and useful for geotechnical practitioners.
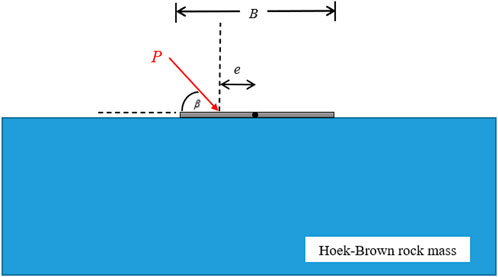
FIGURE 1. Problem definition of foundation on the rock mass.
Problem statement
Hoek and Brown (1980) established an empirical yield criterion for jointed rock masses by employing triaxial experimental results of intact and jointed rocks. Note that the widely used model, the 2002 version, now includes the effect of heavily fractured rocks (Hoek et al., 2002). The HB yield criterion can be represented mathematically as a function of the major and minor effective principal stresses (σ1 and σ3) in the following equations:
where σci is the strength of the intact rock mass obtained from a uniaxial compression test; GSI is the Geological Strength Index; mi is the yield parameter; D is the disturbance factor related to impact damage and rock mass stress reduction. In this study, D is set to be zero according to the assumption of undisturbed in-situ rock masses. In addition, s, a, and mb are the empirical parameters determined from GSI and D. Note that a is the exponential term of the HB failure equation that GSI can significantly influence. When GSI is less than 30, this exponential term becomes significantly higher than 0.5 resulting in the difficulty in the optimization technique of FELA with the HB yield criterion. To ensure the stable of the solutions, several researchers have limited the lowest value of GSI to be 30 which is also the selected range of GSI in this study (GSI = 30–100).
This study has eight input variables: width of footing B, the unit weight of rock mass γ, the intact rock strength σci, the Geological Strength Index GSI, the yield parameter mi, load inclination angle β, loading eccentric length e, and the adhesion factor α. A dimensionless technique is employed in the analysis to reduce these input parameters. As a result, for the output of the ultimate force P, the bearing capacity factor (P/σciB) for this problem is defined by normalizing the ultimate force by the intact rock strength σci and the width of footing B. The function between the output parameter (P/σciB) and all six dimensionless input parameters can be stated as follows:
where e/B is the dimensionless eccentricity and γB/σci is the dimensionless strength. Mention that GSI, mi, β, and α are inherently dimensionless variables that do not require normalisation. The possible ranges of all these parameters are summarised in Table 1. Note that these ranks are selected according to the recommendations by Merifield et al. (2006), Keawsawasvong et al. (2021), and Yang and Yin (2005).
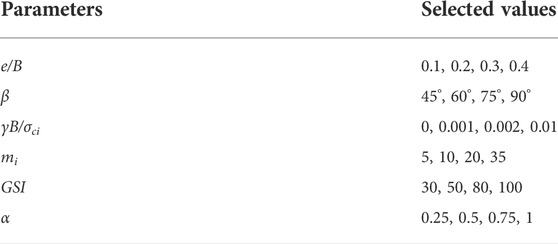
TABLE 1. List of parametric values used for modelling the load on footing and Hoek-Brown material.
Numerical methods
The new stability solutions to the bearing capacity of strip footing on Hoek-Brown rock mass under inclination and eccentric load are obtained utilizing the lower bound (LB) and upper bound (UB) finite element limit analysis (FELA) techniques (Sloan, 2013; Krishnan et al., 2019; Ukritchon et al., 2019, 2020; Keawsawasvong and Ukritchon, 2021, 2022; Kumar and Chauhan 2022). The computation is performed with the OptumG2 finite element program (Krabbenhoft et al., 2015). In OptumG2, upper bound (UB) analysis is implemented with a six-noded triangle element such that each node contains two undetermined velocities. The upper bound analysis incorporates compatibility equations and velocity boundary conditions, which can be used to optimize the limit load on foundations. Besides, a three-noded triangular element with three undetermined stresses is employed in the lower bound (LB) analysis. The lower bound assessment aims to optimize the limit force of foundations by applying equilibrium equations that impose stress boundary conditions and no violation of the yield criteria. Note that OptumG2 has been employed in several previous works to perform various geotechnical stability problems (e.g., Keawsawasvong and Ukritchon, 2019a; Keawsawasvong and Ukritchon, 2019b; Ukritchon and Keawsawasvong, 2019; Keawsawasvong and Ukritchon, 2020; Srivastava and Chauhan 2020; Yodsomjai et al., 2021a; Yodsomjai et al., 2021b; Chauhan, 2021; Keawsawasvong and Lai, 2021; Keawsawasvong et al., 2022b; Chauhan et al., 2022; Keawsawasvong et al., 2022c; Eskandarinejad, 2022).
Figure 2 shows a computational model of a rigid strip footing on a rock mass simulated using OptumG2. In FELA, a rigid plate element is used to simulate a footing, while a triangular solid element made of HB materials is used to simulate an underlying rock. The roughness (or adhesion factor α) at the plate-rock contact varies from 0.25 to 1. Note that the smooth case is not considered since the limit force of a footing with α = 0 cannot be computed because the smooth footing cannot resist the horizontal force induced from the inclination angle. A single point force P with an angle of inclination β and eccentricity e/B is imparted on the footing.
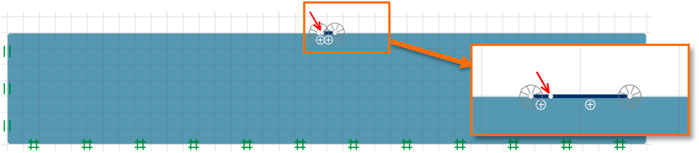
FIGURE 2. Numerical model used for FELA analysis of bearing on the rock with β = 60° and e/B = 0.3.
Additionally, fan meshes are employed at the edges of footings to acquire more precise bound solutions. The ultimate force P is calculated using UB and LB FELA to generate the outcome. The force is then normalized later to be the bearing capacity factor (P/σciB) which is the dimensionless output parameter in this study.
To improve the accuracy and correctness of the computed bound solutions, the adaptive meshing technique based on the Ciria et al. (2008) scheme is implemented in all numerical studies. Accordingly, the number of elements is automatically increased in the zones containing large plastic shear strains so that the computational efficiency of all simulations is significantly improved. After a few iteration steps, the differences between UB and LB solutions become smaller, thus yielding the tighter UB and LB solutions. In this study, the adaptive meshing method is set up so that in the first stage, an initial mesh of typically 3,000 elements is formed, followed by three phases of mesh adaptivity to reach a final mesh of 5,000 elements. Figure 3 illustrates an example of typical adaptive meshes after three iteration steps. It can be seen that the number of meshes significantly increases in the zone containing large plastic shear strains, which can show the slip line of the footing failure.
FIGURE 3. Final adaptive meshes of bearing on the rock with β = 60° and e/B = 0.3.
Numerical results and discussion
Verification
It is crucial to validate the established numerical model before undertaking any parametric studies. The bearing capacity factors for the cases of γB/σci = 0, β = 90°, e/B = 0, and α = 1 are used to compare the findings to those reported earlier by Serrano et al. (2000) using the elasto-plastic displacement-based finite element approach and Merifield et al. (2006) using the FELA. Both upper bound (UB) and lower bound (LB) solutions obtained from the present study are averaged (AVG = (UB + LB)/2) and then used to make the comparison. It can be seen from Table 2 that an excellent agreement can be found between the present study and the previously published solutions, with the percentage errors being less than 5% for all values.
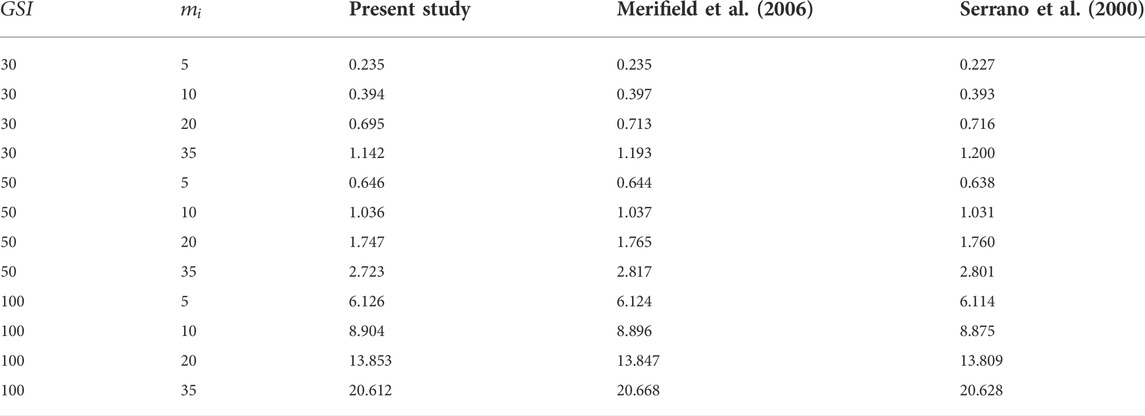
TABLE 2. Bearing capacity comparison of a footing on rock mass with γB/σci = 0, β = 90°, e/B = 0, and α = 1.
Failure mechanisms
The failure mechanisms of strip foundations on rock masses considering the angle of inclination β, eccentricity e/B, and adhesion factor α are presented next. It should be noted that the UB and LB failure mechanisms are slightly different. As a result, only UB cases are employed in this paper to portray the impacts of all considered dimensionless parameters for brevity. The shear dissipations for various cases of β are shown in Figure 4 in which β = 45, 60, and 90°; e/B = 0.3; GSI = 100; mi = 5; γB/σci = 0; and α = 1. From Figure 4, it is found that the influence of β on the patterns of the failures is significant. A large value of β yields a bigger size of failure. In addition, for the cases of β = 45° and 60°, the failures are only extended to the right-hand side of the footing, which is the direction of the inclined force. However, the case of β = 90° shows that the failure is expanded uniformly into both sides since there is no inclination angle involved in this case. The impact of the eccentricity ratio e/B is demonstrated in Figure 5. Note that the selected cases shown in Figure 5 are β = 45°; GSI = 100; mi = 5; γB/σci = 0; α = 1; and e/B = 0.1, 0.2, 0.4. The figure makes it abundantly evident that a larger value for e/B results in a smaller rock mass contributing to the collapse. It alludes to the notion that increasing eccentrical length reduces load distribution to rock. As a result, the scenario with e/B = 0.4 has the least length of failure expansion. The effect of the adhesion factor at the contact area between the footing and rock is examined in Figure 6. The cases of α = 0.25, 0.5, and 1 are employed in Figure 6, where the others are β = 90°; GSI = 100; mi = 5; γB/σci = 0; e/B = 0.3. Clearly, an increase in α causes a slightly larger failure zone extending below the footing. This noted behaviour is due to the fact that when the roughness at the interface increases, it increases the shear strength at the contact area.
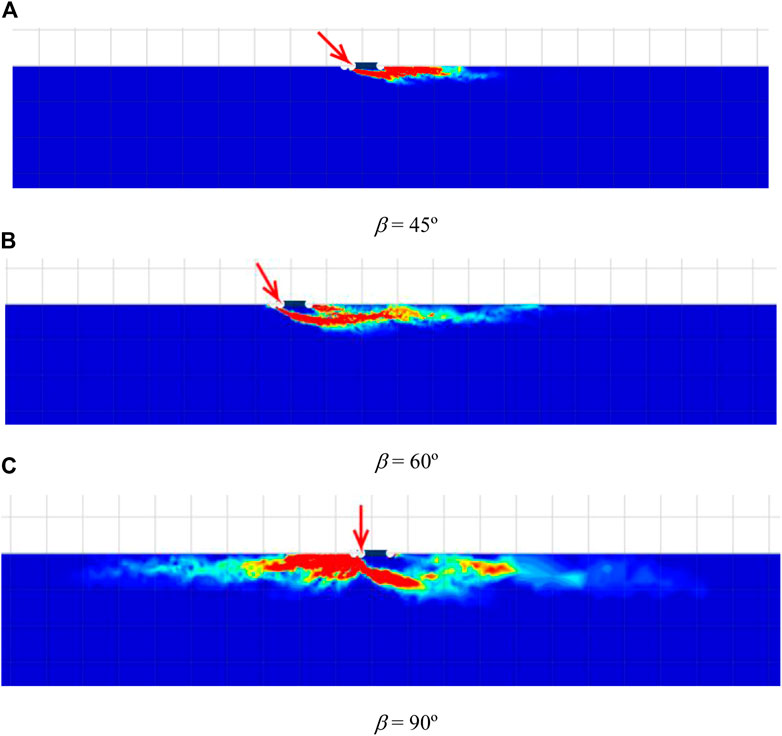
FIGURE 4. Shear dissipations for various β with. e/B = 0.3, GSI = 100, mi = 5, γB/σci = 0, and α = 1. (A) β = 45° (B) β = 60° (C) β = 90°.
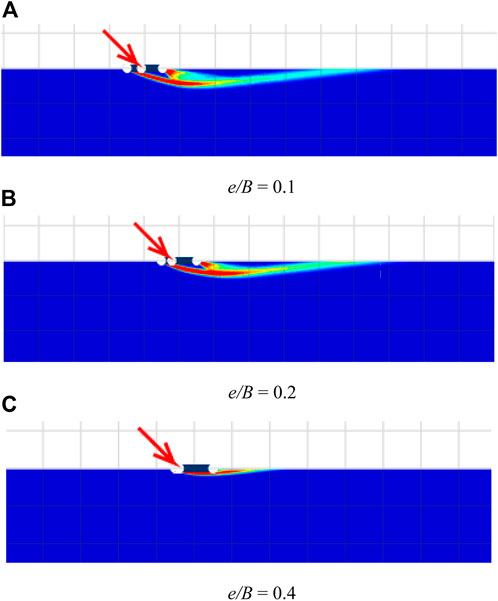
FIGURE 5. Shear dissipations for various e/B with. β = 45°, GSI = 100, mi = 5, γB/σci = 0, and α = 1. (A) e/B = 0.1 (B) e/B = 0.2 (C) e/B = 0.4.

FIGURE 6. Shear dissipations for various α with β = 90°, GSI = 100, mi = 5, γB/σci = 0, and e/B = 0.3. (A) α = 0.25 (B) α = 0.5 (C) α = 1.
The changes in failure mechanisms due to the HB parameters are investigated and discussed next. The impact of GSI on the failure mechanisms is demonstrated in Figure 7 for the cases of GSI = 50, 80, and 100, mi = 5, β = 90°, α = 1, γB/σci = 0, and e/B = 0.3. In addition, the effect of mi on the failure patterns is illustrated in Figure 8, where the selected cases of mi = 5, 20, and 35, GSI = 100, β = 90 °, α = 1, γB/σci = 0, and e/B = 0.3 are carried out. The size of the failure zone is inversely proportional to the GSI of the rock mass (refer to Figure 7). Conversely, an increase in mi causes a bigger size of the failures, as shown in Figure 8. The findings from Figures 7, 8 are similar to that in the previous studies by Merifield et al. (2006), Keawsawasvong et al. (2021), and Keawsawasvong (2021). It should be noted that, even though an increase in mi or GSI can increase the value of the bearing capacity factors, they have a different impact on the failure pattern. A large value of GSI means rocks are intact rocks with few discontinuities. Like soils with high values of strength parameters, the size of the failure zone becomes smaller when the internal strength of the rock becomes larger. However, the mi parameter is the material constant in the HB model that basically depends on the rock type (Hoek et al., 2002). Thus, the pattern of failure influenced by mi is quite different from GSI since they have different meanings. Finally, the influence of the dimensionless strength γB/σci is shown in Figure 9. The selected cases are γB/σci = 0, 0.001, and 0.002; β = 60°; GSI = 100; mi = 35; α = 1; e/B = 0.3. It should be noted that the practical ranges of unit weight (γ) and uniaxial compressive strength (σci) of rock masses are γ = 22–30 kN/m3 and σci = 0.25–250 MPa. As a result, the range of γB/σci can be varied from 0 to 0.002. The case of γB/σci = 0 corresponds to an extremely strong rock mass with a relatively large uniaxial compressive strength. From Figure 9, a small impact of the dimensionless strength on the failure mechanisms can be observed. The size of the failure zone does not change when the value of γB/σci increases or decreases, as the range of γB/σci is quite small (γB/σci = 0–0.01).
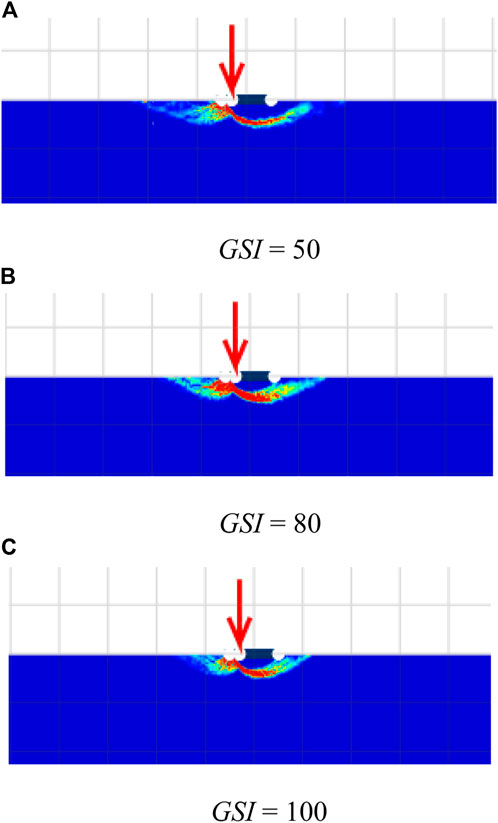
FIGURE 7. Shear dissipations for various GSI with β = 90°, α = 1, mi = 5, γB/σci = 0, and e/B = 0.3. (A) GSI = 50 (B) GSI = 80 (C) GSI = 100.
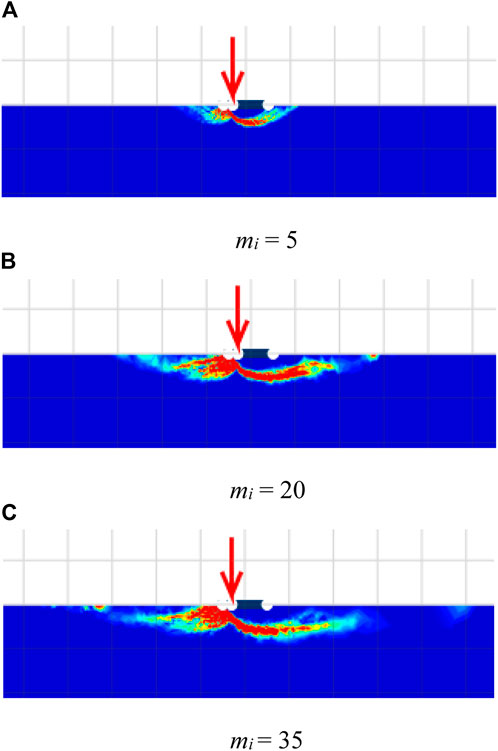
FIGURE 8. Shear dissipations for various mi with β = 90 °, GSI = 100, α = 1, γB/σci = 0, and e/B = 0.3. (A) mi = 5 (B) mi = 20 (C) mi = 35.
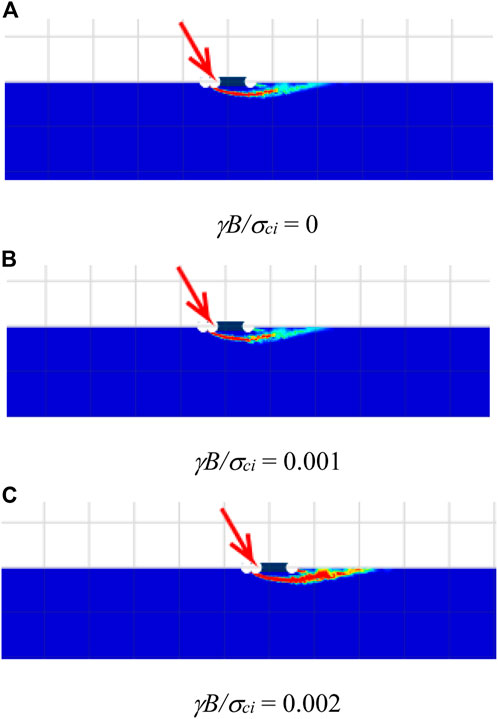
FIGURE 9. Shear dissipations for various α with β = 60 °, GSI = 100, mi = 35, α = 1, and e/B = 0.3. (A) γB/σci = 0 (B) γB/σci = 0.001 (C) γB/σci = 0.002.
Numerical results
The solutions of the bearing capacity factor (P/σciB) of strip footings subjected to inclined and eccentric load and resting on Hoek-Brown rock mass are presented next. In this study, the average (AVG) solutions obtained from UB and LB results are used to express all numerical results. Since there are all 5,120 AVG solutions for the bearing capacity factors of this problem with the consideration of six dimensionless parameters as mentioned earlier, for brevity, only some of them are employed to present the influences of six dimensionless parameters on the bearing capacity factor. Nevertheless, in the next section, all 5,120 AVG solutions will be used later as the set of training data to develop the MARS model.
The effect of the roughness or adhesion factor (α) on the bearing capacity factor (P/σciB) is shown in Figures 10A,B for the cases of β = 60° and 75°, respectively. Note that the others are set as GSI = 100; γB/σci = 0; mi = 5. The interface with fully rough condition (α = 1) produces the strongest shear strength at the contact area, which results in the highest value of P/σciB. For the cases with small β, the relationship between α and P/σciB is a continually increasing line. However, for the cases with large β, the line of α and P/σciB relation increases from α = 0.25 to α = 0.5; then, the value of P/σciB converges to the largest constant after α being higher than 0.5. This is probably due to the reason that the case with a large value of β induces a small value of lateral force. As a result, when the value of α is in the range of 0.5–1 corresponding to the rough or fully rough interface, a small lateral force has a low influence on the bearing capacity factors so that the tendency of all lines in Figure 10B becomes a straight line after α > 0.5.
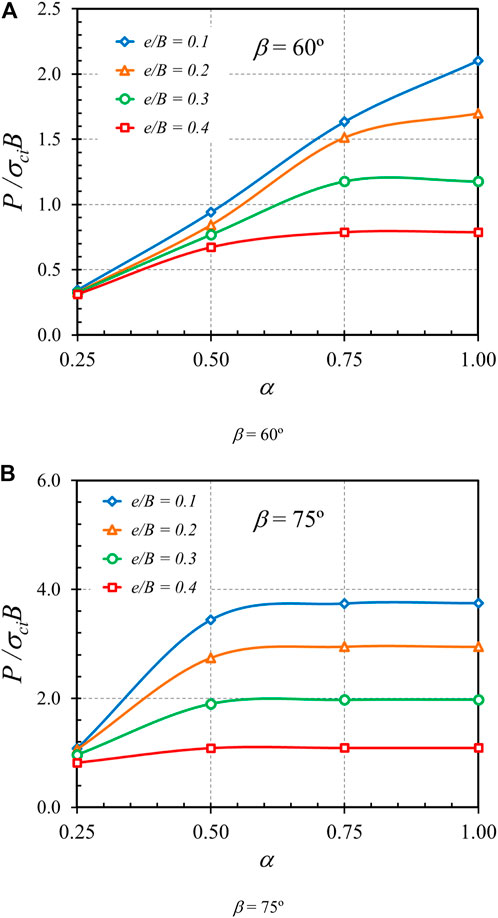
FIGURE 10. Influence of adhesion factor, α on the stability solutions of bearing capacity factor on the rock mass (GSI = 100, γB/σci = 0, and mi = 5). (A) β = 60° (B) β = 75°.
The plots of P/σciB versus e/B are expressed in Figures 11A,B for the cases of α = 0.75 and α = 1, respectively. In Figure 11, the other parameters are fixed as GSI = 100; γB/σci = 0; mi = 5. The relationship between P/σciB and e/B is nonlinear. Since a large eccentric length generally causes a reduction in the efficiency of load, that is, applied on the footing, an increase in e/B yields a decrease in P/σciB, as can be observed in Figure 11. The plots showing the relationship between β and P/σciB are shown in Figures 12A,B for the cases of e/B = 0 and e/B = 0.4, respectively. Also, the other parameters used in Figure 12 are GSI = 100, γB/σci = 0, and mi = 5. Clearly, the bearing capacity factor for the footing with β = 90° is the largest since the footing is subjected to vertical force only. When β becomes smaller (less than 90°), the bearing capacity factor also becomes lower owing to the horizontal force induced from the inclined angle.
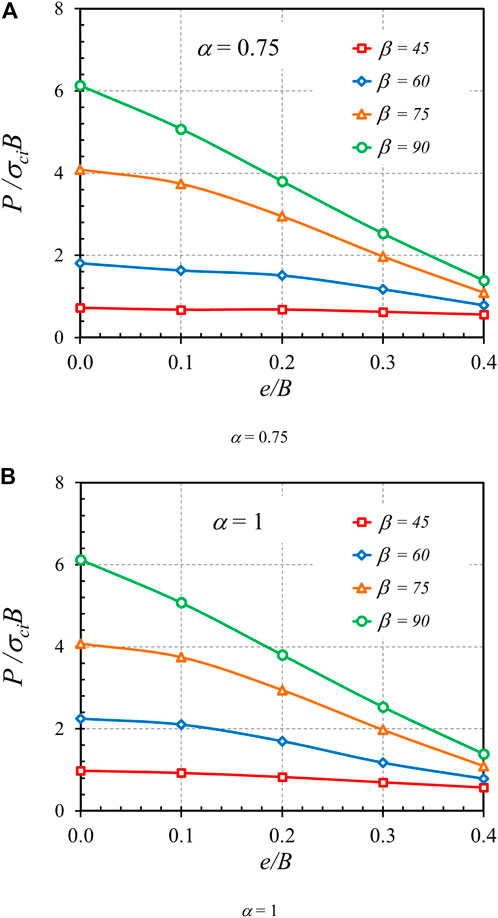
FIGURE 11. Influence of eccentricity, e/Β on the stability solutions of bearing capacity factor on the rock mass (GSI = 100, γB/σci = 0, and mi = 5). (A) α = 0.75 (B) α = 1.
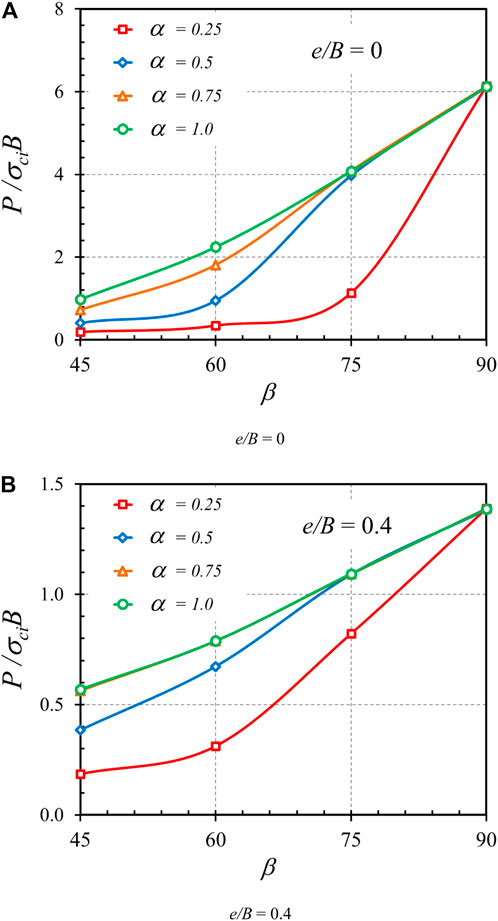
FIGURE 12. Influence of load inclination, β on the stability solutions of bearing capacity factor on the rock mass (GSI = 100, γB/σci = 0, and mi = 5). (A) e/B = 0 (B) e/B = 0.4.
Figures 13–15 demonstrate the effects of Hoek-Brown materials, including GSI, mi, and γB/σci, on the bearing capacity factor P/σciB, respectively. Figures 13A,B present the impact of GSI on the bearing capacity factor P/σciB for the cases of γB/σci = 0 and 0.01, β = 45°, e/B = 0, and α = 1. An exponential relationship between P/σciB and GSI can be observed, where an increase in GSI causes a nonlinear increase in P/σciB. This exponentially increasing curve is caused by the exponential function in the HB model as expressed in Eqs 2–4. Also, a higher value of GSI corresponding to highly undisturbed rock mass gives rise to a stronger strength of rock, resulting in a larger bearing capacity factor, as shown in Figure 13. A relationship between the mi parameter and the bearing capacity factor P/σciB is shown in Figure 14. The plots correspond to the cases of GSI = 30 and 50, β = 45°, e/B = 0, and α = 1. Since the mi parameter depends upon the mineralogy, composition, and grain size of the intact rock in a physical meaning, an increase in mi yields an increase in rock strength. Thus, the relationship between P/σciB and mi is linearly correlated. It should also be noted that each contour line in Figure 14 corresponds to the different values of γB/σci. It is found that the effect of γB/σci is quite insignificant so that all contour lines overlap each other. This issue can be confirmed in Figure 15 showing the influence of γB/σci on P/σciB for the cases GSI = 30 and 100, β = 45°, e/B = 0, and mi = 5. Indeed, an increase in rock unit weight causes an increase in rock strength. However, the effect of γB/σci is quite small since its range is narrow, as described earlier. From Figures 15, 16, it can be concluded that the impact of γB/σci is negligible for the considered range of γB/σci = 0 to 0.01 in this study.
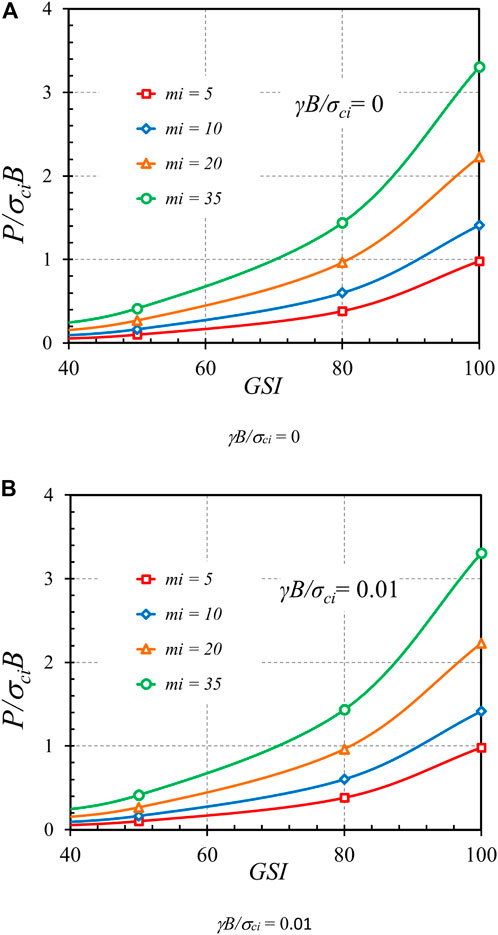
FIGURE 13. Influence of GSI on the stability solutions of bearing capacity factor on the rock mass (β = 45°, e/B = 0, and α = 1). (A) γB/σci = 0 (B) γB/σci = 0.01.
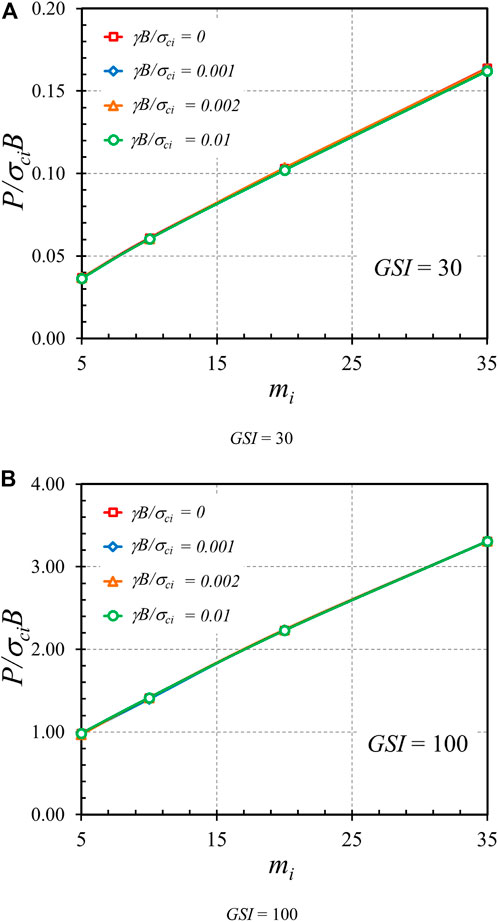
FIGURE 14. Influence of mi on the stability solutions of bearing capacity factor on the rock mass (β = 45°, e/B = 0, and α = 1). (A) GSI = 30 (B) GSI = 100.
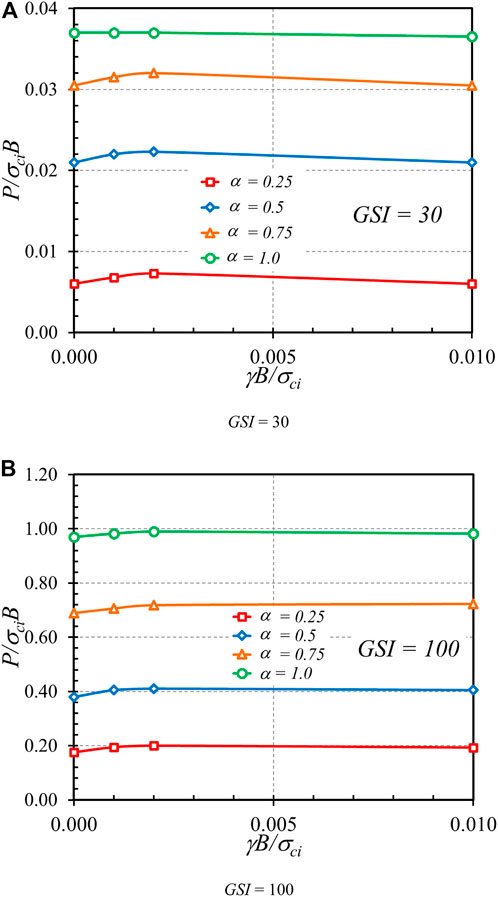
FIGURE 15. Influence of γB/σci on the stability solutions of bearing capacity factor on the rock mass (β = 45°, e/B = 0, and mi = 5). (A) GSI = 30 (B) GSI = 100.
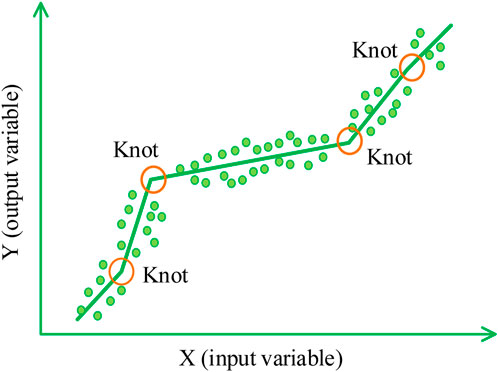
FIGURE 16. The concept of MARS model.
MARS model
By the parametric study in the above part, it is recognized that considering many input parameters (i.e., six parameters in the present study) may affect the effectiveness of practical engineering in designing work. So, it becomes imperative to suggest some theoretical guidelines and simple tools for practitioners. For instance, considers the sensitivity of each parameter on the output results or an empirical equation that shows a complex relationship between input and output parameters. These things can be reduced the calculation time for numerical modelling and selecting the impact parameters of practitioners. Fortunately, together with the development of artificial intelligence, machine learning is applied in data analysis in many scientific fields, including geotechnical problems, which have significant issues in calculating data (e.g., Fernández-Cabán et al., 2018; Ghahramani et al., 2020; Bamer et al., 2021; Wu and Snaiki, 2022). Some machine learning methods, which can be considered as the successful models in geotechnical problems, are artificial neural networks ∼ ANN, extreme learning machines ∼ ELM, support vector regression ∼ SVR, Gaussian process regression ∼ GPR, and stochastic gradient boosting trees ∼ SGBT (e.g., Yuan et al., 2021; Keawsawasvong et al., 2022c). Nevertheless, Multivariate Adaptive Regression Splines (MARS), a curve-based machine learning method, is quite an efficient method compared to other methods (e.g., Wu and Fan, 2019; Raja and Shukla, 2021; Shiau et al., 2022). In the present study, MARS is applied to the sensitivity analysis of the dimensionless input parameter on the output results of the bearing capacity factor (P/σciB). On the other hand, a correlation equation that shows the complex relationship between the input dimensionless parameters and outcomes of the bearing capacity factor (P/σciB) is also an effective tool for practical engineering.
Multivariate Adaptive Regression Splines (MARS) is a nonlinear regression method. As shown in Figure 16, the MARS model concept is meshing the complex nonlinear relationship between the input and output variables into many simple linear relationships. Furthermore, MARS does not need any assumption between input and output variables. MARS is suitable for high-dimensional issues that contain many input and output variables (e.g., Zheng et al., 2019b; Zhang et al., 2019; Jearsiripongkul et al., 2022; Lai et al., 2022; Sirimontree et al., 2022; Yodsomjai et al., 2022).
For a brief description, MARS algorithm includes 2 steps, as shown in Figure 17. Firstly, MARS is partitioned data into many data groups suitable for the linear regression model. The boundary of partition data, the pair of Knots as shown in Figure 16, is determined based on optimizing the model performance and fitting accuracy. The regression lines are mathematically expressed by basic functions, as shown in Eq. 6.
where x is an input variable and t is a threshold value. This first step can be to create an over-fitted model using all input parameters. On the other hand, this step is often called as a forward step. The second step (or called “backward”) applies a pruning algorithm based on the Generalized Cross-Validation (GCV) value to eliminate the least effective terms to attain the best model (Zhang, 2019; Wang et al., 2020). The GCV value can be determined by Eq. 7.
where RMSE is the root mean square error for the training dataset, N is the number of basic functions, d is the penalty factor, and R is the number of data points. The detail of MARS can be seen in Zhang (2019).
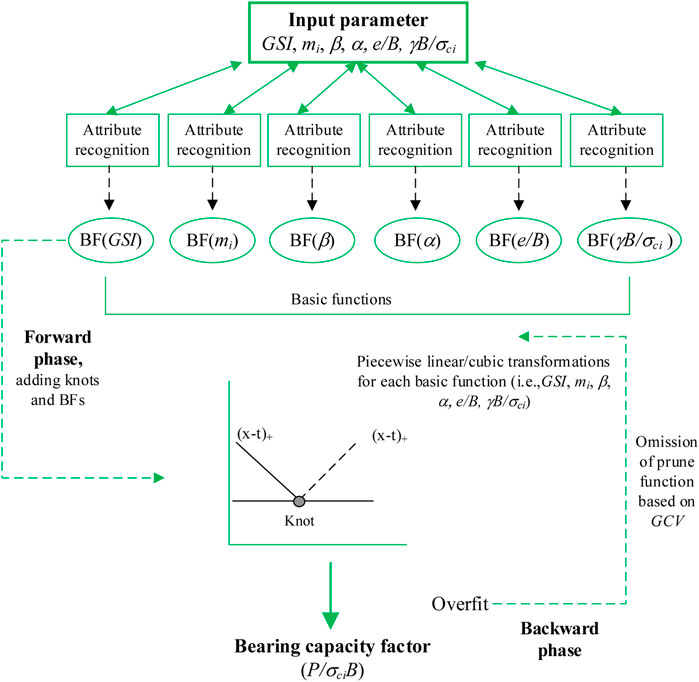
FIGURE 17. MARS algorithm.
In the sensitivity analysis, the importance of each input variable on the output variable is measured by the Relative Important Index (RII) (Steinberg et al., 1999; Gan et al., 2014). MARS determined the RII value by Eq. 8
where Δg is the increase in GCV between the over-fitted and pruned models and when ith parameter is eliminated. The higher of Δg, the more significant is the deleted parameter.
MARS proposes a correlation function obtained by merging all basic functions (BFs) to express the complex relationship between input and output variables mathematically. This function is expressed in Eq. 9
where a0 is the constant, N is the number of BFs, gn is the nth BF, and an is the coefficient of gn.
Sensitive analysis and correlation function from MARS model
In the present study, all numerical results of bearing capacity factors and respective input dimensionless parameters are used as the training data in the MARS model. To select the optimal MARS model, the number of basic functions is varied. The performance of the MARS model is examined through the coefficient of determination (R2 value) and mean squared error (MSE). The R2 value varied from 0 to 1. The R2 closed to 1 means that predicted results and the target value is well suited. While the lower MSE value is, the better model can be obtained.
The impact of the number of fundamental functions on the R2 and MSE values is depicted in Figure 18. It can be seen that the number of basic function increase, and the value of MSE value decreases while R2 closes to 1. The value of MSE and R2 become stable when the number of basic functions is larger than 45. Hence, the MARS model with 50 basic functions can be considered as a well model for the current problem and can be selected for further analysis.
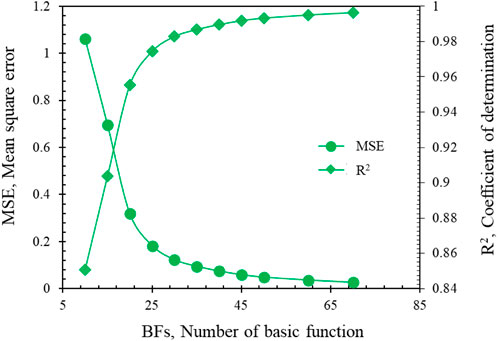
FIGURE 18. Influence of basic function on MARS performance.
The sensitivity analysis result is shown in Figure 19, where the relative important index RII of all dimensionless input parameters is presented. The RII of 100% means that the respective parameter is the most important. As a result, the geological strength index GSI is the most important one, while the inclination angle β, the yield parameter mi, the dimensionless eccentricity loading e/B, the adhesion factor α, and the dimensionless strength γB/σci are lower-ranked ones with RII of 84.3, 62.07, 58.17, 24.51, and 3%, respectively.
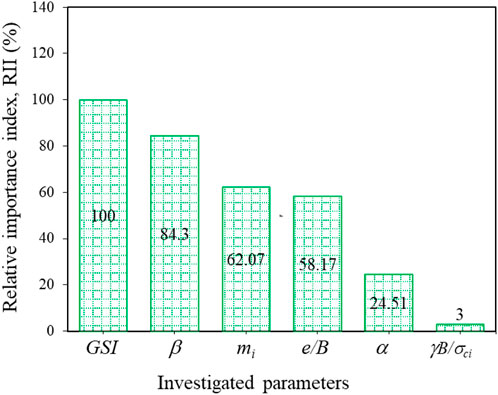
FIGURE 19. Variation of Relative Important Index, RII on various rock mass parameters.
On another side, the basic functions of the analysis MARS model and the correlation equation between the dimensionless input and output variables are shown in Table 3. To verify the proposed correlation equation, the comparison between predicted and numerical values of the bearing capacity factor (P/σciB) is prepared in Figure 20. It can be seen that a good agreement between the results from the proposed correlation equation and numerical is obtained with the value of R2 = 99.33%. This means that the proposed correlation equation can be an effective tool for practical engineering in predicting the bearing capacity of a strip footing on rock mass under inclined and eccentric loading. It is noted that, although the correlation equation shown in Table 3 seems to be complex, it can be easy to put as Marco function in excel. The authors prepare a simple code for practical engineering shown in Appendix 1.

TABLE 3. Basic functions and correlation equation obtained from the MARS analysis.

FIGURE 20. Comparison between bearing capacity factors from proposed equation and numerical results.
Conclusion
The FELA solutions of the bearing capacity factors for strip footings on Hoek-Brown rock masses subjected to inclined and eccentric loading are presented in this paper. The average bound solutions for this problem can be represented as a function of six dimensionless parameters, including the geological strength index (GSI), rock mass yield parameter mi, the dimensionless strength (γB/σci), the adhesion factor (α), the inclined angle (β), and the eccentricity of load (e/B). The results show that all parameters significantly impact the bearing capacity factor (P/σciB) except the dimensionless strength. The failure mechanisms influenced by each dimensionless input parameter are investigated and discussed in detail. For practical engineers, it is time-consuming to develop the algorithm of FELA with the HB failure criterion for computing the bearing capacity factor. To develop an optimal machine learning model based on the MARS approach, 5,120 FELA solutions are then carried out as a training data set in MARS. A closed-form equation for obtaining the in the current study is then developed based on the scheme of MARS. The predicted solutions and those from FELA are compared to show the accuracy of the closed-form equation. The sensitivity analysis of six dimensionless variables is also carried out by using the MARS model. In the current study, this proposed MARS equation can be used to predict the bearing capacity factor for strip footings subjected to inclined and eccentric loading and resting on rock masses by practical engineers.
Data availability statement
The original contributions presented in the study are included in the article/supplementary material; further inquiries can be directed to the corresponding author.
Author contributions
Conceptualization: VL and SK; investigation: VL, SK, and AE; methodology: VL, KS, SK, AE, VC, WS-L, and SL; data analysis: VL, KS, SK, AE, VC, WS-L, and SL; validation: VL, KS, SK, AE, VC, WS-L, and SL; visualization: VL, KS, SK, AE, VC, WS-L, and SL; draft: VL and SK; review and editing: AE, VC, WS, and SL.
Funding
This study was financially supported by the Thammasat University Research Unit in Structural and Foundation Engineering, Thammasat University; Office of the Permanent Secretary, Ministry of Higher Education, Science, Research and Innovation under Research Grant for New Scholar (RGNS 64-134); and by the Thailand Research Fund (TRF) under Grant (RTA6280012).
Acknowledgments
We would like to thank Ho Chi Minh City University of Technology (HCMUT), VNU-HCM for the support of time and facilities for this study.
Conflict of interest
The authors declare that the research was conducted in the absence of any commercial or financial relationships that could be construed as a potential conflict of interest.
Publisher’s note
All claims expressed in this article are solely those of the authors and do not necessarily represent those of their affiliated organizations, or those of the publisher, the editors and the reviewers. Any product that may be evaluated in this article, or claim that may be made by its manufacturer, is not guaranteed or endorsed by the publisher.
Appendix A: Marco function in microsoft excel
Function BCF(GSI, mi, Gama, beta, E_B, anpha) corresponding to (GSI, mi, γB/σci, β, e/B, α), respectively.
BF1 = Max (0, GSI—80)
BF2 = Max (0, 80—GSI)
BF3 = Max (0, beta—60) ∗ BF1
BF4 = Max (0, 60—beta) ∗ BF1
BF5 = Max (0, mi—5) ∗ BF3
BF6 = Max (0, e_B—0.1) ∗ BF5
BF8 = Max (0, e_B—0.1)
BF10 = Max (0, beta—60)
BF11 = Max (0, 60—beta)
BF12 = Max (0, mi—5)
BF13 = Max (0, beta—60) ∗ BF2
BF14 = Max (0, 60—beta) ∗ BF2
BF15 = Max (0, GSI—50) ∗ BF12
BF16 = Max (0, 50—GSI) ∗ BF12
BF17 = Max (0, anpha—0.5) ∗ BF15
BF18 = Max (0, 0.5—anpha) ∗ BF15
BF19 = Max (0, beta—45) ∗ BF15
BF20 = Max (0, e_B—0.1) ∗ BF19
BF22 = Max (0, e_B—0.2) ∗ BF3
BF23 = Max (0, 0.2—e_B) ∗ BF3
BF24 = Max (0, beta—75) ∗ BF18
BF25 = Max (0, 75—beta) ∗ BF18
BF26 = Max (0, e_B—0.1) ∗ BF18
BF27 = Max (0, 0.1—e_B) ∗ BF18
BF28 = Max (0, beta—75) ∗ BF26
BF29 = Max (0, 75—beta) ∗ BF26
BF31 = Max (0, 0.75—anpha) ∗ BF1
BF32 = Max (0, beta - 60) ∗ BF31
BF33 = Max (0, 60—beta) ∗ BF31
BF34 = Max (0, e_B—0.1) ∗ BF10
BF35 = Max (0, 0.1—e_B) ∗ BF10
BF36 = Max (0, GSI—50) ∗ BF8
BF37 = Max (0, 50—GSI) ∗ BF8
BF38 = Max (0, mi—20) ∗ BF10
BF39 = Max (0, 20—mi) ∗ BF10
BF40 = Max (0, beta—75) ∗ BF15
BF41 = Max (0, 75—beta) ∗ BF15
BF42 = Max (0, e_B—0.1) ∗ BF40
BF43 = Max (0, 0.1—e_B) ∗ BF40
BF44 = Max (0, anpha—0.75) ∗ BF41
BF45 = Max (0, 0.75—anpha) ∗ BF41
BF46 = Max (0, e_B—0.1) ∗ BF31
BF48 = Max (0, anpha—0.5)
BF49 = Max (0, 0.5—anpha)
BF50 = Max (0, mi—5) ∗ BF8
BCF = 0.508708 + 0.0778788 ∗ BF1—0.0107436 ∗ BF2 + 0.00173605 ∗ BF3—0.00305416 ∗ BF4 + 0.000183561 ∗ BF5—0.000319477 ∗ BF6 + 0.0634328 ∗ BF10–0.013729 ∗ BF11 + 0.0148772 ∗ BF12–0.000866225 ∗ BF13 + 0.000147591 ∗ BF14 + 0.00081723 ∗ BF15–0.00031283 ∗ BF16–0.000283142 ∗ BF17–0.0146255 ∗ BF18 + 0.00012414 ∗ BF19–0.000409864 ∗ BF20–0.0156994 ∗ BF22 + 0.0138337 ∗ BF23 + 0.00107819 ∗ BF24 + 0.000570285 ∗ BF25 + 0.0459211 ∗ BF26–0.00442648 ∗ BF27–0.00348082 ∗ BF28–0.00139517 ∗ BF29–0.193336 ∗ BF31 + 0.00475476 ∗ BF32 + 0.00858671 ∗ BF33–0.0826643 ∗ BF34 + 0.0652835 ∗ BF35–0.0496545 ∗ BF36 + 0.0584928 ∗ BF37 + 0.000497006 ∗ BF38–0.00103991 ∗ BF39–0.000106445 ∗ BF40 + 0.000276057 ∗ BF42 + 0.00126849 ∗ BF43 + 0.0000413328 ∗ BF44–0.00010996 ∗ BF45 + 0.284044 ∗ BF46 + 0.074536 ∗ BF48–0.545053 ∗ BF49–0.0504621 ∗ BF50.
References
Bamer, F., Thaler, D., Stoffel, M., and Markert, B. (2021). A Monte Carlo simulation approach in nonlinear structural dynamics using convolutional neural networks. Front. Built Environ. 7, 53. doi:10.3389/fbuil.2021.679488
Birid, K., and Choudhury, D. (2021). Bearing capacity of ring foundations over a rock mass using numerical analysis. Taylor – Francis. doi:10.1080/17486025.2021.19750
Chauhan, V. B. (2021). Limit analysis of the retaining wall with relief shelves under static surcharge loading using FEM. Sadhana 46 (3), 135. doi:10.1007/s12046-021-01662-9
Chauhan, V. B., Srivastava, A., Jaiswal, S., and Keawsawasvong, S. (2022). Behavior of back-to-back MSE walls: Interaction analysis using finite element modeling. Transp. Infrastruct. Geotech. doi:10.1007/s40515-022-00248-0
Chihi, O., and Saada, Z. (2022). Bearing capacity of strip footing on rock under inclined and eccentric load using the generalized Hoek-Brown criterion. Eur. J. Environ. Civ. Eng. 26 (6), 2258–2272. doi:10.1080/19648189.2020.1757513
Ciria, H., Peraire, J., and Bonet, J. (2008). Mesh adaptive computation of upper and lower bounds in limit analysis. Int. J. Numer. Methods Eng. 75, 899–944. doi:10.1002/nme.2275
Eskandarinejad, A. (2022). Seismic vertical uplift capacity of horizontal strip anchors embedded in sand adjacent to slopes using finite element limit analysis. Arab. J. Geosci. 15, 16. doi:10.1007/s12517-021-09280-9
Fernández-Cabán, P. L., Masters, F. J., and Phillips, B. M. (2018). Predicting roof pressures on a low-rise structure from freestream turbulence using artificial neural networks. Front. Built Environ. 68. doi:10.3389/fbuil.2018.00068
Gan, Y., Duan, Q., Gong, W., Tong, C., Sun, Y., Chu, W., et al. (2014). A comprehensive evaluation of various sensitivity analysis methods: A case study with a hydrological model. Environ. Model. Softw. 51, 269–285. doi:10.1016/j.envsoft.2013.09.031
Ghahramani, A., Galicia, P., Lehrer, D., Varghese, Z., Wang, Z., and Pandit, Y. (2020). Artificial intelligence for efficient thermal comfort systems: Requirements, current applications and future directions. Front. Built Environ. 6, 49. doi:10.3389/fbuil.2020.00049
Hansen, J. B. (1970). A revised and extended formula for bearing capacity. Bull. Dan. Geotech. Inst. 28, 5–11. doi:10.3208/sandf1972.33.169
Hjiaj, M., Lyamin, A. V., and Sloan, S. W. (2004). Bearing capacity of a cohesive-frictional soil under non-eccentric inclined loading. Comput. Geotechnics 31 (6), 491–516. doi:10.1016/j.compgeo.2004.06.001
Hoek, E., and Brown, E. T. (1980). Empirical strength criterion for rock masses. J. Geotech. Engrg. Div. 106 (9), 1013–1035. doi:10.1061/AJGEB6.0001029
Hoek, E., Carranza-Torres, C., and Corkum, B. (2002). “Hoek–Brown failure criterion - 2002 edition,” in Proceedings of the North American rock mechanics society meeting in Toronto (Canada).
Jaiswal, S., and Chauhan, V. B. (2002). Influence of secondary reinforcement layers to enhance the stability of steep soil slope under earthquake loading. Arab. J. Geosci. 15 (11), 1–15. doi:10.3390/su14084456
Jearsiripongkul, T., Lai, V. Q., Keawsawasvong, S., Nguyen, T. S., Van, C. N., Thongchom, C., et al. (2022). Prediction of uplift capacity of cylindrical caissons in anisotropic and inhomogeneous clays using multivariate adaptive regression splines. Sustainability 14 (8), 4456. doi:10.3390/su14084456
Keawsawasvong, S. (2021). Bearing capacity of conical footings on Hoek-Brown rock masses using finite element limit analysis. Int. J. Comput. Mat. Sci. Eng. 10 (3), 2150015. doi:10.1142/S2047684121500159
Keawsawasvong, S., and Lai, V. Q. (2021). End bearing capacity factor for annular foundations embedded in clay considering the effect of the adhesion factor. Int. J. Geosynth. Ground Eng. 7, 15. doi:10.1007/s40891-021-00261-2
Keawsawasvong, S., Seehavong, S., and Ngamkhanong, C. (2022c). Application of artificial neural networks for predicting the stability of rectangular tunnels in Hoek–Brown rock masses. Front. Built Environ. 8, 837745. doi:10.3389/fbuil.2022.837745
Keawsawasvong, S., Shiau, J., Limpanawannakul, K., and Panomchaivath, S. (2022a). Stability charts for closely spaced strip footings on Hoek-Brown rock mass. Geotech. Geol. Eng. (Dordr). 40, 3051–3066. doi:10.1007/s10706-022-02077-x
Keawsawasvong, S., Shiau, J., Ngamkhanong, C., Lai, V. Q., and Thongchom, C. (2022b). Undrained stability of ring foundations: Axisymmetry, anisotropy, and non-homogeneity. Int. J. Geomech. 22 (1), 04021253. doi:10.1061/(ASCE)GM.1943-5622.0002229
Keawsawasvong, S., Thongchom, C., and Likitlersuang, S. (2021). Bearing capacity of strip footing on Hoek-Brown rock mass subjected to eccentric and inclined loading. Transp. Infrastruct. Geotech. 8, 189–202. doi:10.1007/s40515-020-00133-8
Keawsawasvong, S., and Ukritchon, B. (2022). Design equation for stability of a circular tunnel in anisotropic and heterogeneous clay. Undergr. Space 7 (1), 76–93. doi:10.1016/j.undsp.2021.05.003
Keawsawasvong, S., and Ukritchon, B. (2020). Design equation for stability of shallow unlined circular tunnels in Hoek-Brown rock masses. Bull. Eng. Geol. Environ. 79, 4167–4190. doi:10.1007/s10064-020-01798-8
Keawsawasvong, S., and Ukritchon, B. (2019a). Undrained basal stability of braced circular excavations in non-homogeneous clays with linear increase of strength with depth. Comput. Geotechnics 115, 103180. doi:10.1016/j.compgeo.2019.103180
Keawsawasvong, S., and Ukritchon, B. (2019b). Undrained stability of a spherical cavity in cohesive soils using finite element limit analysis. J. Rock Mech. Geotechnical Eng. 11 (6), 1274–1285. doi:10.1016/j.jrmge.2019.07.001
Keawsawasvong, S., and Ukritchon, B. (2021). Undrained stability of plane strain active trapdoors in anisotropic and non-homogeneous clays. Tunn. Undergr. Space Technol. 107, 103628. doi:10.1016/j.tust.2020.103628
Krabbenhoft, K., Lyamin, A., and Krabbenhoft, J. (2015). Optum computational engineering (OptumG2). Available at: www.optumce.com.
Krabbenhoft, S., Damkilde, L., and Krabbenhoft, K. (2014). Bearing capacity of strip footings in cohesionless soil subject to eccentric and inclined loads. Int. J. Geomech. 14 (3), 04014003. doi:10.1061/(ASCE)GM.1943-5622.0000332
Krabbenhoft, S., Damkilde, L., and Krabbenhoft, K. (2012). Lower bound calculations of the bearing capacity of eccentrically loaded footings in cohesionless soil. Can. Geotech. J. 49 (3), 298–310. doi:10.1139/t11-103
Krishnan, K., Halder, K., and Chakraborty, D. (2019). Seismic bearing capacity of a strip footing over an embankment of anisotropic clay. Front. Built Environ. 5, 134. doi:10.3389/fbuil.2019.00134
Kumar, P., and Chauhan, V. B. (2022). Bearing capacity of strip footing resting above a circular void in the rock mass using adaptive finite element method. Innov. Infrastruct. Solut. 7 (1), 72–14. doi:10.1007/s41062-021-00666-y
Lai, V. Q., Shiau, J., Keawsawasvong, S., and Tran, D. T. (2022). Bearing capacity of ring foundations on anisotropic and heterogenous clays: FEA, NGI-ADP, and MARS. Geotech. Geol. Eng. (Dordr). 40, 3913–3928. doi:10.1007/s10706-022-02117-6
Loukidis, D., Chakraborty, T., and Salgado, R. (2008). Bearing capacity of strip footings on purely frictional soil under eccentric and inclined loads. Can. Geotech. J. 45, 768787. doi:10.1139/T08-015
Merifield, R. S., Lyamin, A. V., and Sloan, S. W. (2006). Limit analysis solutions for the bearing capacity of rock masses using the generalised Hoek–Brown criterion. Int. J. Rock Mech. Min. Sci. 43 (6), 920–937. doi:10.1016/j.ijrmms.2006.02.001
Meyerhof, G. G. (1963). Some recent research on the bearing capacity of foundations. Can. Geotech. J. 1 (1), 16–26. doi:10.1139/t63-003
Meyerhof, G. G. (1953). “The bearing capacity of foundations under eccentric and inclined loads,” in Proceedings of the third conference of soil mechanics, 440–445. doi:10.1179/1939787915Y.0000000003
Raja, M. N. A., and Shukla, S. K. (2021). Multivariate adaptive regression splines model for reinforced soil foundations. Geosynth. Int. 28 (4), 368–390. doi:10.1680/jgein.20.00049
Roy, N., and Koul, S. (2022). Effect of embedment depth on the seismic bearing capacity of strip footing in rock mass. Int. J. Geomech. 22 (7), 06022010. doi:10.1061/(ASCE)GM.1943-5622.0002463
Saada, Z., Maghous, S., and Garnier, D. (2008). Bearing capacity of shallow foundations on rocks obeying a modified Hoek-Brown failure criterion. Comput. Geotechnics 35, 144–154. doi:10.1016/j.compgeo.2007.06.003
Serrano, A., Olalla, C., and Gonzalez, J. (2000). Ultimate bearing capacity of rock masses based on the modified Hoek–Brown criterion. Int. J. Rock Mech. Min. Sci. 37 (6), 1013–1018. doi:10.1016/s1365-1609(00)00028-9
Serrano, A., and Olalla, C. (1998a). Ultimate bearing capacity of an anisotropic discontinuous rock mass, part I: Basic modes of failure. Int. J. Rock Mech. Min. Sci. 35 (3), 301–324. doi:10.1016/s0148-9062(97)00337-9
Serrano, A., and Olalla, C. (1998b). Ultimate bearing capacity of an anisotropic discontinuous rock mass, part II: Determination procedure. Int. J. Rock Mech. Min. Sci. 35 (3), 325–348. doi:10.1016/s0148-9062(97)00338-0
Serrano, A., and Olalla, C. (1994). Ultimate bearing capacity of rock masses. Int. J. Rock Mech. Min. Sci. Geomechanics Abstr. 31 (2), 93–106. doi:10.1016/0148-9062(94)92799-5
Sirimontree, S., Jearsiripongkul, T., Lai, V. Q., Eskandarinejad, A., Lawongkerd, J., Seehavong, S., et al. (2022). Prediction of penetration resistance of a spherical penetrometer in clay using multivariate adaptive regression splines model. Sustainability 14 (6), 3222. doi:10.3390/su14063222
Sloan, S. W. (2013). Geotechnical stability analysis. Géotechnique 63 (7), 531–571. doi:10.1680/geot.12.RL.001
Srivastava, A., and Chauhan, V. B. (2020). Numerical studies on two-tiered MSE walls under seismic loading. SN Appl. Sci. 2 (10), 1625–1627. doi:10.1007/s42452-020-03414-6
Steinberg, D., Colla, P. L., and Martin, K. (1999). MARS user guide. San Diego, CA: Salford Systems.
Taiebat, H. A., and Carter, J. P. (2002). Bearing capacity of strip and circular foundations on undrained clay subjected to eccentric loads. Géotechnique 52 (1), 61–64. doi:10.1680/geot.52.1.61.40828
Ukritchon, B., and Keawsawasvong, S. (2019). Design equations of uplift capacity of circular piles in sands. Appl. Ocean Res. 90, 101844. doi:10.1016/j.apor.2019.06.001
Ukritchon, B., Yoang, S., and Keawsawasvong, S. (2019). Three-dimensional stability analysis of the collapse pressure on flexible pavements over rectangular trapdoors. Transp. Geotech. 21, 100277. doi:10.1016/j.trgeo.2019.100277
Ukritchon, B., Yoang, S., and Keawsawasvong, S. (2020). Undrained stability of unsupported rectangular excavations in non-homogeneous clays. Comput. Geotechnics 117, 103281. doi:10.1016/j.compgeo.2019.103281
Vesic, A. (1975). “Bearing capacity of shallow foundations,” in Foundation engineering handbook. Editors H. F. Winterkorn, and H. Y. Fang (New York: Van Nostrand Reinhold), 121–147. doi:10.1007/978-1-4757-5271-7_14
Wang, L., Wu, C., Gu, X., Liu, H., Mei, G., and Zhang, W. (2020). Probabilistic stability analysis of Earth dam slope under transient seepage using multivariate adaptive regression splines. Bull. Eng. Geol. Environ. 79 (6), 2763–2775. doi:10.1007/s10064-020-01730-0
Wu, L., and Fan, J. (2019). Comparison of neuron-based, kernel-based, tree-based and curve-based machine learning models for predicting daily reference evapotranspiration. PloS one 14 (5), e0217520. doi:10.1371/journal.pone.0217520
Wu, T., and Snaiki, R. (2022). Applications of machine learning to wind engineering. Front. Built Environ. 8, 811460. doi:10.3389/fbuil.2022.811460
Yang, X. L., and Yin, J. H. (2005). Upper bound solution for ultimate bearing capacity with a modified Hoek–Brown failure criterion. Int. J. Rock Mech. Min. Sci. 42, 550–560. doi:10.1016/j.ijrmms.2005.03.002
Yodsomjai, W., Keawsawasvong, S., and Lai, V. Q. (2021). Limit analysis solutions for bearing capacity of ring foundations on rocks using Hoek-Brown failure criterion. Int. J. Geosynth. Ground Eng. 7, 29. doi:10.1007/s40891-021-00281-y
Yodsomjai, W., Keawsawasvong, S., and Likitlersuang, S. (2021b). Stability of unsupported conical slopes in Hoek-Brown rock masses. Transp. Infrastruct. Geotech. 8, 279–295. doi:10.1007/s40515-020-00137-4
Yodsomjai, W., Keawsawasvong, S., and Senjuntichai, T. (2021a). Undrained stability of unsupported conical slopes in anisotropic clays based on Anisotropic Undrained Shear failure criterion. Transp. Infrastruct. Geotech. 8 (4), 557–568. doi:10.1007/s40515-021-00153-y
Yodsomjai, W., Lai, V. Q., Banyong, B., Chauhan, V. B., Thongchom, C., and Keawsawasvong, S. (2022). A machine learning regression approach for predicting basal heave stability of braced excavation in non-homogeneous clay. Arab. J. Geosci. 15, 873. doi:10.1007/s12517-022-10161-y
Yuan, X., Tanksley, D., Jiao, P., Li, L., Chen, G., and Wunsch, D. (2021). Encoding time-series ground motions as images for convolutional neural networks-based seismic damage evaluation. Front. Built Environ. 7. doi:10.3389/fbuil.2021.660103
Zhang, W., Zhang, R., Wang, W., Zhang, F., and Goh, A. T. C. (2019). A Multivariate Adaptive Regression Splines model for determining horizontal wall deflection envelope for braced excavations in clays. Tunn. Undergr. Space Technol. 84, 461–471. doi:10.1016/j.tust.2018.11.046
Zheng, G., Yang, P., Zhou, H., Zeng, C., Yanf, X., He, X., et al. (2019a). Evaluation of the earthquake induced uplift displacement of tunnels using multivariate adaptive regression splines. Comput. Geotechnics 113, 103099. doi:10.1016/j.compgeo.2019.103099
Keywords: bearing capacity, Hoek-Brown, mars, rock mass, strip footing
Citation: Lai VQ, Sangjinda K, Keawsawasvong S, Eskandarinejad A, Chauhan VB, Sae-Long W and Limkatanyu S (2022) A machine learning regression approach for predicting the bearing capacity of a strip footing on rock mass under inclined and eccentric load. Front. Built Environ. 8:962331. doi: 10.3389/fbuil.2022.962331
Received: 06 June 2022; Accepted: 18 July 2022;
Published: 27 September 2022.
Edited by:
Sujit Kumar Dash, Indian Institute of Technology Kharagpur, IndiaReviewed by:
Obaidur Rahaman, Jadavpur University, IndiaS. Mustapha Rahmaninezhad, Terracon Consultants Inc., United States
Copyright © 2022 Lai, Sangjinda, Keawsawasvong, Eskandarinejad, Chauhan, Sae-Long and Limkatanyu. This is an open-access article distributed under the terms of the Creative Commons Attribution License (CC BY). The use, distribution or reproduction in other forums is permitted, provided the original author(s) and the copyright owner(s) are credited and that the original publication in this journal is cited, in accordance with accepted academic practice. No use, distribution or reproduction is permitted which does not comply with these terms.
*Correspondence: Suraparb Keawsawasvong, ksurapar@engr.tu.ac.th