 Jeffrey W. Berman1*
 Joseph Wartman1
 Michael Olsen2
 Jennifer L. Irish3
 Scott B. Miles4
 Troy Tanner5
 Kurtis Gurley6
 Laura Lowes1
 Ann Bostrom7
 Jacob Dafni8
 Michael Grilliot1
 Andrew Lyda1
 Jaqueline Peltier1
- 1Department of Civil and Environmental Engineering, University of Washington, Seattle, WA, United States
- 2School of Civil and Construction Engineering, Oregon State University, Corvallis, OR, United States
- 3Department of Civil and Environmental Engineering, Virginia Polytechnic Institute, Blacksburg, VA, United States
- 4Department of Human Centered Design and Engineering, University of Washington, Seattle, WA, United States
- 5Applied Physics Laboratory, University of Washington, Seattle, WA, United States
- 6Department of Civil and Coastal Engineering, University of Florida, Gainesville, FL, United States
- 7Evans School of Public Policy and Governance, University of Washington, Seattle, WA, United States
- 8Shannon & Wilson, Seattle, WA, United States
In 2016, the National Science Foundation (NSF) funded a multi-institution interdisciplinary team to develop and operate the Natural Hazards Reconnaissance Facility (known as the “RAPID”) as part of the Natural Hazards Engineering Research Infrastructure (NHERI) program. During the following 2 years, the RAPID facility developed its instrumentation portfolio and operational plan with input from the natural hazards community, the facility’s leadership team, and an external steering committee. In September 2018, the RAPID began field operations, which continue today and include instrumentation, software, training, and support services to conduct reconnaissance research before, during, and after natural hazard and disaster events. Over the past 2 years, the RAPID has supported the data collection efforts for over 60 projects worldwide. Projects have spanned a wide range of disciplines and hazards and have also included data collection at large-scale experimental facilities in the United States and abroad. These projects have produced an unprecedented amount of high-quality field data archived on the DesignSafe cyberinfrastructure platform. This paper describes the RAPID facility’s development, instrumentation portfolio (including the mobile application RApp), services and capabilities, and training activities. Additionally, overviews of three recent RAPID-supported projects are presented, including descriptions of field data collection workflows, details of the resulting data sets, and the impact of these project deployments on the natural hazard fields.
Introduction
The Natural Hazards Reconnaissance Facility, known as the RAPID, is part of the Natural Hazards Engineering Research Infrastructure (NHERI) network supported by the National Science Foundation (NSF). Based at the University of Washington (UW), the RAPID is a collaboration between UW, Oregon State University, Virginia Tech, and the University of Florida. The facility enables the natural hazards and disaster research communities to conduct next-generation rapid response investigations to characterize civil infrastructure performance and community response to natural hazards, evaluate design methodologies’ effectiveness, calibrate simulation models, and develop solutions for resilient communities. The RAPID’s primary mission serves the interdisciplinary natural hazards and disaster research communities, but its resources and services are also available to other government agencies and industry. Researchers and practitioners have used the RAPID’s resources effectively across various engineering, geosciences, and social science disciplines. Consistent with NSF’s focus, the RAPID primarily serves reconnaissance needs for earthquake, windstorm, landslide, and tsunami hazards. However, its equipment and services are available for a broad range of applications.
The RAPID facility provides investigators with the hardware, software, and support services needed to collect, process, and assess perishable interdisciplinary data following natural hazards and disaster events. Support for the natural hazards and disaster research community is provided through training and educational activities, field deployment services, and promoting public engagement with science and engineering. Specifically, the RAPID facility engages in the following strategic activities: (1) acquisition, maintenance, and operation of state-of-the-art data collection equipment; (2) development and support of mobile applications to enable interdisciplinary field reconnaissance; (3) providing advisory services and basic logistics support for research missions; (4) facilitation of the systematic archiving, processing, and visualization of acquired data in DesignSafe (Rathje et al., 2017); (5) training a broad user base through workshops and other activities; and (6) public engagement, community outreach, and education.
The facility emphasizes three-dimensional, image-based, advanced survey data [for example, lidar and high-resolution photos from unmanned aerial systems (UASs)] to serve a range of disciplines. In addition, it has equipment for more discipline-specific data collection, including, for example, seismometers, accelerometers, ground investigation equipment, a hydrographic survey vessel, water level gauges, and flow velocity meters, among many other instruments. The RAPID has also developed, and continues to advance, a reconnaissance mobile software application called RApp (the “RAPID application”). The software RApp integrates the collection of field data such as questionnaires, photos, video, and audio, and metadata associated with RAPID instrumentation data collection, while also serving as an in-field resource for team organization and RAPID equipment user manuals (Miles and Tanner, 2018). Integration through common metadata enables linked analyses to support interdisciplinary investigations and simulations. Data collected with RApp are automatically archived on the NHERI cyberinfrastructure, DesignSafe (Rathje et al., 2017).
RAPID began supporting field deployments in September 2018 and, since then, has deployed equipment and/or staff on more than 60 missions worldwide in support of facility users. An unprecedented amount of high-resolution and high-accuracy data has been collected on the impacts of Hurricanes Florence and Michael in 2018, the 2018 Palu-Donggala earthquake and tsunami in Indonesia, the 2018 Hokkaido Eastern Iburi earthquake in Japan, the 2018 Anchorage earthquake, the 2019 Ridgecrest earthquake, and the 2019 Hurricane Dorian, among other recent natural hazards events. Data collected by the RAPID Facility are archived on DesignSafe. This paper describes the RAPID, its development, its capabilities, and its user support services. Additionally, overviews of example data collection deployments are provided along with brief examples of the collected data and an initial look at the impact of these data on addressing grand challenges in natural hazards resilience. The examples include investigation of the performance of large-volume low-rise buildings during Hurricane Michael, investigation of a large flow-slide that occurred the 2018 Palu-Donggala Earthquake in Indonesia, and monitoring of a large, slow-moving landslide in coastal Oregon.
Development of the Rapid
The RAPID was developed over a 2-year period and is currently supported through September 2021, with a possible 5-year renewal through 2026. The process began by engaging the natural hazards and disaster reconnaissance research communities, in order to understand their data gathering needs to advance reconnaissance research aimed at grand challenges, such as community natural hazard resilience. From that engagement, the leadership developed a plan for the facility, including its equipment and operations, in collaboration with an External Steering Committee (serving in an advisory rather than a true “steering” capacity) and NSF. The RAPID then began to acquire and commission equipment, host workshops to train potential users in field data acquisition with the equipment, produce training guides and materials, develop workflows for data acquisition and data management, and develop the software RApp.
Input from the natural hazards and disaster reconnaissance community was critical in developing the RAPID and its capabilities. To gather feedback from the community, the RAPID leadership team organized an interdisciplinary workshop in January 2017 in Seattle, Washington (Wartman et al., 2020). The workshop’s purpose was to identify the grand challenges in natural hazard resilience that require perishable data from reconnaissance, the key needs and opportunities for collecting that data, and the requirements for the RAPID to help meet those needs and leverage those opportunities. User-centered design principles and processes guided the workshop’s structure, which engaged more than 80 researchers, representatives from stakeholder government agencies (such as the United States Geological Survey), and practitioners. Participants included those with expertise in geotechnical engineering, structural engineering, coastal sciences and engineering, geomatics, various social sciences, and instrumentation and technologies for reconnaissance. The participants also had diverse interests in terms of natural hazards, with hurricane, tornado, earthquake, and tsunami expertise and experience well represented.
The RAPID leadership team used the workshop results to frame RAPID’s mission, science plan, strategic activities, equipment portfolio, software development plan, and data management plan. The workshop also revealed the need for a new reconnaissance research landscape to help address grand challenges. This outcome helped kindle the eventual formation of CONVERGE, a NHERI node at the University of Colorado Boulder1, which helps coordinate reconnaissance efforts across disciplines. It also provided an impetus for the expansion of the NSF-supported extreme event reconnaissance organizations (EERs) beyond geotechnical impacts (GEER)2, to those focused on structural engineering (StEER)3, nearshore impacts (NEER)4, social sciences (SSEER), operations (OSEER), and sustainable materials management (SUMMEER).
During the development phase of the RAPID, an interdisciplinary and multi-hazard External Steering Committee (ESC) was engaged and regularly provided feedback. In particular, the ESC reviewed the RAPID’s science plan, mission and strategic activities, and the proposed equipment portfolio. The ESC members are experts with deep experience in natural hazard and disaster reconnaissance and covered the range of disciplines and hazards the RAPID has been developed to serve.
RAPID development has continued through its period of operations. Feedback is collected routinely from users and improves the facility’s operations and inform additional equipment priorities. Collaboration with CONVERGE and the other EERs through a leadership council has also helped to strengthen the RAPID’s ability to serve its users and has helped to set priorities for the facility mobile software, RApp.
The RAPID science plan was developed in response to the 2017 community workshop findings and with feedback from the RAPID’s ESC and other subject matter experts. As described in Wartman et al. (2020), the RAPID seeks to help address grand challenges in natural hazards resilience by enabling the collection of data products to advance our understanding of how integrated natural, engineered, and social systems respond to natural hazards. The resulting data products are designed to advance simulation capabilities for natural hazard performance and impact assessment by providing critical benchmark data for validation. To do this, RAPID maintains instrumentation and services that enable strategic and innovative approaches to integrated data collection in the field. Wartman et al. (2020) also present new field methodologies for field data collection with RAPID instrumentation.
Rapid Instrumentation
The equipment available at the RAPID, selected with research community input, as described above, has enabled a transformation in reconnaissance approaches across multiple disciplines. As described below, RAPID maintains equipment, such as terrestrial lidar and UASs, that have applications across multiple disciplines, hazards, geospatial scales, and temporal scales as well as equipment with primary applications within specific disciplines at specific locations. Such instruments have been widely cited as critical to advancing reconnaissance data collection (e.g., Bray et al., 2019; Greenwood et al., 2019). A sampling of the available equipment, as of late 2020, is described below within several broad categories. A complete list of the RAPID equipment, including manufacturers, specifications, and use cases may be found on the facility’s website5.
Lidar
RAPID has a collection of lidar resources that enable applications across many disciplines where 3D point capture of a scene is essential. RAPID’s portfolio includes tripod-mounted terrestrial lidar systems capable of scanning ranges up to 2.4 km for landscape-scale mapping as well as smaller and extremely portable systems with a 130 m range that can complete full 360° scans for mapping at a local site scale in as little as 2 min at a rate of nearly 2 million points per second. Single point accuracy for the terrestrial lidar scanners varies from 1.2 to 10+ mm (1 −σ) depending on the selected scanner and scanning geometry such as distance to a target. The RAPID has developed simple, efficient workflows for lidar acquisition and provides facility users with guidance on the optimal lidar scanner to suit their data collection needs. Below, Case Study 1 provides an example reconnaissance effort that featured heavy use of lidar to document and assess in detail the damage to a specific building typology observed after Hurricane Michael.
RAPID also has a UAS mounted lidar system, the miniRanger, developed on a turnkey basis by Phoenix Lidar Systems. This system is customized to meet the needs of the RAPID and the natural hazards reconnaissance community. Additionally, the lidar system on the miniRanger can be removed from the UAS and attached to other vehicles for use as a mobile lidar platform. An example deployment of the miniRanger system to document and measure a landslide affecting United States Highway 101 on the Oregon coast is presented later. The miniRanger was selected for the RAPID portfolio to provide an aerial lidar platform for smaller sites where airborne lidar would be cost-prohibitive and lack sufficient resolution. The MiniRanger is ideal for sites that are less than a few square kilometers in size.
Unmanned Aerial Systems
RAPID maintains a fleet of UASs to support natural hazards reconnaissance across several disciplines. The fleet includes small scout UASs with camera and video capabilities; mid-range UASs with excellent cameras and flight time; larger industrial systems that can fly in significant winds and light rain and have flexibility in camera and sensor mounting; UASs with Real-Time Kinematic (RTK) GNSS to simplify the ground control necessary for improving survey accuracy; and fixed-wing systems with exceptionally long flight time and the ability to cover extensive areas. Several RAPID staff members have Remote Pilot Certificates issued by the United States Federal Aviation Agency should users need certified pilots to help with their data collection.
Significantly, RAPID has developed strategies and workflows for deploying UASs in combination with ground control to ensure that the acquired imagery is best suited for its intended research purpose. This includes the generation of photogrammetric products such as centimeter-level resolution orthophotos or structure from motion/multi-view stereo (SfM/MVS) point clouds. An example UAS deployment is presented later where the data collected were used to understand the cause of a massive flowslide that occurred during the Palu, Indonesia earthquake.
Imaging Equipment
High-resolution imaging is critical in any post-event data-gathering effort to assess the performance of the built, natural, and even social systems. As a result, the RAPID provides a variety of image collection equipment to support such data gathering. The equipment includes two StreetView camera systems with car and backpack mounts. These camera systems can collect 360° images that can be quickly processed into a Streetview environment. The Streetview systems can cover hundreds of kilometers per day as they can be used at vehicle speeds up to 95 km/h. RAPID also has a system for collecting gigapixel panoramic images along with high-resolution digital cameras set up for regular image capture as well as optimized capture of images for use in Structure-from-Motion modeling. Additionally, smaller camera and video equipment are available that can be used for rapid image collection, including specialized 360-cameras that can operate with a smartphone and a gimbal-stabilized handheld camera system that can be used for high-quality videos and images. Figure 1 shows an example screenshot from a StreetView environment showing data from Mexico Beach, FL, obtained during a StEER mission following Hurricane Michael.
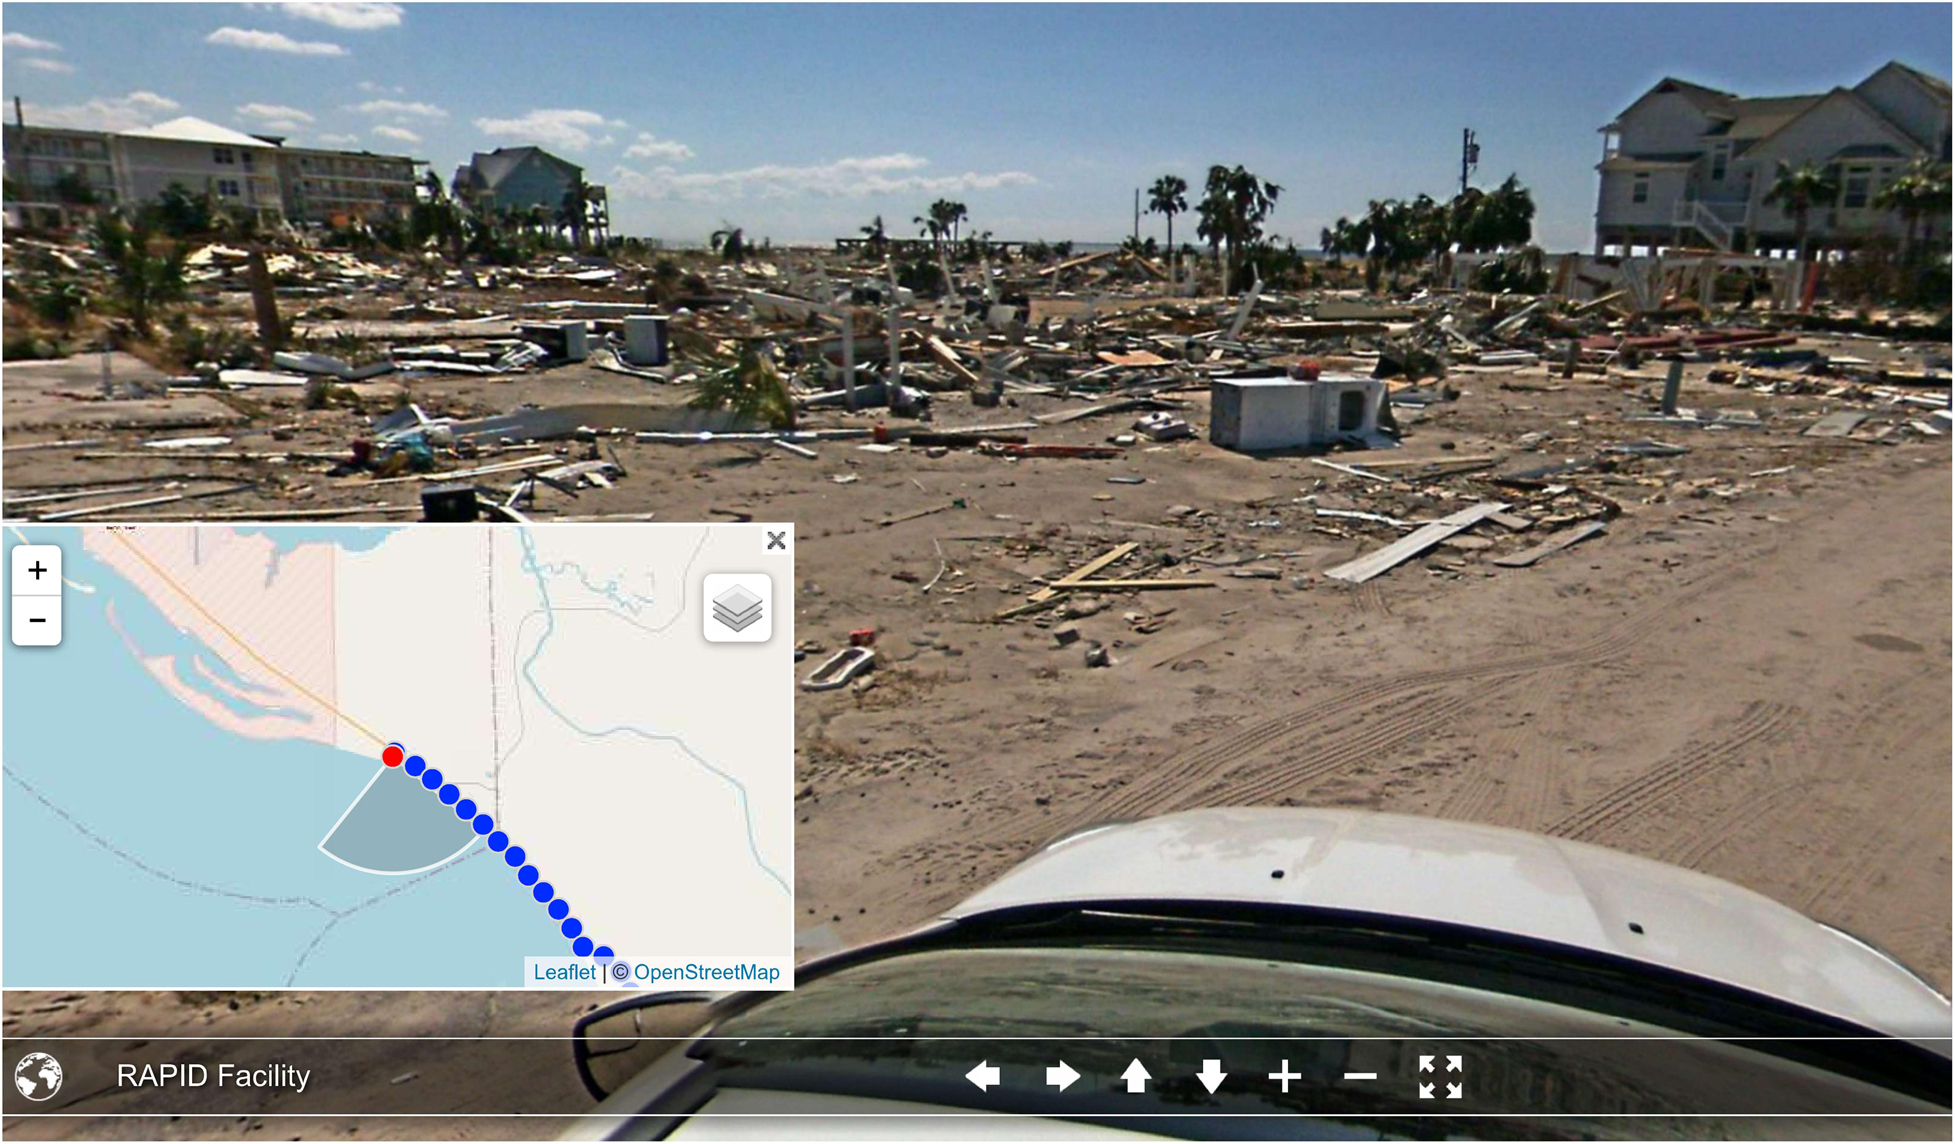
Figure 1. StreetView images acquired with RAPID equipment during a STEER reconnaissance mission in Mexico Beach, FL, following Hurricane Michael (Roueche et al., 2020).
Surveying Equipment
While lidar and UAS technology provide highly detailed point cloud and imagery products, surveying is necessary to provide accurate control for reliable measurements using these products. Additionally, these high accuracy survey instruments and positioning systems (i.e., GNSS) can be used by themselves to make precise measurements of natural hazard impact. For example, a GNSS rover can be used to “tag” water level height observations following a storm surge. RAPID provides these capabilities by maintaining a robotic total station, a suite of GNSS receivers, and a digital level.
Geotechnical and Seismological Equipment
Characterization of the ground conditions at a site can be critical to understanding liquefaction, infrastructure damage, and ground movements. The RAPID provides an array of equipment for site characterization and ground investigation, including a lightweight dynamic cone penetration system, a larger smart dynamic cone penetration system, and a wireless multi-channel analysis of surface wave (MASW) system with 24 acquisition units. Additionally, for both recording ground motions and site characterization, RAPID has an array of six broadband seismometers.
Structural Equipment
To support the investigation of the dynamic response of structures to hurricanes or earthquake aftershocks, the RAPID maintains a portfolio of high-quality accelerometers. The instrumentation includes three “structure sets” of instruments, each consisting of three tri-axis accelerometers, a GPS unit for synchronizing the recordings, cabling, and the necessary battery supplies to acquire data for weeks. The accelerometers are exceptional in terms of accuracy and measurement flexibility and have a wide operation frequency range (DC to 430 Hz) and a full-scale range of ± 0.25 to ± 4 g. They are hardened and can be deployed in challenging environments. The accelerometers are maintained in a “ready-to-go” state and can be rapidly deployed ahead of hurricanes or just after earthquake mainshocks.
Coastal Equipment
Characterization of the bathymetry of affected coastal areas as well as storm surge and inundation measurements are critical data in understanding the coastal impacts of natural hazards. The RAPID maintains equipment for gathering these data, including a remotely operated hydrographic survey boat with a single beam sonar, a velocity flow profiler, water level gauges, an underwater grab sampler, underwater beacons, and a pinger-receiver system. Figure 2 shows the hydrographic survey boat in use during a RAPID user training workshop at UW and during a combined user training and research deployment at the During Nearshore Event Experiment (DUNEX) in Duck, NC6.
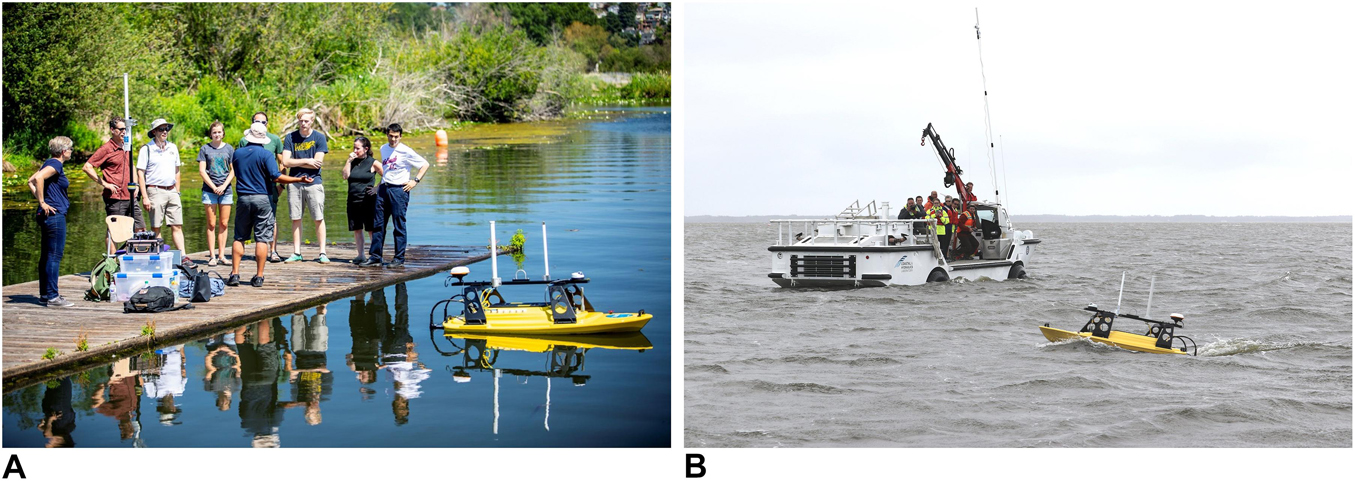
Figure 2. Hydrographic survey boat in use: (A) during user training, and (B) at the DUNEX site.
Software for Reconnaissance Support Across Disciplines
The RAPID has developed the mobile software platform RApp to serve multiple functions in natural hazards and disaster reconnaissance. The software runs within iOS on Apple iPads. The facility has numerous iPads to support field teams when needed as well as during training. RApp serves as a platform to collect data such as questionnaires, photos, or videos. RApp also provides simple tools for capturing metadata associated with data collected using other RAPID equipment. RApp integrates with the RAPID built web-based platform for pre-deployment configuration and post-deployment review of collected data and metadata called Mission Control. RApp will also automatically upload data directly to a user’s project on DesignSafe, the NHERI Cyberinfrastructure, when a Wi-Fi or cellular connection is available. Figure 3A shows the primary purposes of DesignSafe, Mission Control, and RApp, while Figure 3B shows the reconnaissance workflow utilizing them.
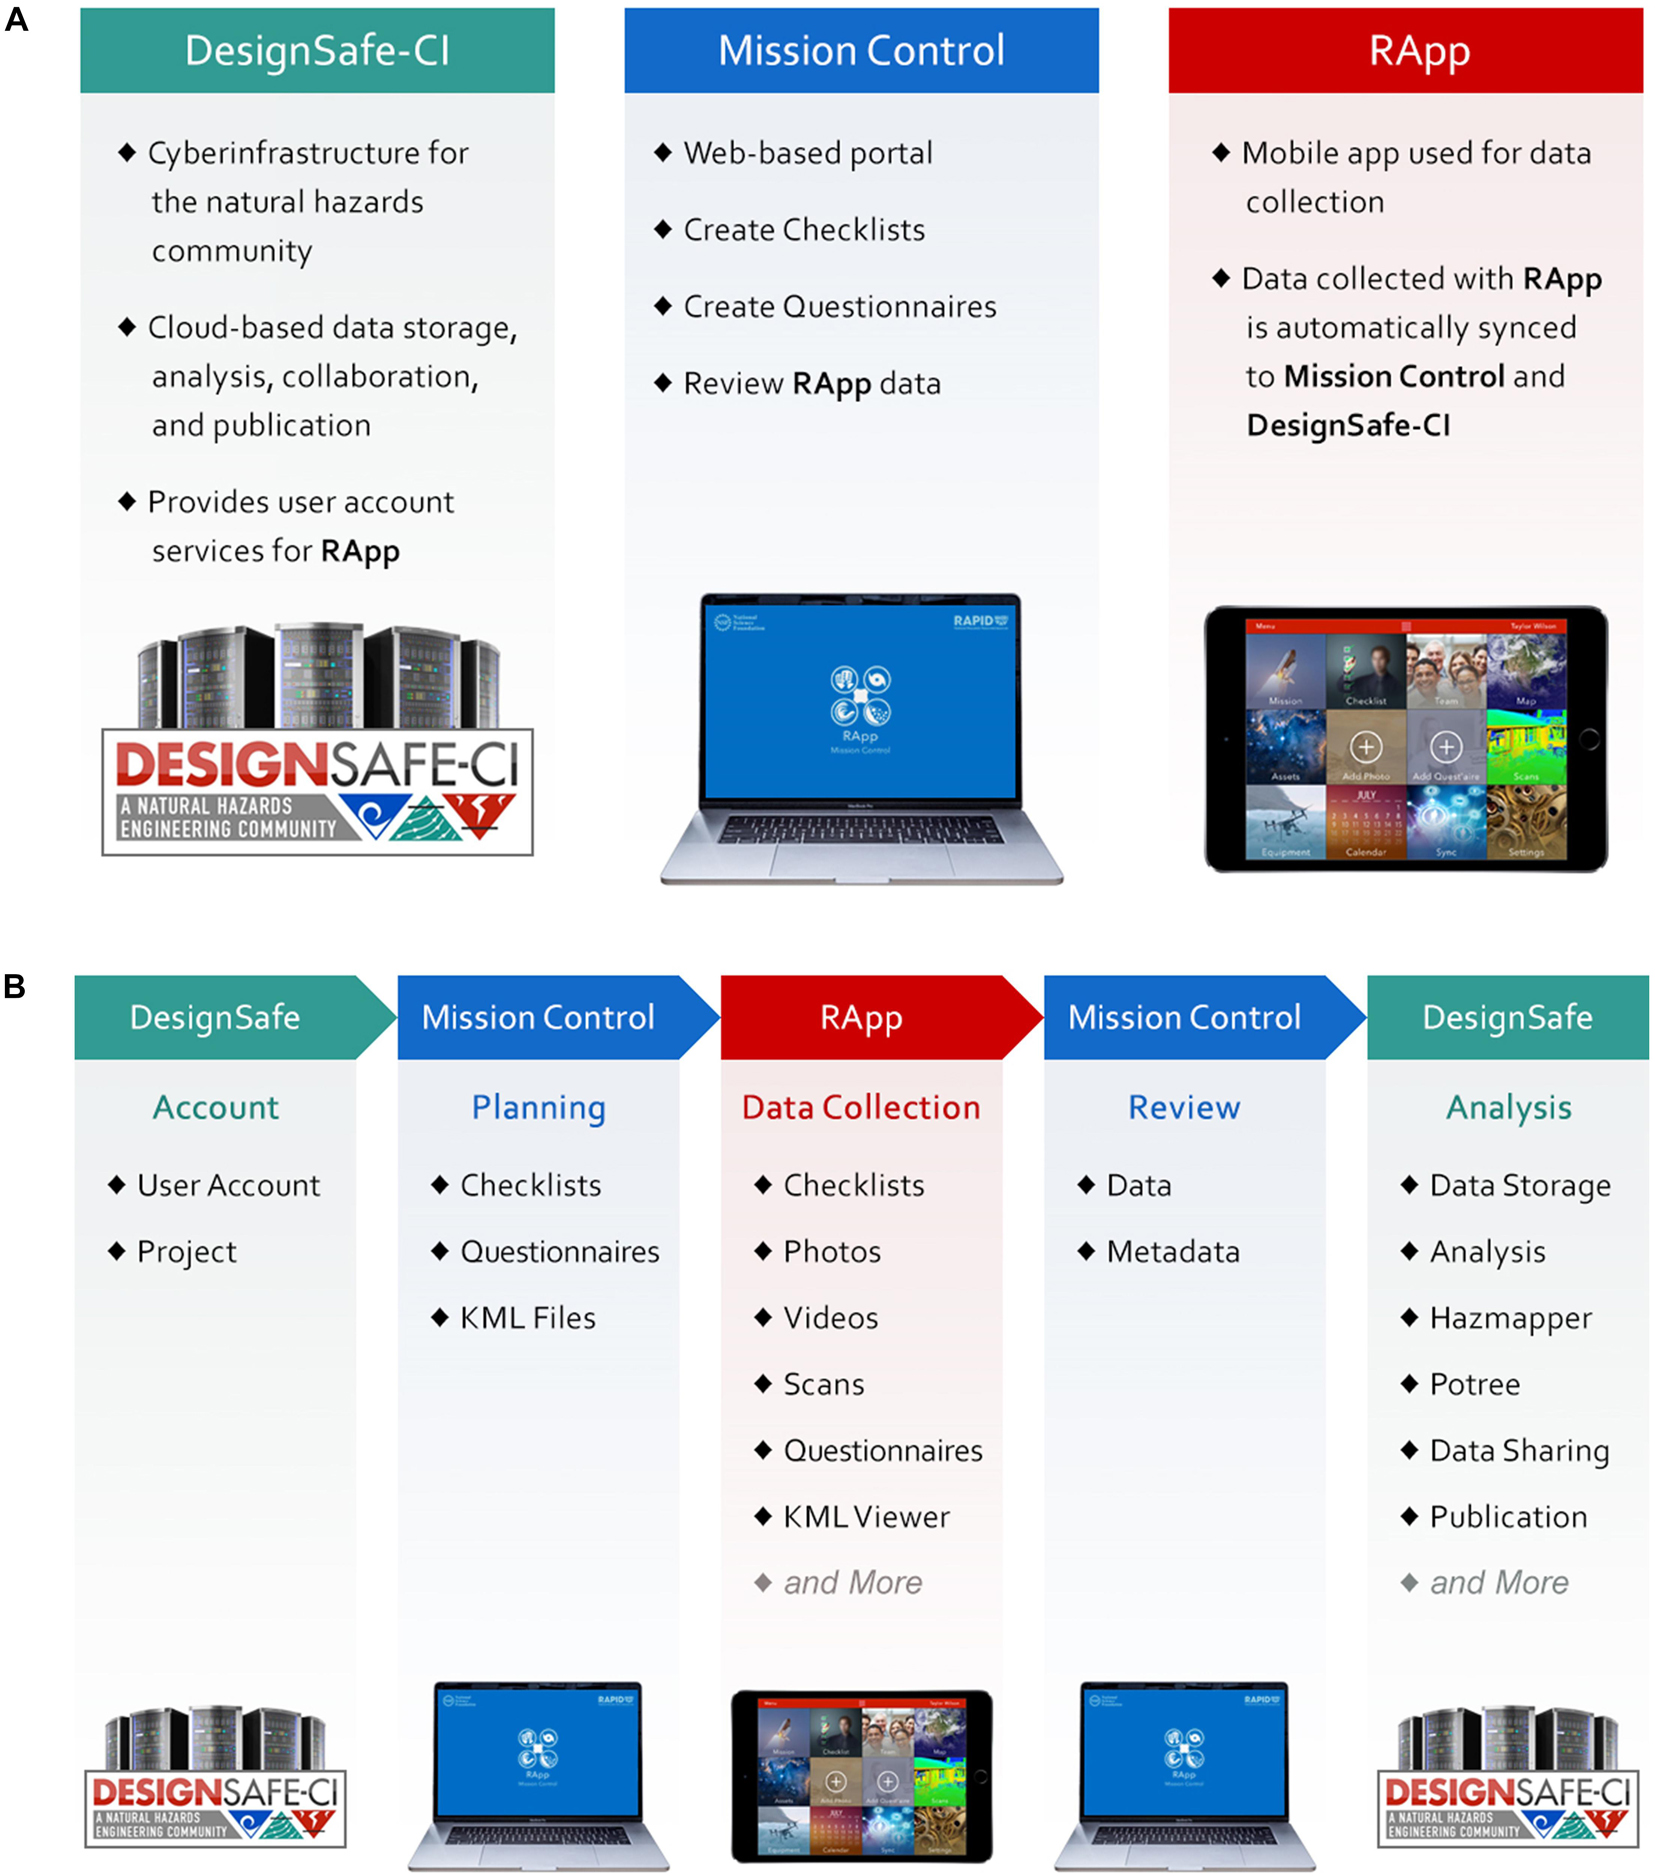
Figure 3. DesignSafe, Mission Control, and RApp: (A) general purposes of each and (B) the field reconnaissance workflow.
Figure 4 shows the main screen of RApp, which consists of customizable tiles so that users may quickly access the RApp tools they need most frequently. All data gathered using RApp is geolocated using the iPad’s integrated GPS, to facilitate investigation of regional distribution of damage and impact. Current functionality allows users to import.kml files to support pre-reconnaissance planning; develop customized questionnaires; record locations and metadata for lidar scans; record with audio, video, and images; and preload manuals for RAPID equipment, among other capabilities. A simplified version of RApp will be available in 2021 for use on iPhones. More information on RApp and user training are available on the RAPID website and recorded webinars hosted on the Converge website7.
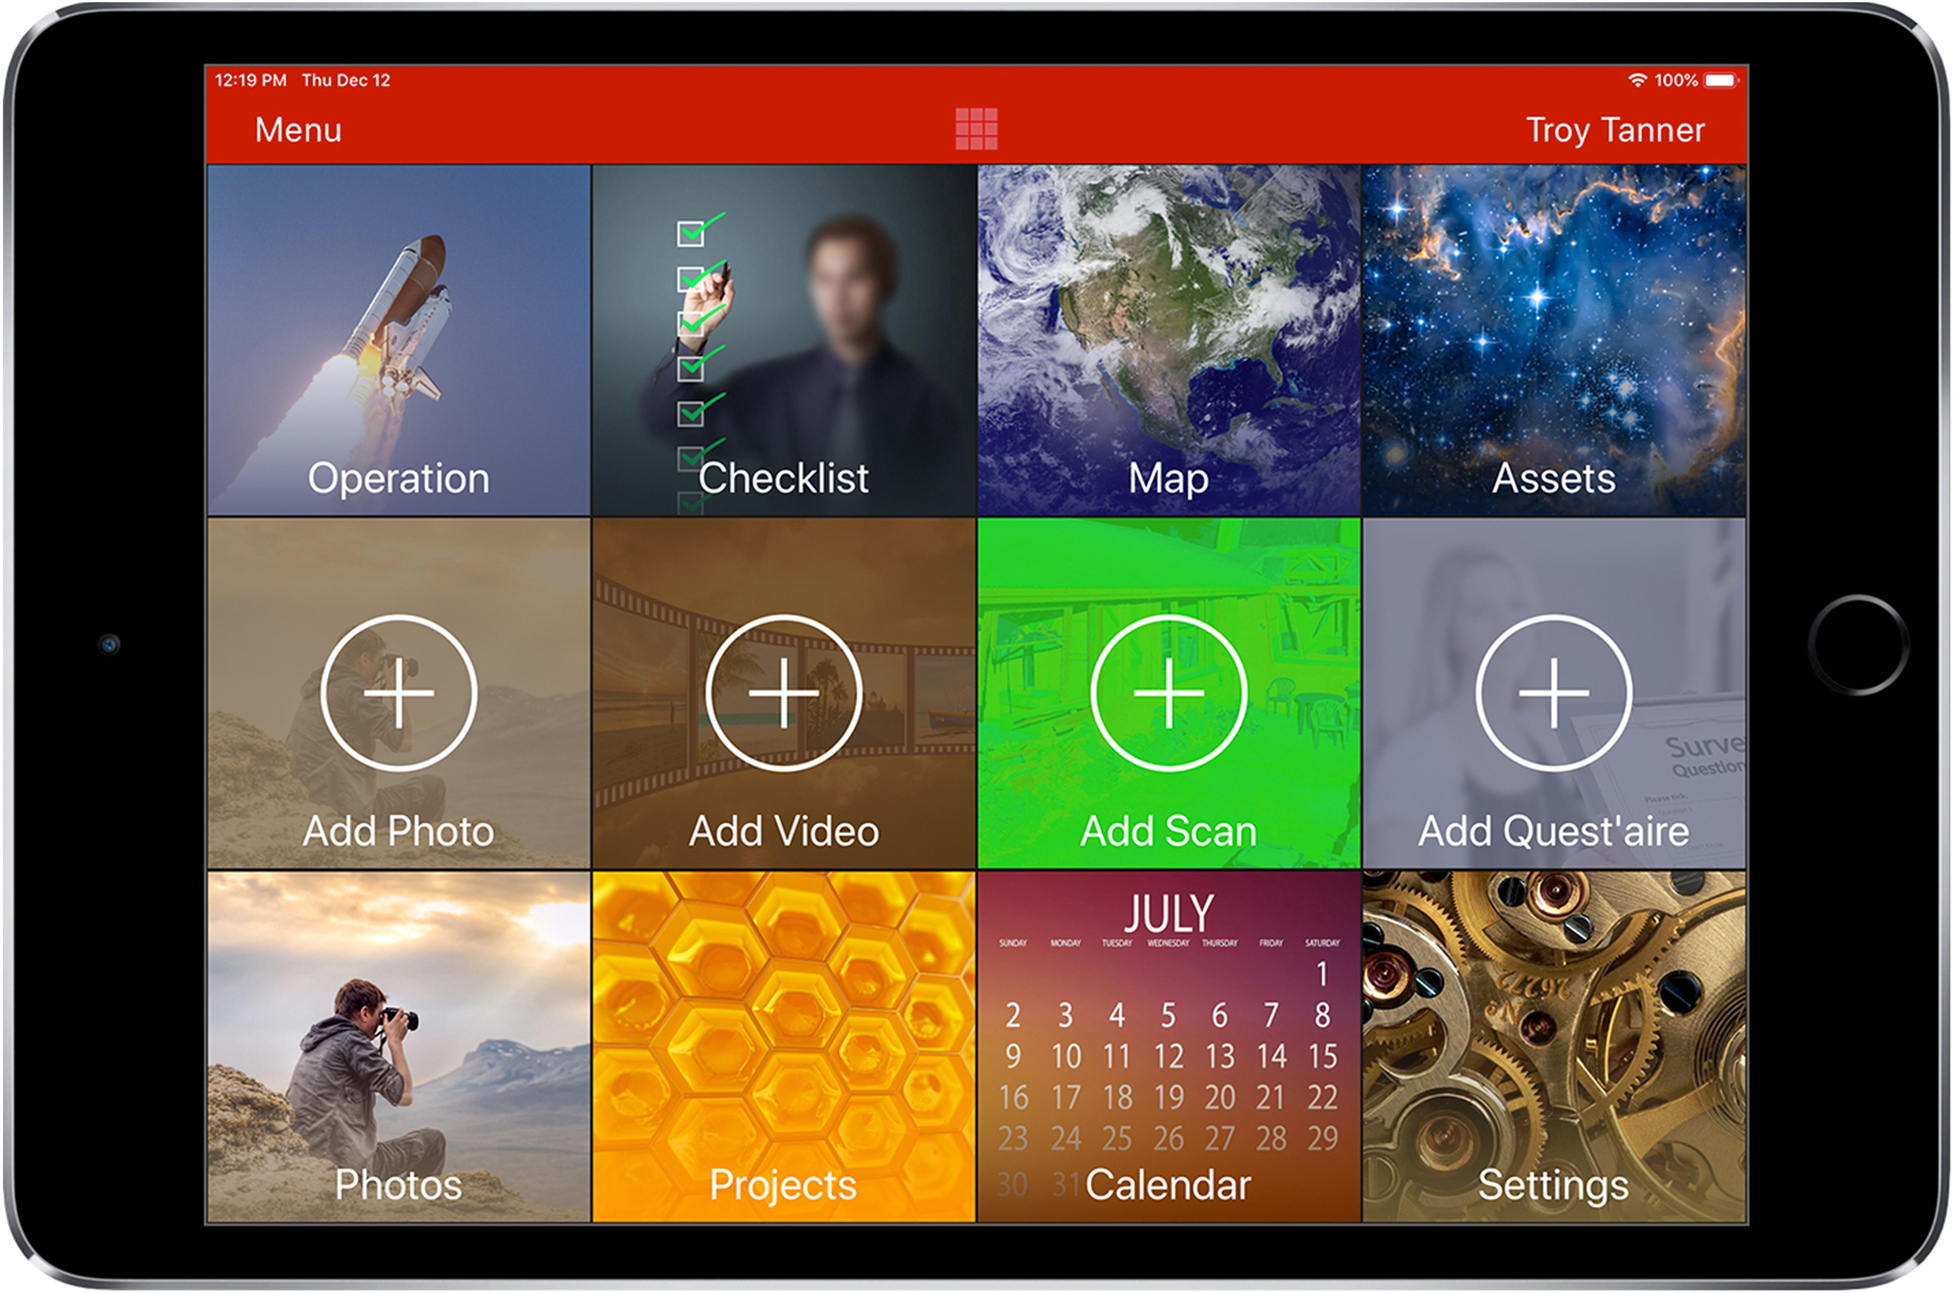
Figure 4. RApp main screen with customizable tiles.
Equipment and Software for Social Science Reconnaissance Applications
The RAPID has developed RApp as its primary tool to support Social Science reconnaissance applications, as well as interdisciplinary research that requires linking social and behavioral data with other data, in time and space. Beginning in late 2020, RApp is supporting complex questionnaires (“surveys”) that have logic-based structures (i.e., conditional branching, wherein the answer to one question determines which question follows) and will include a library of pre-constructed questionnaires (a.k.a. survey instruments) that have been used in social science reconnaissance. The library of questionnaires is being developed in collaboration with CONVERGE (Peek et al., 2020). RApp also supports collection of audio and video.
The RAPID’s other equipment, in particular its imaging equipment, is also of value to the social sciences. For example, RAPID equipment such as the street view systems and UAV systems can be used to capture image data that can be processed or distilled to understand communities’ responses to natural hazards, long-term community recovery, and demographic changes. Additionally, image data gathered in communities before any natural hazard events can be used to help planners and policymakers consider and envision mitigation measures.
Data Processing Equipment
Processing of data collected with some of the RAPID equipment requires substantial graphics processing power and specialized software. Necessary processing includes integration of multiple lidar scans of a single scene (referred to as registration), the development of SfM/MVS models from images, and the development of StreetView scenes from the images collected from one of RAPID’s StreetView cameras. RAPID maintains a number of processing workstations and laptops with high-powered graphic processing units (GPUs) to provide facility users with access to computational resources and software necessary to do this processing. The data processing workstations and laptops are also available for use in data interrogation, i.e., exploring 3D point clouds to make detailed measurements. As described below, some processing is carried out by RAPID staff, while other data processing is the facility users’ responsibility. RAPID headquarters also houses a mini-computer automatic virtual environment (mini-CAVE) system, which helps users interrogate point clouds in a 3D immersive environment. This system can help identify the key characteristics of the damage data set, which are not as apparent in 3D visualization software in a 2D workstation environment.
Rapid Services
Field Support
RAPID staff have training and expertise in all of the facility’s equipment. If desired, RAPID staff will accompany researchers into the field to collect perishable data. However, the RAPID also operates with the objective of expanding expertise in the use of the facility tools and technologies and encourages users to train on and operate the equipment themselves. Only two pieces of the RAPID’s equipment require RAPID staff to operate: the hydrographic survey boat (Figure 3) and the UAS lidar system. Other equipment may be operated by users, except that Remote Pilot Certification from the United States Federal Aviation Administration (FAA) is required to operate RAPID’s UASs.
The RAPID also offers remote field support when needed. RAPID staff can walk users through problems with the equipment and guide field operation in difficult or unforeseen conditions. All equipment is shipped with simplified user manuals that RAPID has developed to quickly assist users in the field.
Data Processing Support and Data Archiving
The RAPID provides data processing support to maximize the advances enabled by the collected data, to ensure systematic data collection by the natural hazards reconnaissance community, and to provide confidence in data for reuse. This support includes baseline data processing for certain data types, including GNSS and total station data, the processing of StreetView data, and other basic data processing. To provide user support and software licenses for processing complex data sets such as lidar and SfM/MVS point cloud models, RAPID provides in-person data processing workshops at the RAPID headquarters, remote assistance via web conferencing, and shippable high-powered GPU laptops.
All data collected for NSF-supported natural hazards reconnaissance missions must be archived and made publicly available. The DesignSafe cyberinfrastructure is where data collected via RAPID equipment are archived. DesignSafe and RAPID have collaborated to create a data model for field data, ensuring that the necessary metadata are archived along with the data, maximizing its use in the future. RAPID staff ensure that all raw data collected with RAPID equipment are archived to the NHERI cyberinfrastructure DesignSafe and made publicly available by the users in a typical time frame of 3–9 months.
User Training
User training is critical to the mission and operation of the RAPID. To achieve the objectives identified in the facility’s science plan, data must be collected by the entire natural hazards and disaster research community as they participate in reconnaissance efforts, not just by the limited facility staff. Therefore, training users in systematic data collection methods, basic data processing, and archiving and publishing of the data on DesignSafe is a core service provided by RAPID. Each summer, the RAPID holds an intensive weeklong workshop that provides attendees with the hands-on experience necessary to deploy RAPID equipment themselves. Attendees of this workshop, listed on the RAPID website, are considered advanced users. In the 30 months that RAPID has been operating, many workshop attendees have been deployed with RAPID equipment on reconnaissance missions. In addition to the RAPID’s summer workshop, user training is also provided on a one-on-one basis as needed, including refreshers on particular instruments in the days immediately preceding fieldwork.
Logistics Support
RAPID provides facility users with logistical support related to equipment use. For example, multiple options are available for users to receive the facility’s equipment. During the first 18 months of operations, RAPID provided facility users equipment by having it (i) shipped to their home or work prior to departure, (ii) sent to a shipping facility (e.g., FedEx office) for pickup, (iii) handed off by other field teams who were using it in the same locations, (iv) accompany RAPID staff during travel to support the field researchers, and (v) picked up directly at RAPID headquarters by users traveling through Seattle on their way to the field (typically for deployments to Asia). RAPID also provides support on procedures for traveling or shipping equipment internationally, including advice on appropriate customs protocols.
Example Deployments of Rapid Resources
RAPID resources have been deployed by more than 50 researchers to gather perishable data following natural hazards and disasters and have also been used in creative ways to support other research since the facility began operations in September 2018. RAPID has supported reconnaissance following significant hurricanes in the United States and the Caribbean (e.g., Hurricanes Florence, Michael, and Dorian), earthquakes in the United States (e.g., Ridgecrest, California, and Anchorage, Alaska) and abroad (e.g., Hokkaido, Japan; Palu, Indonesia; and Puerto Rico), as well as numerous smaller events such as landslides in Oregon and Alaska. The facility also deployed lidar and imaging equipment to document the damage following the Camp Wildfires in Paradise, CA, and to support data collection for major shake table experiments at the E-Defense research facility in Japan. Thus far, the facility has served more than 40 deployments of equipment and/or staff, supporting researchers from academia, government, state agencies, and the private sector. The sections below highlight three representative deployments that illustrate the RAPID equipment’s capabilities and demonstrate the scientific and engineering advances enabled by the collection of high-resolution, interdisciplinary data. More information on past RAPID deployments and links to collected, publicly available data sets are available on the RAPID’s website8.
Case Study 1: Damaged Building Reconnaissance in Hurricane Michael
Hurricane Michael struck the Florida coast’s panhandle region on 10 October 2018 as a Category 4 hurricane and caused widespread devastation. The event’s impact was substantial, causing near-total destruction of the city of Mexico Beach, with maximum sustained winds exceeding 250 km/h (155 mph) and a storm surge exceeding 4 m. Panama City, FL, approximately 38 km from Mexico Beach, was also struck with winds exceeding 225 km/h (140 mph) and a storm surge of nearly 2 m.
Reconnaissance performed by StEER within a few days of the hurricane’s landfall found widespread damage to buildings and infrastructure throughout the region (Alipour et al., 2018). StEER recommended detailed follow-up investigations based on their initial findings. Of those, several related to the observed high rate of failure of low-rise large-volume steel-framed buildings (LRLVBs). This prompted a second data-gathering effort, supported by a collaborative NSF RAPID grant, to collect detailed perishable data on the performance of LRLVBs and to search for potentially systematic modes of failure that might point to necessary changes in building design.
LRLVBs are an important and common structure type, as their uses include storage, shipping hubs, manufacturing, grocery and retail, and even schools (i.e., gymnasiums). They often house many jobs, especially when aggregated over a region, and severe damage to these structures can negatively affect recovery. Panama City is an industrial hub in Florida’s affected region, with over 1.5 million people in its metropolitan region and many LRLVBs that suffered damage during Hurricane Michael. This area was the focus of the follow-up reconnaissance effort.
The reconnaissance team, led by Profs. David Roueche and Justin Marshall from Auburn University and Prof. Jeffrey Berman from UW, deployed RAPID staff and equipment to collect perishable data characterizing full and partially collapsed LRLVBs. The equipment utilized included long- and short-range terrestrial lidar scanners, UASs, surveying equipment (total station and GNSS), and various camera systems. The fieldwork lasted 5 days and resulted in the detailed documentation of 12 buildings for which the collected data sets are available on DesignSafe (Berman et al., 2020). The initial StEER reconnaissance efforts identified several of the buildings, and others were added by the research team while in the field.
Figure 5 shows a photo of a damaged LRLVB, a marine storage structure constructed using a proprietary steel-framed building system and a light-gauge steel cladding. While the building system was proprietary, it was composed mainly of I-shaped beams and columns with conventional bolted connections. As shown, the building suffered a partial collapse as one of the short walls, facing the northwest, collapsed into the structure’s interior.
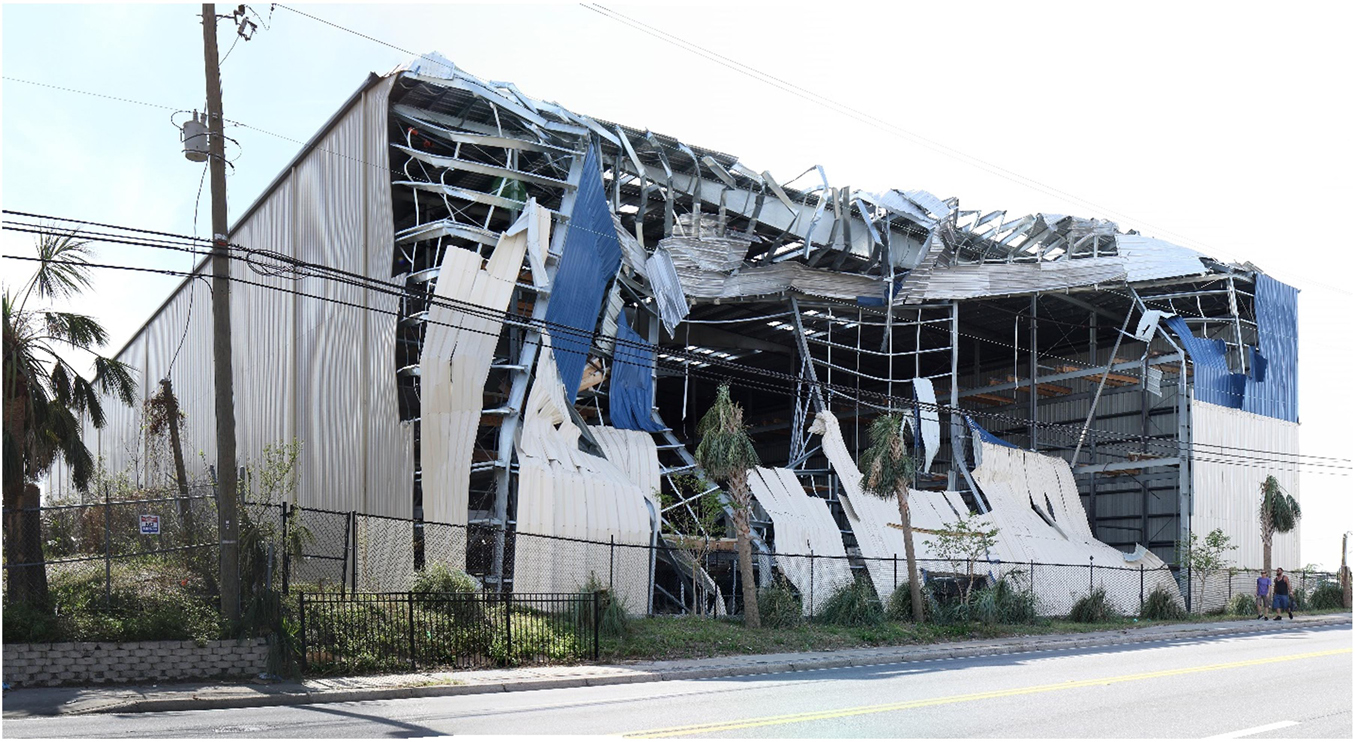
Figure 5. Partially collapsed marine storage building in Panama City, FL.
The field team spent 1 day at this marina storage building. UAV flights were conducted to document roof and exterior damage and more than 30 lidar scans were taken of the building’s interior and exterior. GNSS was used to establish exterior control points for the UAV and the total station was used to survey targets captured in the lidar scans to improve registration accuracy.
The 3D point cloud of the interior of the building from the registered lidar scans is shown in Figure 6. As shown, the structure is difficult to observe, as the building was full of debris and of boats still in their storage racks. One advantage of lidar in reconnaissance applications is the ability to “clean” the point clouds to expose the important information and strip away extraneous objects. Figure 7 shows a point cloud model of the building’s interior following cleaning to the remove debris, storage racks, boats, and other objects. As shown, the structural system is now completely visible, enabling the measurement of spans, heights, section characteristics, connections, etc.
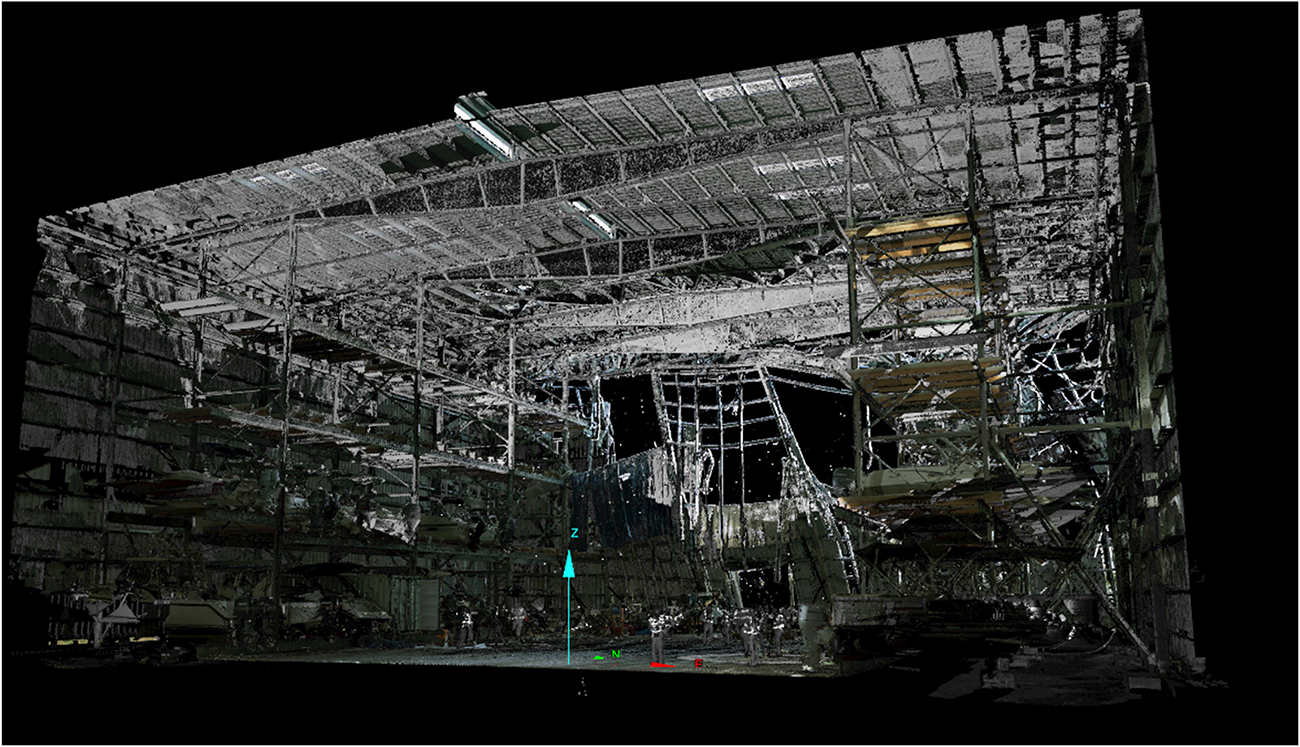
Figure 6. 3D point cloud from lidar scans of the interior of the damaged marine storage building before cleaning (removal of debris to expose the structural system).
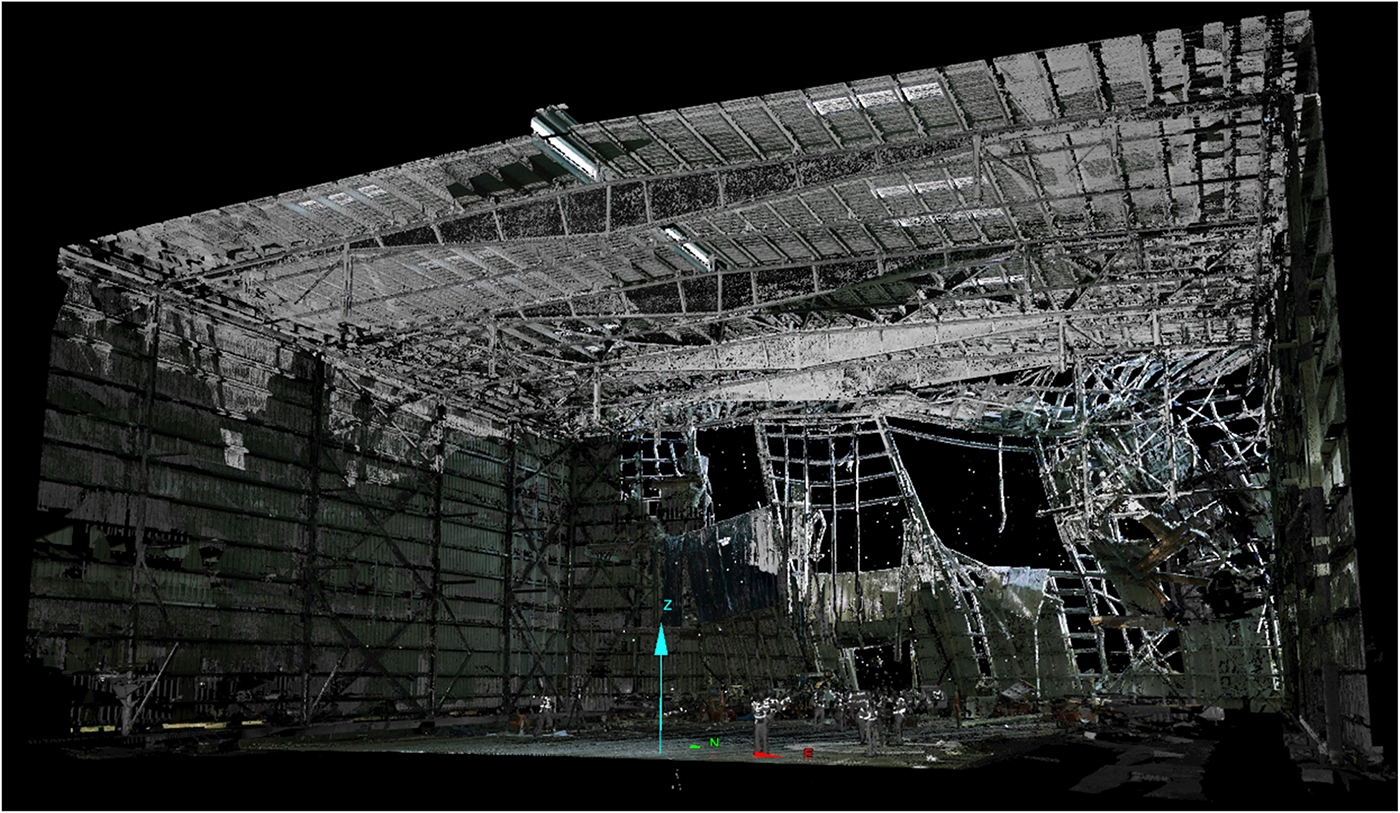
Figure 7. 3D point cloud from lidar scans of the interior of the damaged marine storage building after cleaning (removal of debris to expose the structural system).
While the research team continues to analyze the failure modes of the LRLVBs during Hurricane Michael, trends have emerged in the collected data. In all cases, the collapse or partial collapse was initiated in a shorter wall that collapsed into the building, similar to that shown above for the Marine Storage Building, and also similar to that shown in Figure 8, which shows registered lidar scans of the exterior of a beverage distribution building. In these buildings, moment frame action is used to resist the wind loads applied on the longer sides of the buildings. However, wind loads on the short walls are transferred through the roof to lateral bracing along the long walls. Although work continues to identify the exact failure modes, it is believed that failure of roof purlins or trusses that are under compression to transfer those exterior wind loads from the short walls to the lateral bracing likely initiated the collapse. Those roof members would also be under negative bending moment due to suction on the roof and were likely insufficient to resist the combined compression and bending demands. Figure 8B shows a point cloud of the roof purlins attached to the main exterior and first interior girders extracted from the building in Figure 8A. Such detailed models allow for investigation of the failure mode.
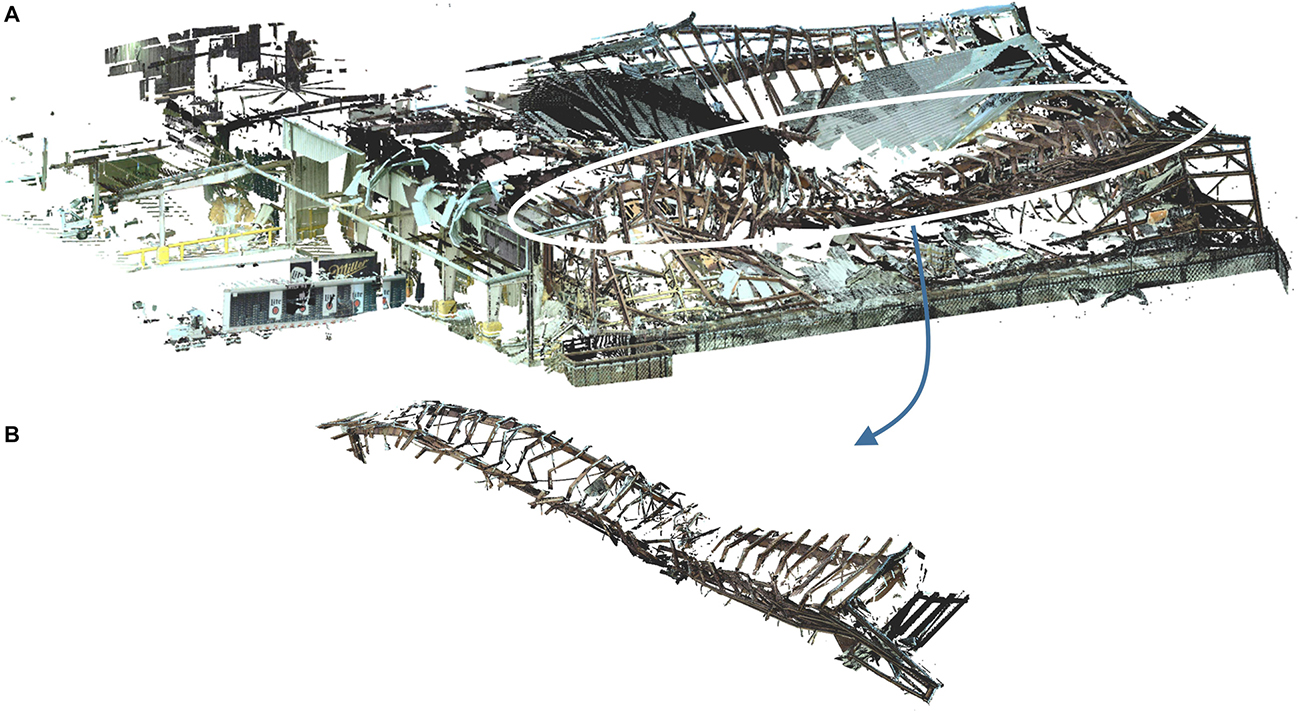
Figure 8. (A) 3D point cloud from lidar scans of the exterior of a beverage distribution building. Scans were only obtained from one side of the building, showing the shorter face of the building and the collapsed roof framing members. (B) Two lines of main girders [circled in (A)] and their connected roof purlins extracted from the full point cloud.
The collected lidar and image data from the 12 buildings surveyed are being used to enable the development of structural models and to formulate hypotheses for the collapse mechanisms. Findings from these collected data and subsequent data will likely inform future building code and construction changes to ensure more robust LRLVB design in the future. Such advances will ultimately improve community resilience in hurricane-prone regions where such buildings provide critical economic and social functions.
Case Study 2: Flowslide Mapping following the 2018 Palu-Donggala Earthquake
The Mw7.5 Palu-Donggala earthquake occurred on 28 September 2018 in Sulawesi, Indonesia. The earthquake triggered a series of massive landslides (classified as “flowslides”), collapsed both unreinforced and reinforced structures, and generated tsunami waves that impacted coastal areas surrounding Palu Bay. Government officials estimate that the earthquake and its secondary effects killed over 4,000 people and resulted in capital losses of approximately USD$900M. The significant loss of life makes the Palu-Donggala earthquake the deadliest natural disaster worldwide in 2018 and the deadliest earthquake to affect Indonesia since the 2006 Yogyakarta earthquake. A substantial majority of the fatalities were directly related to the flowslides, making this one of the most significant landslide disasters of the past several decades.
In November 2018, the Geotechnical Extreme Events Reconnaissance (GEER) association mobilized a team that arrived in the affected region and conducted 6 days of extensive fieldwork (Mason et al., 2019; Gallant et al., 2020). The GEER team included 5 U.S.-based and 15 Indonesian-based investigators. The team assessed local geology, collected perishable field data, and obtained eyewitness accounts to understand the mechanisms responsible for the initiation and progression of the large significant flowslides in the region.
The RAPID supported the GEER reconnaissance mission by providing in-field staffing (including a drone pilot) and instrumentation including UAVs, high-resolution GPS, and the mobile software RApp. The field team mapped the flowslides at high resolution using a DJI Inspire 2 UAV mated with a Zenmuse X4S camera (1-in. sensor, with 20 MP resolution). RTK GPS measurements were used to determine the coordinates of a network of ground control points to increase survey accuracy. The UAV flights were typically flown at an elevation of 65 m (with the nadir images having 75% overlap), providing a ground sampling distance pixel resolution of ∼2 cm. The GPS control allowed the post-processed digital ground surface model to achieve a 95% confidence interval geolocation accuracy of ∼10 cm across study areas spanning up to several square kilometers.
The UAV photographs were post-processed using the Pix4D software “Mapper” to develop high-resolution orthomosaic images and digital surface models. Figure 9 compares an approximately 15,000 m2 portion of a larger (>1 km2) geo-referenced, true-color orthomosaic image with a post-event crisis response satellite imagery of the same area provided by Google Earth. The orthomosaic pixel size is ∼2 cm, providing a superb resolution that allows small features such as building components and ground cracks to be located, mapped, and measured. The full-size orthomosaic image includes information on buildings’ post-earthquake conditions and critical infrastructure such as roads, canals, and levees.
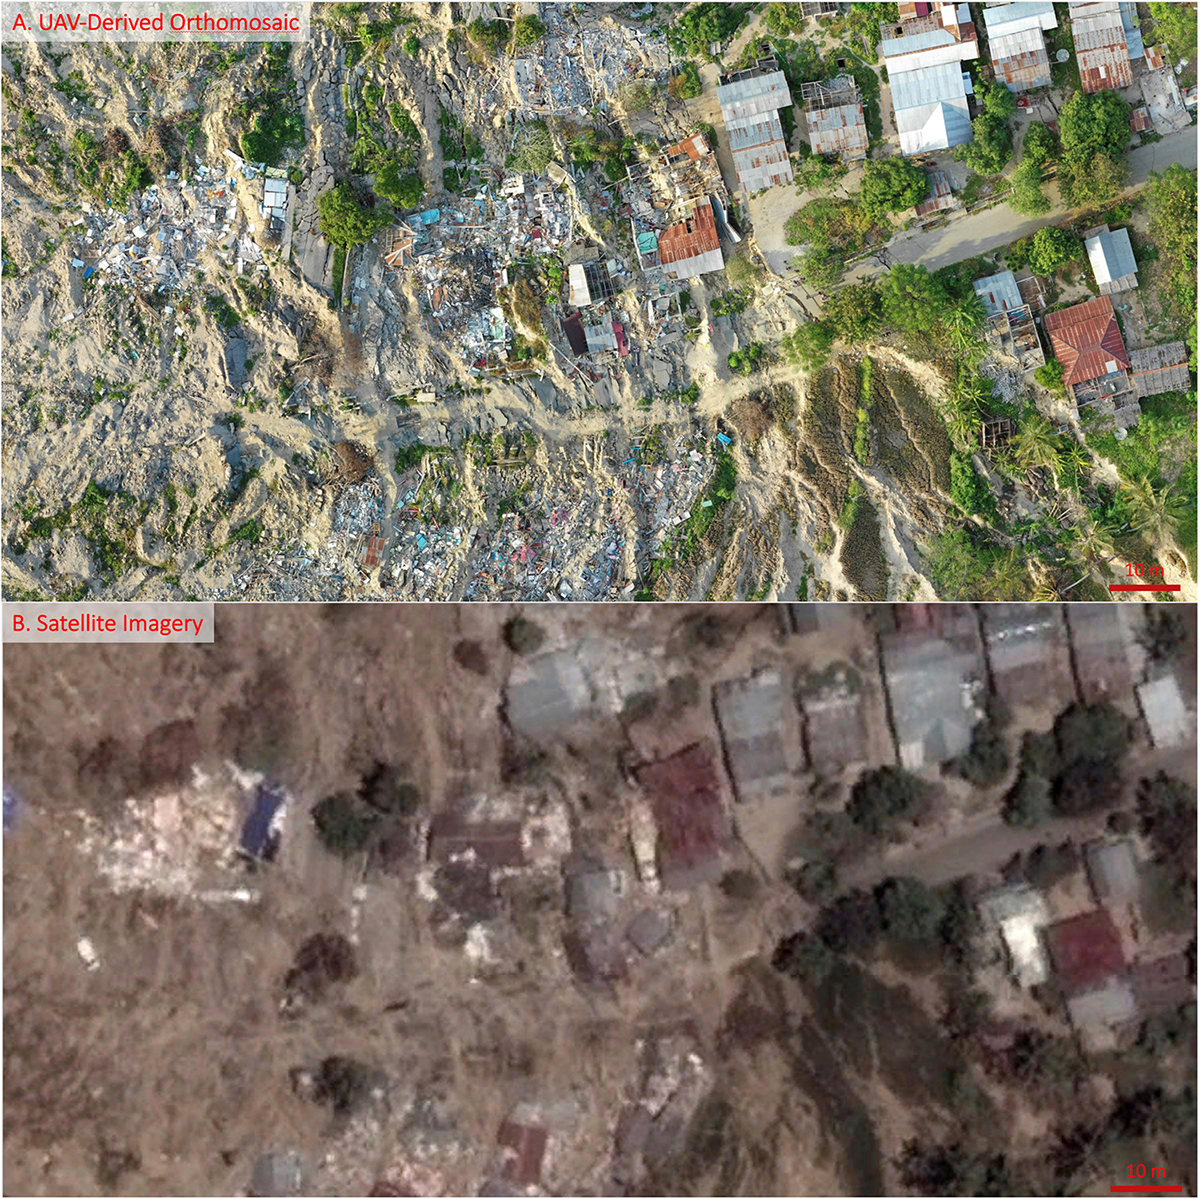
Figure 9. (A) Example of a portion of a high-resolution (∼2 cm pixel) orthomosaic of a flowslide. (B) Shown for comparison is a post-earthquake satellite image of the same scene provided by Google Earth crisis response program. Note the dramatic difference in resolution between the images.
Figures 10, 11 are true-color and shaded relief digital surface models, respectively, of the upper part of a flowslide in Palu City. The shaded relief image is a digitally derived model depicting shadows from simulated sunlight. In this case, the sunlight is generated from the right side of the model allowing the features of the terrain in the slide area to be identified via the shadows. This helps to accentuate subtle morphological features on the ground surface. Taken together, Figures 10, 11 reveal distinct zones with different modes of ground deformation, post-earthquake geomorphologic expression, and erosive or depositional features. Specifically, the upper part of the flowslide (to the right) is characterized by large tension cracks and graben-like down-dropped and back-rotated blocks of ground, resulting in differential settlement and lateral spreading. In the lower portion of the flowslide, the ground blocks generally disintegrate and decrease in size. Evidence of erosion is visible in some localized areas. The vegetation across the flowslide region was low lying (generally less than 50 cm tall), and therefore, the digital surface model, which includes ground cover, closely approximates a digital elevation model of the ground surface. It is also worth noting that the ground deformation entirely occurs downslope of an agricultural canal.
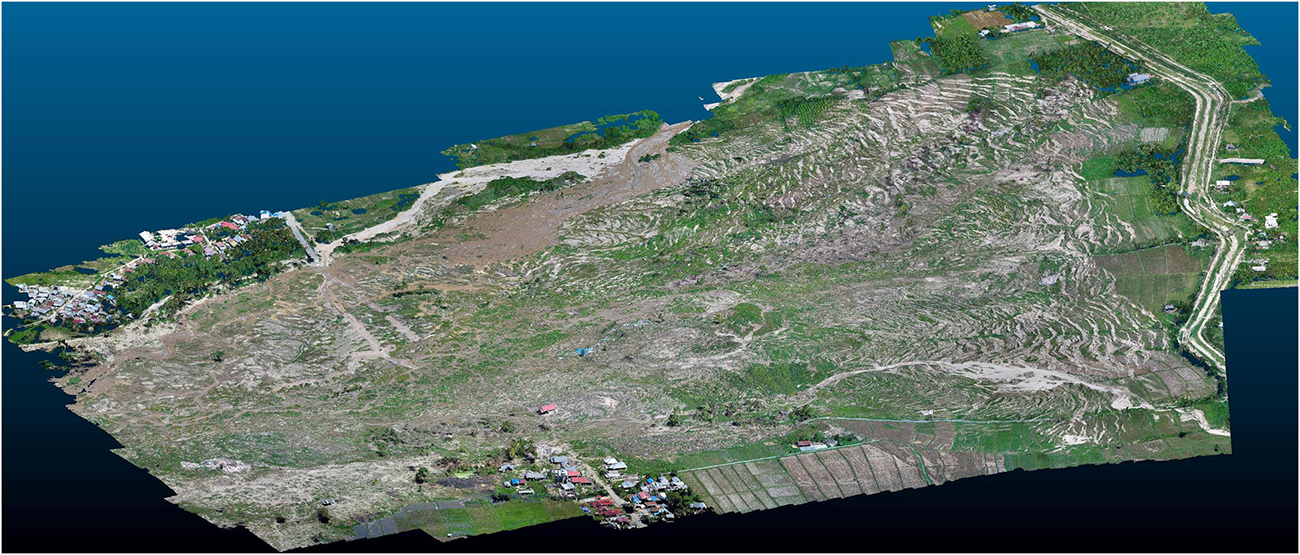
Figure 10. True-color digital surface model (shown as a “point cloud”) of a flowslide.
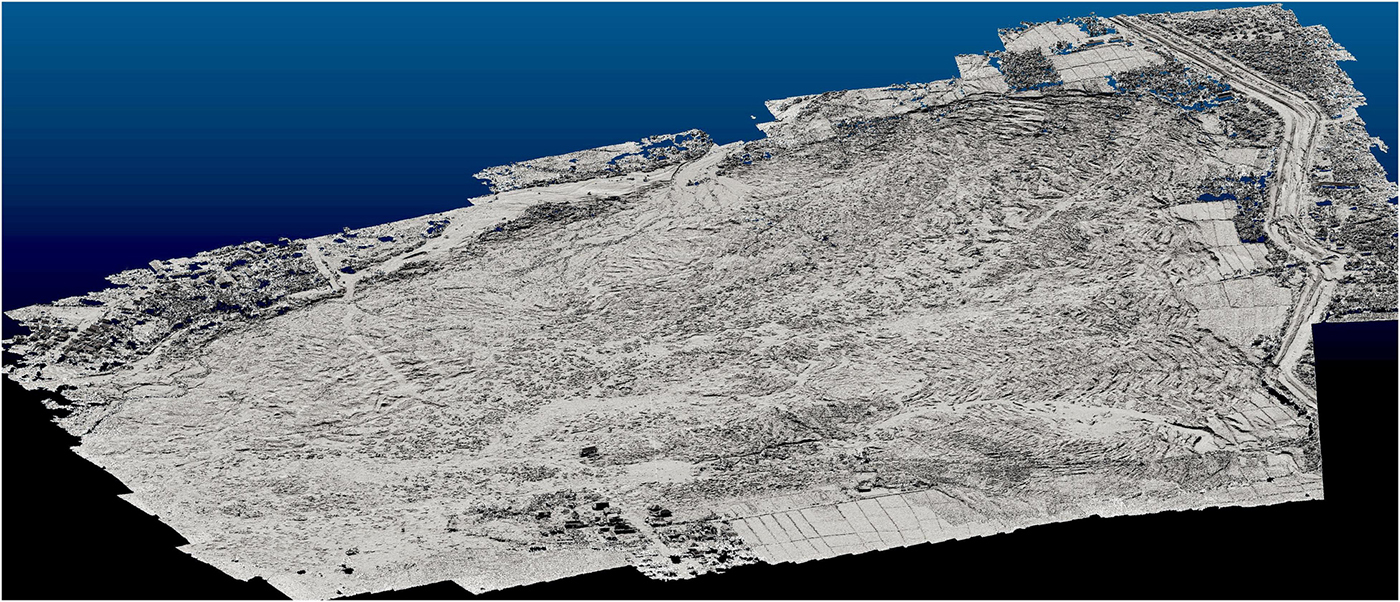
Figure 11. Shaded relief digital surface model of a flowslide. North is toward the top. Simulated sunlight shines southward at 45° to the horizon.
Based on the high-resolution UAV surveys and other reconnaissance observations, including eyewitness interviews, Mason et al. (2020) reached several key conclusions:
1. Earthquake-induced soil liquefaction triggered the flowslide movement.
2. Anthropogenic modification of the landscape played a critical role in the initiation of the flowslides. Specifically, the construction and operation of an unlined agricultural canal artificially recharged groundwater in the flowslide area.
3. The flowslides were not coseismic but instead occurred a short time after the earthquake shaking ended, which may be attributed to the phenomenon of void distribution in the liquefied soils (Mason et al., 2020).
Case Study 3: Characterization of Damage to United States Highway 101 From the Hooskanaden Landslide
On 24 February 2019, after intense rainfall, a large surge event occurred at the Hooskanaden landslide, significantly damaging approximately 1 km of United States Highway 101 in Southwest Oregon, near the California border (Figure 12). The highway was closed for nearly 2 weeks while emergency operations were underway. The event resulted in 45 m of horizontal movement and 12 m of downward vertical movement of Highway 101 (Alberti et al., 2020) with horizontal velocities of up to 60 cm/h. Six meters of uplift (Figure 13) was observed at the toe of the slide, which daylighted on the cobble/gravel beach adjacent to the Pacific Ocean. The slide rises from 0 to 160 m in elevation with an approximate slope of 15°. Geologically, the site is predominately melange material with pockets of hard and soft material within a moderately weak soil matrix. This location is tectonically active and part of the Cascadia Subduction Zone. This seismicity, combined with high rainfall and frequent storm activity, has resulted in rugged terrain across the slide.
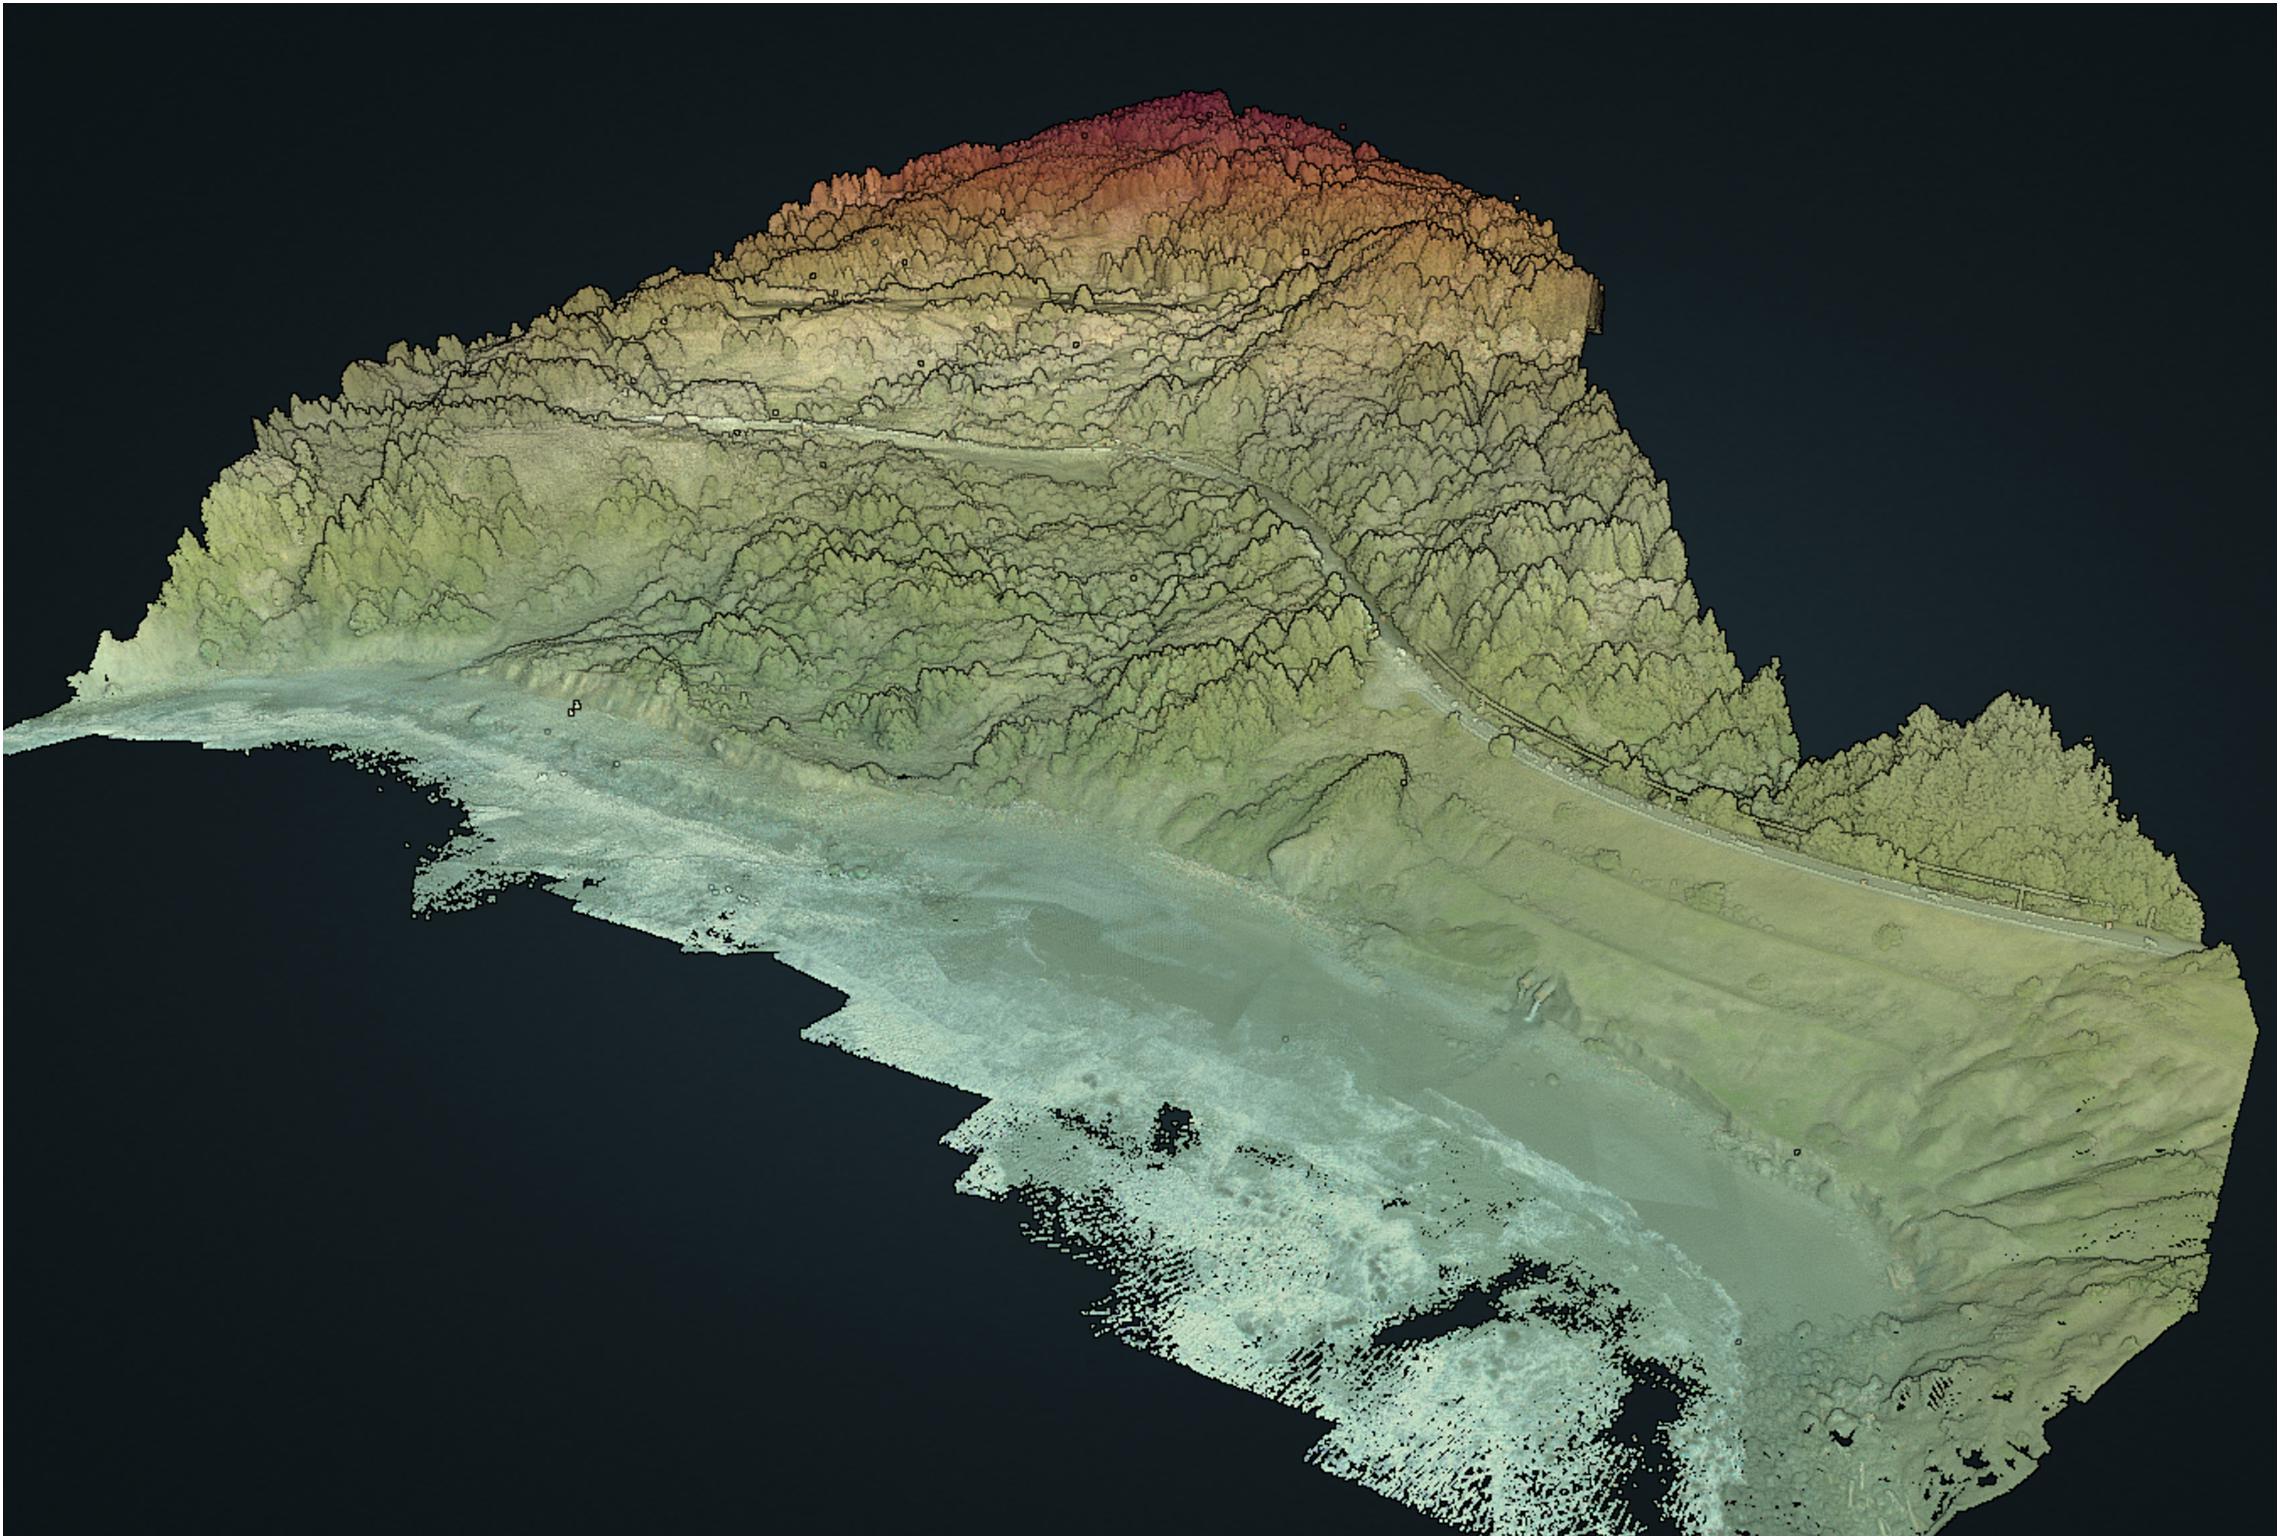
Figure 12. UAS lidar point cloud of the Hooskanaden landslide showing overview with colors blended from elevation and RGB.
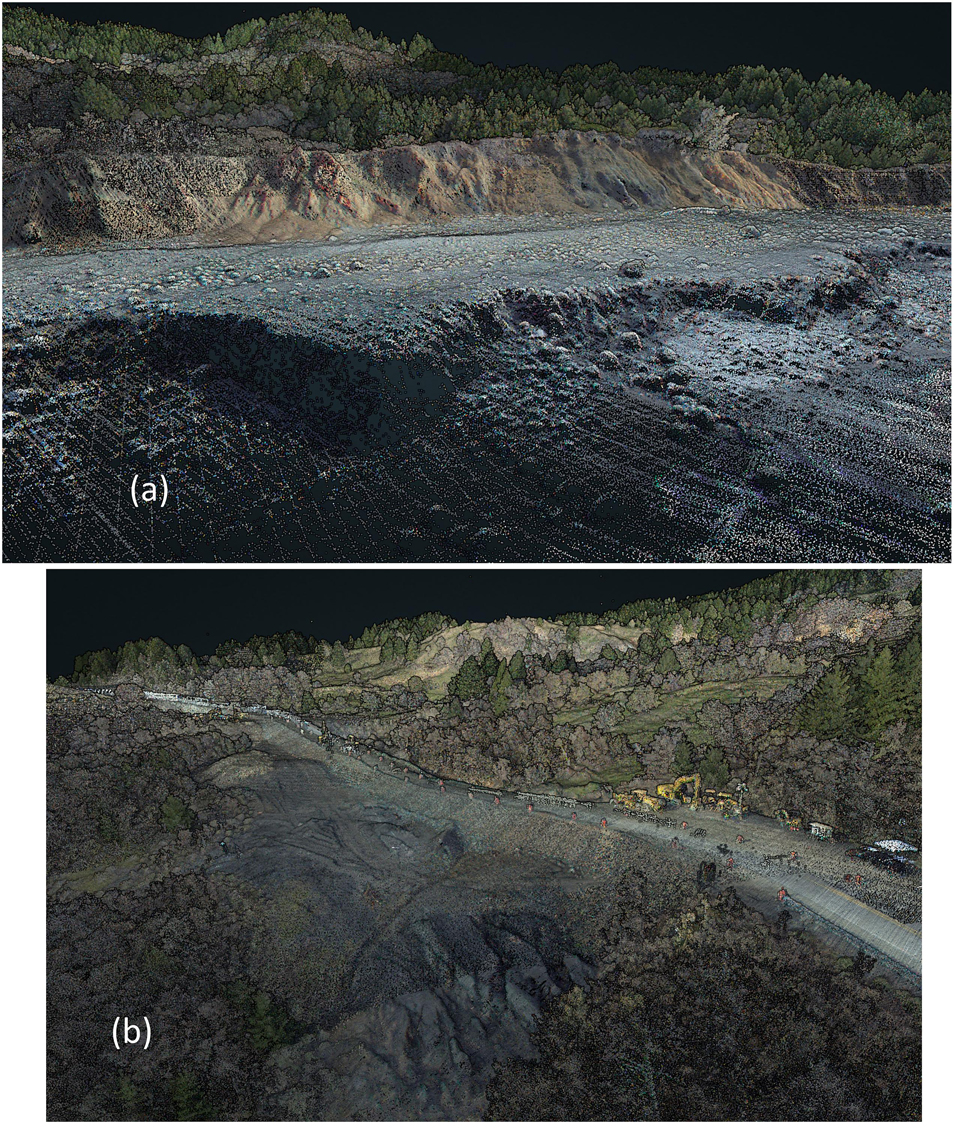
Figure 13. UAS lidar point cloud of the Hooskanaden landslide showing (a) uplift at the toe on the cobble beach (RGB) and (b) reconstruction of the highway in progress at the time of survey.
Over the last several decades, the Hooskanaden landslide has continually resulted in costly maintenance and repairs for Highway 101 by Oregon DOT. As a result, it was selected as one of the key sites for a long-term coastal landslide monitoring study by an Oregon State University research team consisting of Ben Leshchinsky, Michael Bunn, Matt O’Banion, Andrew Senogles, Stefano Alberti, and Joann Herrmann, and Oregon DOT collaborators Curran Mohney, Jill Dekoekkoek, Geoff Crook, and Kira Glover-Cutter. The research team had collected over 3 years of terrestrial lidar surveys at the site, established reference points for total station surveys, as well as a MEMs sensor array to track movements with high temporal frequency. Unfortunately, monitoring pins for the total station were repeatedly lost due to excessive movement of the slide and maintenance operations. The MEMs sensor sheared after approximately 1 month of operation. Given the immense size of the slide (nearly 0.5 km2) and rugged terrain, it is not feasible to capture Terrestrial lidar data on the entire slide. As a result, the terrestrial lidar efforts were focused on key vantage points, including detailed scans of the sea cliff.
Two sets of UAS lidar were acquired at the site by the RAPID: March 2019 and June 2019, each requiring 3 days of field acquisition. A total of 24 and 17 flights were completed for the first and second surveys, respectively. Terrain following was implemented on the UAS, given the steep terrain changes present at the site. Not only were these data useful for the research team to aid in the interpretation of the slide, but the data were also utilized by Oregon DOT to support the emergency repairs as well as the design and reconstruction of the highway (Figure 13). These measurements of movement were computed by comparing UAS lidar measurements with terrestrial lidar scans acquired in Fall 2018. In addition to the measurements, the data were used by the research team and ODOT to map tension cracks and other features in the slide that could clearly be distinguished from the high-resolution DEM. Key advantages of the UAS lidar include the ability to capture the entire slide area in high detail as well as the ability to obtain an improved ground model over the terrestrial lidar given the improved vantage point above the ground.
The UAS lidar data were georeferenced by the RAPID facility using inertial explorer and Phoenix Lidar Systems’ software using the GNSS receiver measurements, Inertial Navigation System (INS), and laser scanner to produce the point cloud. Following the direct georeferencing using the sensor components, a vertical (Z) only adjustment was completed to minimize errors between the individual flights by comparing vertical offsets between overlapping flights. Table 1 provides summary statistics of the overall adjustment. Overall, minimal adjustment was required given the relatively high agreement between flights. Nevertheless, biases of 7–10 cm were observed when comparing against terrestrial lidar scans acquired at the same time. Further, scatter of the UAS lidar data of ± 5 cm within a flight were commonly observed on hard surfaces such as the cobble/gravel beach and the road surface. The resolution was also considerably lower than the terrestrial lidar data but was relatively uniform across the site such that a 0.2 m DEM was produced for the entire slide. Herein, a simple accuracy assessment is provided. A rigorous accuracy assessment of the RAPID’s UAS lidar can be found in Babbel et al. (2019), which shows similar accuracy results to those presented in this case study.
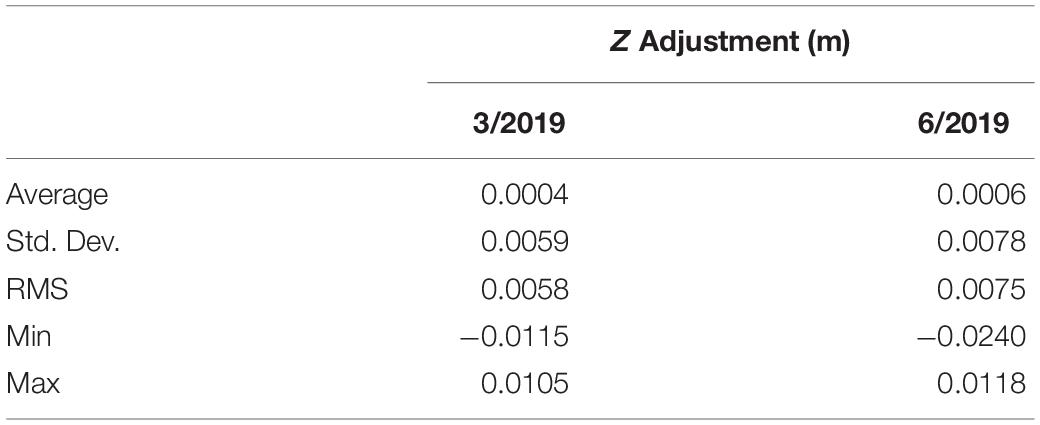
Table 1. Flight elevation (Z) adjustment statistics following the direct georeferencing solution for the March and June 2019 survey.
Ultimately, the ability to efficiently obtain data across the entire landslide, minimal time of mobilization, and overall quality of data made the UAS lidar the optimal choice for obtaining the post-event DEMs over alternatives such as terrestrial and airborne lidar and SfM/MVS photogrammetric methods.
Summary and Conclusion
After 2 years of development and close to 2 years of field operations, the NHERI RAPID Facility is providing the natural hazards and disaster research communities with the equipment and support services to transform reconnaissance and data collection following extreme events. The RAPID hosts equipment and has developed software with applications that cross disciplines from engineering to the natural and social sciences. These developments have resulted in the collection of high-quality, high-resolution data sets that are enabling new science and engineering findings, ultimately leading to improved community resilience to natural hazards. To date, RAPID has deployed equipment and/or staff to more than 60 missions worldwide. Data have been collected following hurricanes, earthquakes, tsunamis, tornadoes, and landslides, and in other applications, such as supplementing laboratory instrumentation in large-scale structural engineering experiments.
As the example projects highlighted above demonstrate, the RAPID’s equipment and workflows enable field teams to collect perishable data at multiple scales and with the resolution and accuracy necessary to make critical measurements and observations. RAPID’s user training provides facility users with the expertise required to collect data themselves while RAPID’s staff has expertise in all of the facility’s equipment and can accompany teams when requested. RApp, the RAPID’s mobile software platform, supports direct data collection such as images, audio, and custom-designed questionnaires, with an eye toward applications in the social sciences, as well as collecting metadata from the RAPID’s other equipment and helping to coordinate teams in the field. Data and metadata collected with RApp are geolocated to facilitate collection and data linkage and are automatically uploaded to DesignSafe, enabling data collection over large areas and data reuse for advancing our understanding of natural hazard impacts.
With contributions and input from many in the natural hazards and disaster engineering, sciences, and social sciences communities, the newly operational NHERI RAPID Facility is transforming reconnaissance methods following natural disasters. The impact of the unprecedented volume of quality of data being collected from the real-world laboratory will not be known for some time. However, it is clear as researchers begin to use the collected data to help understand the impacts of natural hazards, inform simulation models, and link new models that cross disciplines. Such data are crucial in making discoveries that will improve community resilience. Further, the facility has raised questions and sparked recent discussions (and collaboration with CONVERGE) about integrating data across disciplines, including data formats, ethics, and questions about appropriate standardization of disaster reconnaissance data.
Data Availability Statement
Publicly available datasets were analyzed in this study. This data can be found here: Berman et al. (2020).
Ethics Statement
Written informed consent was obtained from the individual(s) for the publication of any potentially identifiable images or data included in this article.
Author Contributions
JB, JW, MO, JI, SM, KG, LL, AB, and TT collaboratively developed the RAPID Facility, its science plan, and strategic objectives, which were conveyed to NSF through internal reporting and have informed the text here. MG, AL, JP, JB, JW, JD, and MO carried out the day-to-day operations of the facility and designed the RAPID’s operations. All authors contributed to manuscript revision, read, and approved the submitted version.
Funding
The RAPID Facility operates under a cooperative agreement with the NSF under Award No. CMMI: 1611820. Research on the performance of LRLVBs in Hurricane Michael was supported by the NSF under award nos. 1904653 and 1904327. Research on the flow slide during the Palu, Indonesia earthquake was supported by the NSF through GEER under award number 1826118. Any opinions, findings, conclusions, and recommendations presented in this paper are those of the authors and do not necessarily reflect the views of the National Science Foundation. Funding for the Hooskadaden Landslide case study were provided by Oregon DOT and FHWA (SPR807).
Conflict of Interest
JD was employed by Shannon and Wilson, Inc. after employed by the RAPID facility during its development.
The remaining authors declare that the research was conducted in the absence of any commercial or financial relationships that could be construed as a potential conflict of interest.
Acknowledgments
We acknowledge collaborators on the highlighted research projects, including Profs. David Roueche, Justin Marshall, and Jack Montgomery at Auburn University; Ben Mason at Oregon State University; and Daniel Hutabarat at U.C. Berkeley. Andrew Sengoles, Erzhue Che, and Ben Leshchinsky (OSU) assisted with the collection, processing, and analysis of the Hooskanaden landslide case study.
Footnotes
- ^ https://converge.colorado.edu/
- ^ http://www.geerassociation.org/
- ^ https://www.steer.network/
- ^ https://neerassociation.org/
- ^ https://rapid.designsafe-ci.org/
- ^ https://uscoastalresearch.org/dunex
- ^ https://converge.colorado.edu/communications/webinar-series/rapp-introduction-to-the-rapid-facility-field-data-collection-app
- ^ https://rapid.designsafe-ci.org/
References
Alberti, S., Senogles, A., Kingen, A., Booth, A., Castro, P., DeKoekkoek, J., et al. (2020). The Hooskanaden Landslide: Historic and Recent Surge Behavior of an Active Earthflow on the Oregon Coast. Berlin: Springer. doi: 10.1007/s10346-020-01466-8
Alipour, A., Aly, A. M., Davis, B., Mariantonieta, G. S., Kijewski-Correa, T., Lenjani, A., et al. (2018). Steer - Hurricane Michael: Preliminary Virtual Assessment Team (P-Vat) Report, Alexandria: National Science Foundation.
Babbel, B. J., Olsen, M. J., Che, E., Leshchinsky, B. A., Simpson, C., and Dafni, J. (2019). Evaluation of Uncrewed Aircraft Systems’ Lidar Data Quality. ISPRS Int. J. Geo-Inf 8:532. doi: 10.3390/ijgi8120532
Berman, J., Marshall, J., Roueche, D., Grilliot, M., Berman, J., Marshall, J., et al. (2020). “Low-rise large volume building reconnaissance after hurricane michael using RAPID facility technologies (lidar, UAVs, GPS, photos)”, in Hurricane Michael Reconn-Large Volume Buildings. DesignSafe-CI. Available online at: https://doi.org/10.17603/ds2-3jpz-sk97
Bray, J. D., Frost, J. D., Rathje, E. M., and Garcia, F. E. (2019). Recent Advances in Geotechnical Post-earthquake Reconnaissance. Front. Built Environ. 5:5. doi: 10.3389/fbuil.2019.00005
Gallant, A. P., Montgomery, J., Mason, H. B., et al. (2020). The Sibalaya flowslide initiated by the 28 September 2018 MW 7.5 Palu-Donggala, Indonesia earthquake. Landslides 17:2020. doi: 10.1007/s10346-020-01354-1
Greenwood, W. W., Lynch, J. P., and Zekkos, D. (2019). Applications of UAVs in civil infrastructure. J. Infrastruct. Syst. 25:04019002. doi: 10.1061/(asce)is.1943-555x.0000464
Mason, B., Gallant, A., Hutabarat, D., Montgomery, J., Reed, A., Wartman, J., et al. (2019). Geotechnical Reconnaissance: The 28 September 2018 M7.5 Palu-Donggala, Indonesia Earthquake. Report number: GEER-061. (Corvallis, OR: Oregon State University).
Mason, B., Montgomery, J., Gallant, A., Hutabarat, D., Reed, A., Wartman, J., et al. (2020). East Palu Valley Flowslides Induced by the 2018 MW 7.5 Palu-Donggala Earthquake, Geomorphology, Alexandria: National Science Foundation.
Miles, S. B., and Tanner, T. (2018). Designed a Disaster Reconnaissance Field App with a User-Centered Approach”,in Proceedings of the Eleventh U.S. National Conference of Earthquake Engineering. Los Angeles, CA.
Peek, L., Tobin, J., Adams, R., Wu, H., and Mathews, M. (2020). A Framework for Convergence Research in the Hazards and DisasterField: The Natural Hazards Engineering Research Infrastructure CONVERGE Facility. Frontiers 6:110. doi: 10.3389/fbuil.2020.00110
Rathje, E. M., Dawson, C., Padgett, J. E., Pinelli, J. P., Stanzione, D., Adair, A., et al. (2017). DesignSafe: New Cyberinfrastructure for Natural Hazards Engineering. Nat. Hazards Rev. 18:06017001. doi: 10.1061/(ASCE)NH.1527-6996.0000246
Roueche, D., Kijewski-Correa, T., Cleary, J., Gurley, K., Marshall, J., Pinelli, J., et al. (2020). “StEER Field Assessment Structural Team (FAST),” in StEER - Hurricane Michael. DesignSafe-CI. Alexandria: National Science Foundation. https://doi.org/10.17603/ds2-5aej-e227.
Keywords: natural hazards, reconnaissance, field data collection, research instrumentation, lidar
Citation: Berman JW, Wartman J, Olsen M, Irish JL, Miles SB, Tanner T, Gurley K, Lowes L, Bostrom A, Dafni J, Grilliot M, Lyda A and Peltier J (2020) Natural Hazards Reconnaissance With the NHERI RAPID Facility. Front. Built Environ. 6:573067. doi: 10.3389/fbuil.2020.573067
Received: 16 June 2020; Accepted: 08 October 2020;
Published: 11 November 2020.
Edited by:
Tiziana Rossetto, University College London, United KingdomReviewed by:
Sotirios Argyroudis, Aristotle University of Thessaloniki, GreeceEdmund Booth, Imperial College London, United Kingdom
Copyright © 2020 Berman, Wartman, Olsen, Irish, Miles, Tanner, Gurley, Lowes, Bostrom, Dafni, Grilliot, Lyda and Peltier. This is an open-access article distributed under the terms of the Creative Commons Attribution License (CC BY). The use, distribution or reproduction in other forums is permitted, provided the original author(s) and the copyright owner(s) are credited and that the original publication in this journal is cited, in accordance with accepted academic practice. No use, distribution or reproduction is permitted which does not comply with these terms.
*Correspondence: Jeffrey W. Berman, andiZXJtYW5AdXcuZWR1