 Ignacio Sánchez-Gendriz
 D. Luna-Naranjo
 Luiz Affonso Guedes1
 José D. López
95% of researchers rate our articles as excellent or good
Learn more about the work of our research integrity team to safeguard the quality of each article we publish.
Find out more
ORIGINAL RESEARCH article
Front. Antennas Propag. , 25 July 2024
Sec. Signal Propagation
Volume 2 - 2024 | https://doi.org/10.3389/fanpr.2024.1400382
Soundscape analysis has become integral to environmental monitoring, particularly in marine and terrestrial settings. Fish choruses within marine ecosystems provide essential descriptors for environmental characterization. This study employed a month-long sequence of continuous underwater recordings to generate 24-h spectrograms, utilizing Principal Component Analysis (PCA) specifically adapted to analyze fish choruses. The spectrograms were constructed using a frequency range from 0 to 5 kHz, represented by 1,025 spectral points (frequency bin width 5 Hz) on a linear scale. A preliminary spectral subsampling reduced the frequency components to 205 spectral points. PCA was then applied to this subsampled data, selecting 7 principal components (PCs) that explained 95% of the variance. To enhance visualization and interpretation, we introduced “acoustic maps” portrayed as heatmaps. This methodology proved valuable in characterizing the structure of the observed environment and capturing pertinent diel patterns of fish choruses. Additionally, these PCA components can be analyzed using acoustic maps to reveal hidden dynamics within the marine acoustic environment. The dimensionality reduction achieved by PCA not only streamlined data handling but also enabled the extraction of spectral information pertinent to fish choruses and the temporal dynamics of the soundscape. In conclusion, our methodology presents a versatile framework extendable to diverse biological choruses and ecoacoustic studies. The straightforward, easily interpretable analysis leverages computations derived from 24-h spectrograms, offering novel insights into the daily dynamics of biological. Choruses and contributing to future advancements in ecoacoustic research.
In recent years, a variety of approaches have been employed to study and characterize ecosystems for both conservation and biodiversity monitoring purposes, with techniques such as Passive Acoustic Monitoring (PAM) gaining recognition for their utility (Desjonquères et al., 2020; Sugai et al., 2019; Ross et al., 2023). PAM, which leverages the use of hydrophones or microphones in a specific area, facilitates the collection of extensive, long-duration audio recordings (Gibb et al., 2019). These recordings capture animal vocalizations and other intrinsic acoustic components of the environment (Cauchy et al., 2023), serving as valuable resources for studying specific species behavior, tracking biodiversity changes, and identifying potential ecosystem threats (Stowell and Sueur, 2020).
One specific phenomenon of significant importance is the study of fish choruses, which represent some of the most impressive occurrences in nature (Siddagangaiah et al., 2022). Fish choruses, characterized by their collective vocalizations, can serve as indicators of critical activities such as feeding, spawning, and mating, thus offering a relevant proxy for ecosystem studies (Kim et al., 2023). Consequently, the use of PAM for studying these specific choruses is essential.
However, the extensive data generated by long-term PAM recordings present a significant challenge for researchers. For comprehensive studies, recordings can stretch across several months or even years (Sánchez-Gendriz and Padovese, 2017a; Smith et al., 2020), resulting in the daunting task of extracting valuable information from the complex audio data. The questions regarding intermediate processing and visualization of pertinent information remain open.
To address these challenges, researchers have developed or adapted methods from various areas, implementing a group of descriptors or variables collectively referred to as Acoustic Indices (Buxton et al., 2018; Bradfer-Lawrence et al., 2019). Despite the burgeoning interest in Acoustic Indices, the utility of classical computational approaches, notably Principal Component Analysis (PCA), has also shown promise in this domain, as evidenced by recent scholarly contributions (Benocci et al., 2021; Symes et al., 2022).
Accordingly, this paper delves into the nuanced application of PCA, specifically tailored to the analysis of daily spectrograms, for the exploratory data analysis of extensive PAM datasets. Our objective is to demonstrate the efficacy of PCA in unveiling complex patterns within long-duration acoustic recordings, thereby advancing the methodological toolkit available for ecoacoustic research.
The objective of this research is to leverage daily spectrograms from month-long underwater Passive Acoustic Monitoring (PAM) to demonstrate the efficacy of PCA in the analysis and interpretation of fish choruses. The methodologies developed in this study aim to empower researchers to efficiently reduce the dimensionality of extensive PAM datasets, thereby simplifying the analysis of complex acoustic environments. By customizing these techniques, the scope of analysis can be broadened to include biological choruses from a varied spectrum of species across both aquatic and terrestrial environments. Ultimately, employing these methodologies holds the potential to enhance ecosystem understanding and significantly reinforce conservation initiatives in critical environments.
Section 2 presents the experimental framework, detailing the dataset utilized, the process for computing daily Power Spectral Density (PSD) matrices, and the methodology for manual annotations of fish chorus timings. Section 3 delves into the PCA methodology applied to daily spectrograms, exploring two distinct approaches for spectral data reduction.
In Section 4, we discuss the results and analyses stemming from the transformation of daily spectrograms into energy-related time series, including their conversion into acoustic maps. This section highlights the utility of these transformations in identifying long-term patterns, diurnal fluctuations, and the effects of specific events on the acoustic landscape.
Additionally, Section 4 compares the spectral characteristics of original fish choruses with those reconstructed post-PCA application, and similarly, contrasts the original long-term spectrograms with their PCA-reconstructed counterparts. The manuscript concludes with Section 5 summarizing the overall considerations, limitations of the current study, and potential directions for future research.
The data presented in this study was collected in an ecologically relevant area named Xixova´-Japu´ı State Park (XJSP), located in the southwest of the Santos Estuarine System (São Paulo State, Brazil). The park encompasses a marine area inside the Santos Bay and an adjacent inland region of tropical rainforest. Situated in the vicinity of Santos Harbour, the largest port in Brazil, the conservation unit is within a region severely affected by environmental impacts and port activities Araujo et al. (2013). Specifically, the data presented in our study was collected underwater, in the marine area of the conservation unit, as illustrated in Figure 1.
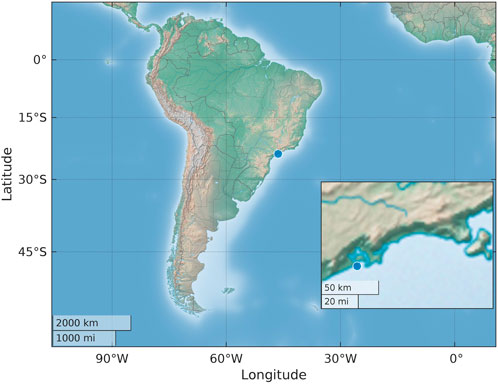
Figure 1. Map highlighting the location of the recording point at XJSP, situated within the Santos Estuarine System (São Paulo State, Brazil).
A custom-made autonomous passive monitoring system Caldas-Morgan et al. (2015) was deployed at the monitoring site. The autonomous system continuously recorded underwater sound from February 4 to 4 March 2015. The recording was carried out at a 11.025 kHz sampling rate (fs), with 16-bit resolution, and was continuously stored in a local SD card, in WAV files of 15-min durations.
In order to obtain a time-spectral representation of the entire collected dataset, daily PSD matrices were computed for each monitored day. It is worth noting that this procedure entails a significant volume of data reduction, enabling quick visualization of large datasets while retaining relevant information about the monitored site, which will be discussed in the following sections with more details.
The procedure used to calculate the daily PSD matrices is explained as follows: for each WAV file recorded on a specific day (from 04/02/2015 to 04/03/2015), a respective PSD matrix was computed using the Welch method Welch (1967) with a 1-s Hamming window, 1,025 frequency points, 50% overlap, and 60-s temporal signal segments. Subsequently, all PSD matrices pertaining to the same day were concatenated, thus producing daily PSD matrices Pulgar-Pantaleon et al. (2023).
Daily Power Spectral Density (PSD) matrices were utilized both for the calculation of Sound Pressure Levels (SPL) for each respective day and for facilitating the visualization of 24-h spectrograms Sánchez- Gendriz and Padovese (2017b). SPL, indicative of a sound signal’s energy, can be deduced from the PSD matrices based on Parseval’s theorem. This theorem posits that the total energy of a signal can be represented equivalently in the time or frequency domain. Consequently, by aggregating the daily PSD matrices over specific frequency bands, a time series representing the energy within those bands is generated. This series serves as a proxy for identifying events localized within certain spectral ranges, such as fish choruses.
Previous investigations have identified four distinct fish choruses (Ch1, Ch2, Ch3, and Ch4) characterized by regular daily occurrences, primarily at dawn and dusk periods Sánchez-Gendriz and Padovese (2016), Sánchez-Gendriz and Padovese (2017b). To ascertain the onset, peak, and cessation of each chorus type, manual labeling was conducted through the spectrogram’s visual examination and the SPL time series for designated frequency bands. Specifically, the 0.3–1 kHz band was applied for Ch1 annotations; the 0.3–1.5 kHz band for Ch2 and Ch4; and the 1.5–2.0 kHz band for Ch3 annotations. These temporal markers were meticulously noted on the SPL plots Sánchez-Gendriz and Padovese (2017b).
The selection of different frequency bands for manual annotation was based on the distinct and specific spectral characteristics of each type of chorus. These differences in spectral concentration allowed for the discrimination of chorus types, as previously noted in the literature and illustrated in the long-term spectrograms presented in this study. The meticulous annotation of fish chorus timings serves as a reference for subsequent analyses, enabling a comparative evaluation of the outcomes derived from the PCA methodology delineated in this study.
To achieve efficient data representation while maintaining relevant temporal and frequency information, spectral dimensionality reduction was applied to the analyzed data.
Firstly, spectral downsampling was performed at a ratio of 1:5, reducing the original 1,025 frequency bins to 205 points. Next were selected the frequency bins within the 200–2,000 Hz range, which represent chorus activities as illustrated in Section 3.1, resulting in 67 spectral points. PCA was then applied to the spectrally subsampled data within this frequency band. The number of principal components was chosen to capture 95% of the variance.
PCA was utilized to compress the spectral dimensions of the 24-h spectrograms, facilitating subsequent analysis and visualization. This reduction was achieved by concatenating daily spectrograms and treating the frequency dimensions as features projected onto the principal component space, with time bins serving as individual instances. The spectrograms were constructed with 1,025 frequency points and 1,440 time points per day, corresponding to a 1-min resolution.
This methodological approach effectively reduces the dimensionality of the spectrogram data while preserving the essential spectral characteristics that define the temporal patterns of fish choruses. The effectiveness of this approach will be demonstrated in the subsequent section.
To reconstruct the spectrograms, we performed an inverse PCA transformation, projecting the data back from the principal component space to the original frequency space. Given the spectral downsampling performed initially, linear interpolation was employed during reconstruction to restore the frequency resolution to its original state. This interpolation step ensures that the visual and analytical resolution of approximately 5 Hz is maintained, thereby preserving the fidelity of the spectral information. The reconstructed spectrograms retain the key features of the original data, enabling a detailed analysis of the temporal and spectral patterns of fish choruses.
Acoustic heatmaps, also known as Acoustic Maps, were developed utilizing the PCA derived from the 24-h spectrograms. These maps are intended to augment the visual representation and aid in the identification of dynamic acoustic patterns within the analyzed soundscape.
The creation of Acoustic Maps entailed several steps: Initially, for each principal component (PC) extracted at a 1-min temporal resolution, a corresponding 24-h time series was constructed. To achieve temporal smoothness and enhance interpretability, a moving average filter was subsequently applied to these time series, adhering to the methodology described in Sanchez-Gendriz (2021).
These filtered time series were then arranged into a two-dimensional (2D) array to form a heatmap matrix, where each row represented a 1-min interval within the 24-h cycle, and each column corresponded to a day within the study period. To further improve the readability of the Acoustic Maps, horizontal interpolation was performed on the heatmap matrix. This step is especially beneficial for datasets encompassing a relatively short duration, as it significantly enhances the visual continuity of the data representation. In the context of this study’s 29-day dataset, horizontal interpolation was instrumental in refining the visual quality of the maps, a point that will be detailed in the following sections.
We used the annotated timings for each of the four chorus types across individual days to create a map of the acoustic activity. For ease of identification, choruses were labeled sequentially based on their occurrence in time. Therefore, we used the labels Ch1, Ch2, Ch3, and Ch4 to denote these continuous sound events. Figure 2 provides a twofold representation: a) An Acoustic Map showcasing the activity of the choruses. Notably, the Acoustic Map in Figure 2A has a unique characteristic: each time series, representing a specific chorus, spans a 24-h duration with a 1-min time resolution. If chorus i occurs, it adopts a value of i, and during non-occurrences, the value is 0. By using different colors for each chorus and a separate colormap for periods with no chorus activity, we can superimpose the time occurrence of all four chorus types onto the same Acoustic Map. b) In Figure 2B, a depiction of a 24-h spectrogram with annotations for the four chorus types, is shown. A keen observation from the sample days in Figure 2B shows that chorus Ch1 and Ch2 overlap in their time and frequency band concentration, but they vary significantly in their spectral shape. In contrast, while Ch2 and Ch4 exhibit similar spectral patterns, they differ in their time of occurrence. Ch3 stands apart both in terms of its spectral content and its temporal proximity to the end of Ch2.
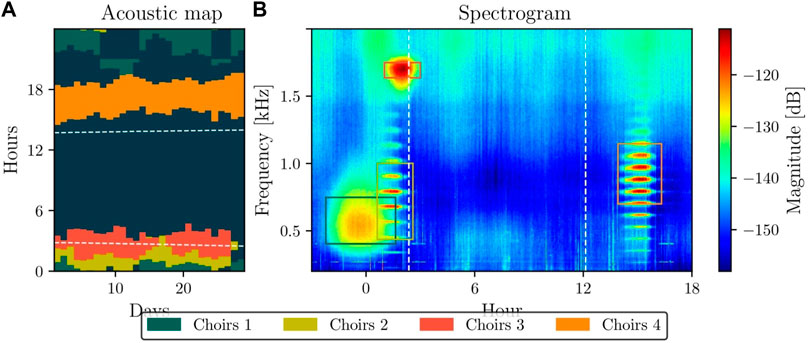
Figure 2. Acoustic activity map based on annotated timings of four chorus types, labeled Ch1, Ch2, Ch3, and Ch4, across individual days. (A) Acoustic Map spanning 24 h with 1-min resolution: each time series denotes a chorus type, adopting values of i during its occurrence and 0 otherwise. Different colors represent each chorus type, with a separate colormap indicating periods of inactivity. (B) 24-h spectrogram highlighting the four chorus types. Choruses Ch1 and Ch2 overlap in terms of time and frequency, yet exhibit distinct spectral shapes. Although Ch2 and Ch4 present similar spectral patterns, they manifest at different times. Ch3, with its distinct spectral content, appears close to the end of Ch2.
Long-term spectrograms have been instrumental in characterizing soundscapes in both terrestrial and marine environments Guan et al. (2015); Sankupellay et al. (2015), especially when monitoring fish communities Carric¸o et al. (2020). Even though spectrograms transform audible information into a visual domain, the inherent data reduction is worth noting. Aural analysis of a 24-h sound file is a lengthy process, while 24-h spectrograms allow for rapid exploration, often with minimal training required for the recognition of prolonged sound events like fish choruses.
For instance, Figure 3 illustrates a 7-day spectrogram derived from our dataset. A recurring pattern of fish choruses is evident. In the top panel, the spectrogram covers a frequency band from 0 to 5 kHz. The bottom panel presents annotations of notable fish choruses demarcated by rectangular boxes. Here we illustrate the long-term spectrogram, showing the annotations of choruses on the spectrograms. For that we will illustrate as representation 7 days of the data. Extended long-term spectrograms covering 28 complete days are included as (Supplementary Figure S1–Original spectrograms, Supplementary Figure S2–PCA reconstructed spectrograms).
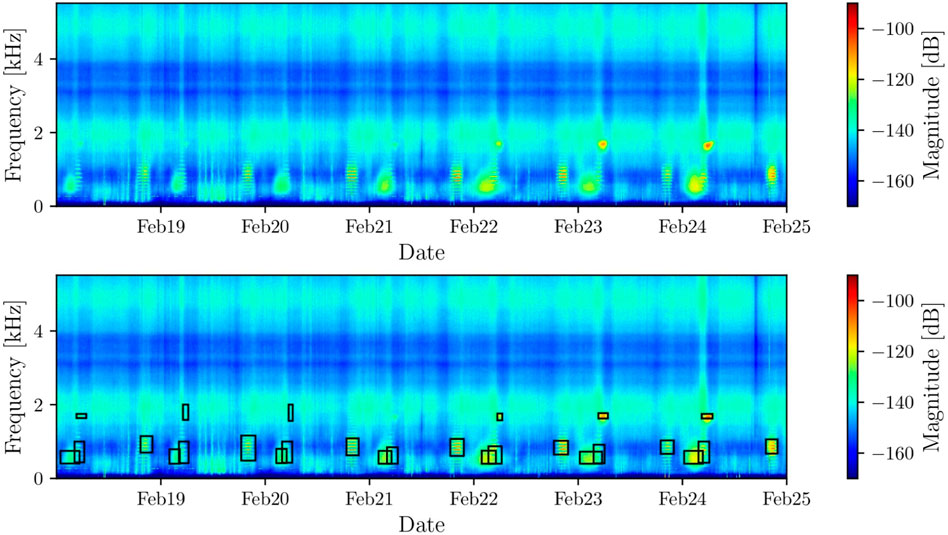
Figure 3. A 7-day spectrogram derived from our dataset. The top panel captures the 0–5 kHz frequency band, and the bottom panel highlights fish chorus annotations enclosed in rectangular boxes.
As part of the visualization pipeline, for representing values in spectrograms, heatmaps, and spectral information, we have transformed the magnitude numerically using AdB = 20 log10(A). This logarithmic transformation is a standard practice in acoustics to effectively represent the wide dynamic range of sound pressure levels, making it easier to visualize and interpret variations in acoustic signals.
In this section, we present the results obtained from applying PCA to the spectral dimension of long-term spectrograms. Following spectral downsampling at a ratio of 1:5, we retained 205 frequency components from the original 1,025 frequency bins. Based on prior analysis (Section 3.1), we focused on the frequency range from 200 to 2,000 Hz, resulting in 67 spectral components, as this range contains relevant acoustic activity.
PCA was then applied to the spectrally subsampled spectrograms. As illustrated in Figure 4, seven principal components were selected based on the cumulative variance criterion, accounting for 95% of the variance in the original data. This approach effectively reduces the dimensionality of the spectrogram data while preserving the essential spectral characteristics that define the temporal patterns of fish choruses, as demonstrated in Section 3.2.2. The spectral contribution of each component is detailed in the Supplementary Material.
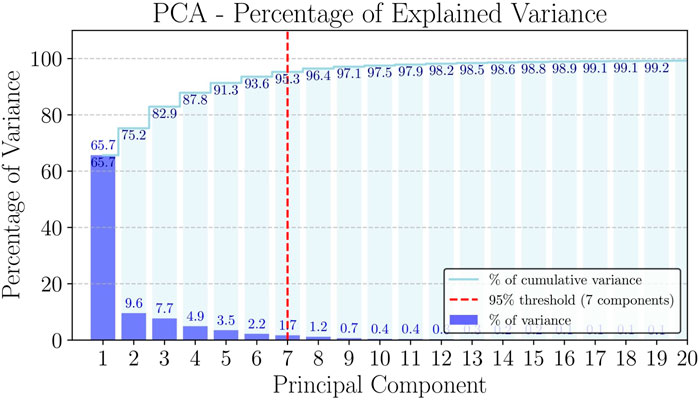
Figure 4. This figure illustrates the cumulative percentage of variance explained by each principal component. The red dashed line indicates the threshold at which 95% of the variance is explained, corresponding to seven principal components. Each bar represents the percentage of variance explained by an individual principal component, demonstrating the diminishing returns of additional components beyond the seventh.
The principal components are initially illustrated as Acoustic Maps. Subsequently, we provide a visualization of 7 days of reconstructed spectrograms obtained from a representative period and compare them with the original spectrograms.
Additionally, we have included Supplementary Figure S3, which illustrates the contribution of each individual PC. This figure was obtained by performing an inverse PCA using each specific PC represented in the figure. The figure also includes the contributions of the combined seven Principal Components (1:7 PCs). It is important to note that while the spectral contribution of individual PCs can be challenging to interpret, they provide valuable insights when combined. The individual components show patterns that are a linear combination of the energy concentrated in the frequency bins of the original spectrograms. These patterns, while not corresponding to contiguous frequency ranges, capture different aspects of the spectral characteristics. The individual temporal patterns of each PC can be representative of the dynamics of the soundscape, as previously illustrated in Figure 5 and further complemented by the results presented in Supplementary Figure S3.

Figure 5. Acoustic maps of principal components.
The application of PCA to soundscape analysis is not merely a statistical reduction but an insightful exploration into the biophony of the studied marine ecosystem. Although we cannot directly label each Principal Component (PC) with specific fish activities, they encapsulate significant acoustic patterns related to the dynamics of the marine environment. These components are projections of the data into the space of greatest variance, allowing us to capture the critical aspects of the soundscape.
To analyze and interpret these components, we created acoustic heatmaps, which we propose as a complementary visualization tool. The acoustic heatmaps, presented in Figure 5, unravel the temporal evolution and intricate dynamics captured within the time series of PCs. Each PC revealed through PCA provides a distinct perspective on the acoustic characterization of the marine environment.
For instance, the pronounced energy observed in component 1 during nighttime hours suggests a robust pattern of nocturnal or crepuscular activity. Such activity may reflect the ecological behaviors of marine organisms, particularly those associated with vital functions like feeding or spawning in fishes, which are often timed to occur in reduced light conditions Smejkal et al. (2018); Fortes-Silva et al. (2010).
It is important to note that PCs are obtained as linear combinations of the spectral information presented in the original spectrograms, after downsampling and selecting the frequency band of interest. These PCs can be understood as a reduced latent space that not only holds the spectral information (as we can project back and obtain approximations of the original spectrograms), but also serves as a valuable complementary visualization tool for characterizing the acoustic environment.
In contrast, components 2, 3, and 6, which exhibit pronounced activities at sunrise, might represent a diurnal chorus, where different species are possibly taking advantage of the lower levels of light to communicate for mating or territorial purposes. The sunrise as well as sunset periods often mark a transition in the oceanic soundscapes Buscaino et al. (2016). Thus, these particular PCs encapsulate with notable precision the significance of sunrise in the soundscape under study.
The weighted components heatmap, which aggregates the contribution of individual PCs, serves as a composite representation, encapsulating the overall soundscape. It accentuates the dominant sound patterns and minimizes less significant noise, allowing for a clearer interpretation of the soundscape’s behavior over the studied period.
The complementarity of the PCs underscores the multifaceted nature of marine acoustic environments. When interlaced with long-term spectrograms, these acoustic maps enrich exploratory data analysis (EDA) and facilitate a more nuanced visualization of soundscape dynamics. They act as a Supplementary Material, augmenting traditional spectrogram analysis by highlighting temporal patterns that may otherwise be obscured.
In summary, the use of PCA to generate acoustic maps is a well-suited methodological framework for characterizing the acoustic signatures of marine environments. This technique stands to significantly improve our understanding and monitoring of complex terrestrial and aquatic ecosystems. The insights obtained from these maps are invaluable, offering implications for ecological surveillance and the advancement of acoustic monitoring technologies in these demanding contexts.
The reconstruction of spectrograms using PCA is a powerful example of dimensionality reduction without significant loss of critical information, which has profound implications for the design and operation of communication systems, particularly in the context of environmental monitoring.
The visual comparison of the PCA-reconstructed spectrograms with the original in Figure 6 underlines the efficacy of PCA in capturing and representing the essential features of the soundscape. Even with a reduction from 1,025 spectral points to just 7 principal components, the PCA reconstruction retains the core spectral characteristics and temporal events observed in the original data. This fidelity in reconstruction is remarkable, as it suggests that the bulk of the information conveyed in the original spectrogram is encapsulated within these few components.
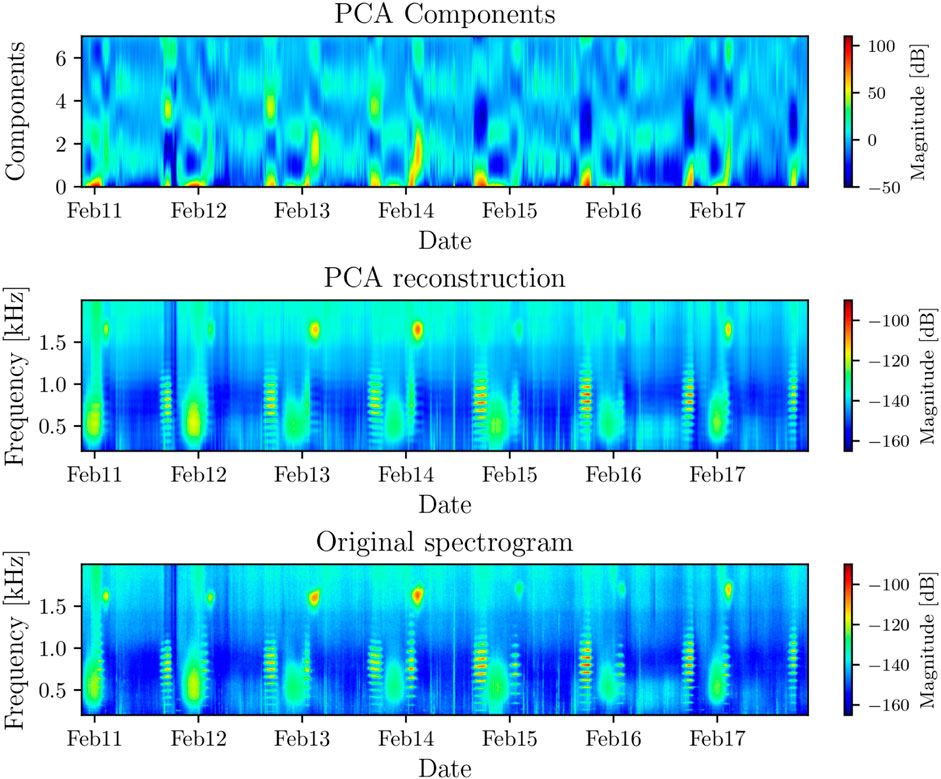
Figure 6. Comparison of principal components along with representative long-term spectrograms.
For communication systems, especially those deployed for long-term environmental monitoring or across extensive arrays of acoustic sensors, this dimensionality reduction is invaluable. It means that the systems can store and transmit the most relevant information without the overhead of excessive data size. In practical terms, this could lead to more efficient use of bandwidth and storage, faster transmission of data, and potentially lower energy requirements for sensor operation—critical factors in remote or large-scale monitoring operations where resources are at a premium.
Moreover, the ability to reconstruct the original spectrogram from a handful of components has significant implications for the real-time analysis and interpretation of acoustic data. Systems could be designed to process and analyze data more quickly, identify key acoustic events or changes in the environment with greater speed, and respond to potential incidents or anomalies in a timely manner.
In the context of ecological monitoring, this means that researchers can maintain a high-resolution window into the soundscape while managing the data deluge that often accompanies continuous monitoring. For communication systems, particularly in underwater environments where bandwidth is limited, employing PCA for data reduction could enable more nuanced and detailed acoustic information to be captured and analyzed than would otherwise be feasible.
The detailed comparison of original and PCA-reconstructed spectra for various chorus types, as depicted in Figure 7, provides compelling evidence for the robustness of the PCA method in preserving the integrity of spectral features during dimensionality reduction.
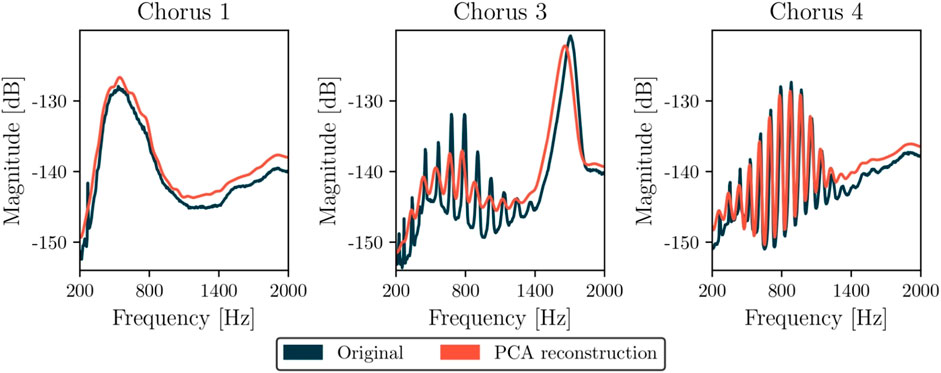
Figure 7. Comparison of selected spectrum for chorus types and mean spectrum from PCA reconstructed spectrograms.
For Chorus 1, the congruence between the original and PCA-reconstructed spectra is particularly notable in the contour of the frequency range where the main energy is concentrated. This indicates that PCA retains the fundamental frequency components that characterize this type of chorus.
The Chorus 2–3 graph facilitates a nuanced comparison between two chorus types within the same frequency domain. The reconstruction not only preserves the unique peaks of each chorus but also delineates the subtle differences between them. The peaks of Chorus 2 are accurately matched in the PCA reconstruction, demonstrating the method’s capacity to discern variations within similar frequency ranges. Chorus 3, despite its close frequency range to Chorus 2, is distinctly represented, underscoring PCA’s ability to differentiate and reconstruct overlapping acoustic events.
In the case of Chorus 4, with its complex spectral profile characterized by multiple peaks, the PCA reconstruction closely mirrors the original’s variations, indicating that even the finer details of a chorus’s frequency signature are captured.
The fidelity with which the PCA reconstructions replicate the original spectra is critical for multiple reasons. Firstly, it shows that PCA does more than reduce data dimensionality—it effectively encapsulates the essence of acoustic events. Secondly, by preserving the unique characteristics of each spectrum, PCA ensures that the ecological or environmental information within the acoustic signals is conserved. This preservation is vital for applications where spectral features are used for the identification, classification, or monitoring of biological or environmental occurrences.
Regarding communication systems, PCA’s capacity to conserve essential spectral characteristics with fewer components can lead to more efficient data compression and transmission protocols. Such efficiency is especially crucial when managing extensive datasets or transmitting data across channels with limited bandwidth, scenarios common in remote underwater monitoring systems.
In summary, the PCA methodology demonstrates a substantial reduction in data dimensionality while preserving essential patterns and variations within acoustic data. This balance of efficiency and effectiveness is highlighted by the close resemblance between the original and PCA-reconstructed spectrograms, which underscores the technique’s suitability for sophisticated environmental sensing and communications. The visual representations generated by PCA serve as an intuitive gateway to complex data, broadening the accessibility of ecological research across various domains. Ultimately, the ability of PCA to distill complex soundscapes into a few informative components promises significant advancements in ecoacoustics and the evolution of next-generation communication systems designed for intricate and data-intensive environments.
In conclusion, this research elucidates the efficacy of employing Principal Component Analysis (PCA) for spectral dimensionality reduction and the visualization of environmental soundscapes using 24-h spectrograms. Our analysis demonstrates that even a limited set of seven principal components, derived from an initial dataset of 1,025 spectral points, is sufficient to accurately reconstruct original spectrograms, preserving both temporal and spectral integrity. This approach not only serves as a robust technique for reducing data complexity but also emerges as a valuable visualization tool, enhancing our understanding of acoustic dynamics over prolonged periods.
The creation of Acoustic Maps has proven to be of significant value, particularly for the analysis and visualization of fish choruses. While the focus of this study has been on underwater acoustic data, the methodologies developed here are versatile and show promise for application in a broader range of aquatic and terrestrial ecosystems. Further exploration into the utilization of these methods in diverse environments suggests a wide spectrum of potential applications.
The implications of our findings for the development of communication and monitoring systems are particularly noteworthy. By demonstrating that a few principal components can convey the bulk of necessary information, we propose a scalable solution for environmental monitoring systems. Such systems could leverage the dimensionality reduction capabilities of PCA, leading to efficient data storage, transmission, and real-time analysis in various settings, including those that require extended deployment of acoustic sensor arrays.
This study contributes to the growing field of ecoacoustics and opens the door to the development of advanced, data-efficient communication systems tailored for the complex and data-rich landscapes of environmental monitoring.
The data analyzed in this study is subject to the following licenses/restrictions: All data produced or utilized in this study are available upon request. Requests to access these datasets should be directed to aWduYWNpb2dlbmRyaXpAZ21haWwuY29t.
IS-G: Conceptualization, Data curation, Formal Analysis, Investigation, Methodology, Software, Supervision, Validation, Visualization, Writing–original draft, Writing–review and editing. DL-N: Conceptualization, Data curation, Formal Analysis, Methodology, Software, Validation, Visualization, Writing–review and editing. LG: Investigation, Methodology, Supervision, Validation, Writing–review and editing. JL: Funding acquisition, Methodology, Project administration, Supervision, Writing–review and editing. LP: Conceptualization, Funding acquisition, Investigation, Methodology, Project administration, Resources, Supervision, Validation, Writing–review and editing.
The author(s) declare that financial support was received for the research, authorship, and/or publication of this article. The logistics for data collection were supported by the São Paulo Research Foundation (FAPESP) under grant number 2016/021750. Additional funding for travel and accommodations was provided by the Colombian National Ministry for Science, Technology and Innovation, Francisco Jose de Caldas—MINCIENCIAS (Colombia), Program No. 111585269779.
The authors declare that the research was conducted in the absence of any commercial or financial relationships that could be construed as a potential conflict of interest.
All claims expressed in this article are solely those of the authors and do not necessarily represent those of their affiliated organizations, or those of the publisher, the editors and the reviewers. Any product that may be evaluated in this article, or claim that may be made by its manufacturer, is not guaranteed or endorsed by the publisher.
The Supplementary Material for this article can be found online at: https://www.frontiersin.org/articles/10.3389/fanpr.2024.1400382/full#supplementary-material
Araujo, G., Moreira, L., Morais, R., Davanso, M., Garcia, T., Cruz, A., et al. (2013). Ecotoxicological assessment of sediments from an urban marine protected area (Xixová-Japuí State Park, SP, Brazil). Mar. Pollut. Bull. 75, 62–68. doi:10.1016/j.marpolbul.2013.08.005
Benocci, R., Roman, H. E., Bisceglie, A., Angelini, F., Brambilla, G., and Zambon, G. (2021). Eco-acoustic assessment of an urban park by statistical analysis. Sustainability 13, 7857. doi:10.3390/su13147857
Bradfer-Lawrence, T., Gardner, N., Bunnefeld, L., Bunnefeld, N., Willis, S. G., and Dent, D. H. (2019). Guidelines for the use of acoustic indices in environmental research. Methods Ecol. Evol. 10, 1796–1807. doi:10.1111/2041-210x.13254
Buscaino, G., Ceraulo, M., Pieretti, N., Corrias, V., Farina, A., Filiciotto, F., et al. (2016). Temporal patterns in the soundscape of the shallow waters of a Mediterranean marine protected area. Sci. Rep. 6, 34230. doi:10.1038/srep34230
Buxton, R. T., McKenna, M. F., Clapp, M., Meyer, E., Stabenau, E., Angeloni, L. M., et al. (2018). Efficacy of extracting indices from large-scale acoustic recordings to monitor biodiversity. Conserv. Biol. 32, 1174–1184. doi:10.1111/cobi.13119
Caldas-Morgan, M., Alvarez-Rosario, A., and Padovese, L. R. (2015). An autonomous underwater recorder based on a single board computer. PLoS One 10, e0130297. doi:10.1371/journal.pone.0130297
Carrico, R., Silva, M., Vieira, M., Afonso, P., Menezes, G., Fonseca, P., et al. (2020). The use of soundscapes to monitor fish communities: meaningful graphical representations differ with acoustic environment. Acoustics 2, 382–398. doi:10.3390/acoustics2020022
Cauchy, P., Heywood, K. J., Merchant, N. D., Risch, D., Queste, B. Y., and Testor, P. (2023). Gliders for passive acoustic monitoring of the oceanic environment. Front. Remote Sens. 4. doi:10.3389/frsen.2023.1106533
Desjonquères, C., Gifford, T., and Linke, S. (2020). Passive acoustic monitoring as a potential tool to survey animal and ecosystem processes in freshwater environments. Freshw. Biol. 65, 7–19. doi:10.1111/fwb.13356
Fortes-Silva, R., Martínez, F., Villarroel, M., and Sánchez-Vázquez, F. (2010). Daily rhythms of locomotor activity, feeding behavior and dietary selection in Nile tilapia (oreochromis niloticus). Comp. Biochem. Physiology Part A Mol. Integr. Physiology 156, 445–450. doi:10.1016/j.cbpa.2010.03.031
Gibb, R., Browning, E., Glover-Kapfer, P., and Jones, K. E. (2019). Emerging opportunities and challenges for passive acoustics in ecological assessment and monitoring. Methods Ecol. Evol. 10, 169–185. doi:10.1111/2041-210x.13101
Guan, S., Lin, T.-H., Chou, L.-S., Vignola, J., Judge, J., and Turo, D. (2015). Dynamics of soundscape in a shallow water marine environment: a study of the habitat of the indo-pacific humpback dolphin. J. Acoust. Soc. Am. 137, 2939–2949. doi:10.1121/1.4919312
Kim, E. B., Frasier, K. E., McKenna, M. F., Kok, A. C. M., Peavey Reeves, L. E., Oestreich, W. K., et al. (2023). SoundScape learning: an automatic method for separating fish chorus in marine soundscapes. J. Acoust. Soc. Am. 153, 1710–1722. doi:10.1121/10.0017432
Pulgar-Pantaleon, E. M., Sánchez-Gendriz, I., and Guedes, L. A. (2023). Ecoacousticanalyzer: a long-term acoustic data analysis tool for environmental monitoring. Softw. Impacts 17, 100565. doi:10.1016/j.simpa.2023.100565
Ross, S. R. P., O’Connell, D. P., Deichmann, J. L., Desjonquères, C., Gasc, A., Phillips, J. N., et al. (2023). Passive acoustic monitoring provides a fresh perspective on fundamental ecological questions. Funct. Ecol. 37, 959–975. doi:10.1111/1365-2435.14275
Sánchez-Gendriz, I. (2021). Signal processing basics applied to ecoacoustics. Ecol. Inf. 66, 101445. doi:10.1016/j.ecoinf.2021.101445
Sánchez-Gendriz, I., and Padovese, L. R. (2016). Underwater soundscape of marine protected areas in the south Brazilian coast. Mar. Pollut. Bull. 105, 65–72. doi:10.1016/j.marpolbul.2016.02.055
Sankupellay, M., Towsey, M., Truskinger, A., and Roe, P. (2015). “Visual fingerprints of the acoustic environment: the use of acoustic indices to characterise natural habitats,” in 2015 Big Data Visual Analytics (BDVA), Hobart, TAS, 22–25 September 2015, (IEEE). doi:10.1109/bdva.2015.7314306
Sánchez-Gendriz, I., and Padovese, L. R. (2017a). enA methodology for analyzing biological choruses from long-term passive acoustic monitoring in natural areas. Ecol. Inf. 41, 1–10.
Sánchez-Gendriz, I., and Padovese, L. R. (2017b). enTemporal and spectral patterns of fish choruses in two protected areas in southern atlantic. Ecol. Inf. 38, 31–38.
Siddagangaiah, S., Chen, C.-F., Hu, W.-C., and Farina, A. (2022). The dynamical complexity of seasonal soundscapes is governed by fish chorusing. Commun. Earth Environ. 3, 109. doi:10.1038/s43247-022-00442-5
Smejkal, M., Souza, A. T., Blabolil, P., Bartonˇ, D., Sajdlová, Z., Vejˇŕık, L., et al. (2018). Nocturnal spawning as a way to avoid egg exposure to diurnal predators. Sci. Rep. 8, 15377. doi:10.1038/s41598-018-33615-4
Smith, D. G., Truskinger, A., Roe, P., and Watson, D. M. (2020). enDo acoustically detectable species reflect overall diversity? a case study from Australia’s arid zone. Remote Sens. Ecol. Conserv. 6, 286–300. doi:10.1002/rse2.173
Stowell, D., and Sueur, J. (2020). Ecoacoustics: acoustic sensing for biodiversity monitoring at scale. Remote Sens. Ecol. Conserv. 6, 217–219. doi:10.1002/rse2.174
Sugai, L. S. M., Silva, T. S. F., Ribeiro, J. W., and Llusia, D. (2019). Terrestrial passive acoustic monitoring: review and perspectives. Bioscience 69, 15–25. doi:10.1093/biosci/biy147
Symes, L. B., Kittelberger, K. D., Stone, S. M., Holmes, R. T., Jones, J. S., Ruvalcaba, I. P. C., et al. (2022). Analytical approaches for evaluating passive acoustic monitoring data: a case study of avian vocalizations. Ecol. Evol. 12, e8797. doi:10.1002/ece3.8797
Keywords: ecoacoustics, PCA, signal processing, spectrogram, temporal patterns
Citation: Sánchez-Gendriz I, Luna-Naranjo D, Guedes LA, López JD and Padovese LR (2024) Exploring fish choruses: patterns revealed through PCA computed from daily spectrograms. Front. Antennas Propag. 2:1400382. doi: 10.3389/fanpr.2024.1400382
Received: 13 March 2024; Accepted: 08 July 2024;
Published: 25 July 2024.
Edited by:
María Campo-Valera, University of Malaga, SpainReviewed by:
Ajey Kumar, Symbiosis International (Deemed University), IndiaCopyright © 2024 Sánchez-Gendriz, Luna-Naranjo, Guedes, López and Padovese. This is an open-access article distributed under the terms of the Creative Commons Attribution License (CC BY). The use, distribution or reproduction in other forums is permitted, provided the original author(s) and the copyright owner(s) are credited and that the original publication in this journal is cited, in accordance with accepted academic practice. No use, distribution or reproduction is permitted which does not comply with these terms.
*Correspondence: Ignacio Sánchez-Gendriz, aWduYWNpb2dlbmRyaXpAZGNhLnVmcm4uYnI=
Disclaimer: All claims expressed in this article are solely those of the authors and do not necessarily represent those of their affiliated organizations, or those of the publisher, the editors and the reviewers. Any product that may be evaluated in this article or claim that may be made by its manufacturer is not guaranteed or endorsed by the publisher.
Research integrity at Frontiers
Learn more about the work of our research integrity team to safeguard the quality of each article we publish.