- 1Department of Mathematics, University of Nairobi, Nairobi, Kenya
- 2International Centre of Insect Physiology and Ecology (ICIPE), Nairobi, Kenya
- 3School of Agricultural, Earth, and Environmental Sciences, University of KwaZulu-Natal, Pietermaritzburg, South Africa
- 4School of Computer Science and Applied Mathematics, University of Witwatersrand, Johannesburg, South Africa
Malaria remains a critical public health challenge in Africa, demanding innovative control strategies. This study introduces a novel approach using Microsporidia MB-infected mosquitoes and stochastic optimal control within a Lévy process framework to regulate mosquito release strategies. The primary goal is to optimize Microsporidia MB prevalence within mosquito populations to disrupt Plasmodium transmission to humans. By incorporating Lévy noise into the modeling process, we capture the inherent randomness of mosquito dynamics, improving intervention accuracy. The model, guided by the Hamilton–Jacobi–Bellman (HJB) equation, optimizes release protocols while accounting for key environmental factors like seasonality and temperature fluctuations. Results show that intervention success depends on local climatic conditions, underscoring the need for flexible, region-specific strategies in malaria-endemic areas. Focus regions include Kenya, Ghana, Niger, and Benin, where Microsporidia MB has been confirmed. Findings suggest that targeted mosquito releases could significantly reduce malaria transmission, offering valuable insights for public health efforts.
1 Introduction
Malaria is a mosquito-borne disease that results from an individual being infected by any of the five Plasmodium species known as P. falciparum, P. vivax, P.ovale, P. malariae and P.knowlesi [1–3]. Approximately 50 mosquito species from the genus, Anopheles have been identified as major vectors of the disease [2]. According to the World Health Organization [4], malaria deaths have been estimated at more than 600,000 during the year 2021. The 2022 World Malaria Report states that the disease continues to persist in the African region more than any other region of the world as the region accounts for the highest cases and deaths, especially among children.
To control the spread of malaria, control and intervention measures have been applied over the years and these efforts have helped in lowering the prevalence of malaria in most regions across the globe. As an effort to lower the disease infection and transmission, insecticide-treated nets (ITNs) and indoor residual spraying (IRS) are primarily used in order to control malaria vectors [5]. However, the rising issues of resistance threaten the progress and efforts achieved [6].
The World Health Organization has put forward its support for the development of improved, innovative, and sustainable methods to reduce and eliminate malaria. One of the aforementioned involves the use of endosymbionts as plasmodium transmission blockers in mosquitoes. In literature, the bacteria Wolbachia has been proposed and explored as an endosymbiont for malaria control [7, 8]. Another possible endosymbiont is a microsporidian denoted Microsporidia MB that has been discovered to impair plasmodium transmission [9]. This Microsporidia MB species has been identified in association with Anopheles arabiensis, Anopheles gambiae, and Anopheles coluzzii, as evidenced by research conducted in Kenya, Ghana, and, more recently, in Niger and the Republic of Benin [9–12]. In the pursuit of effective malaria control strategies, researchers have explored the intriguing role of microsporidia-infected mosquitoes. Fox and Weiser's investigation into Anopheles gambiae infected with Nosema stegomyiae shed light on natural infections in Liberia [13]. Meanwhile, laboratory studies by other scientists focused on Plistophora culicis infections in Culex pipiens fatigans mosquitoes, revealing altered mosquito biology and reduced Plasmodium development [14]. Additionally, a recent study examined the effects of Nosema algerae on Plasmodium yoelii nigeriensis in Anopheles stephensi, emphasizing the intricate interactions within the mosquito host [15]. Notably, Bano's work highlighted the partial inhibitory effect of P. culicis on the sporogonic cycle of P. cynomolgi [16]. While these studies don't directly prescribe a solution, they contribute valuable knowledge for advancing biocontrol strategies against malaria transmission.
Although information on Microsporidia MB is limited, past literature suggests that microsporidia could serve as a promising malaria vector control strategy, warranting further investigation. The potential for these advancements is both challenging and exciting; however, practical application requires careful consideration of deploying endosymbiont-infected mosquitoes into natural environments. Various mathematical models have been employed to study vector-borne diseases, providing valuable insights into effective control strategies. For instance, models depicting the release of Wolbachia-infected mosquitoes have demonstrated practical guidance for implementing release strategies to achieve desirable mosquito populations in the field [17–20]. Additionally, optimal control strategies using sterile mosquitoes [21–26] and genetically modified mosquitoes have been explored [27, 28]. Furthermore, recent studies have employed fractional differential equations to model vector-borne diseases such as dengue fever, capturing complex behaviors and memory effects in disease transmission dynamics [29–33]. While these approaches provide valuable insights, they often do not fully account for the inherent variability and uncertainty driven by environmental factors. This is where stochastic methods become essential. By incorporating stochastic elements, such as Stochastic Differential Equations (SDEs), we can better capture the unpredictable dynamics of mosquito populations, influenced by environmental fluctuations. SDEs have been widely used across various fields to model systems under uncertainty. In epidemiology, they are pivotal for understanding disease transmission dynamics and informing control strategies, making them highly relevant for developing effective frameworks for malaria vector control. Beyond epidemiology, SDEs have proven their utility in finance, engineering, ecology, and even agriculture, where they are used to model complex systems influenced by random factors [34–38]. By integrating stochastic elements with the dynamics of Microsporidia MB, our approach aims to create a more realistic and effective framework for malaria vector control, better equipped to handle the variability of real-world environments.
Building upon previous work in vector control, this study introduces a novel approach by utilizing Microsporidia MB-infected mosquitoes, rather than transgenic mosquito populations, to block malaria transmission. The primary objective is to optimize this biological intervention by incorporating stochastic elements into the modeling of mosquito population dynamics, with the ultimate goal of enhancing microbe prevalence in mosquito populations to disrupt Plasmodium transmission to humans. A key innovation of our methodology is the use of Lévy noise, which captures the inherent randomness and unpredictability in mosquito population fluctuations. This stochastic framework is crucial for accurately modeling how different release frequencies and patterns of infected mosquitoes affect overall population dynamics, overcoming the limitations of traditional deterministic models. Additionally, we expand our analysis spatially by mapping optimal infection prevalence rates across selected West African countries-namely Niger, Ghana, and Benin-where malaria is endemic, and also including Kenya. This geographical focus addresses the need for tailored vector control strategies that account for regional variability in mosquito behavior, infection prevalence, and environmental conditions. By using advanced simulations and mapping techniques, our research highlights the complexities of controlling mosquito populations, particularly under varying environmental and seasonal conditions. We examine stochastic growth rates, infection prevalence ratios, and uninfected mosquito proportions to deliver insights into the effectiveness of mosquito release strategies. This study is particularly innovative in its application of stochastic processes to epidemiological modeling and its focus on Microsporidia MB-based biological interventions, offering a promising alternative to traditional transgenic methods.
This research applies stochastic optimal control and Lévy processes to develop an optimized strategy for releasing Microsporidia MB-infected mosquitoes to block malaria transmission. By integrating mathematical modeling with ecological and biological insights, we address the complexities of mosquito population dynamics and environmental variability. Our approach formulates a stochastic control problem, solved using the Hamilton–Jacobi–Bellman (HJB) equation under jump diffusions, to determine the optimal mosquito release strategy. In Section 2, we define the theoretical framework by introducing the Lévy process and its applications, outlining stochastic control with Lévy jumps, and formulating the dynamics of mosquito populations influenced by both white and Lévy noise. This section also establishes the framework for the stochastic optimal mosquito release problem, detailing the data sources for temperature measurements and model validation. Section 3 progresses to the analytical derivation of optimal release strategies, including Python-based simulations, visualization maps based on temperature variations, and validation of these strategies. Section 4 discusses the implications of our findings within the broader context of malaria control and concludes by summarizing our research outcomes, along with suggesting future directions for vector-borne disease management.
2 Materials and methods
Our methodology applies a Lévy process-based mathematical model to analyze the population dynamics of Anopheles mosquitoes, distinguishing between Microsporidia MB-infected and uninfected groups. The model combines traditional population dynamics with stochastic elements, such as white noise and Lévy noise, to address environmental fluctuations and unpredictable changes. Central to our approach is the strategic release of infected mosquitoes to influence the wild population and enhance symbiont prevalence, thus supporting malaria control efforts. Key parameters of the model, including growth rates, mortality, and environmental factors, are essential for understanding and optimizing this strategy [39].
2.1 Area of study
This research examines the population dynamics of Anopheles mosquitoes in selected regions of West Africa-namely Niger, Ghana, and Benin Republic and Kenya, East Africa (Figure 1). These areas are home to key malaria vectors such as Anopheles gambiae, Anopheles coluzzii, Anopheles funestus, and Anopheles arabiensis. In these mosquito species, symbiotic microbes known to inhibit the malaria parasite Plasmodium have been identified. The discovery of these microbial inhibitors presents a promising strategy for controlling malaria transmission.
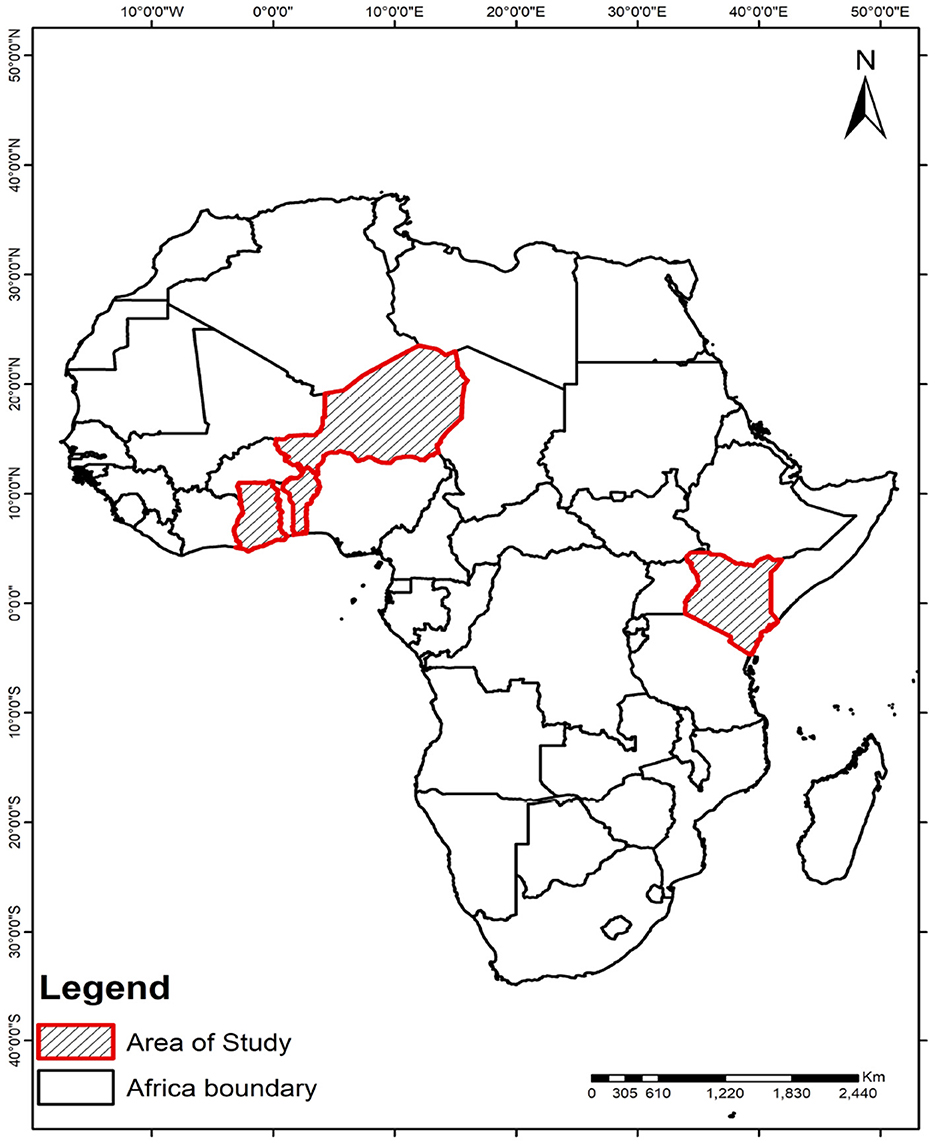
Figure 1. Selected regions of West Africa, including Niger, Ghana, and Benin, along with Kenya in East Africa, are the focus of this study, as Microsporidia MB has been identified in these areas.
Given the significant variability in environmental factors such as temperature across these geographic areas, our approach tailors the release strategies to align with local ecological conditions. This regional customization aims to optimize the conditions under which microbe-infected mosquitoes are released, enhancing the prevalence and effectiveness of the microbial symbionts in reducing malaria transmission. By examining how different environmental settings impact the success of these strategies, we aim to identify the most suitable environments for effective mosquito releases, thereby maximizing the potential for controlling malaria in diverse settings.
2.2 Data
2.2.1 Temperature data
We utilized the Bio1 bioclimatic variable dataset from WorldClim, offering annual mean temperature data spanning the period 1970–2000. This dataset, characterized by a spatial resolution of 30 s (~1 km2), served as a foundational component for our study. To tailor the dataset to our study's specific requirements, we employed QGIS to clip the raster layer to our designated study sites, ensuring a focused analysis of the relevant geographic areas.
2.2.2 Validation data
For the validation process, Microsporidia-infected mosquito data was collected in Kenya from the years 2022 to 2023 after the rainy seasons. The data specifically focus on Anopheles mosquitoes-An. Gambiae, An. Funestus, An. Arabiensis, and An. Coluzzii known for transmitting the Plasmodium parasite across diverse regions in Africa. The alignment of this information with our mapped regions of malaria transmission potential enhances the robustness of our validation process.
2.3 Preliminaries
In this section, we introduce the fundamental concepts of stochastic optimal control, focusing on the application of Lévy processes and jump-diffusion methods in the modeling of evolutionary dynamics in population biology. We also provide preliminary results that demonstrate how our proposed model integrates these stochastic elements to effectively capture the complex variabilities and interactions within biological populations.
2.3.1 Lévy Process
Definition 2.1. Let us define a Lévy process on a filtered probability space , where Ω is the sample space, is the σ-algebra, is the filtration representing the evolution of information over time, and ℙ is the probability measure. A stochastic process {Xt}t≥0, taking values in ℝ and adapted to the filtration , is termed a Lévy process if it satisfies the following three conditions:
1. Initialization: X0 = 0 almost surely, establishing the process at the origin with probability one.
2. Stochastic Continuity: For any ϵ > 0 and for any s ≥ 0, , ensuring that the process is continuous in probability, allowing for jumps but not “wild” behavior.
3. Independent and Stationary Increments: The process exhibits increments that are independent and stationary; that is, for any 0 ≤ s < t, the increment Xt − Xs is independent of and the distribution of Xt − Xs depends only on t − s, not on the actual values of t or s. This property indicates that the process evolves in a way where the future increment is independent of the past, with its distribution reliant solely on the length of the time interval.
2.3.1.1 The dynamics of Itô-Lévy processes
Within the framework of stochastic calculus, the Itô-Lévy process stands out for its ability to model complex systems influenced by both continuous fluctuations and discrete jumps. Herein, we present a foundational theorem characterizing the evolution of such processes:
Theorem 2.2 (Evolution of Itô-Lévy Processes). Consider a process X(t), taking values in ℝ, defined on a probability space. The dynamics of X(t) as an Itô-Lévy process are captured by the differential equation:
where Ñ(dt, dy) is a compensated Poisson random measure defined by:
with R ∈ [0, ∞] demarcating the threshold for jump sizes. Let h : ℝ2 → ℝ be a twice continuously differentiable function, and define a new process Z(t) = h(t, X(t)). The differential of Z(t), embodying the Itô-Lévy dynamics, is then given by:
This theorem elucidates the nuanced behavior of Itô-Lévy processes, highlighting their capacity to integrate both gradual trends and abrupt shifts in state, thereby offering a robust model for systems exhibiting complex dynamics.
2.3.1.2 Control state dynamics and the generator in Lévy-driven systems
The dynamics of a controlled system influenced by Lévy processes can be characterized by its state equation and the associated infinitesimal generator, which together describe how the system evolves under a given control policy. The state equation incorporates both continuous and jump components, while the generator captures the system's local behavior under the control policy.
Definition 2.3 (Controlled Lévy Process State Equation). Consider a controlled stochastic system where the state dynamics are governed by a Lévy-driven Stochastic Differential Equation (SDE) in the form:
where X(t) ∈ ℝn represents the state of the system at time t, denotes the control action applied at time t, chosen from a set of admissible controls , W(t) is a standard Brownian motion, and Ñ(dt, dz) is the compensated Poisson random measure reflecting the jumps.
Definition 2.4 (Infinitesimal Generator of a Controlled Lévy Process). The infinitesimal generator associated with a controlled Lévy process under policy u(t) is defined for a sufficiently smooth function h : ℝn → ℝ as:
which, under the Lévy process dynamics, can be explicitly written as:
Here, λi, σ, and γi are the components of the drift, diffusion, and jump intensity functions, respectively, and ϑ is the Lévy measure that characterizes the jump distribution.
The infinitesimal generator plays a crucial role in the formulation of dynamic programming and the Hamilton–Jacobi–Bellman (HJB) equation for controlled Lévy processes. It encapsulates the expected rate of change of a function of the system's state under a specific control policy, providing a vital link between the stochastic dynamics and the optimization of the control policy.
2.3.1.3 Dynamic programming for controlled Lévy diffusions
Dynamic programming forms the cornerstone of solving stochastic control problems, particularly when the system's dynamics exhibit both continuous fluctuations and discrete jumps. Herein, we present a concise definition tailored to controlled Lévy diffusions:
Definition 2.5. Let us consider a controlled Lévy diffusion process Z(t), initiated at Z(0) = z ∈ ℝk, evolving according to:
where the drift b, volatility σ, and jump intensity γ are functions defining the system's dynamics under a control policy u(t) from a set of admissible controls U. N0(dt, dy) denotes the compensated Poisson measure, capturing the jump behavior.
The objective is encapsulated in the performance criterion Ju(z), expressed as:
aiming to optimize over the course until exit time , with h and i being the cost functions.
A control u is deemed admissible if it ensures a unique strong solution of the diffusion process for any initial condition in S and satisfies the integrability condition for the negative parts of h and i.
The essence of the stochastic control problem lies in determining the optimal value function Φ(y) and identifying an optimal control policy , fulfilling:
For Markov controls, where u = u(z), the diffusion Z(t) under u transforms into a Lévy diffusion characterized by the generator Au, defined as:
where Δϕ(z; y) = ϕ(z + γ(z, u(z), y))−ϕ(z)−∇ϕ(z)·γ(z, u(z), y), incorporating the jump effects through the Lévy measure ϑ.
Theorem 2.6. Hamilton–Jacobi–Bellman criterion for jump diffusion systems. Consider a controlled jump diffusion system within a domain S ⊂ ℝk, subject to the following conditions:
1. Let ϕ be a function such that ϕ ∈ C2(S) for the interior of S and continuous on , the closure of S. It must satisfy:
(a) For every control v ∈ U and state z ∈ S, the inequality
holds, where Av denotes the infinitesimal generator under control v.
(b) The process exits S through its boundary ∂S with certainty if the exit time τS is finite, and
almost surely, for all admissible controls.
(c) The expectation of the absolute value of ϕ at the exit time and the accumulated generator and gradient terms over the interval [0, τS] is finite, i.e.,
for all admissible controls u and stopping times τ.
(d) The negative part of ϕ(Z(τ)) is uniformly integrable up to τS.
Then, ϕ(z) serves as an upper bound for the value function Φ(z) for all z ∈ S, i.e,
2. Furthermore, if there exists a feedback control û such that for any y ∈ S,
(a) Applying û(y) yields Aûϕ(y)+h(y, û(y)) = 0,
(b) The process under û maintains the uniform integrability of ϕ up to τS.
Then, the strategy û, when applied as u*(t) = û(Z(t−)), constitutes an optimal control. Consequently, we have that ϕ(y) equals the optimal value function Φ(y), and thus satisfies:
Proof. See proof in [39].
2.4 Model formulation
2.4.1 Population dynamics of anopheles mosquitoes X(t)
We use a stochastic differential equation based on ecological modeling principles to explore the dynamics of Anopheles mosquito populations. Initially adhering to a fundamental growth model with death rate λ, expressed as
where r signifies the intrinsic growth rate and K denotes the carrying capacity, we extend our exploration to encapsulate more nuanced dynamics. That is integrating stochastic perturbation into Equation 4 such as :
Therefore the population dynamics of Anopheles become:
where σ captures random fluctuations driven by the infinitesimal increments of a Wiener process or simply white noise dW(t). This model provides a foundational understanding of how the population grows and is constrained by environmental capacity and natural mortality.
However, to account for additional complexities such as the release of mosquitoes and other sudden ecological perturbations, we adapt this model by incorporating a more dynamic representation of the growth rate. This adaptation is crucial to reflect more accurately the variability and unpredictability inherent in real-world ecological systems. Consequently, the logistic growth term is approximated by a time-dependent factor , such that,
where β(t) is modeled using the Cox-Ingersoll-Ross (CIR):
Therefore (6) becomes:
The stochastic nature of β(t) captures intrinsic growth adjustments and external shocks, thus refining the population dynamics model to more accurately reflect sudden changes and interventions. Additionally, the correlation between the stochastic processes dW(t) and dV(t), quantified by the correlation coefficient ρ, introduces further complexity. This enhances the model's capability to represent the interconnected ecological and environmental factors affecting mosquito populations.
This comprehensive approach stands on the shoulders of pioneering work by Allen [34], Capocelli and Ricciardi [40], Turelli [41], and Nipa et al. [42], who, in various contexts, enriched our understanding of population dynamics by incorporating stochastic elements and exploring diverse growth rate equations. Their collective contributions underscore the versatility of these modeling frameworks, transcending disciplinary boundaries and fostering a more profound comprehension of the intricate interplay of factors influencing population growth.
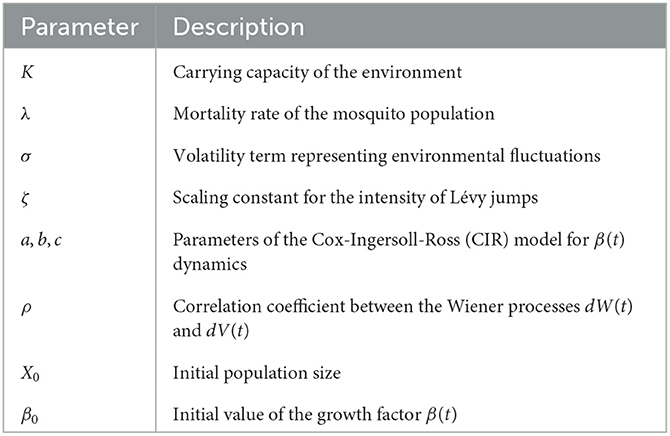
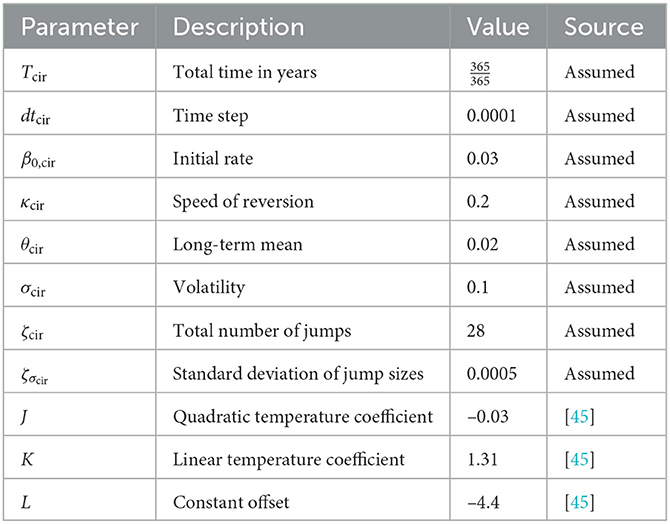
For clarity, the parameters used in our model are summarized in the Table 1.
2.4.2 Dynamics of infected and uninfected mosquito populations
We categorize the mosquito population into two groups: X1(t), representing those infected with Microsporidia MB, and X2(t), comprising the uninfected or wild mosquitoes. The total population is X(t) = X1(t)+X2(t).
The dynamics of these populations are described by a stochastic differential equation with Lévy noise:
This model captures the growth αk, mortality λk, and stochastic influences within each mosquito population, providing a foundation for optimizing symbiont-infected mosquito release strategies for malaria control.
2.4.3 Interaction between infected and uninfected mosquitoes
This section explores the interactions between two key mosquito populations: those infected with Microsporidia MB, a symbiont known for inhibiting malaria transmission, and the uninfected ones. Understanding the dynamics and potential coexistence of these populations is crucial for developing effective malaria control strategies. Drawing from the works of Rafikov et al. [28] and Wyse et al. [43], we model these dynamics using a stochastic differential equation with Lévy noise:
where
signifies the proportion of class k mosquitoes within the total population.
Focusing on a specific case with n = 2 classes (infected and uninfected), we define the total mosquito population as X(t) = X1(t)+X2(t). The fractions of infected and uninfected mosquitoes are represented as
and
Accordingly, Equation 11 can be reformulated for this two-class scenario as follows:
The parameters in this equation are defined as follows:
• γk,j: Interaction coefficients
– γ11: Infected-Infected Mating Rate
– γ12: Infected-Uninfected Mating Rate
– γ21: Uninfected-Infected Mating Rate
– γ22: Uninfected-Uninfected Mating Rate
• θj: Proportional rates
– θ1: Infection prevalence ratio
– θ2: Uninfected ratio
• λk: Mortality rate of the mosquito population
• σk: Volatility term for random population fluctuations
• dWk(t): Wiener process for standard Brownian motion
• Ñk(dt, dy): Lévy measure for impulsive behavior in the population
In the following, we consider that the diffusion term of σ2 and the scaling constant for the intensity of Lévy jumps ζ2 for the wild (uninfected) mosquitoes are null, and that the corresponding intensity of Lévy jumps for infected mosquitoes ζ1 is the unit.
2.4.4 Release control problem formulation
In the context of this study, the performance function is formulated as follows:
Here, α > 0 and γ ∈ (0, 1) are constants, and denotes the expectation with respect to the probability law of the state vector (X1, X2) given initial conditions . The function is given by , where is a fixed domain in ℝ and is a given subset of ℝ2.
Let us consider u(t) = (R(t), θ1(t)) ∈ [0, ∞) × [0, 1] as the control applied at time t, chosen from a set of admissible controls . Furthermore, biological constraints impose that the total mosquito population X(t) = X1(t) + X2(t) is non-negative for all t ≥ 0.
The objective is to identify an optimal release control strategy, defined as follows:
This is subject to the dynamic equation:
Here, , and β(t) describes a mean-reverting process. The functions m1(θ) and m2(λ) are defined as follows:
2.4.4.1 Stopping time τS
The stopping time τS is defined as the first time at which the mosquito population reaches zero:
Assumption 2.7. The generator of the Lévy diffusion process for t ≥ 0 and initial condition is given by:
For simplicity and to avoid compromising the theoretical integrity of the control problem, we assume that the derivative of ψ with respect to β is not directly captured in the generator. Consequently, we use the simplified generator as shown above.
In this context, β(t) is a stochastic function representing the mosquito growth rate, and X(t) represents the population of infected and uninfected mosquitoes. While β(t) was originally a deterministic function, making it stochastic adds realism to the model. However, we choose to simplify the problem by not directly including β(t) in the generator. This is justified because β(t) influences the system implicitly through its effect on X(t), and its direct stochastic influence can be captured indirectly.
By focusing on the primary stochastic process X(t) and simplifying the model, we make the problem more tractable for analysis and control without significantly compromising accuracy. This assumption allows us to balance model complexity with practical applicability, especially when empirical evidence supports that the effects of β(t) can be captured indirectly through X(t).
3 Mathematical analysis
3.1 Analytical results
In this section, we rigorously analyze the solution to the stochastic optimal control problem via dynamic programming, a methodology crucial for optimizing the Hamiltonian–Jacobi–Bellman (HJB) equation. The HJB equation serves as the fundamental equation governing the release control problem, underpinning our analytical framework.
Proposition 3.1. The solution to the dynamic (9) representing the total mosquito population is given by:
with :
In particular, if −1 < ζy ≤ 0,
Proof. Consider Z(t) = h(t, X(t)) such that h(t, X(t)) = ln(X(t)) is an Ito-Lévy process. Using the Ito-Lévy formula, we get,
By replacing h by ln(x), dZ(t) is expressed as follows:
Thus, by integrating both sides of the previous equality, we have :
Taking the exponential of both sides facilitates deriving the solution presented in Equation 23. For further details, the reader is referred to the comprehensive discussions in Øksendal and Sulem [39] and Nunno et al. [44].
Proposition 3.2. A solution to the release control problem (17) is given by :
where is a constant determining the corresponding fraction over the total mosquito required for the release. An explicit formula for the constant is given in the following proposition.
Proof. Consider the following controlled process
The corresponding generator to Z(t) denoted by 𝔸u is given by:
Choose
Based on Assumption 2.7, we have
with
Setting we get,
Let us define the function H(R, θ1) as follows:
For any release value Rv ≥ R and prevalence ratio θv,1 ≥ θ1 simultaneously,
This implies that H(R, θ1) is a non-decreasing function with respect to R and θ1. Furthermore, H is concave in (R, θ1) and attains its maximum, that is:
The relation (29) implies that,
Moreover, from (30) we have
Thus
Accordingly,
From Equations 29, 30, and based on the HJB criterion for jumps diffusion in Theorem (2.6), the optimal release R* and symbiont transmission rate can be expressed as follows:
Proposition 3.3. The constant in Equation 32 is given by:
where
Remark 3.4. This constant, , can be denoted as because it depends on temperature T. This dependence arises from the fact that the mosquito death rates λ1 and λ2 are functions of temperature. Consequently, this makes the release strategy temperature dependent, even though it can inherit the dependency from x, which is already influenced by environmental conditions. This ensures that R is proportional to the total mosquito population at any time, and that the proportionality factor reflects the impact of temperature on the release.
As depicted in Figure 2, the release factor quantifies the necessary adjustments in mosquito release quantities throughout the year 2023. This model reflects how local temperature fluctuations critically influence mosquito population management strategies. The graph highlights the relationship between temperature and the scaling of mosquito release, underlining the importance of temperature in optimizing biological control measures against mosquito-borne diseases. This adaptive strategy aids in tailoring interventions to be more effective and responsive to changing climatic conditions, enhancing the efficacy of disease control efforts.
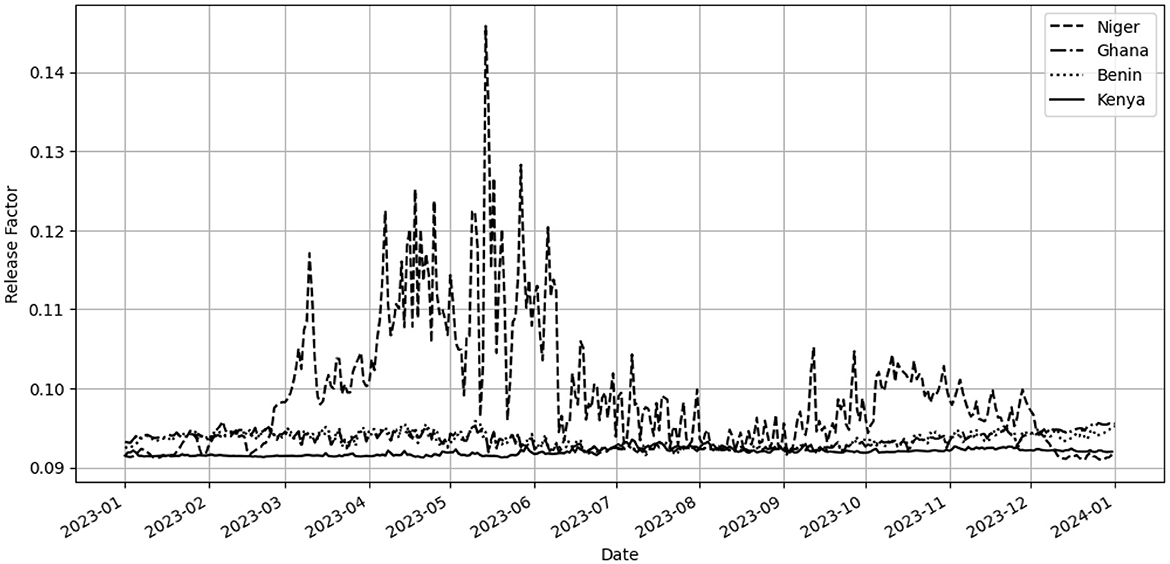
Figure 2. Temperature-Dependent Release Factor from January 1, 2023, to January 1, 2024: This plot displays the computed release factor as a function of daily mean temperatures from Niger, Ghana, Benin and Kenya. Each data point illustrates the factor adjustment required to modulate daily mosquito releases in response to environmental temperature variations.
Proof. [Proposition 3.3] The release strategy of infected mosquitoes by the symbiont microbe imposes that . Therefore,
Since the total mosquito population is assumed to be strictly positive (x > 0), we have:
Thus
Accordingly, if ϑ = 0,
Now let us consider that ϑ ≠ 0. If θ1 ≠ 0, define the function f(y; θ1) as:
such that f(y; θ1) ≠ 0 for all y ∈ ℝ. Therefore,
Hence, the following equation holds:
Proposition 3.5. Given that θ1 and R are solutions to the release problem, the following inequality holds:
where ς(β) is defined as:
and κ0, κ1, κ2 are constants.
Moreover, if there exists a finite value,
such that:
then the expected absolute value of ψ at the exit time, along with the accumulated generator and gradient terms over the interval [0, τS], is finite.
Proof.
Therefore, we have
since , we obtain the following :
By applying Fubini's theorem, we interchange the expectation and integral, justified by the non-negativity of the integrand:
Since , we have :
Thus
We get
Since ψ(t)2 ≥ 0, we have . Applying Jensen's inequality for the concave function , we obtain:
Therefore,
Considering the relation (44), we note that
Hence,
where is a positive constant.
Remark 3.6. Since , the expression (33) can be written as :
Theorem 3.7. Suppose that for each mosquito population , there exists a release strategy v such that v: = û(x), satisfying the condition:
and that u*(t) = û(X(t)). Then is an optimal control given by the following:
The value function for the release control problem described by (17) is then expressed by
where is a constant determined by (34), which differentiates cases where the measure ϑ(dy) is zero and non-zero. The term involving the integral over ℝ signifies contributions from jumps, with ϑ(dy) representing a measure.
Proof. Let and for k = 1, 2, …, set τk = k∧τS.
Since Proposition 3.5 ensures that
we can apply Dynkin's Formula II to obtain
Therefore,
Thus, for ,
Accordingly,
Furthermore, since u* = û(x) then,
Therefore
Using Propositions 3.2 and 3.3, the proof is completed.
Proposition 3.8. Assuming that and satisfy the conditions of the release control problem and that γ11 and γ22 are distinct from , then the integral
can take the form :
Consequently, the infection prevalence ratio during release can be articulated as follows :
Note that the integral is independent of θ1 and θ2.
Proof. Suppose that where H is given by
Thus,
Since , Equation 57 becomes:
Therefore, we obtain:
Given that the total mosquito population X(t) and the constants and γ are non-zero, it follows that:
This expression for is derived by rearranging the terms and solving for under the condition that the denominator is non-zero, which should be verified in the context of the problem. Therefore
Hence,
Furthermore the integral is independent of θ1 and θ2. This completes the derivation of θ1 and θ2, as required by the release control problem.
Proposition 3.9. (Sensitivity of the infection prevalence ratio) Let θ1 and θ2 the fractions of infected and uninfected mosquitoes, such that :
Therefore, as the growth rate β increases the infection prevalence ratio θ1 increases. That is, for all β ∈ (0, 1)
Proof. Assume that γ11 and γ22 are different from .
(i) Considering the case where the Lévy measure ϑ = 0, by setting θ1 = f(β) such that for the function is well defined,
Thus, if
(ii) In the same way for ϑ ≠ 0, f′(β) > 0 whenever .
3.2 Numerical results
3.2.1 Numerical simulation of mosquito population dynamics
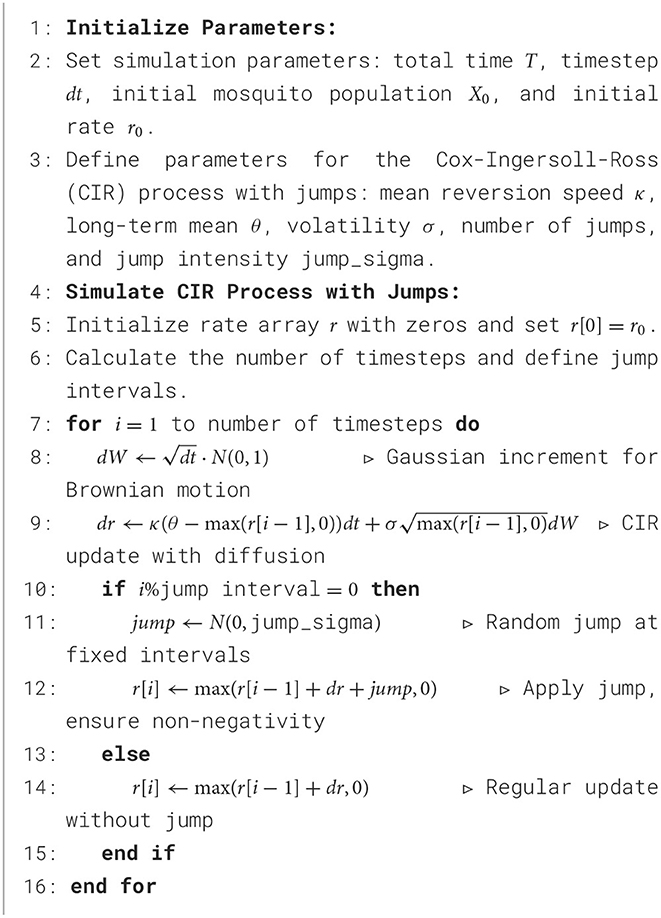
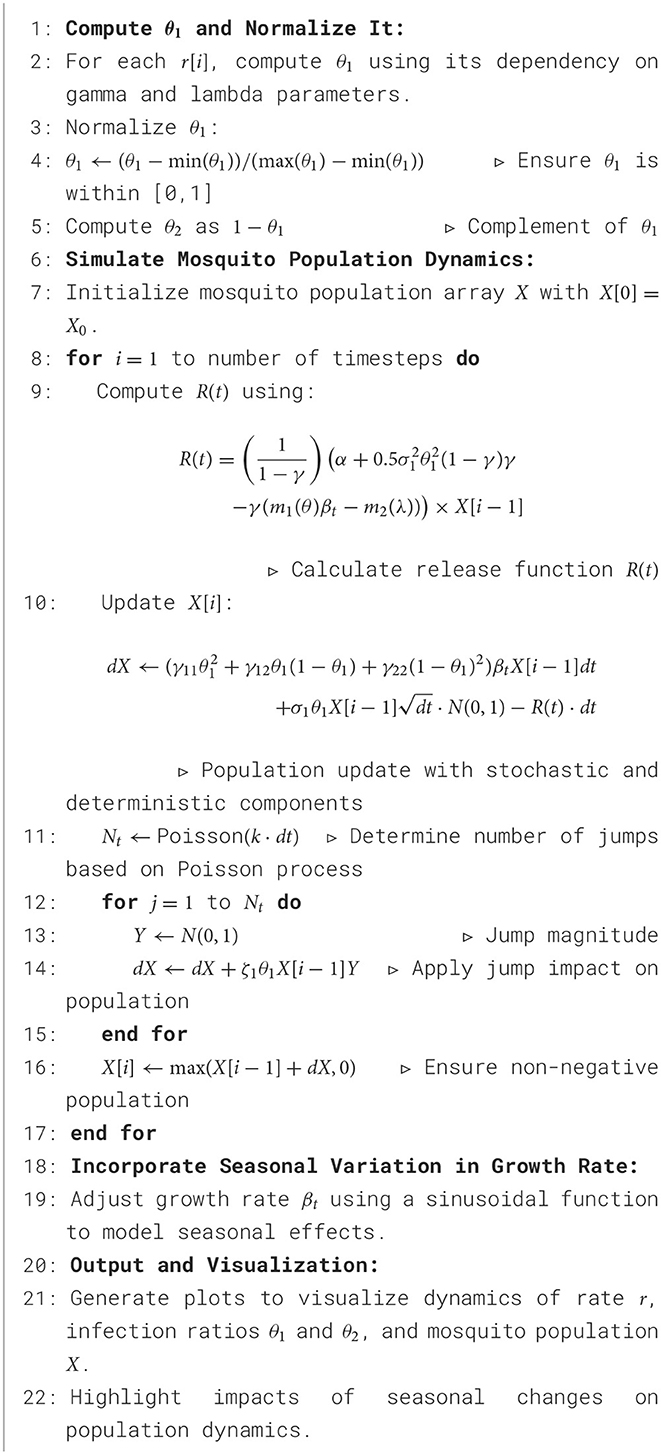
This section provides a comprehensive description of the numerical methods used to simulate the dynamics of mosquito populations influenced by stochastic factors and vector control strategies, incorporating Lévy-driven stochastic differential equations (SDEs). The simulations are performed using Python, leveraging its robust libraries for numerical computations and stochastic modeling.
3.3 Numerical simulations of the optimal control problem
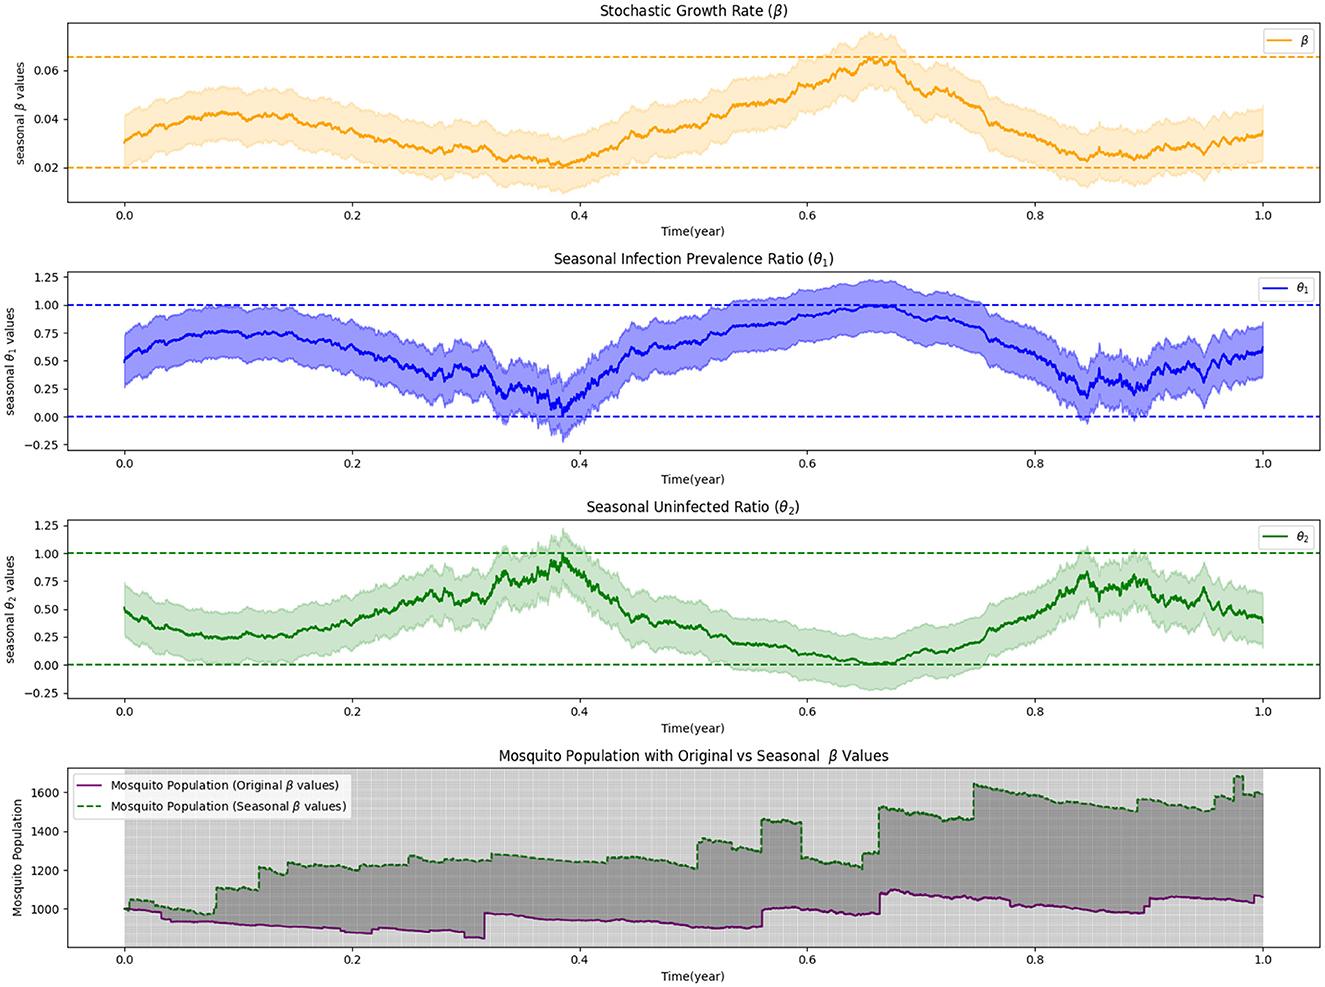
In our study, we employ numerical simulations to investigate the intricacies of stochastic optimal control in mosquito release strategies, focusing on the effects of Lévy measures and seasonality. While we do not present the cases with zero Lévy noise and non-zero Lévy noise without seasonality, they serve as baseline references to understand the infection dynamics under more controlled conditions. The first simulation, depicted in Figure 3, incorporates seasonal dynamics under a zero Lévy measure. This simulation demonstrates how infection prevalence and the ratio of uninfected individuals fluctuate with the seasons, while also highlighting the necessary adjustments in stochastic growth rates to optimize the release process. It emphasizes the critical role of seasonality in the success of mosquito control efforts, where timing and environmental conditions are pivotal to strategic planning. In Figure 4, we extend the analysis by introducing non-zero Lévy measures, in combination with seasonality, to explore their joint impact on mosquito release strategies. This simulation provides a multifaceted view of how Lévy-driven fluctuations and seasonal variations influence infection dynamics and control strategies. The results underscore the complexity of designing effective mosquito release strategies that must account for both ecological variability and stochastic uncertainties.
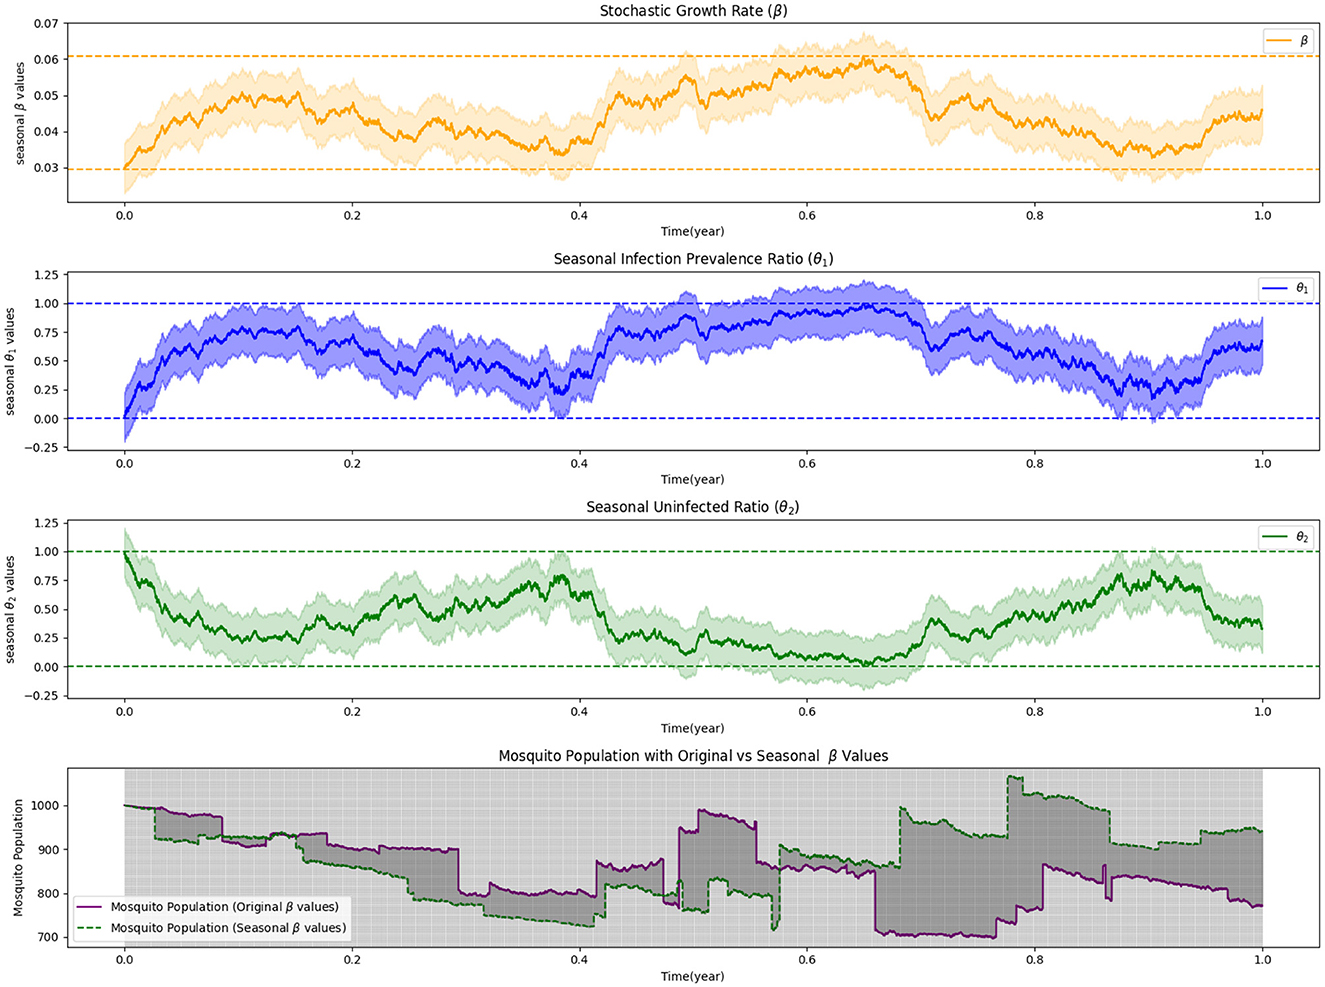
Figure 3. Stochastic optimal control and seasonal dynamics in mosquito release: a zero Lévy measure simulation.
3.4 Numerical illustration of the infection prevalence ratio θ1
This section presents both 2D and 3D analyses to deepen our understanding of how symbiont prevalence in mosquito populations correlates with key environmental and biological factors. Specifically, the 2D analyses (Figures 5A, B) explore the relationships between symbiont prevalence, temperature, and the stochastic growth rate β. These correlations provide insights into the individual effects of temperature and growth rates on symbiont spread within mosquito populations. Extending beyond this, the 3D visualizations (Figures 5C, D) synthesize these variables, offering a comprehensive view that highlights the intricate interplay between environmental conditions and the efficacy of mosquito release strategies. Through this multifaceted analytical approach, we gain a clearer understanding of the factors that influence symbiont prevalence, aiding in the optimization of mosquito release methodologies.
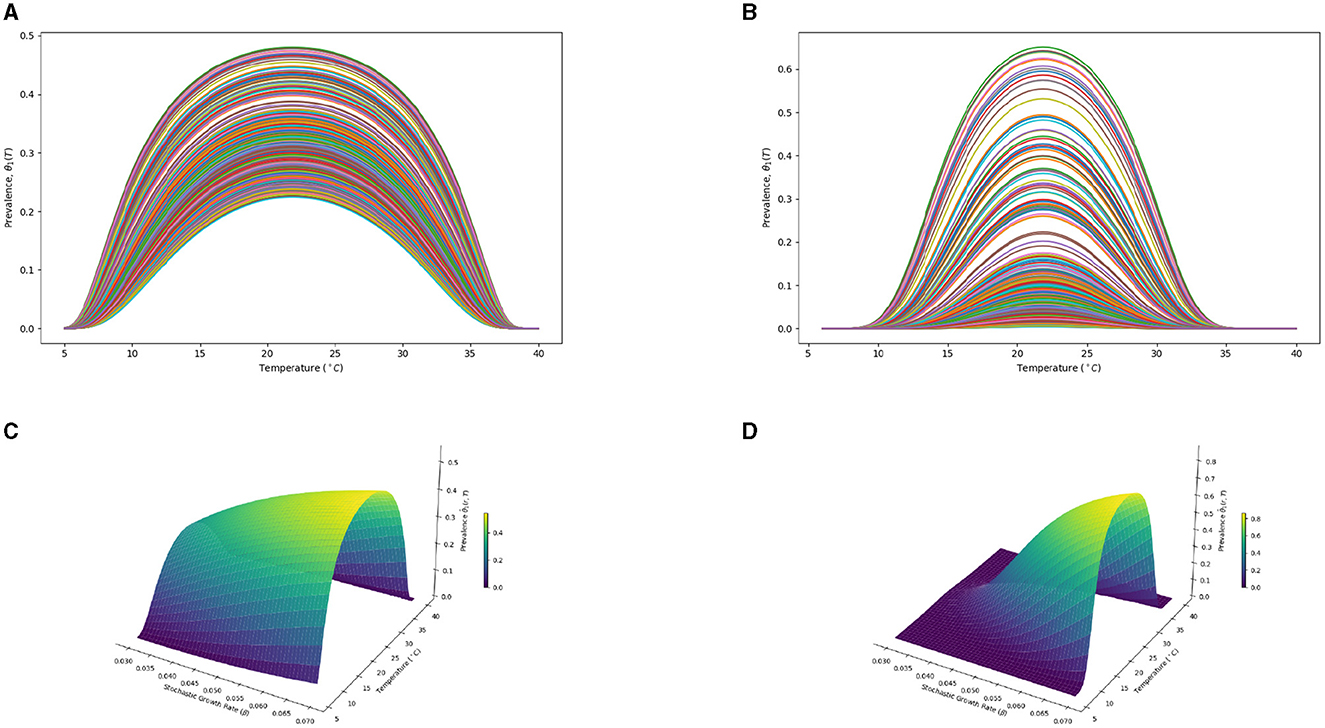
Figure 5. Interplay of environmental conditions and symbiont prevalence in mosquito releases: a 2D and 3D analytical perspective. (A) θ1_values with Levy measure ϑ = 0 in 2D. (B) θ1_values with Levy measure ϑ ≠ 0 in 2D. (C) θ1_values with ϑ = 0 in 3D. (D) θ1_values with ϑ ≠ 0 in 3D.
3.4.1 Spatial representations based on temperature
This part of the paper presents numerical simulations and spatial illustrations that complement our analytical findings, while also considering the biological and ecological implications of our study. To ensure the model's compatibility with biological settings, we have adjusted the infection prevalence ratio using a logistic transformation. Specifically, we normalize the symbiont prevalence rate during release with the logistic function . This guarantees that the ratio remains non-negative and is bounded between 0 and 1, which is essential for maintaining the practical applicability and interpretability of our model in real-world biological scenarios. The proportion θ1 represents the infection prevalence ratio, influenced by temperature and varying growth rates over time. Conversely, θ2 denotes the uninfected ratio, reflecting the susceptibility of wild mosquitoes to the Plasmodium parasite. This becomes critical in estimating the maximum malaria prevalence during periods when the symbiont prevalence drops or becomes inefficient, possibly due to environmental changes. The simulations were conducted with both zero and non-zero Lévy measures to demonstrate the varying effects under different conditions. To define the infection prevalence ratio quantitatively, we derive the formula for θ1 as follows:
To map the malaria transmission potential risk area, we consider the uninfected ratio , which can be represented by:
3.5 Spatial illustrations
In this subsection, we present spatial illustrations depicting the areas of malaria transmission potential risk based on the variability in symbiont prevalence over a year of release. This risk is closely linked to the effectiveness of the release strategy.
The maps show variations in malaria transmission risks across different study areas, illustrating the effects of mosquito releases in Benin, Niger, Ghana, and Kenya on reducing malaria transmission risks. At day 28 of the releases, the lowest transmission risks observed are 82% for Benin (Figure 6A), 76% for Niger (Figure 7A), 77% for Ghana (Figure 8A), and 76% for Kenya (Figure 9A). By day 252, there is a notable decrease in malaria transmission risks: 44% for Benin (Figure 6B), 37% for Niger (Figure 7B), 37% for Ghana (Figure 8B), and 37% for Kenya (Figure 9B). This demonstrates the impact of the release strategy on malaria transmission dynamics, primarily influenced by vector population densities. The green areas indicate low transmission risk (Figures 6–9), while the red areas indicate high transmission risk, highlighting regions where the release strategy has less impact.
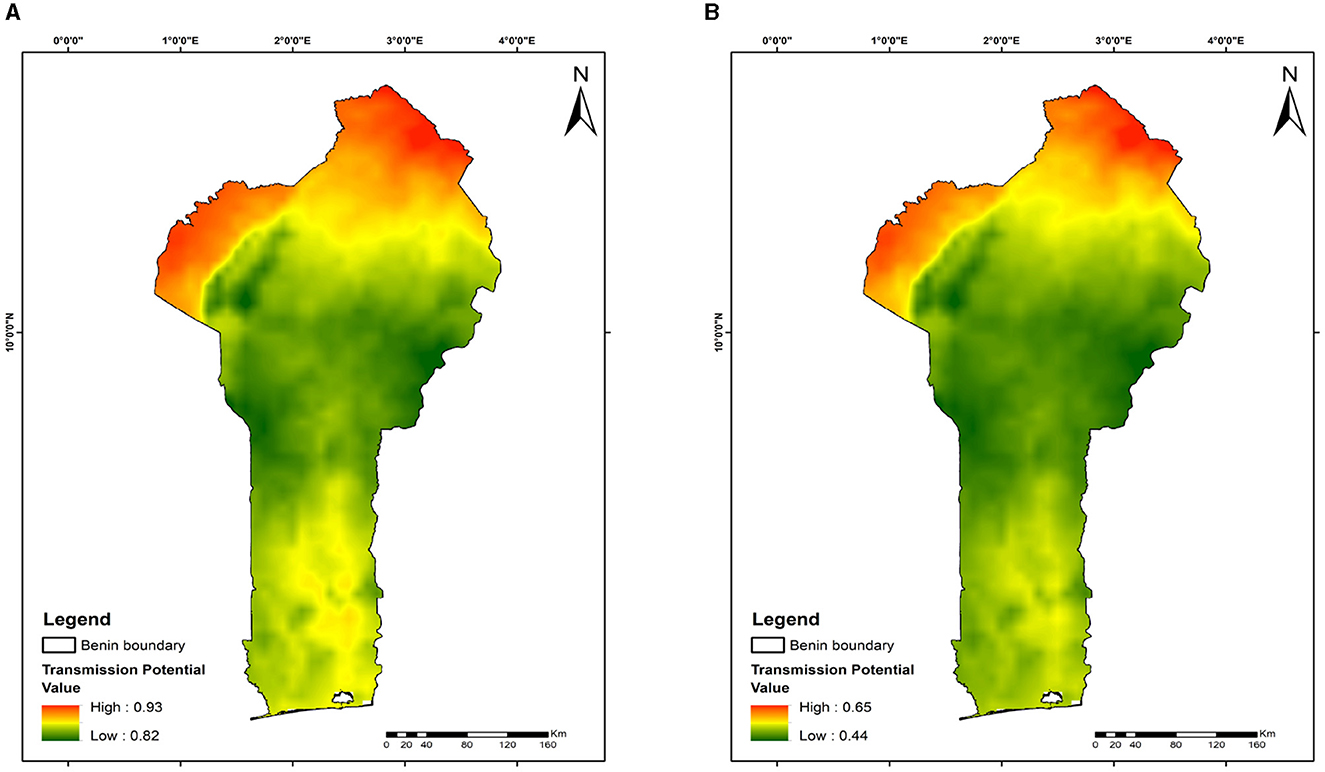
Figure 6. Mapping malaria transmission risks in Benin: evaluating mosquito release strategy efficiency. (A) 28 days. (B) 252 days. This map illustrates malaria transmission risk areas in Benin, influenced by temperature variations, geographical location, and the timing and quantity of mosquito releases.
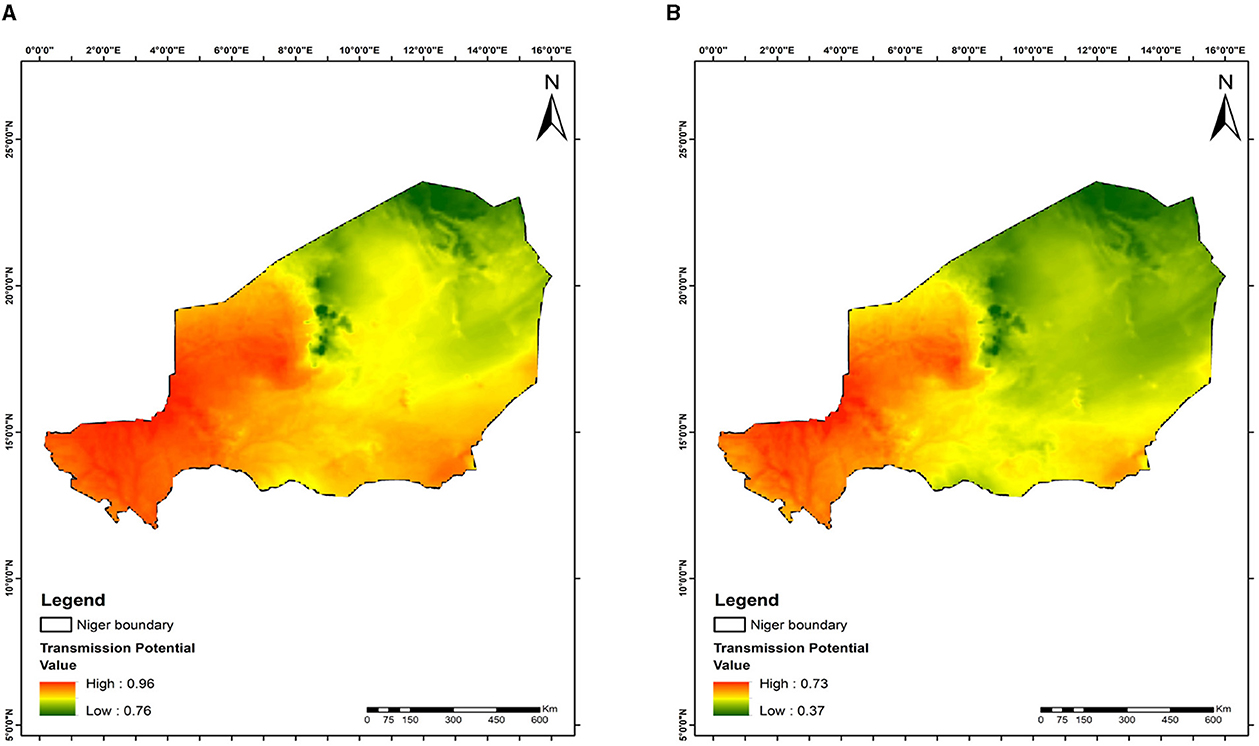
Figure 7. Mapping malaria transmission risks in Niger: evaluating mosquito release strategy efficiency. (A) 28 days. (B) 252 days. This map shows malaria transmission risk areas, impacted by temperature differences, geographical location, and the timing and quantity of mosquito releases.
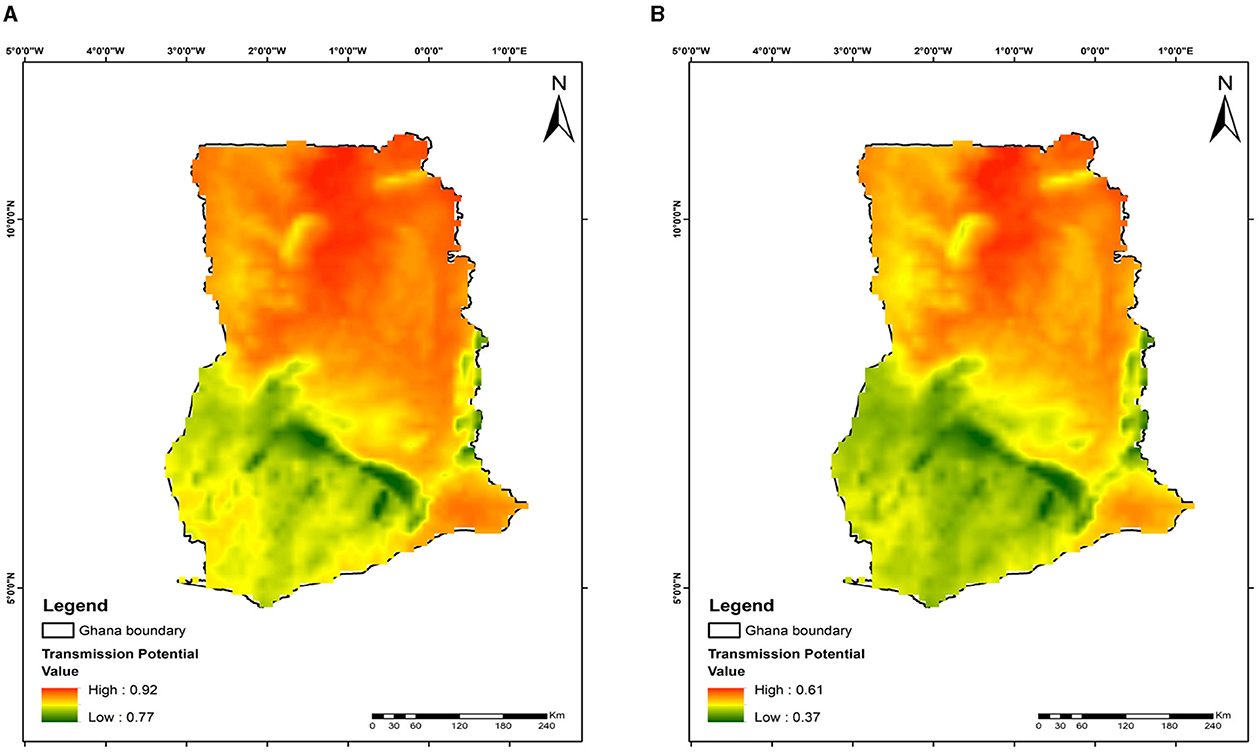
Figure 8. Mapping malaria transmission risks in Ghana: evaluating mosquito release strategy efficiency. (A) 28 days. (B) 252 days. This map depicts malaria transmission risk areas, affected by temperature variations, geographical location, and the timing and quantity of mosquito releases.
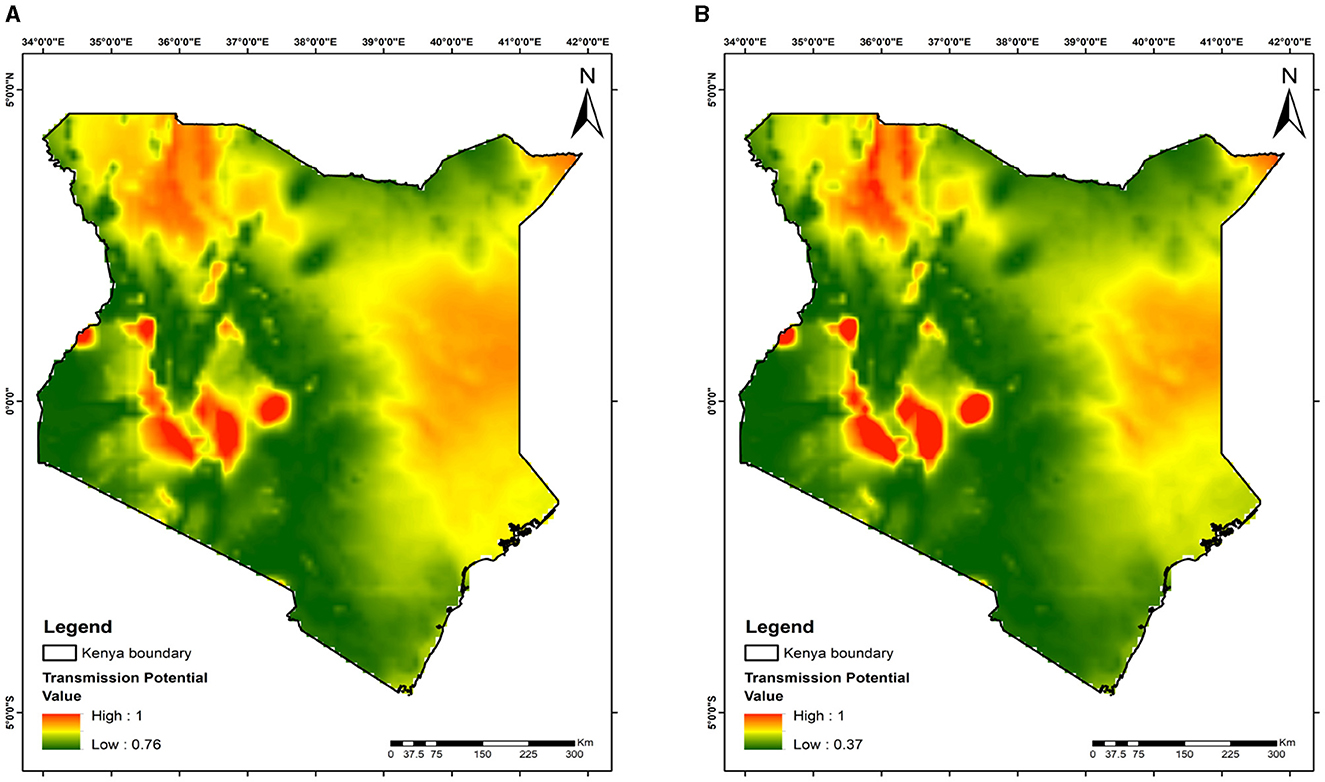
Figure 9. Mapping malaria transmission risks in Kenya: evaluating mosquito release strategy efficiency. (A) 28 days. (B) 252 days. This map highlights malaria transmission risk areas, shaped by temperature differences, geographical location, and the timing and quantity of mosquito releases.
3.6 Validation
The integrity of our model was rigorously tested using data on the prevalence of the microbe Microsporidia MB collected in Kenya. Figure 10 illustrates a direct correlation between symbiont prevalence in mosquito populations and malaria transmission risk across Kenya. The map highlights regions based on confirmed prevalence and overlays these with malaria transmission risks, providing a compelling visual validation of our model. Our analysis mapped Microsporidia MB prevalence data against areas of significant malaria transmission potential, identifying specific zones of concern. The validation revealed that regions with higher symbiont prevalence exhibit lower malaria transmission risks, underscoring the importance of symbiont activity in mitigating malaria transmission. In conclusion, our model's validation highlights the necessity for tailored strategies that address malaria transmission challenges, including the innovative use of symbionts for vector control.
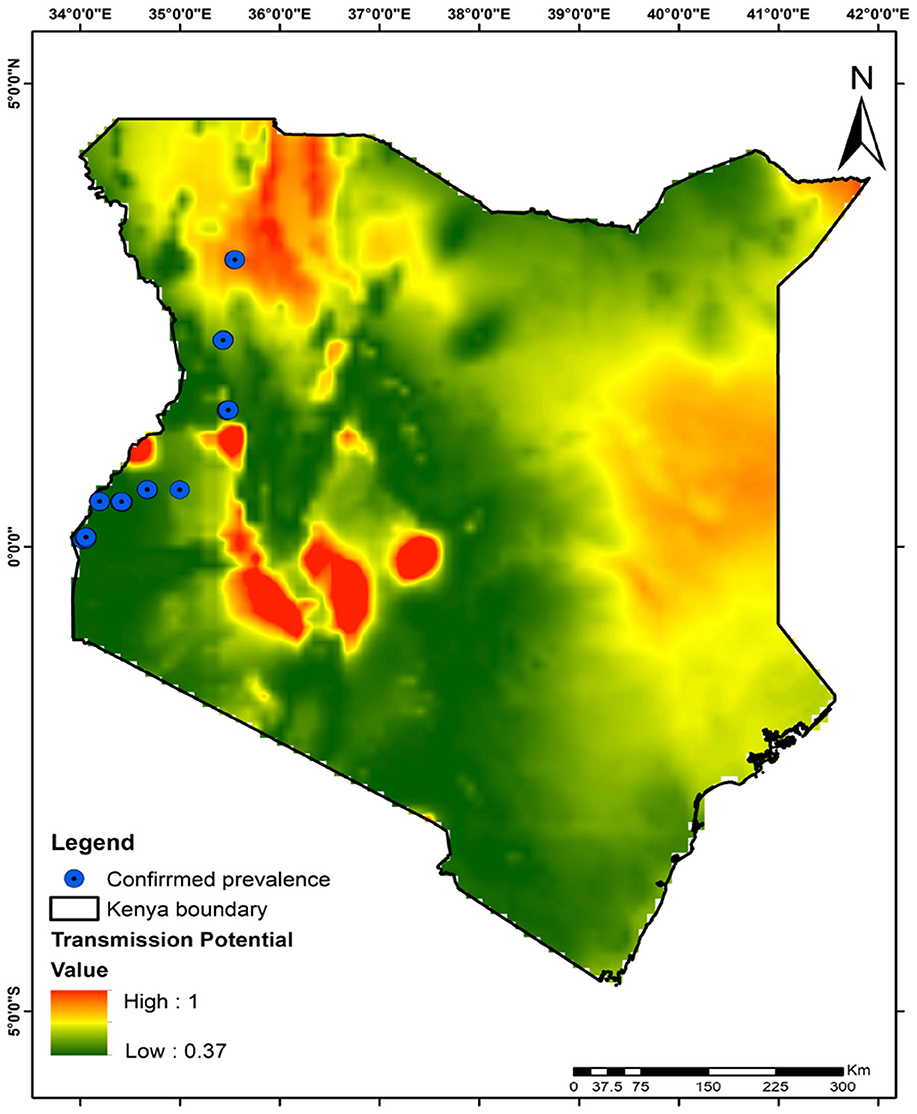
Figure 10. Correlating Microsporidia MB prevalence with low malaria transmission risk area: a validation of the model. This figure shows how the prevalence of Microsporidia MB in mosquito populations reduces malaria transmission risk in various regions of Kenya, validating our model's effectiveness.
3.6.1 Model parameter values
The sensitivity of the stochastic growth rate β and the population of mosquitoes X(t) under the parameters in Tables 2, 3 are in Table 4 in Appendix.
4 Discussion
This study investigated the use of stochastic optimal control to manage the release of Anopheles mosquitoes infected with Microsporidia MB, aiming to reduce malaria transmission. By employing Hamilton–Jacobi–Bellman (HJB) Equation 17, we identified the optimal daily release and symbiont prevalence necessary for effective malaria control. Our results demonstrate that an increase in the growth rate of Anopheles mosquitoes enhances the infection prevalence ratio (Proposition 3.9) and reduces the proportion of uninfected mosquitoes, thereby amplifying the potential for disease control.
A key improvement in this study is the refined calculation of the infection prevalence ratio using a sigmoid function, providing a more accurate representation of biological and ecological realities. This ratio, influenced by stochastic factors such as time and temperature, highlights the variability in infection rates within mosquito populations. The relationship between the optimal infection prevalence (θ1) and the uninfected mosquito ratio (θ2) illustrates malaria transmission risk dynamics, as shown in Figures 6–9. Our spatial analysis across these regions reveals a general reduction in malaria transmission following the release of infected mosquitoes. However, this reduction is not uniform; it varies with time, temperature, and geographical conditions, with fluctuations reflecting the adaptation period of released mosquitoes into wild populations.
Recent advances in malaria control emphasize the ongoing need for innovative strategies. For example, the CDC recently reported the effectiveness of vector control measures such as pyrethroid-chlorfenapyr-impregnated nets, despite emerging challenges like insecticide resistance [46]. Concurrently, mathematical modeling has been pivotal in evaluating various interventions. Notably, one recent study integrated machine learning with transmission dynamics to optimize malaria intervention strategies [47]. Similarly, Ozodiegwu et al. developed a model incorporating drug resistance and preventive measures to assess malaria dynamics in Nigeria [48]. In this context, our study introduces a novel approach, leveraging stochastic optimal control and mosquitoes infected with Microsporidia MB to disrupt Plasmodium transmission. This strategy complements existing interventions, reinforcing flexibility and adaptation to local environmental conditions. Moreover, by integrating stochastic elements such as white and Lévy noise, we have enhanced the model's capacity to account for diverse environmental variabilities, offering a more comprehensive depiction of mosquito population dynamics.
The implications of our findings are significant for public health, particularly in malaria-endemic regions of West and East Africa. The adaptability of the infected mosquitoes and the variability in symbiont prevalence, influenced by environmental and ecological factors, underscore the complexity of implementing effective vector control strategies. Additionally, challenges related to potential ecological impacts, logistical concerns, and public acceptance must be carefully considered to ensure successful implementation of this approach. Ongoing monitoring will be essential to assess the ecological impacts and efficacy of the releases over time. While this study does not explicitly address the economic costs of mosquito releases, future research should incorporate economic modeling to evaluate the cost-effectiveness of various release strategies. This would aid in optimizing the timing, frequency, and scale of releases, thereby maximizing their impact while ensuring financial viability for large-scale implementation.
Future studies should also explore additional factors that influence the success of Microsporidia MB-infected mosquito releases, such as the interaction between symbionts and insecticide-resistant mosquito populations, potential ecological side effects, and long-term sustainability. Incorporating more extensive field data, especially from regions with varied climates, could further refine the model and increase its applicability across different malaria-endemic zones.
In conclusion, this research advances malaria vector control strategies by employing stochastic optimal control under a Lévy process to optimize the release of Microsporidia MB-infected mosquitoes. Our model demonstrates the significant influence of symbiont activity on mosquito population dynamics, affecting both infection prevalence and malaria transmission risks. By accounting for environmental factors such as seasonality and incorporating Lévy noise, the model captures a more realistic and dynamic picture of mosquito behavior under varying conditions. Spatial analysis across Ghana, Niger, Benin, and Kenya reveals the gradual impact of infected mosquitoes on local populations, supporting the potential for integrated approaches in malaria control. These findings underscore the importance of adaptable, region-specific strategies, with further research needed to explore economic feasibility and the interplay between biological and ecological factors for long-term success.
Data availability statement
The original contributions presented in the study are included in the article/Supplementary material, further inquiries can be directed to the corresponding author.
Ethics statement
The manuscript presents research on animals that do not require ethical approval for their study.
Author contributions
SA: Conceptualization, Formal analysis, Investigation, Methodology, Validation, Visualization, Writing – original draft, Writing – review & editing. HT: Conceptualization, Supervision, Validation, Visualization, Writing – review & editing. PN: Conceptualization, Methodology, Supervision, Writing – review & editing. BK: Conceptualization, Investigation, Methodology, Supervision, Visualization, Writing – review & editing. SA: Formal analysis, Investigation, Supervision, Visualization, Writing – review & editing. JH: Conceptualization, Funding acquisition, Resources, Supervision, Validation, Writing – review & editing.
Funding
The author(s) declare financial support was received for the research, authorship, and/or publication of this article. This study, conducted by the International Centre of Insect Physiology and Ecology, is part of the Symbiont Modeling and Deployment Strategies project, generously supported by the Bill and Melinda Gates Foundation (INV-022584). The opinions, findings, conclusions, or recommendations expressed in this publication are those of the authors and do not necessarily reflect the view of the donor.
Acknowledgments
The authors express their gratitude to the Microsporidia team for their support in this work.
Conflict of interest
The authors declare that the research was conducted in the absence of any commercial or financial relationships that could be construed as a potential conflict of interest.
The author(s) declared that they were an editorial board member of Frontiers, at the time of submission. This had no impact on the peer review process and the final decision.
Publisher's note
All claims expressed in this article are solely those of the authors and do not necessarily represent those of their affiliated organizations, or those of the publisher, the editors and the reviewers. Any product that may be evaluated in this article, or claim that may be made by its manufacturer, is not guaranteed or endorsed by the publisher.
Supplementary material
The Supplementary Material for this article can be found online at: https://www.frontiersin.org/articles/10.3389/fams.2024.1465153/full#supplementary-material
References
1. CDC. Comparison of the Plasmodium Species Which Cause Human Malaria. (2013). Available at: http://www.cdc.gov/dpdx/malaria/index.html (accessed November 17, 2023).
2. Marshall JM, Taylor CE. Malaria control with transgenic mosquitoes. PLoS Med. (2009) 6:e1000020. doi: 10.1371/journal.pmed.1000020
3. World Health Organization. Fact Sheet Malaria. WHO Media Centre (2017). Available at: https://apps.who.int/iris/bitstream/handle/10665/204183/Fact_Sheet_WHD_2014_EN_1632.pdf (accessed November 19, 2023).
4. World Health Organization. World Malaria Report 2021. World Health Organization (2021). Licence: CC BY-NC-SA 3.0 IGO. Available at: https://www.who.int/teams/global-malaria-programme/reports/world-malaria-report-2021 (accessed November 19, 2023).
5. Mwamtobe PM, Abelman S, Tchuenche JM, Kasambara A. Optimal (control of) intervention strategies for malaria epidemic in Karonga District, Malawi. In: Abstract and Applied Analysis. Hindawi Publishing Corporation (2014), p. 1–20. doi: 10.1155/2014/594256
6. World Health Organization. World Malaria Report: 20 years of global progress and challenges. World Health Organization (2020). Available at: https://www.who.int/publications/i/item/9789240015791 (accessed November 19, 2023).
7. Gomes FM, Barillas-Mury C. Infection of anopheline mosquitoes with Wolbachia: implications for malaria control. PLoS Pathog. (2018) 14:e1007333. doi: 10.1371/journal.ppat.1007333
8. Hughes GL, Koga R, Xue P, Fukatsu T, Rasgon JL. Wolbachia infections are virulent and inhibit the human malaria parasite Plasmodium falciparum in Anopheles gambiae. PLoS Pathog. (2011) 7:e1002043. doi: 10.1371/journal.ppat.1002043
9. Herren JK, Mbaisi L, Mararo E, Makhulu EE, Mobegi VA, Butungi H, et al. A microsporidian impairs Plasmodium falciparum transmission in Anopheles arabiensis mosquitoes. Nat Commun. (2020) 11:2187. doi: 10.1038/s41467-020-16121-y
10. Akorli J, Akorli EA, Tetteh SNA, Amlalo GK, Opoku M, Pwalia R, et al. Microsporidia MB is found predominantly associated with Anopheles gambiae s.s. and Anopheles coluzzii in Ghana. Sci Rep. (2021) 11:18658. doi: 10.1038/s41598-021-98268-2
11. Moustapha LM, Sadou IM, Arzika II, Maman LI, Gomgnimbou MK, Konkobo M, et al. First identification of microsporidia MB in Anopheles coluzzii from Zinder City, Niger. Parasit Vectors. (2024) 17:39. doi: 10.1186/s13071-023-06059-7
12. Ahouandjinou MJ, Sovi A, Sidick A, Sewadé W, Koukpo CZ, Chitou S, et al. First report of natural infection of Anopheles gambiae s.s. and Anopheles coluzzii by Wolbachia and Microsporidia in Benin: a cross-sectional study. Malaria J. (2024) 23:72. doi: 10.1186/s12936-024-04906-1
13. Fox RM, Weiser J. A microsporidian parasite of Anopheles gambiae in Liberia. J Parasitol. (1959) 45:21–30. doi: 10.2307/3274782
14. Reynolds D. Laboratory studies of the microsporidian Plistophora culicis (Weiser) infecting Culex pipiens fatigans Wied. Bull Entomol Res. (1970) 60:339–49. doi: 10.1017/S0007485300040852
15. Schenker W, Maier W, Seitz H. The effects of Nosema algerae on the development of Plasmodium yoelii nigeriensis in Anopheles stephensi. Parasitol Res. (1992) 78:56–9. doi: 10.1007/BF00936182
16. Bano L. Partial inhibitory effect of Plistophora culicis on the sporogonic cycle of Plasmodium cynomolgi in Anopheles stephensi. Nature. (1958) 181:430–430. doi: 10.1038/181430a0
17. Huang M, Tang M, Yu J. Wolbachia infection dynamics by reaction-diffusion equations. Sci China Math. (2015) 58:77–96. doi: 10.1007/s11425-014-4934-8
18. Matsufuji T, Seirin-Lee S. The optimal strategy of incompatible insect technique (IIT) using Wolbachia and the application to malaria control. J Theor Biol. (2023) 569:111519. doi: 10.1016/j.jtbi.2023.111519
19. Zhang X, Tang S, Cheke RA. Models to assess how best to replace dengue virus vectors with Wolbachia-infected mosquito populations. Math Biosci. (2015) 269:164–77. doi: 10.1016/j.mbs.2015.09.004
20. Zheng B, Tang M, Yu J. Modeling Wolbachia spread in mosquitoes through delay differential equations. SIAM J Appl Math. (2014) 74:743–70. doi: 10.1137/13093354X
21. Cai L, Bao L, Rose L, Summers J, Ding W. Malaria modeling and optimal control using sterile insect technique and insecticide-treated net. Appl Anal. (2022) 101:1715–34. doi: 10.1080/00036811.2021.1999419
22. Fister KR, McCarthy ML, Oppenheimer SF. Diffusing wild type and sterile mosquitoes in an optimal control setting. Math Biosci. (2018) 302:100–15. doi: 10.1016/j.mbs.2018.05.015
23. Multerer L, Smith T, Chitnis N. Modeling the impact of sterile males on an Aedes aegypti population with optimal control. Math Biosci. (2019) 311:91–102. doi: 10.1016/j.mbs.2019.03.003
24. Fister KR, McCarthy ML, Oppenheimer SF, Collins C. Optimal control of insects through sterile insect release and habitat modification. Math Biosci. (2013) 244:201–12. doi: 10.1016/j.mbs.2013.05.008
25. Stone CM. Transient population dynamics of mosquitoes during sterile male releases: modelling mating behaviour and perturbations of life history parameters. PLoS ONE. (2013) 8:e76228. doi: 10.1371/journal.pone.0076228
26. Thomé RC, Yang HM, Esteva L. Optimal control of Aedes aegypti mosquitoes by the sterile insect technique and insecticide. Math Biosci. (2010) 223:12–23. doi: 10.1016/j.mbs.2009.08.009
27. Diaz H, Ramirez A, Olarte A, Clavijo C. A model for the control of malaria using genetically modified vectors. J Theor Biol. (2011) 276:57–66. doi: 10.1016/j.jtbi.2011.01.053
28. Rafikov M, Bevilacqua L, Wyse A. Optimal control strategy of malaria vector using genetically modified mosquitoes. J Theor Biol. (2009) 258:418–25. doi: 10.1016/j.jtbi.2008.08.006
29. Meetei MZ, Zafar S, Zaagan AA, Mahnashi AM, Idrees M. Dengue transmission dynamics: a fractional-order approach with compartmental modeling. Fractal Fract. (2024) 8:207. doi: 10.3390/fractalfract8040207
30. Alyobi S, Jan R. Qualitative and quantitative analysis of fractional dynamics of infectious diseases with control measures. Fractal Fract. (2023) 7:400. doi: 10.3390/fractalfract7050400
31. Tang TQ, Jan R, Khurshaid A, Shah Z, Vrinceanu N, Racheriu M. Analysis of the dynamics of a vector-borne infection with the effect of imperfect vaccination from a fractional perspective. Sci Rep. (2023) 13:14398. doi: 10.1038/s41598-023-41440-7
32. Jan R, Boulaaras S, Alyobi S, Rajagopal K, Jawad M. Fractional dynamics of the transmission phenomena of dengue infection with vaccination. Discrete Contin Dyn Syst Ser S. (2022) 16:2096–117. doi: 10.3934/dcdss.2022154
33. Jan A, Jan R, Khan H, Zobaer M, Shah R. Fractional-order dynamics of Rift Valley fever in ruminant host with vaccination. Commun Math Biol Neurosci. (2020) 2020. doi: 10.28919/cmbn/5017
34. Allen E. Environmental variability and mean-reverting processes. Discrete Contin Dyn Syst Ser B. (2016) 21:2073–89. doi: 10.3934/dcdsb.2016037
35. Allen EJ, Allen LJ, Schurz H. A comparison of persistence-time estimation for discrete and continuous stochastic population models that include demographic and environmental variability. Math Biosci. (2005) 196:14–38. doi: 10.1016/j.mbs.2005.03.010
36. Luquin-Covarrubias MA. Morales-Bojórquez E. Effects of stochastic growth on population dynamics and management quantities estimated from an integrated catch-at-length assessment model: Panopea globosa as case study. Ecol Modell. (2021) 440:109384. doi: 10.1016/j.ecolmodel.2020.109384
37. Ayoubi T, Bao H. Persistence and extinction in stochastic delay Logistic equation by incorporating Ornstein-Uhlenbeck process. Appl Math Comput. (2020) 386:125465. doi: 10.1016/j.amc.2020.125465
38. Chidzalo P, Ngare PO, Mung'atu JK. Pricing weather derivatives under a tri-variate stochastic model. Sci Afr. (2023) 21:e01768. doi: 10.1016/j.sciaf.2023.e01768
39. Øksendal B, Sulem A. Stochastic control of jump diffusions stochastic control. In: Applied Stochastic Control of Jump Diffusions. Cham: Springer (2019), p. 93–155. doi: 10.1007/978-3-030-02781-0_5
40. Capocelli R, Ricciardi L. A diffusion model for population growth in random environment. Theor Popul Biol. (1974) 5:28–41. doi: 10.1016/0040-5809(74)90050-1
41. Turelli M. Random environments and stochastic calculus. Theor Popul Biol. (1977) 12:140–78. doi: 10.1016/0040-5809(77)90040-5
42. Nipa KF, Jang SRJ, Allen LJ. The effect of demographic and environmental variability on disease outbreak for a dengue model with a seasonally varying vector population. Math Biosci. (2021) 331:108516. doi: 10.1016/j.mbs.2020.108516
43. Wyse APP, Bevilacqua L, Rafikov M. Simulating malaria model for different treatment intensities in a variable environment. Ecol Modell. (2007) 206:322–30. doi: 10.1016/j.ecolmodel.2007.03.038
44. Nunno GD, Øksendal B, Proske F. Malliavin Calculus for Lévy Processes with Applications to Finance. Cham: Springer (2008). doi: 10.1007/978-3-540-78572-9
45. Parham PE, Michael E. Modelling climate change and malaria transmission. In: Michael E, Spear RC, editors. Modelling Parasite Transmission and Control. Cham: Springer (2010), p. 184–99. doi: 10.1007/978-1-4419-6064-1_13
46. Centers for Disease Control and Prevention. Research contributions. (2024). Available at: https://www.cdc.gov/malaria/php/public-health-strategy/research-contributions.html (accessed October 04, 2024).
47. Golumbeanu M, Yang GJ, Camponovo F, Stuckey EM, Hamon N, Mondy M, et al. Leveraging mathematical models of disease dynamics and machine learning to improve development of novel malaria interventions. Infect Dis Poverty. (2022) 11:37–53. doi: 10.1186/s40249-022-00981-1
Keywords: malaria, vector control, stochastic control, HJB equation, Microsporidia MB, Lévy process
Citation: Affognon SB, Tonnang HEZ, Ngare P, Kiplangat BK, Abelman S and Herren JK (2024) Optimizing microbe-infected mosquito release: a stochastic model for malaria prevention. Front. Appl. Math. Stat. 10:1465153. doi: 10.3389/fams.2024.1465153
Received: 15 July 2024; Accepted: 30 October 2024;
Published: 27 November 2024.
Edited by:
Angel Martin Del Rey, University of Salamanca, SpainCopyright © 2024 Affognon, Tonnang, Ngare, Kiplangat, Abelman and Herren. This is an open-access article distributed under the terms of the Creative Commons Attribution License (CC BY). The use, distribution or reproduction in other forums is permitted, provided the original author(s) and the copyright owner(s) are credited and that the original publication in this journal is cited, in accordance with accepted academic practice. No use, distribution or reproduction is permitted which does not comply with these terms.
*Correspondence: Steeven Belvinos Affognon, belvinos@gmail.com
 Steeven Belvinos Affognon
 Henri E. Z. Tonnang
 Philip Ngare1
 Shirley Abelman
 Jeremy K. Herren