 Reza Pakyari*
 Omama M. Al-Hamed
- Statistics Program, Department of Mathematics, Statistics and Physics, College of Arts and Sciences, Qatar University, Doha, Qatar
Two new goodness-of-fit testing procedures are introduced to test exponentiality when data are subject to Type-I censoring. We proposed four test statistics for this purpose. Under extensive Monte Carlo simulations, we showed that the proposed tests maintain the nominal significance level and show good power for both monotonic and non-monotonic hazard function alternatives even for small samples as n = 10. A real dataset is studied for illustrative purposes.
1. Introduction
In reliability and life testing problems, Type-I censoring has gained a significant amount of popularity due to the duration of the experiment being fixed prior to it being started and the fact that it is under the control of the experimenter.
It is of interest to study the lifetime of n items by performing a life testing experiment. By controlling the total time, the experiment can be terminated at the time of T, which can be determined before the life testing experiment begins. This means that d observations take the form of X1 : n ≤ X2 : n ≤ … ≤ Xd : n, and n − d data values are censored, as discussed by Balakrishnan and Cohen [1] and Cohen [2].
The exponential distribution considered in this article is well-known and frequently uses lifetime models. The exponential model is a special case among many important statistical models such as Weibull and gamma distributions. The simplicity and the existence of closed form solutions for many problems make the exponential model appealing, which informs the current study (see also Balakrishnan and Basu [3]). We assume the following form of pdf for the exponential distribution with scale parameter θ
Suppose n items are placed in a life testing experiment, which will be terminated at a pre-determined time T > 0. Let X1 : n, X2 : n, …, Xd : n be the corresponding Type-I censored sample from a distribution function F. Consider the following goodness-of-fit hypothesis
For some positive scale parameter θ. Based on this, the current study was interested in testing for exponentiality.
The maximum likelihood estimator (MLE) of θ, based on censored data X1 : n, X2 : n, …, Xd : n is given by
Provided that d ≥ 1. However, hereafter we assume that d ≥ 1 and that at least one example of censored data are observed.
Pearson [4] was the first to study the problem of goodness-of-fit, which is a statistical procedure for testing the suitability of a specific model to describe a given set of complete or censored data. For a detailed discussion of this problem see D'Agostino and Stephens [5], Huber-Carol et al. [6], and Nikulin and Chimitova [7] among others.
Stephens [8] proposed a version of the Cramer-von Mises and Anderson-Darling goodness-of-fit test statistics for Type-I censored data. Pakyari and Balakrishnan [9] studied a goodness-of-fit testing procedure for the exponential distribution when the available data are Type-I censored. They studied the goodness-of-fit testing problem for the exponential model by treating the Type-I censored data as a complete sample and then performing classical goodness-of-fit tests for complete data.
Their method considered the Type-I censored sample X1 : n ≤ X2 : n ≤ … ≤ Xd : n as order statistics from a complete sample of size d, from a right-truncated exponential distribution at time T.
Pakyari and Resalati Nia [10] extended their work to test other lifetime models such as Weibull and log-normal distributions. We use this idea to present test statistics based on order statistics in Section 2. For the various goodness-of-fit procedures available for censored data see also Balakrishnan et al. [11], Balakrishnan et al. [12], Doring and Cramer [13], Lim and Park [14], Lin et al. [15], Noughabi [16], Pakyari and Balakrishnan [17], Pakyari [18], Pakyari and Baklizi [19], Park and Pakyari [20], and Qi et al. [21].
This article presents new testing procedures for testing the goodness-of-fit of the exponential model when data are Type-I censored. We study several testing procedures in this regard such as tests based on order statistics, tests based on quantiles, and tests based on binomial distribution. However, our proposed method is based on order statistics followed by tests based on quantiles. We investigate the empirical power of the proposed tests through an extensive Monte Carlo simulation study.
This study aims to provide some easy yet powerful goodness-of-fit testing procedures for exponentiality, which is known to be a special case among many well-applied lifetime models.
The paper is structured as follows. Section 2 introduces some test statistics which are constructed based on order statistics. In Section 3 we propose a test statistic based on a linear combination of quantiles vector. Tests based on binomial distribution are discussed in Section 4. In Section 5, we investigate the validity of the proposed tests by calculating the empirical significance levels and comparing them with the nominated levels. We then perform a Monte Carlo simulation study to access the empirical power of the proposed tests so that we can compare them with the power of some known tests described in the literature on this subject. Finally, we explain the proposed tests using a real data example.
2. Tests based on order statistics
Note that conditional on D = d,
Where the order statistics V1 : d, …, Vd : d are a random sample of size d from exponential distribution but right truncated at T; see Arnold et al. [22] and David and Nagaraja [23].
On finding the MLE of θ, it will be useful to transform the Type-I censored sample X1 : n, X2 : n, …, Xd : n to the complete uniformly distributed sample U1 : d, U2 : d, …, Ud : d using the following transformation:
Therefore, testing that the Type-I censored data X1 : n, X2 : n, …, Xd : n follow exponential distribution is equivalent to testing that the complete data U1 : d, U2 : d, …, Ud : d follow a uniform distribution.
If we then let be the deviation of each order statistics Ui : d from its expected value, then several goodness-of-fit test statistics can be considered:
Large values of these statistics will tend to reject the null hypothesis of exponentiality. In Section 5, we use the Monte Carlo simulation to determine the upper tail of the simulated values of the statistics T1, T2, and T3 as critical points for testing exponentiality.
3. Test based on quantiles
Note that the order statistics Ui : d defined by Equation (3) follow beta distribution with parameters (i, d − i + 1). Define
Where is the cumulative distribution function (CDF) and is the incomplete beta function. pi is the CDF of the beta distribution with parameters (i, d − i+1) evaluated at ui : d.
The quantiles vector
can be used as a measure of goodness-of-fit. Extreme values of pi, i.e. values close to zero or one are signs of "badness-of-fit"! It is noteworthy that, although pi's are uniformly distributed over (0, 1), they are not statistically independent.
We propose a test statistic in terms of a linear combination of pi and 1 − pi as follows:
Where , for i = 1, 2, …, d and p(i)'s are the ordered values of pi arranged from smallest to largest. Note that the test statistic TP will be calculated for values of p(i) in the interval (0, 1), i.e. we exclude the cases with p(i) = 0 or p(i) = 1. Note also that whilst ui : d's are ordered in terms of their values, the pi's are not necessarily ordered. Moreover, the test statistic TP, will be large whenever one of pi's are close to zero or one. Hence, large values of TP provide evidence that the null hypothesis H0 of exponentiality should be rejected.
4. Test based on binomial distribution
Let the discrete random variable D denote the number of observed failures before the termination time T. Then, under the validity of the null hypothesis, under the exponentiality of the model, D follows a binomial distribution with parameters (n, p), where p = F(T) = 1 − exp(−T/θ).
Hence, testing the null hypothesis of exponentiality (1), is equivalent to performing a binomial test say
Note that if we assume that the null hypothesis is true, i.e. under the validity of the exponential model, we expect to observe nF(T) failures. The usual binomial test may then be used to find the associated p-value.
For large values of sample size n, the binomial distribution is well approximated by the Gaussian model in which a z-test is performed to the test statistic Z, using continuity correction given by
However, using the Monte Carlo simulation we found that the test statistic TB does not maintain the nominated significance level for small sample sizes even for sample sizes n ≤ 40, so we did not include the power of TB in our simulation study.
In the following section, we perform a Monte Carlo simulation to assess the power of the proposed tests for various alternative models, and for a combination of various sample sizes n and censoring proportion 1 − F(T) = exp(−T/θ).
5. Simulation study
In this section, the performance of our proposed tests will be evaluated by studying the empirical significance level and the empirical power through extensive Monte Carlo simulations. We used the R pseudo-random generator with 50,000 iterations.
First, we investigate the null distribution of the test statistics presented in the previous section using the Monte Carlo estimate of the coefficient of skewness () and the coefficient of kurtosis (β2) when the underlying distribution is standard exponential. The results are shown in Table 1. The coefficient of skewness () and the coefficient of kurtosis (β2) are defined as:
and
From Table 1, it is clear that the null distribution of all the test statistics are far from normality, as and β2 are not close to 0 and 3 respectively, which are the coefficients of skewness and kurtosis of normal distribution. This is also evident from Figure 1, which depicts the simulated pdf curves for the test statistics under the validity of the null hypothesis. Indeed, it has been observed that all the test statistics are skewed to the right. Hence, we use empirical critical values to perform goodness-of-fit tests.
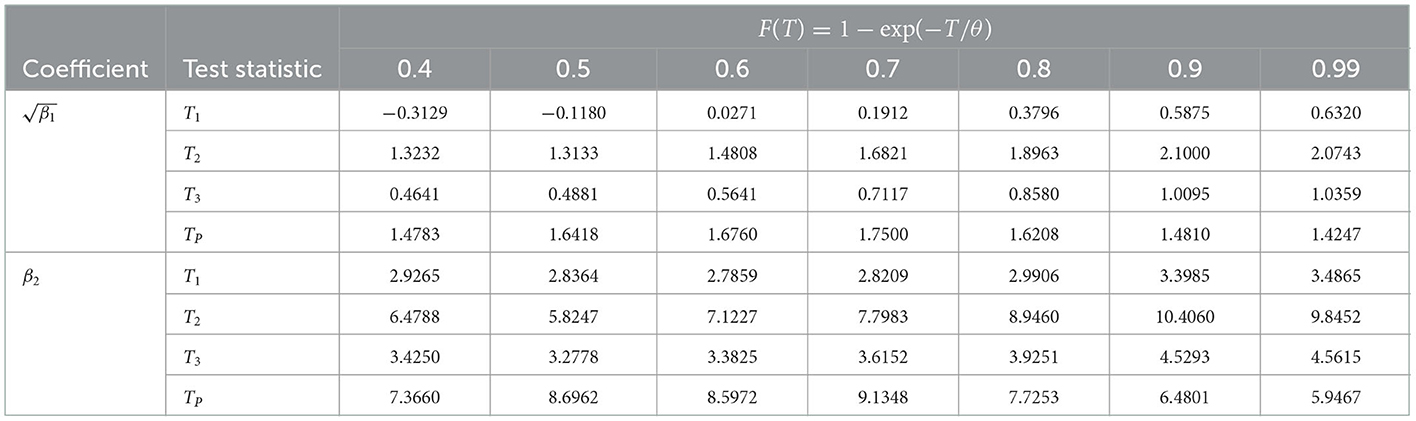
Table 1. Monte Carlo estimate of the coefficient of skewness () and coefficient of kurtosis (β2) for the test statistics T1, T2, T3, and TB under the null distribution of exponentiality.
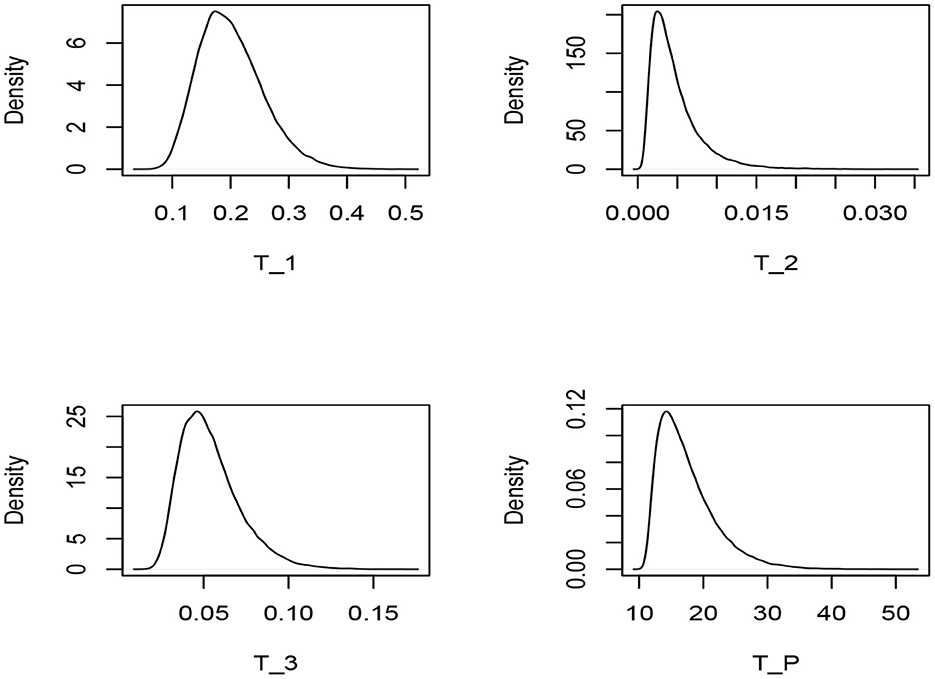
Figure 1. Monte Carlo simulated pdf curves for the test statistics T1, T2, T3, and TP under the assumption of exponential model.
We compare the empirical power of the proposed tests to those of the EDF-based test statistics proposed by Pettitt and Stephens [24] and Stephens [8].
Stephens [8] studied the modification of the Kolmogorov-Smirnov statistic for the Type-I censored data from an exponential model in the form of:
Where and with being the MLE of the scale parameter θ given by Equation (2).
Pettitt and Stephens [24] also studied the Cramér-von Mises statistic and the Anderson-Darling statistic under Type-I censoring in the form of:
and
We considered seven alternative models in three groups , and based on their behavior of hazard functions as follows:
: Group I alternative (Monotonic decreasing hazard rates):
1. Gamma distribution with shape parameter α = 0.5 and scale parameter β = 1.0, denoted by Gamma (0.5, 1.0).
2. Weibull distribution with shape parameter a = 0.5 and scale parameter b = 1.0, denoted by Weibull (0.5, 1.0).
3. Lomax distribution with shape parameter d = 4.0 and scale parameter c = 1.0, denoted by Lomax (1.0, 4.0).
: Group II alternative (Monotonic increasing hazard rates):
1. Gamma distribution with shape parameter α = 2.0 and scale parameter β = 1.0, denoted by Gamma (2.0, 1.0).
2. Weibull distribution with shape parameter a = 2.0 and scale parameter b = 1.0, denoted by Weibull (2.0, 1.0).
: Group III alternative (Non-monotonic hazard rates):
1. Log-normal distribution with location parameter μ = 0 and scale parameter σ = 0.5, denoted by Log-normal (0, 0.5).
2. Log-normal distribution with location parameter μ = 0 and scale parameter σ = 1.0, denoted by Log-normal (0, 1.0).
The following forms of probability density functions were used here.
The gamma distribution with density function
Where α > 0 is the shape parameter and β > 0 is the scale parameter.
The Weibull distribution with density function
Where a > 0 and b > 0 are the shape and scale parameters, respectively.
The log-normal distribution with density function
Where −∞ < μ < ∞ is the mean and σ > 0 is the standard deviation of the transformed normal distribution.
Finally, the Lomax distribution (also known as Pareto Type II), with probability density function
With the scale parameter c > 0 and the shape parameter d > 0.
The plot of CDFs of the alternative distributions in groups , and are depicted in Figure 2.
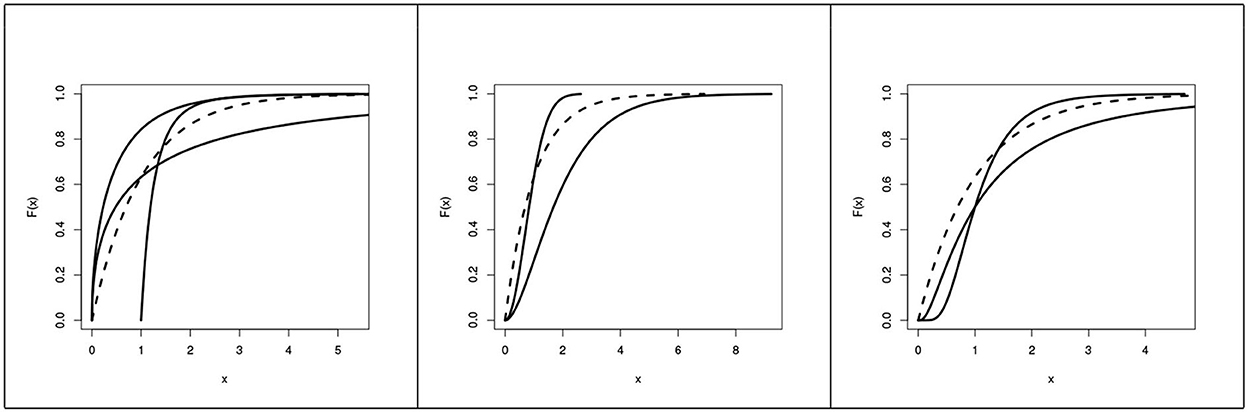
Figure 2. CDF of the alternative groups , , and (left to right) and the CDF of a standard exponential distribution (dashed).
For a comprehensive discussion of these distributions, one may refer to Johnson et al. [25, 26] and Kleiber and Kotz [27].
Verifying the empirical significance level is of great importance for the validity of any goodness-of-fit test statistic. To assess the validity of our tests we investigate the empirical significance level by generating 100, 000 Type-I censored random data from the exponential distribution with a rate equal to one (standard exponential). We considered a combination of various sample sizes n and proportions (probability) of failures F(T) = 1 − exp(−T). The empirical significance levels at nominated level α = 0.10 are tabulated in Table 2. The values in this table confirm the validity of our proposed tests in terms of preserving the nominated significance level.
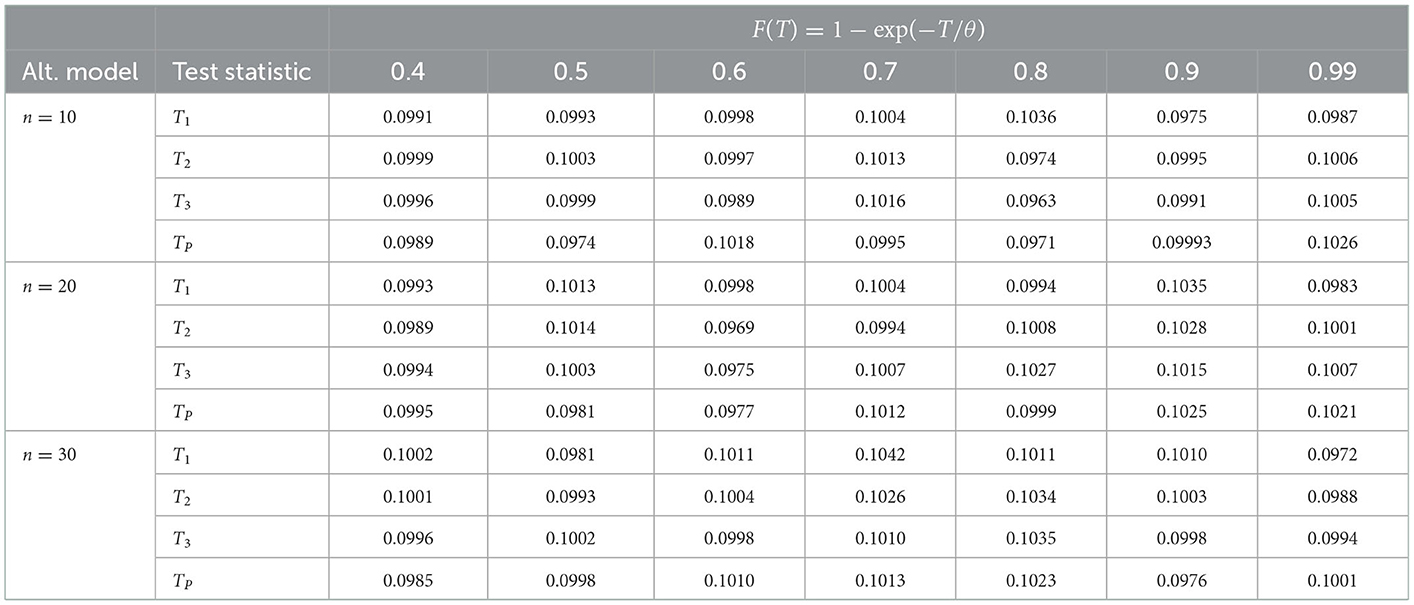
Table 2. Empirical significance level for the test statistics T1, T2, T3, and TP when n = 10, 20, 30 with α = 0.10 and 105 iterations.
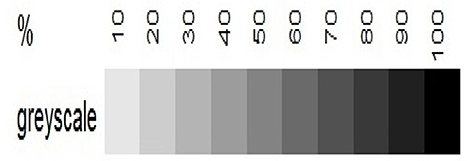
The power of the proposed tests together with the powers associated with the classical EDF-based tests are recorded in Tables 3–5 for sample sizes n = 10, n = 20, and n = 30, respectively for the three alternative groups , , and . Figures 4–6 depict the corresponding heatmaps to provide better visualization of the results. The greyscale is given in Figure 7.
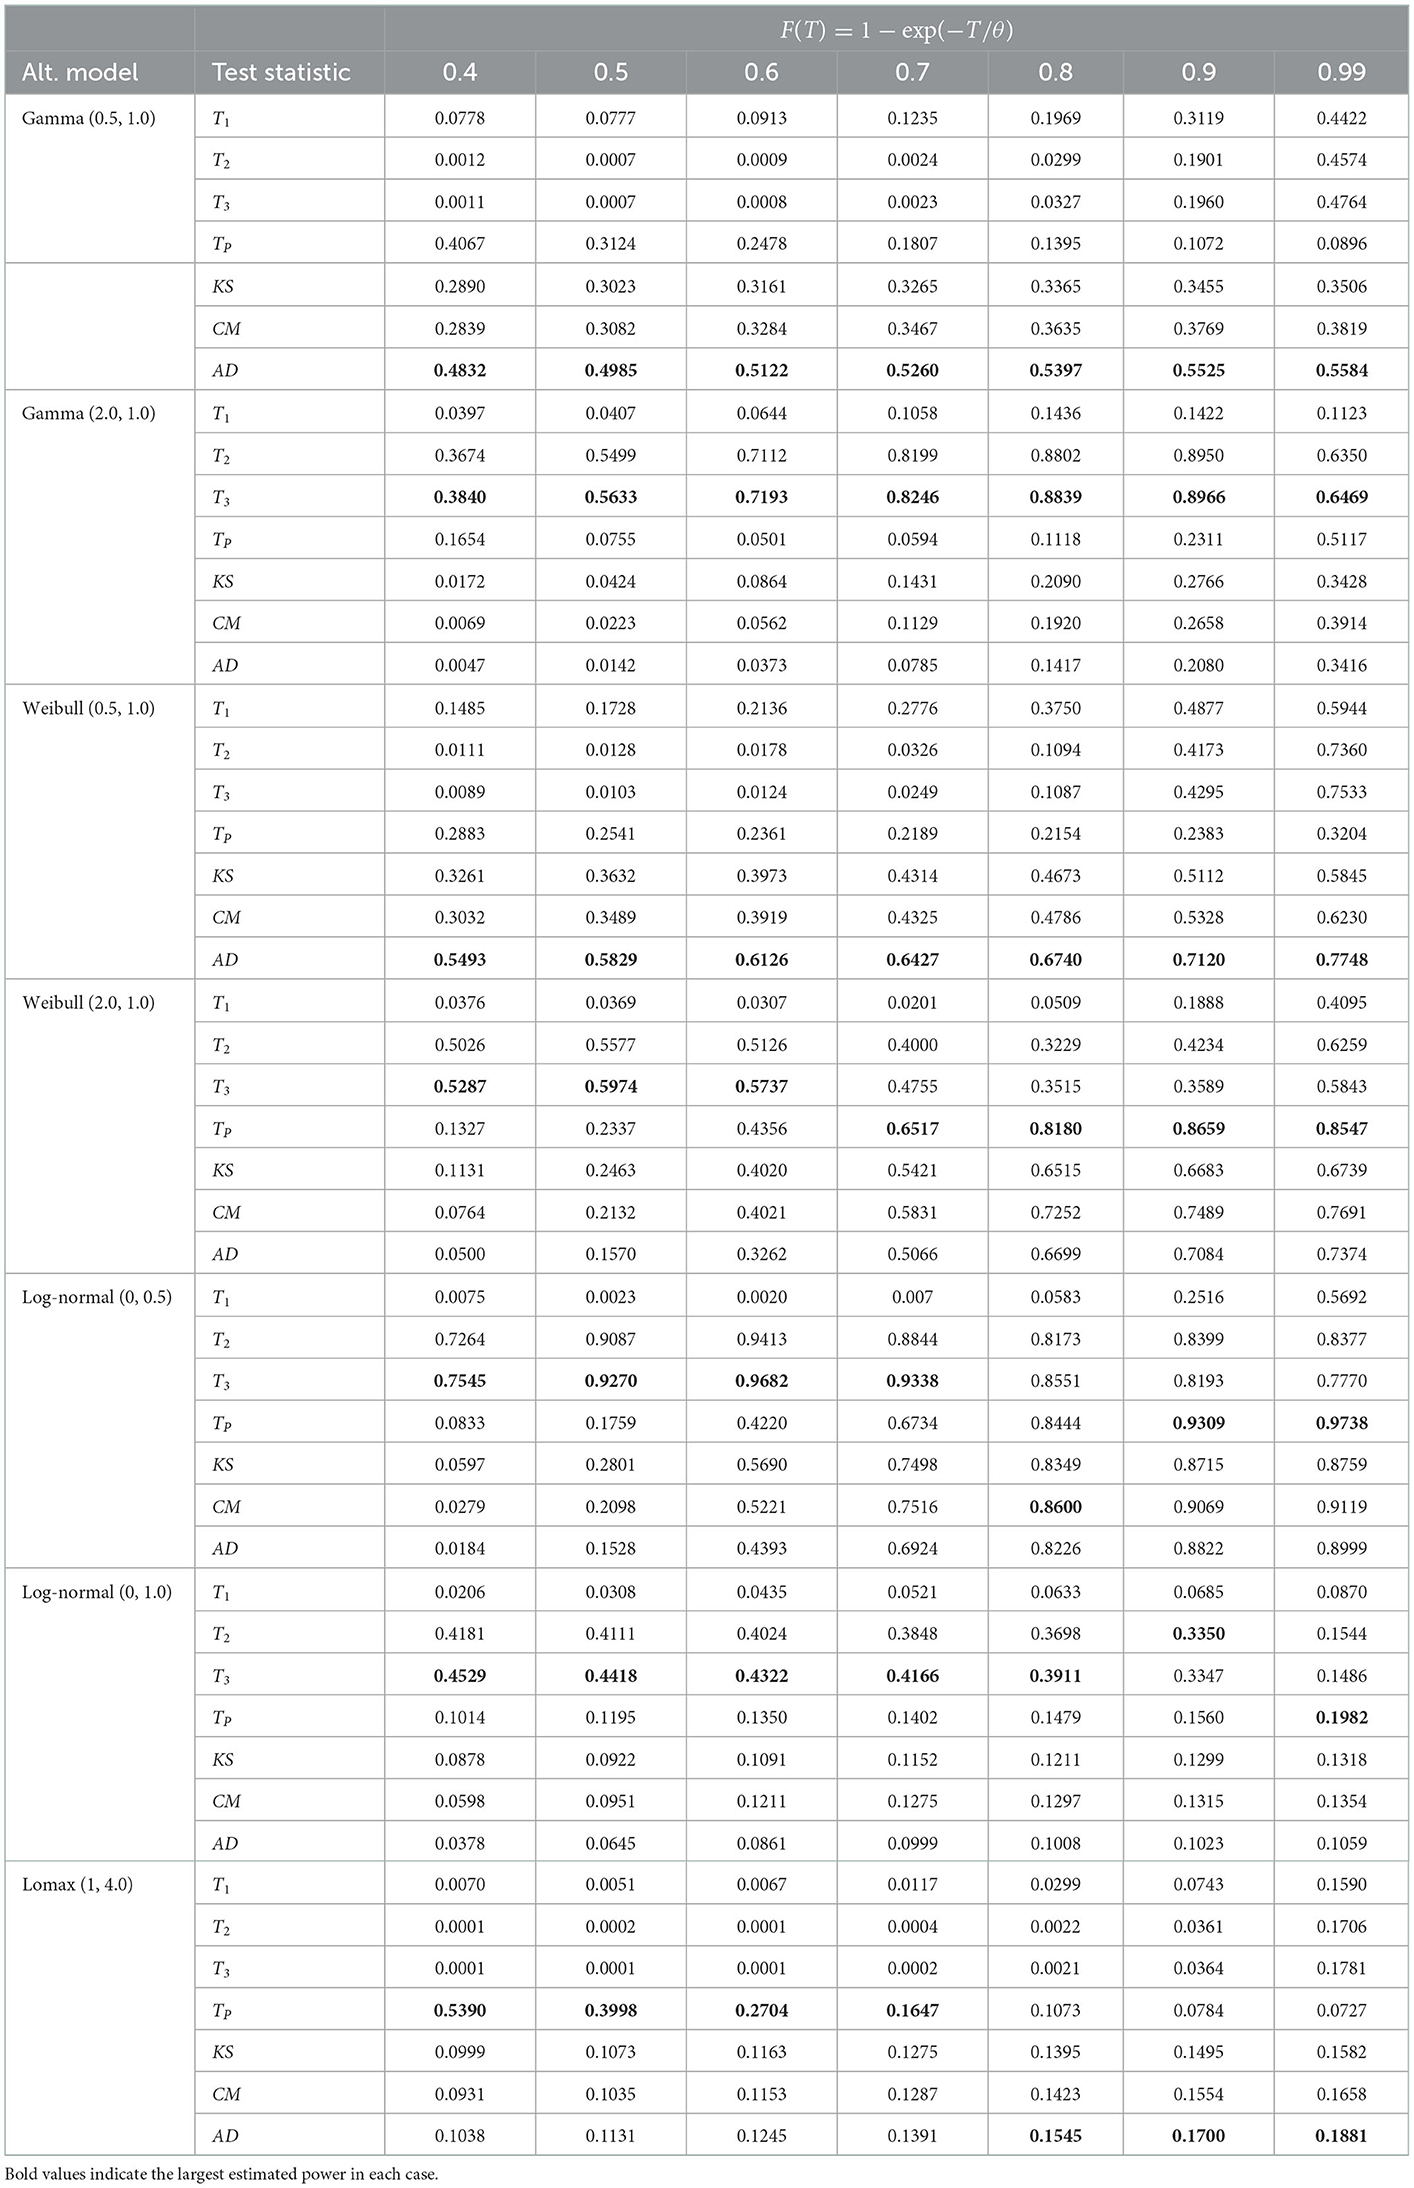
Table 3. Empirical power for various alternative models, n = 10, α = 0.10 and 105 iterations.
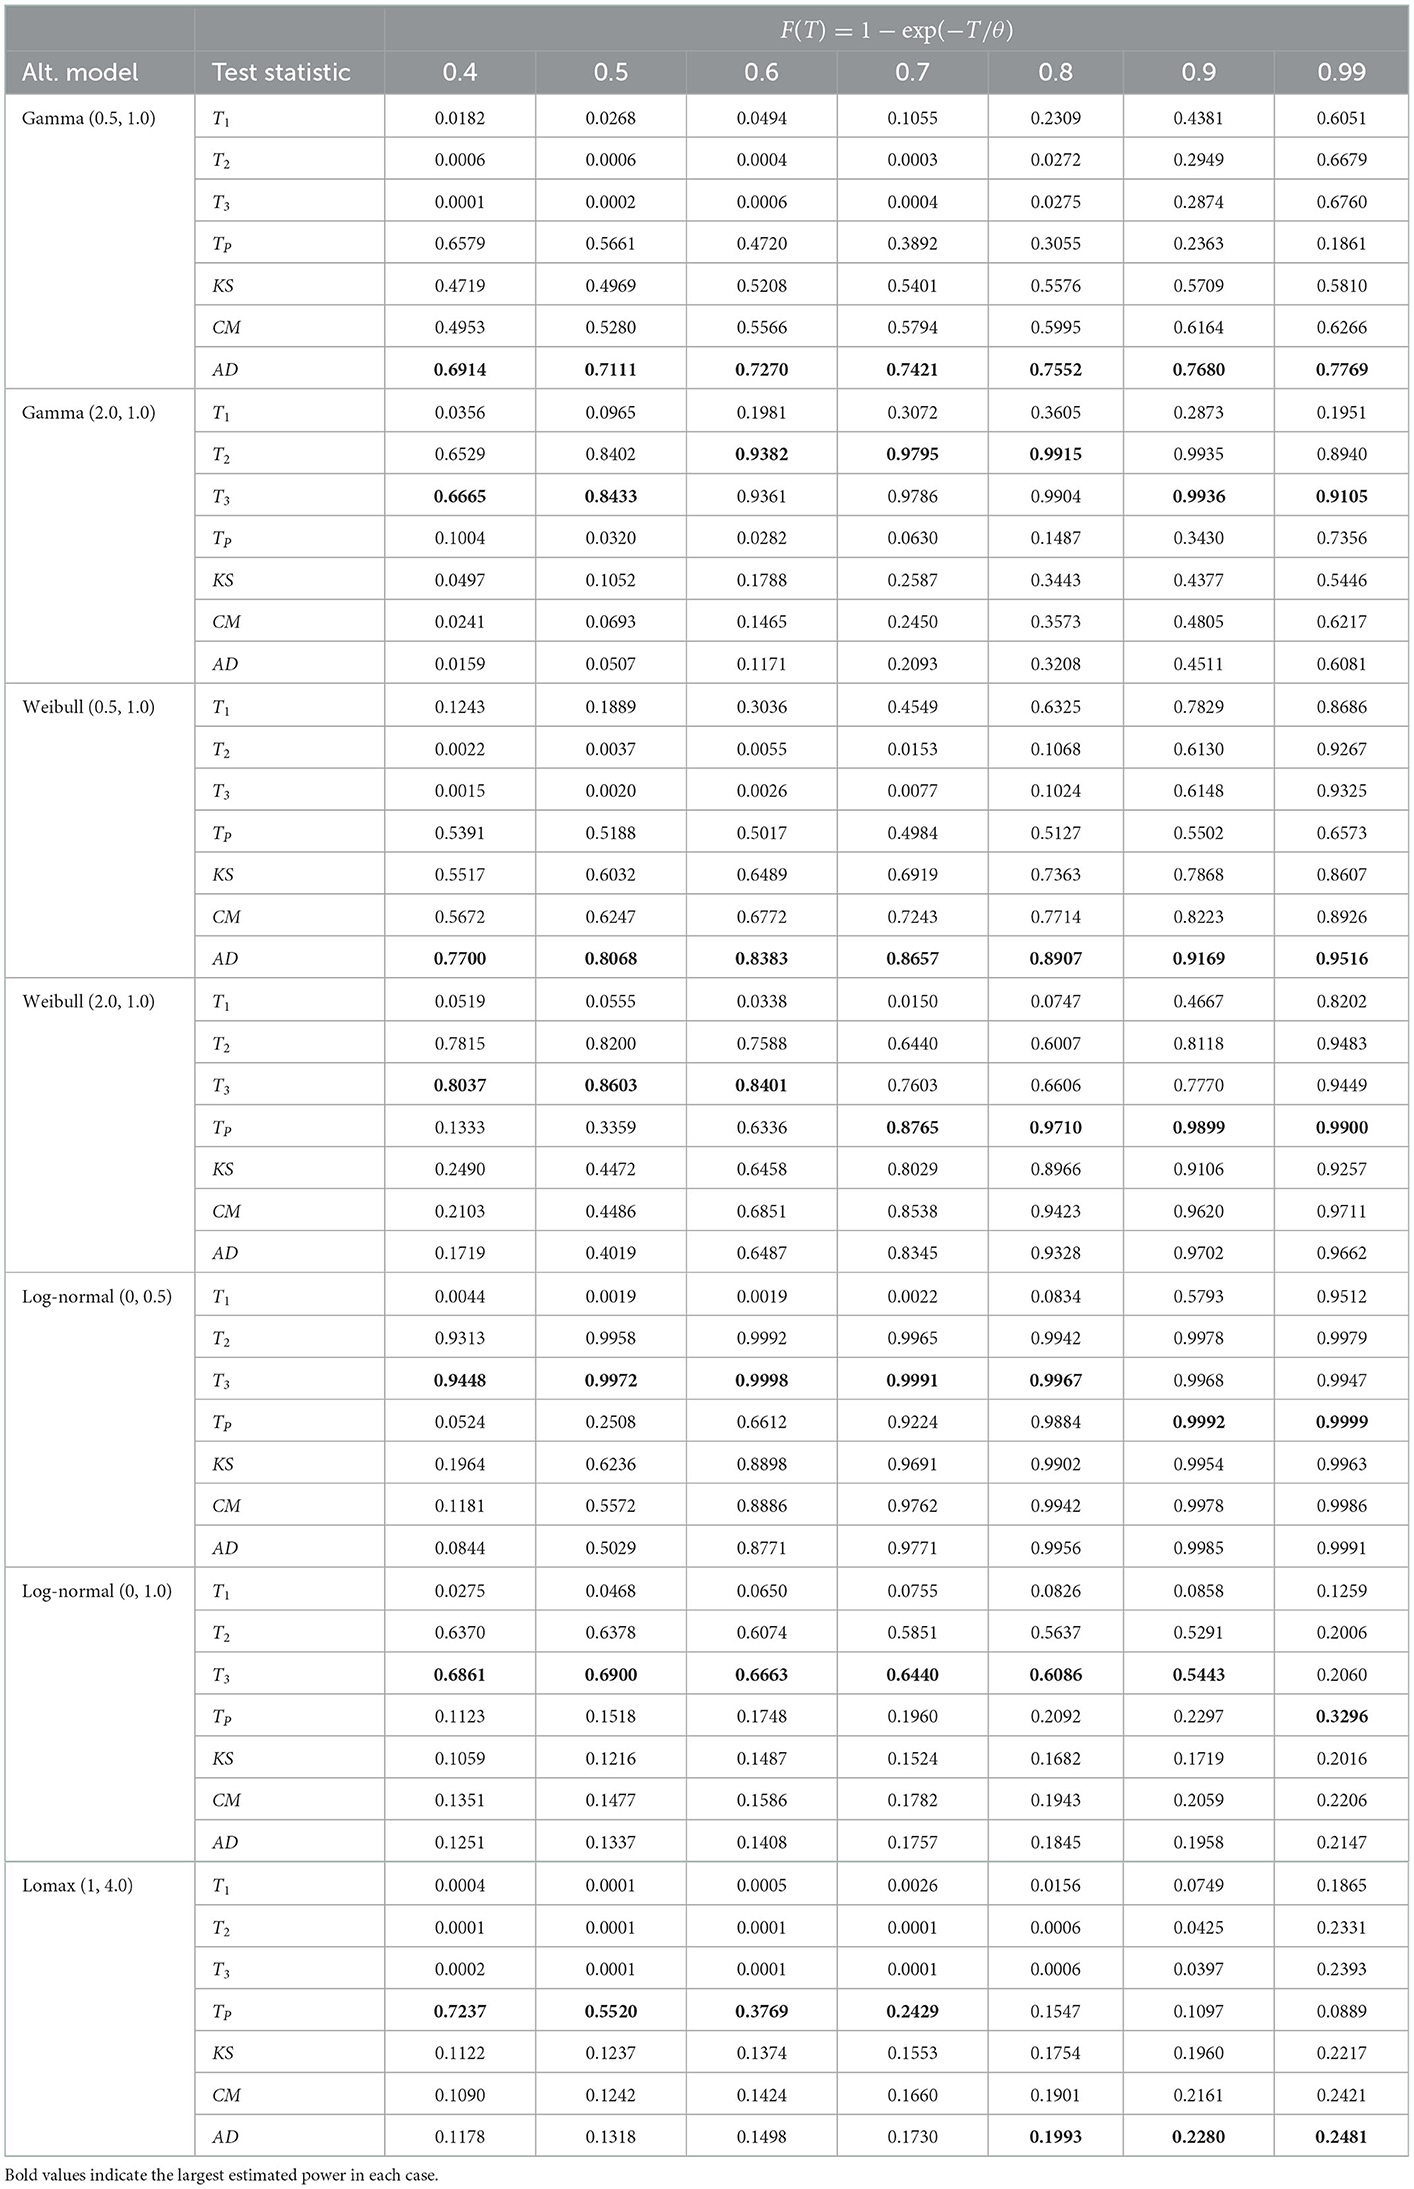
Table 4. Empirical power for various alternative models, n = 20, α = 0.10 and 105 iterations.
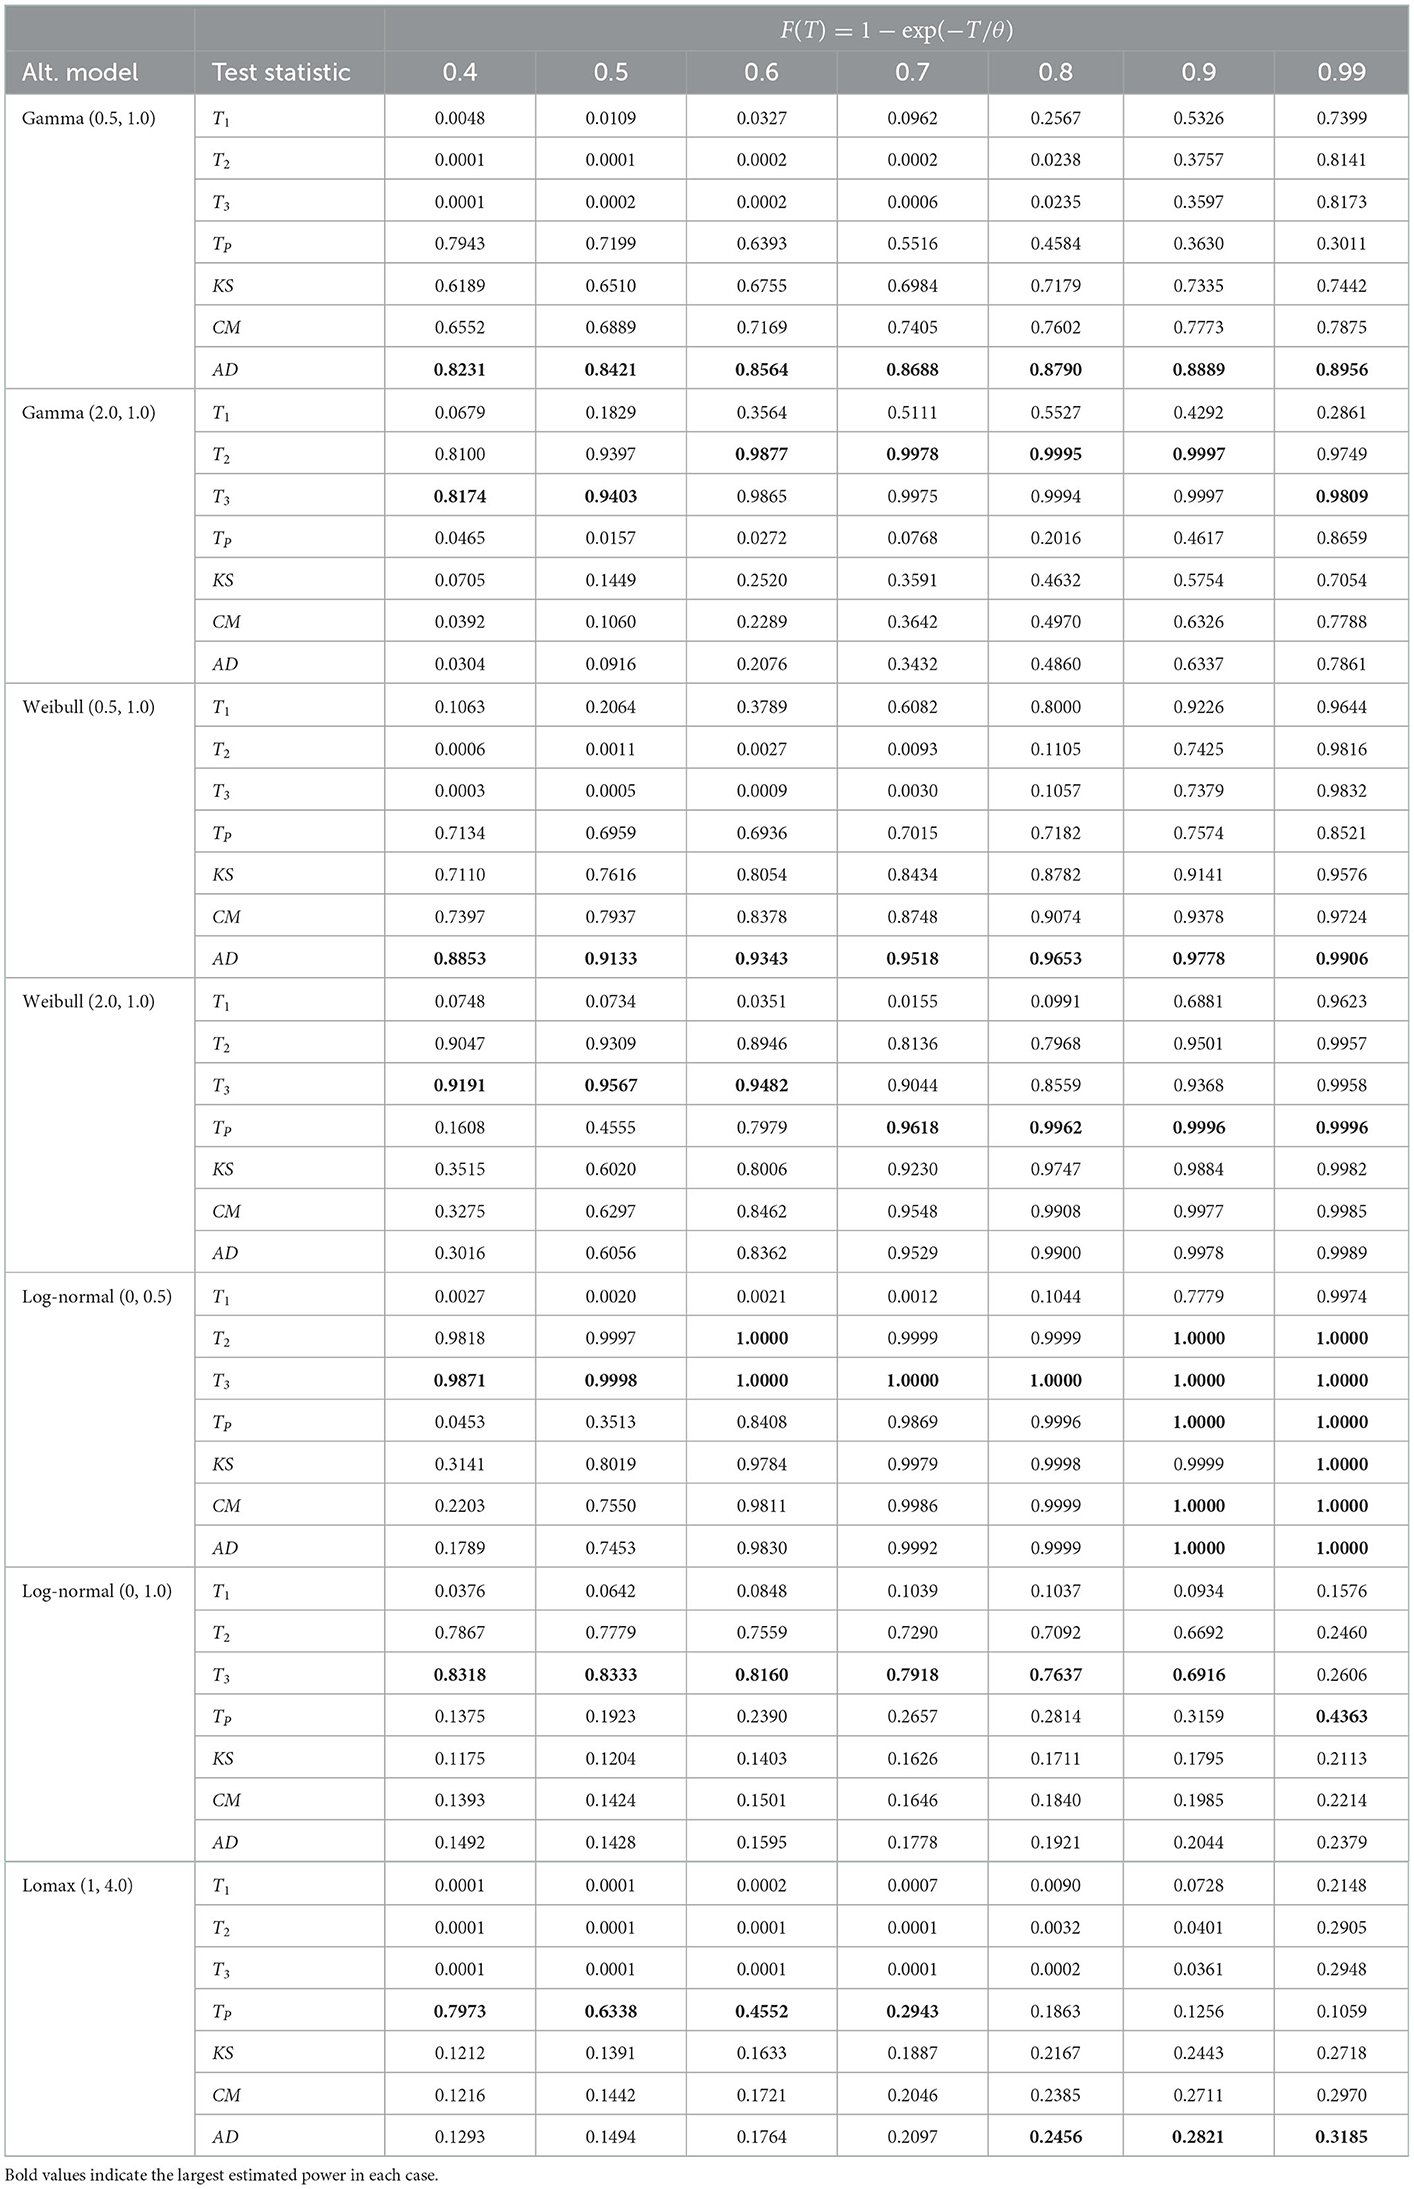
Table 5. Empirical power for various alternative models, n = 30, α = 0.10 and 105 iterations.
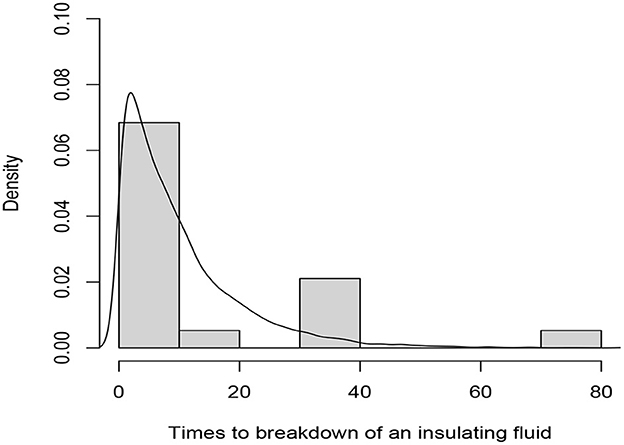
Figure 3. Histogram of the complete data and fitted exponential pdf curve of the data in Table 6.
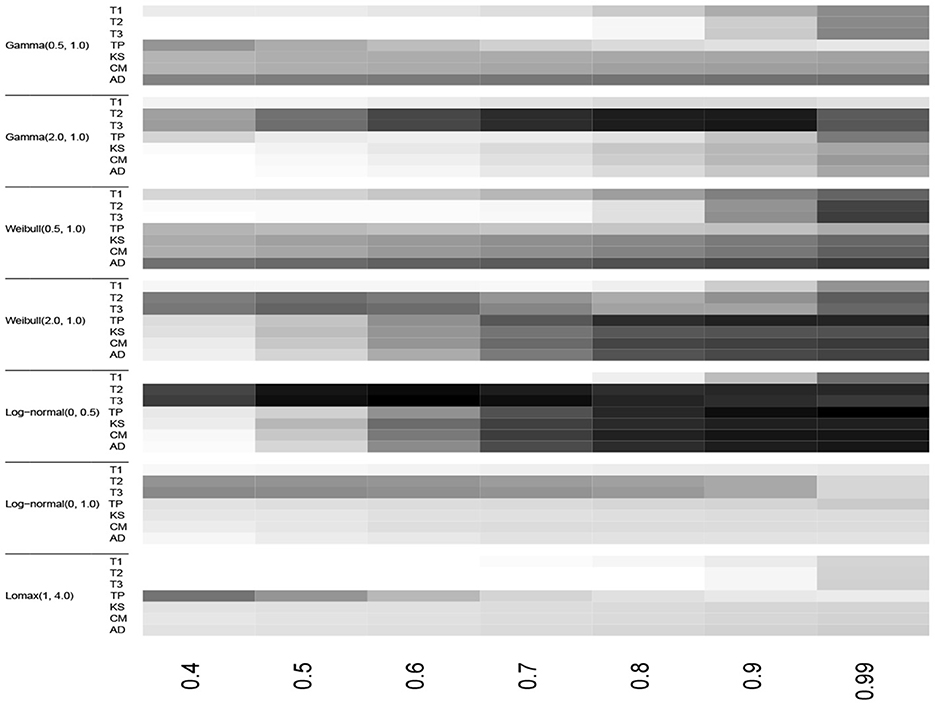
Figure 4. Heatmap of the empirical powers listed in Table 3 for n = 10, α = 0.10 and 105 iterations.

Figure 5. Heatmap of the empirical powers listed in Table 4 for n = 20, α = 0.10 and 105 iterations.
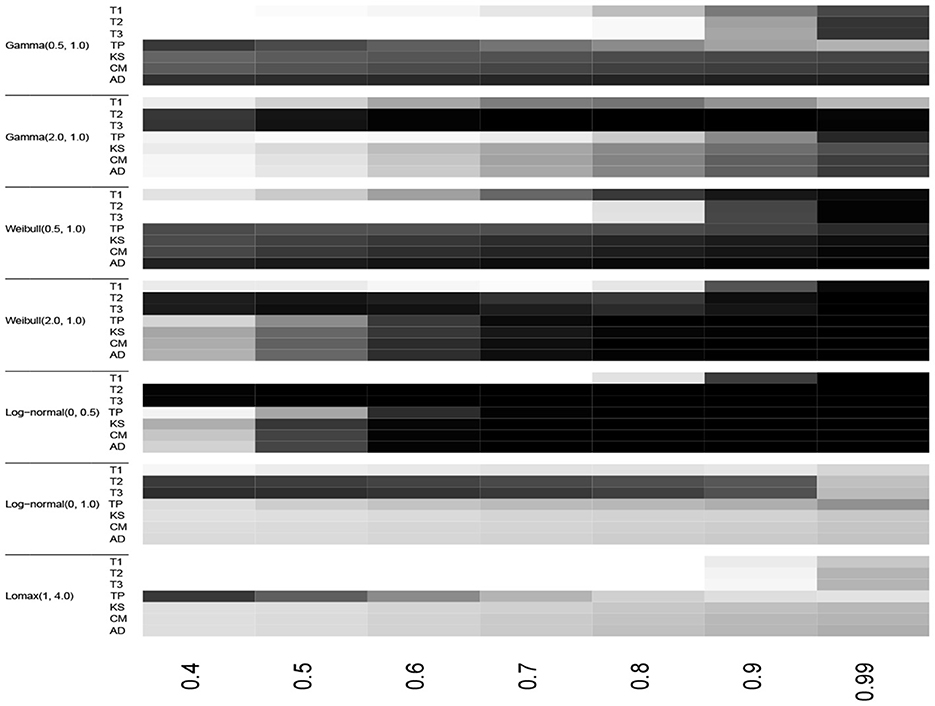
Figure 6. Heatmap of the empirical powers listed in Table 5 for n = 30, α = 0.10 and 105 iterations.
The test statistics T3 and TP outperformed the classical EDF-based statistics for groups and , respectively for the monotonic increase and non-monotonic hazard function alternatives for all sample sizes considered here. The test statistic T2 also had the best power in some cases in groups and . However, in the group alternative for monotonic decreasing hazard functions, the EDF-based test statistic AD performed better than the other tests. In Table 5, for log-normal (0, 0.5) alternative and n = 30, the empirical powers are equal to 1.00 for most tests when the censoring proportion F(T) is at least 60%. This shows the consistency of the test statistics considered here. Moreover, as one would expect the empirical power values of all the tests considered here increase when the sample size n increases and/or when the censoring proportion F(T) increases.
In summary, for the monotonically increasing and non-monotonic hazard rate alternatives, we recommend using the test statistics T3 and TP. For the Lomax model alternative, we recommend TP for a small amount of censoring proportion and the AD statistic for large values of F(T).
6. Numerical example
In this section, we study a numerical example to illustrate our proposed procedure and test statistics. The data concerning the times to breakdown of an insulating fluid tested at 34 kilovolts for n = 19 insulating fluids (see Nelson [28], Table 1.1, page 105).
Suppose we decided to terminate the experiment at time T = 15 so any data larger than 15 is censored. The complete and the Type-I censored data are summarized in Table 6.
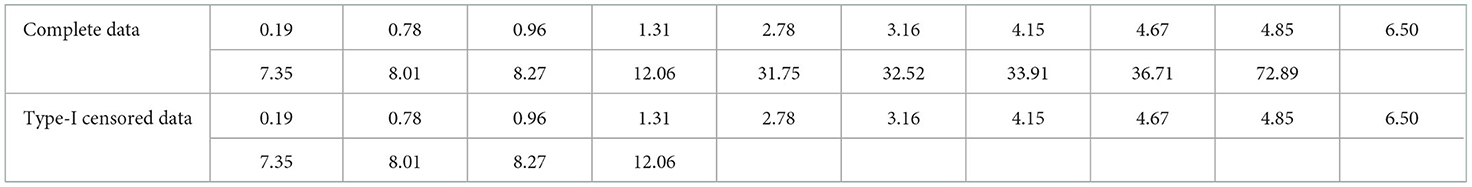
Table 6. Insulating fluid tested at 34 kilovolts data.
The value of d is found to be d = 14 and using Equation (2), the MLE of θ is . Hence, F(T) = F(15) = 1 − exp(−15/10) = 0.78.
The values of the test statistics and the associated p-values are given in Table 7. The p-values are sufficiently large for all test statistics and thereby the null hypothesis of exponentiality is not significant and the exponential model fits the data. The histogram of the complete data and the fitted exponential pdf curve with scale parameter θ = 10 are depicted in Figure 3.
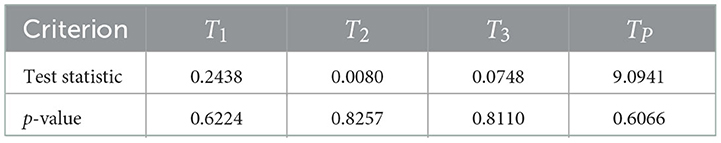
Table 7. Test values of test statistics and their corresponding p-values for the data in Table 6 when testing for the exponential model.
7. Concluding remarks
In this paper, we proposed some new goodness-of-fit tests for exponentiality when the available data are Type-I censored. We employed two methods for this purpose: the first was based on the distance between the observed order statistics and its theoretical mean under the assumption of exponentiality.
The second method was based on the values of quantiles of uniform order statistics, which are known to follow the beta distribution, as is the fact that under the assumption of the null hypothesis, most of the quantiles pi's should be close to 0.5. We proposed test statistics based on the weighted mean of the logarithm of pi.
Among the four test statistics presented in this article, the test statistic T3, based on order statistics, exhibits the most powerful test followed by the test statistic T4, which is based on quantiles.
The large sample properties of the proposed estimators will be examined in a separate future study through Monte Carlo simulation.
Data availability statement
The original contributions presented in the study are included in the article/supplementary material, further inquiries can be directed to the corresponding author.
Author contributions
Sections 1–4 were prepared by RP. Sections 5, 6 were prepared by OA-H (60%) and RP (40%). All authors contributed to the article and approved the submitted version.
Acknowledgments
We are grateful to the associate editor and reviewers for providing useful comments and suggestions on an earlier draft, which led to this improved version of the article. We thank Open Access funding provided by the Qatar National Library.
Conflict of interest
The authors declare that the research was conducted in the absence of any commercial or financial relationships that could be construed as a potential conflict of interest.
Publisher's note
All claims expressed in this article are solely those of the authors and do not necessarily represent those of their affiliated organizations, or those of the publisher, the editors and the reviewers. Any product that may be evaluated in this article, or claim that may be made by its manufacturer, is not guaranteed or endorsed by the publisher.
References
1. Balakrishnan, N, Cohen AC. Order Statistics and Inference: Estimation Methods. Boston, MA: Academic Press (1991).
2. Cohen AC. Truncated and Censored Samples: Theory and Methods. New York, NY: Marcel Dekker (1991).
3. Balakrishnan N, Basu AP. (Eds.). The Exponential Distributions: Theory, Methods, and Applications. Newark, NJ: Taylor and Francis (1995).
4. Pearson K. X. On the criterion that a given system of deviations from the probable in the case of a correlated system of variables is such that it can be reasonably supposed to have arisen from random sampling. Philos Mag Ser. (1900) 50:157–75. doi: 10.1080/14786440009463897
5. D'Agostino RB, Stephens MA. (Eds.) Goodness-of-Fit Techniques. New York, NY: Marcel Dekker (1986).
6. Huber-Carol C, Balakrishnan N, Nikulin MS, Mesbah M. (Eds.). Goodness-of-Fit Tests and Model Validity Boston, MA: Birkhäuser, (2002).
7. Nikulin MS, Chimitova EV. Chi-Squared Goodness-Of-Fit Tests for Censored Data. Hoboken, NJ: John Wiley & Sons (2017).
8. Stephens MA. Tests based on EDF statistics, In: Goodness-of-Fit Goodness-of-Fit Techniques D'Agostino RB Stephens MA, editors. New York, NY: Marcel Dekker (1986).
9. Pakyari R, Balakrishnan N. Testing exponentiality based on Type-I censored data. J Stat Comput Simulat. 83:2369–378. doi: 10.1080/00949655.2012.691974
10. Pakyari R, Resalati Nia K. Testing goodness-of-fit for some lifetime distributions with conventional Type-I censoring. Commun Stat Simulat Comput. (2017) 46:2998–3009. doi: 10.1080/03610918.2015.1069347
11. Balakrishnan N, Ng HKT, Kannan N. Goodness-of-fit tests based on spacings for progressively Type-II censored data from a general location-scale distribution. IEEE Trans. Reliabil. (2004) 53:349–56. doi: 10.1109/TR.2004.833317
12. Balakrishnan N, Rad AH, Arghami NR. Testing exponentiality based on Kullback-Leibler information with progressively Type-II censored data. IEEE Trans Reliabil. (2007) 56:301–7. doi: 10.1109/TR.2007.895308
13. Doring M, Cramer E. On the power of goodness-of-fit tests for the exponential distribution under progressive Type-II censoring. J Stat Comput Simulat. (2019) 89:2997–3034. doi: 10.1080/00949655.2019.1648468
14. Lim J, Park S. Censored kullback-leibler information and goodness-of-fit test with type II censored data. IEEE Trans Reliabil. (2007) 75:633–42. doi: 10.1080/02664760701592000
15. Lin CT, Huang YL, Balakrishnan N. A new method for goodness-of-fit testing based on Type-II right censored samples. J Appl Stat. (2008) 34:1051–64. doi: 10.1109/TR.2008.2005860
16. Noughabi HA. Testing exponentiality based on Kullback–Leibler information for progressively Type II censored data. Commun Stat Simulat Comput. (2017) 46:7624-638. doi: 10.1080/03610918.2016.1248569
17. Pakyari R, Balakrishnan N. A general purpose approximate goodness-of-fit test for progressively Type-II censored data. (2012) IEEE Trans Reliabil. 61:238-242. doi: 10.1109/TR.2012.2182811
18. Pakyari R. Goodness-of-fit testing based on Gini Index of spacings for progressively Type-II censored data. Commun Stat Simulat Comput. (2021) doi: 10.1080/03610918.2021.1930052
19. Pakyari R, Baklizi A. On Goodness-of-fit testing for burr Type X distribution under progressively Type-II censoring. Comput Stat. (2022) 37:2249–65. doi: 10.1007/s00180-022-01197-5
20. Park S, Pakyari R. Cumulative residual Kullbak-Leibler information with the progressively Type-II censored data. Stat Probabil Lett. (2015) 106:287–94. doi: 10.1016/j.spl.2015.07.029
21. Qi W, Allen AS, Li YJ. Family-based association tests for rare variants with censored traits. PLoS ONE. (2019) 14:1–17. doi: 10.1371/journal.pone.0210870
22. Arnold BC, Balakrishnan N, Nagaraja HN. A First Course in Order statistics. New York, NY: John Wiley & Sons (1992).
24. Pettitt AN, Stephens MA. Modified Cramér-von Mises statistics for censored data. Biometrika (1976) 63:291–8.
25. Johnson NL, Kotz S, Balakrishnan N. Continuous Univariate Distributions-Vol. 1. 2nd ed. New York, NY: John Wiley & Sons (1994).
26. Johnson NL, Kotz S, Balakrishnan N. Continuous Univariate Distributions-Vol. 2. 2nd ed. New York, NY: John Wiley & Sons (1995).
27. Kleiber C, Kotz S. Statistical Size Distributions in Economics and Actuarial Sciences. Hoboken, NJ: John Wiley & Sons (2003).
Keywords: beta distribution, binomial distribution, exponential distribution, goodness-of-fit testing, maximum likelihood estimator, order statistics, quantiles, Type-I censoring
Citation: Pakyari R and Al-Hamed OM (2023) On testing exponentiality under Type-I censoring. Front. Appl. Math. Stat. 9:1113477. doi: 10.3389/fams.2023.1113477
Received: 01 December 2022; Accepted: 06 January 2023;
Published: 14 February 2023.
Edited by:
Paul Horn, Cincinnati Children's Hospital Medical Center, United StatesReviewed by:
Yiying Zhang, Southern University of Science and Technology, ChinaFuxia Cheng, Illinois State University, United States
Copyright © 2023 Pakyari and Al-Hamed. This is an open-access article distributed under the terms of the Creative Commons Attribution License (CC BY). The use, distribution or reproduction in other forums is permitted, provided the original author(s) and the copyright owner(s) are credited and that the original publication in this journal is cited, in accordance with accepted academic practice. No use, distribution or reproduction is permitted which does not comply with these terms.
*Correspondence: Reza Pakyari,  cnBha3lhcmlAcXUuZWR1LnFh