
94% of researchers rate our articles as excellent or good
Learn more about the work of our research integrity team to safeguard the quality of each article we publish.
Find out more
ORIGINAL RESEARCH article
Front. Allergy, 29 January 2025
Sec. Asthma
Volume 6 - 2025 | https://doi.org/10.3389/falgy.2025.1506608
 Xiaoying Zhong1,2,3,†
 Jingjing Song1,2,†
 Changyu Lei4,†
 Xiaoming Wang1,2Yufei Wang1,2Jiahui Yu1,2Wei Dai1,2Xinyi Xu1,2
 Junwen Fan1,2Xiaodong Xia1*
 Weixi Zhang1,2*
Introduction: Asthma has an annual increasing morbidity rate and imposes a heavy social burden on public healthcare systems. The aim of this study was to use machine learning to identify asthma-specific genes for the prediction and diagnosis of asthma.
Methods: Differentially expressed genes (DEGs) related to asthma were identified by examining public sequencing data from the Gene Expression Omnibus, coupled with the support vector machine recursive feature elimination and least absolute shrinkage and selection operator regression model. Gene Ontology (GO), Kyoto Encyclopedia of Genes and Genomes (KEGG), Gene set enrichment analysis and correlation analyses between gene and immune cell levels were performed. An ovalbumin-induced asthma mouse model was established, and eukaryotic reference transcriptome high-throughput sequencing was performed to identify genes expressed in mouse lung tissues.
Results: Thirteen specific asthma genes were obtained from our dataset analysis (LOC100132287, CEACAM5, PRR4, CPA3, POSTN, LYPD2, TCN1, SCGB3A1, NOS2, CLCA1, TPSAB1, CST1, and C7orf26). The GO analysis demonstrated that DEGs linked to asthma were primarily related to positive regulation of guanylate cyclase activity, gpi anchor binding, peptidase activity and arginine binding. The renin-angiotensin system, arginine biosynthesis and arginine and proline metabolism were the key KEGG pathways of DEGs. Additionally, the genes CEACAM5, PRR4, CPA3, POSTN, CLCA1, and CST1 expression levels were positively associated with plasma cells and resting mast cells. The mouse model revealed elevated nos2 and clca1 expression in the asthmatic mouse group compared with that in normal mice, which was consistent with the findings in asthmatic patients.
Discussion: This study identified new marker genes for the prediction and diagnosis of asthma, which can be further validated and applied clinically
Asthma is a chronic respiratory illness marked by inflammation and remodeling of the airways that is triggered by complex genetic regulation and environmental exposure to allergens (1). It is caused by swelling and increased mucus in the airways (inflammation) and narrowing of the airways due to muscle spasm (bronchospasm) leading to bronchial overreaction and airway obstruction (2). Asthma affects 5%–10% of the population in many developed countries. In China, approximately 4.2% of adults over the age of 20 years and older have asthma. There are more than 300 million people with asthma worldwide, and its prevalence is increasing every year (3). Asthma usually occurs in preschool years and causes reducing quality of life and early death, which leads to a large public health burden.
Many patients with asthma use self-care and pharmacological therapies to control their symptoms. Recently, monoclonal antibodies have been applied to benefit patients (4). However, their efficacy differs owing to the diverse forms of asthma, and some individuals do not respond to current asthma treatments (5). In recognition of inadequacies in the current understanding of asthma mechanisms, our research highlights the need of having a thorough grasp of diagnosis and immunological variability in asthma.
Asthma involves multiple inflammatory responses. The initial barrier to resistance against microorganisms, gases, and allergens is the bronchial epithelial cells, which is also the centre of the inflammatory response (6). First, allergens can be eliminated by airway epithelial cells via mucus (7). Second, by using pattern recognition receptors, airway epithelial cells may identify chemicals associated with pathogens or hazards, and release cytokines and chemokines (such as IL25, TSLP, CCL5, and CCL22), activate dendritic cells, connect innate and adaptive immunity, and trigger local immune responses (8, 9). Third, they function as antigen-presenting cells, which help trigger type II immunological responses by causing naive T cells to differentiate into CD4+ T cells (10). Therefore, we chose samples of bronchial epithelial cells from public datasets for sequencing and analysis in this study.
Machine learning is a collection of computational intelligence techniques that allows a computer to learn a task autonomously, improving its experience without being explicitly programmed. This method can be used to analyze large amounts of data, establish complex and nonlinear relationships, and identify patterns and relationships between data and interesting outcomes. Zhang et al. identified the immune infiltration-related diagnostic genes SLC27A3 and STAU1 using machine learning in patients with Chronic Obstructive Pulmonary Disease. The area under the receiver operating characteristic (ROC) curve (AUC) was up to 0.900 and 0.971, which demonstrated their high diagnostic value (11). Potential biomarkers of idiopathic pulmonary frailty were previously identified using the least absolute shrinkage and selection operator (LASSO) regression model, random forest algorithms, and support vector machine recursive feature elimination (SVM-RFE). These methods were very helpful in enabling an early diagnosis and enhancing prognosis (12). Research to date shows that machine learning helps uncover the potential causal mechanisms of asthma with good predictive efficacy and can generate new hypotheses (13, 14).
Despite its significant impact on public health, the diagnosis of asthma mostly depends on symptoms and accompanying testing, which does not allow for prediction and treatment. Our study explored differentially expressed genes (DEGs) in asthma by analyzing the bronchial epithelial cell transcriptome of the GSE63142 and GSE158752 databases from the Gene Expression Omnibus (GEO) public sequencing data using machine learning approaches. We evaluated the diagnostic utility of these genes using the AUC after doing functional, pathway, and gene set enrichment analyses of the DEGs. We hope to contribute to the genetic diagnosis and prediction of asthma in the future.
We obtained the GSE63142 and GSE158752 asthma datasets from the GEO database of the National Center for Biotechnology Information (NCBI) (https://www.ncbi.nlm.nih.gov/geo/). The GSE63142 dataset (GPL6480 platform) (15) was uploaded in 2014 and included transcriptome studies of the bronchial epithelial cells from 27 healthy participants and 128 patients with asthma. In the GSE158752 dataset (GPL18573 platform) (16), 50 bronchial epithelial cell samples from patients with asthma and 17 normal samples were obtained. R software (version 4.2.2; https://www.r-project.org/) and RStudio software (version 4.2.2; https://www.r-project.org/) were used to process and analyze the datasets.
All profiles of the gene transcription microarray data were pre-processed utilising the “SVA” package (version 3.46.0), which included background correction and normalization. Gene symbols were annotated based on the annotation data. To execute advanced feature selection and visualization, we utilized GSE63142 as a training set for the DEGs analysis and used GSE158752 as a test set. We examined transcriptome samples from healthy controls and asthma patients to support the expression of the crucial genes identified. The GSE158752 dataset was used for verifying the core gene differential expression. Using the “limma” R package, we determined the DEGs between samples from patients with asthma and healthy subjects using a conservative threshold (|log2FC| > 1.0, p < 0.05). We utilised the “pheatmap” (version 1.0.12) and “ggplot2” packages (version 3.4.2) to generate a heatmap and volcano plot, respectively.
Gene Ontology (GO), Kyoto Encyclopedia of Genes Genomes (KEGG) pathway enrichment analyses were used to identify the characteristic biological, molecular, and cellular attributes and reveal associated enriched pathways. Gene Set Enrichment Analysis (GSEA) was employed to investigate the role of genes in biology (17). Analyses using KEGG, GO, and GSEA were performed using the R package “clusterProfiler” (version 3.14.3). Significantly enriched biological processes, molecular functions, cellular components, and pathways were chosen based on a threshold of p-value < 0.05 and an false discovery rate (FDR) < 0.05. The STRING database (https://cn.string-db.org/) was used for the protein–protein interaction (PPI) network analysis of DEGs related to asthma. It provides uniquely comprehensive coverage, integration, and interactions obtained through text mining (18).
Using the training set, we applied two types of machine learning algorithms to predict asthma disease-associated genes: SVM-RFE and LASSO regression models. The LASSO regression is a model for variable selection and complexity regularisation. We used the “Venn” package to intersect the diagnostic markers of asthma patients generated by the LASSO regression and the techniques of SVM-RFE. To gauge the performance of these models, we deployed the ROC curve and computed the AUC. The AUC quantifies the capacity of these two models to discriminate between healthy control and asthma samples, with predictions based on the chosen features. In summary, we implemented the LASSO regression and SVM-RFE techniques in the training set to select and utilise the training and test sets to then identify important DEGs for asthma diagnosis and evaluate the models' performance by employing the ROC curve and AUC values.
We performed immunoinfiltration analysis using the “CIBERSORT.R” package in the training cohort, used the “corrplot” packages to analyze the differentiated infiltration of immune cells between healthy people and patients with asthma, used the “preprocessCore” package to generate immunocyte content, and analyzed the correlation of core gene expression and immune cells by the “reshape2”, “ggpubr”, and “ggExtra” packages. Data with p-values < 0.05 and q-values < 0.05 were retained and volplot, barboplot, lollipop pictures were generated.
Female wild-type C57BL/6 mice were obtained from the Beijing Vital River Laboratory Animal Technology Co (Beijing, China). Mice were provided unlimited access to water and standard food and were raised under specific pathogen-free conditions (22°C ± 1°C, 50% ± 5% humidity) with a light/dark cycle of 12 h/12 h. One week before use, the mice were isolated and acclimated. Ten mice were classified into two groups (n = 5 each): sham and ovalbumin (OVA). Mice in the OVA group were given an intraperitoneal injection of sensitized OVA (100 μg; Cat #: A5503, Sigma-Aldrich, USA) and aluminium hydroxide (1 mg; Cat #:77161, Thermo Fisher Scientific, USA) on days 1 and 13, while saline (100 μl) was injected into mice in the Sham group. Mice in the OVA group were administered 2% OVA in an aerosol form for over 30 min for seven consecutive days, while mice in the sham group were administered saline. All animals were sacrificed within 24 h of the last nebulization. The Ethics Committee of the Wenzhou Medical University Laboratory Animal Resource Center (Wenzhou, China) granted consent for all studies to be conducted in accordance with the ARRIVE criteria.
Library building for the high-throughput sequencing of the eukaryotic reference transcriptome from the examined mouse lung tissue samples was performed by LC-Bio Technology Co., Ltd. (Hangzhou, China). An Illumina HiSeq X Reagent Kit (Illumina, San Diego, USA) was used as the sequencing platform. The expression of each transcript was calculated using the fragments per kilobase per million read technique to identify the DEGs between samples.
For statistical analysis and visualisation, R version 4.2.2 was employed, while GraphPad Prism 8.2.0 was used to statistically analyze the images. Student's t-tests were used to compare group variables. Results were shown as the mean ± standard deviation. At least three replicates were performed for each experiment. Statistical significance was set at p < 0.05.
A total of 30,889 genes from 155 bronchial epithelial cell samples obtained from 128 patients with asthma and 27 healthy individuals were included in the training set from the GEO dataset. The age range of subjects was 18–62 years, with an average age of 37 years. We first divided the data into two groups to examine the gene expression matrix of the training set: healthy controls and patients with asthma. The subsequent DEG analysis revealed a notable variation in gene expression between the two groups, as demonstrated in the heatmap, highlighting the distinct gene expression landscape of patients with asthma (Figure 1A). A comparatively small number of DEGs were found in this comparison, with a volcano plot displaying 9 upregulated and 4 downregulated genes with a conserved threshold of |log2FC| > 1.0, p < 0.05 (Figure 1B).
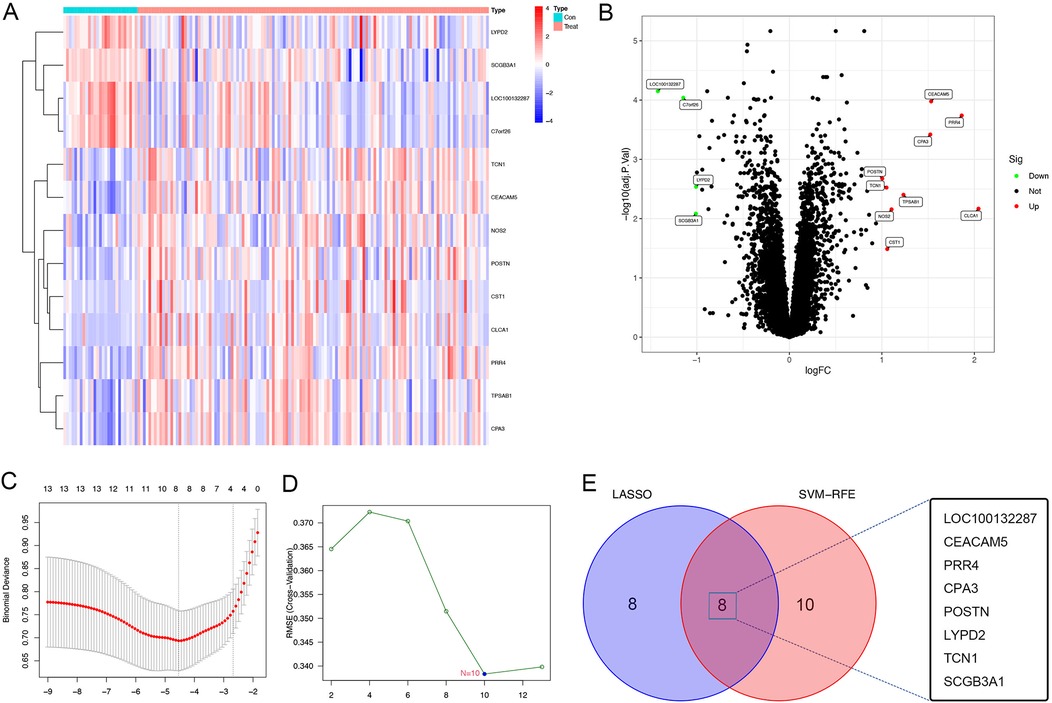
Figure 1. DEGs of patients with asthma using the GSE63142 datasets. (A) Heatmap of the the GSE63142 datasets; gene upregulation is indicated by red and gene downregulation is indicated by blue,highlighting the differences in gene expression between healthy controls and asthma patients. (B) Volcano plot of the GSE63142 datasets; significant DEGs with a conservative threshold of |log2FC| > 1.0, p < 0.05; red represents gene upregulation and blue represents gene downregulation. 13 genes were differentially expressed between healthy controls and patients with asthma (9 genes upregulated and 4 genes downregulated). (C) The LASSO regression analysis to identify the most relevant genes for asthma diagnosis based on the differential expression analysis results, which identified 8 diagnostic core genes. (D) The SVM-RFE menthod using the e1071, kernlab and caret package, which identified 10 diagnostic core genes. (E) Venn plot depicting the identification of key genes for distinguishing between healthy and asthma patients. The intersection of two machine learning algorithms—lasso regression and SVM-RFE method—reveals 8 pivotal genes (LOC100132287, CEACAM5, PRR4, CPA3, POSTN, LYPD2, TCN1, and SCGB3A1) as robust and discriminative features. DEGs, differentially expressed genes; LASSO, least absolute shrinkage and selection operator; SVM-RFE, support vector machine recursive feature elimination.
We constructed the LASSO regression model for feature selection, which identified 8 diagnostic core genes of asthma. This approach reduced unimportant feature coefficients to zero. The SVM-RFE is a learning algorithm used in nonlinear classification, which constructs a hyperplane in the feature classes with a maximum margin (19, 20). The SVM-RFE method is used to identify the most critical diagnostic markers associated with asthma progression. Using the SVM-RFE approach, 10 asthma diagnostic genes were identified. Through the convergence of the SVM-RFE approach and LASSO regression, eight important genes were found to be discriminative characteristics that might be used to separate asthma sufferers from healthy individuals [LOC100132287, carcinoembryonic antigen-related cell adhesion molecule 5 (CEACAM5); proline-rich 4 (PRR4); carboxypeptidase A3 (CPA3); periostin (POSTN); LY6/PLAUR domain cintaining 2 (LYPD2); transcobalamin 1 (TCN1); and secretoglobin family 3A member 1 (SCGB3A1)], as shown in the Venn diagram (Figures 1C–E).
Considering the significant variations in asthma gene expression patterns, we continued with a more comprehensive study focusing on the 13 DEGs. According to the results of the GO enrichment analysis, 95 GO items comprised 19 molecular functions (MF), 64 biological processes (BP), and 12 cellular components (CC). Several processes were significantly enriched. Notably, these included the response to oxygen levels and positive regulation of guanylate cyclase activity for BP, collagen-containing extracellular matrix, zymogen granule and anchoring membrane component for CC, and gpi anchor binding, peptidase activity, arginine binding and intracellular calcium activated chloride channel activity regard to MF. These findings underscore the importance of protein metabolism and enzyme regulation in the pathogenesis of asthma (Figures 2A–C).
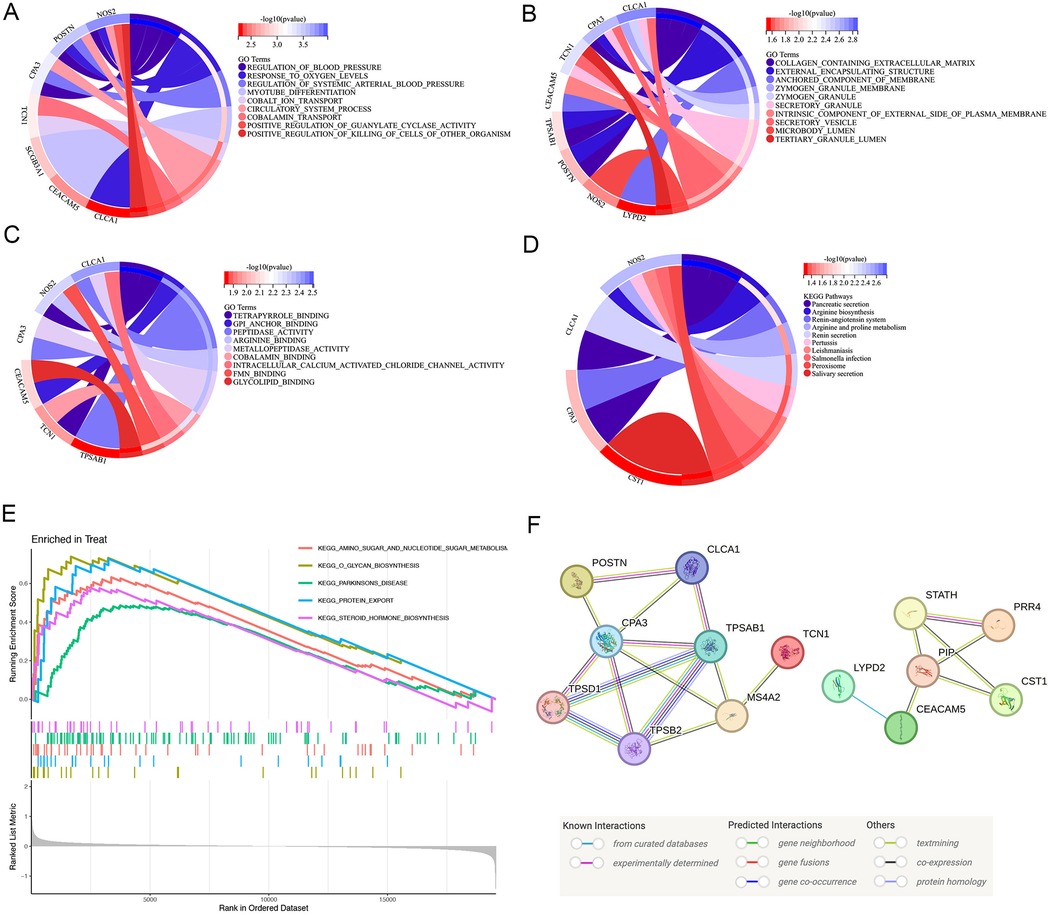
Figure 2. Function, pathway of the DEG enrichment analysis. (A–C) GO analysis of DEGs. Enrichment analysis of DEGs, demonstrating a strong association with response to oxygen levels and positive regulation of guanylate cyclase activity in BP, collagen-containing extracellular matrix, zymogen granule and anchoring membrane component in CC, and gpi anchor binding, peptidase activity, arginine binding and intracellular calcium activated chloride channel activity regard to MF. (D) KEGG pathway analysis of DEGs. The DEGs were linked to the pancreatic secretion, arginine biosynthesis, renin-angiotensin system and arginine and proline metabolism using KEGG pathway analysis. (E) Annotated KEGG pathway analysis using the GSEA approach. The results highlighted significant enrichment of amino sugar and nucleotide sugar metabolism, glycan biosynthesis, parkinsons disease, protein export, steroid hormone biosynthesis. (F) Interaction network of the proteins regulated by the key genes. PPI network of 13 specific asthma genes reflected the core connectivity of CPA3 and TPSAB1 in these proteins. DEGs, differentially expressed genes; GO, gene ontology; KEGG, Kyoto encyclopedia of genes and genomes; PPI, protein–protein interaction; GSEA, gene set enrichment analysis.
We performed the KEGG pathway analysis to explore the higher levels of biological functions associated with asthma. This approach focuses on how a collection of genes in the genome is linked to gene products (enzymes) to create pathways that are distinct in any particular organism (21, 22). According to the KEGG pathway analysis, the DEGs were primarily linked to the pancreatic secretion, arginine biosynthesis, renin-angiotensin system and arginine and proline metabolism (Figure 2D). Nitric oxide is a vasodilator with anti-inflammatory and bronchodilatory properties. Since arginine stimulates the synthesis of nitric oxide, it is possible that changes in the arginine metabolome contribute to the pathophysiology of asthma (23). KEGG enrichment analysis further emphasized that the DEGs were deeply intertwined with the pathogenesis of asthma.
Based on the findings of the KEGG enrichment study, we annotated KEGG using the GSEA approach. The results highlighted significant enrichment of amino sugar and nucleotide sugar metabolism, glycan biosynthesis, parkinsons disease, protein export, steroid hormone biosynthesis. There was significant enrichment of protein export and amino sugar and nucleotide sugar metabolism. Thus, protein, amino sugar and nucleotide sugar are crucial for the pathophysiology of asthma (Figure 2E).
To create a PPI network, thirteen primary DEGs associated with asthma were imported, examined, and visualized using SVG in the STING database. The total gene scores are shown as the number and colour of lines connecting the nodes. Fifteen proteins combined with CPA3 and 19 proteins combined with TPSAB1, reflecting the core connectivity of CPA3 and TPSAB1 (Tryptase alpha/beta-1) in these proteins (Figure 2F). Among these, POSTN, CLCA1 (Calcium-activated chloride channel regulator 1), CPA3, and TPSAB2 (Tryptase alpha/beta-2) existed some co-expression possibility.
Our findings from the GSE63142 dataset showed 13 genes differing in asthma. We further used a one-to-one format for comparison and validated with the GSE63142 dataset The genes CEACAM5, PRR4, CPA3, POSTN, TCN1, CST1 (Cystatin-SN), CLCA1, TPSAB1 and NOS2 (Nitric oxide synthase 2) were highly expressed in patients with asthma (Figure 3A). LOC100132287, LYPD2, SCGB3A1 and C7orf26 (Chromosome 7 open reading frame 26) had low expression in asthma patients (Figure 3B). The validity of these gene transcription patterns as diagnostic markers for asthma was supported by the consistency of the genome data. Further research is required to fully elucidate the underlying molecular pathways. LOC100132287 gene did not present in GSE158752 dataset. PRR4, TCN1, CST1, CLCA1, and NOS2 were also highly expressed in patients with asthma in GSE158752 dataset (Supplementary Figure S1A). LYPD2 and C7orf26 were also lowly expressed in patients with asthma in GSE158752 dataset (Supplementary Figure S1B).
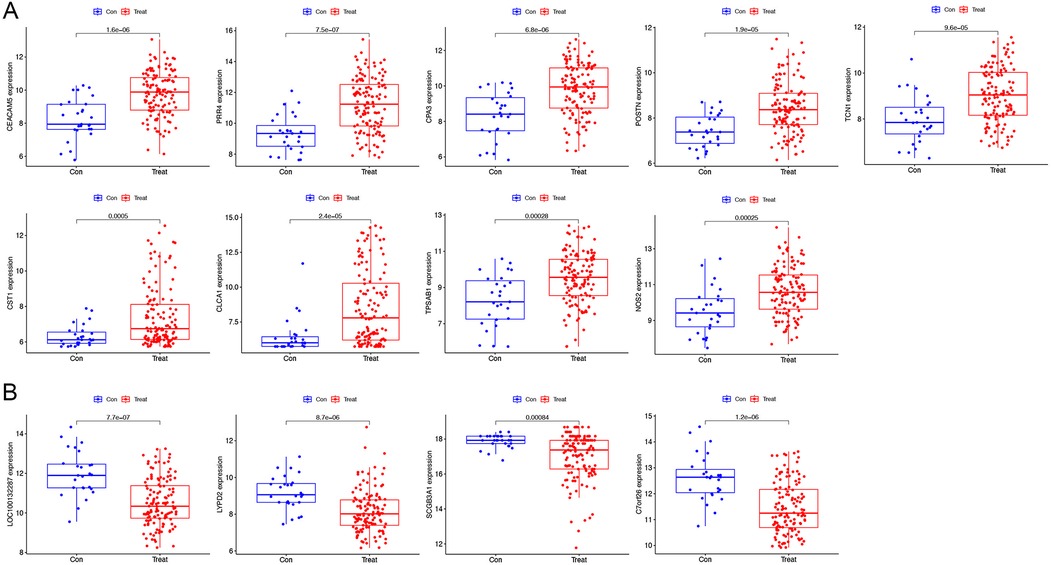
Figure 3. Verification of the varying expression of diagnostic genes. The differential expression of the GSE63142 dataset. (A) The genes have high levels of expression in patients with asthma. (B) The genes have low levels of expression in patients with asthma.
Using the AUC of the ROC curve, we verified the performance of the 13 asthma-associated genes in the training set and GSE63142 dataset. We created an ROC curve drawing of the diagnostic markers in RStudio to determine their diagnostic utility. The AUC ranged from 70.8% to 80.4% in the training set (Figure 4). The AUC values showed that the GSE63142 dataset performed satisfactorily overall, which suggests that these thirteen genes contributed significantly to the diagnostic utility of disease classification. Greater accuracy in differentiating between healthy individuals and asthma sufferers was indicated by the higher AUC values. The AUC ranged from 54% to 83% in the test set. CLCA1 reached an AUC value of 0.83 and its predictive efficacy was even higher than that of the training set (Supplementary Figure S2).
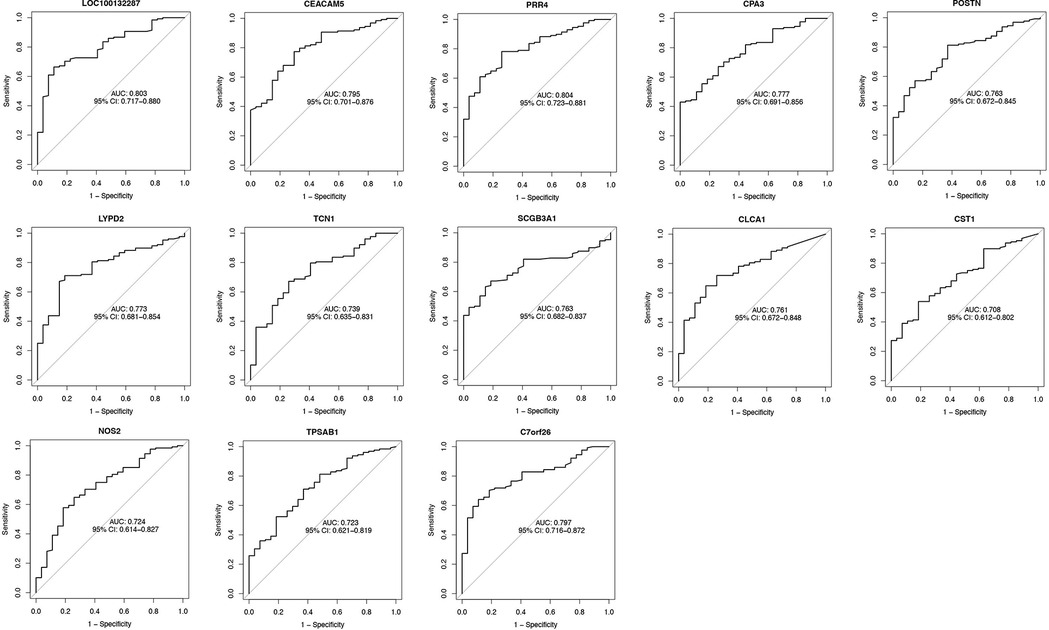
Figure 4. The AUC of diagnostic genes of the GSE63142 dataset. We used the ROC curve and calculated AUC to assess the performance of these models. The AUC ranged from 70.8% to 80.4%. ROC, receiver operating characteristic; AUC, area under the receiver operating characteristic curve.
The proportion of immune cells in each sample was obtained by immune cell infiltration analysis. plasma cells, T cell CD4 naive, T cell gamma delta, monocytes, macrophages M0, activated dendritic cells and Neutrophils were differential between healthy controls and asthma patients (Figures 5A,B). The findings of our investigation into the relationship between DEGs and immune cells are displayed in lollipop charts (Figure 6). The genes CEACAM5, PRR4, CPA3, POSTN, LYPD2, CLCA1, and CST1 were significantly associated with plasma cells and resting mast cells. The genes LOC100132287, TCN1, and C7orf26 were significantly associated with naive B cells. The genes SCGB3A1 were significantly associated with plasma cells, neutrophils and active memory CD4 T cells. The genes CEACAM5, PRR4, CPA3, POSTN, CLCA1, and CST1 had positive correlations with plasma cells and resting mast cells (p < 0.05), whereas PRR4 and CPA3 had negatively correlated with neutrophils and active mast cells (p < 0.05). The genes CPA3, POSTN, CLCA1, CST1, and TPSAB1 were significantly associated with regulatory T cells Tregs (p < 0.05).
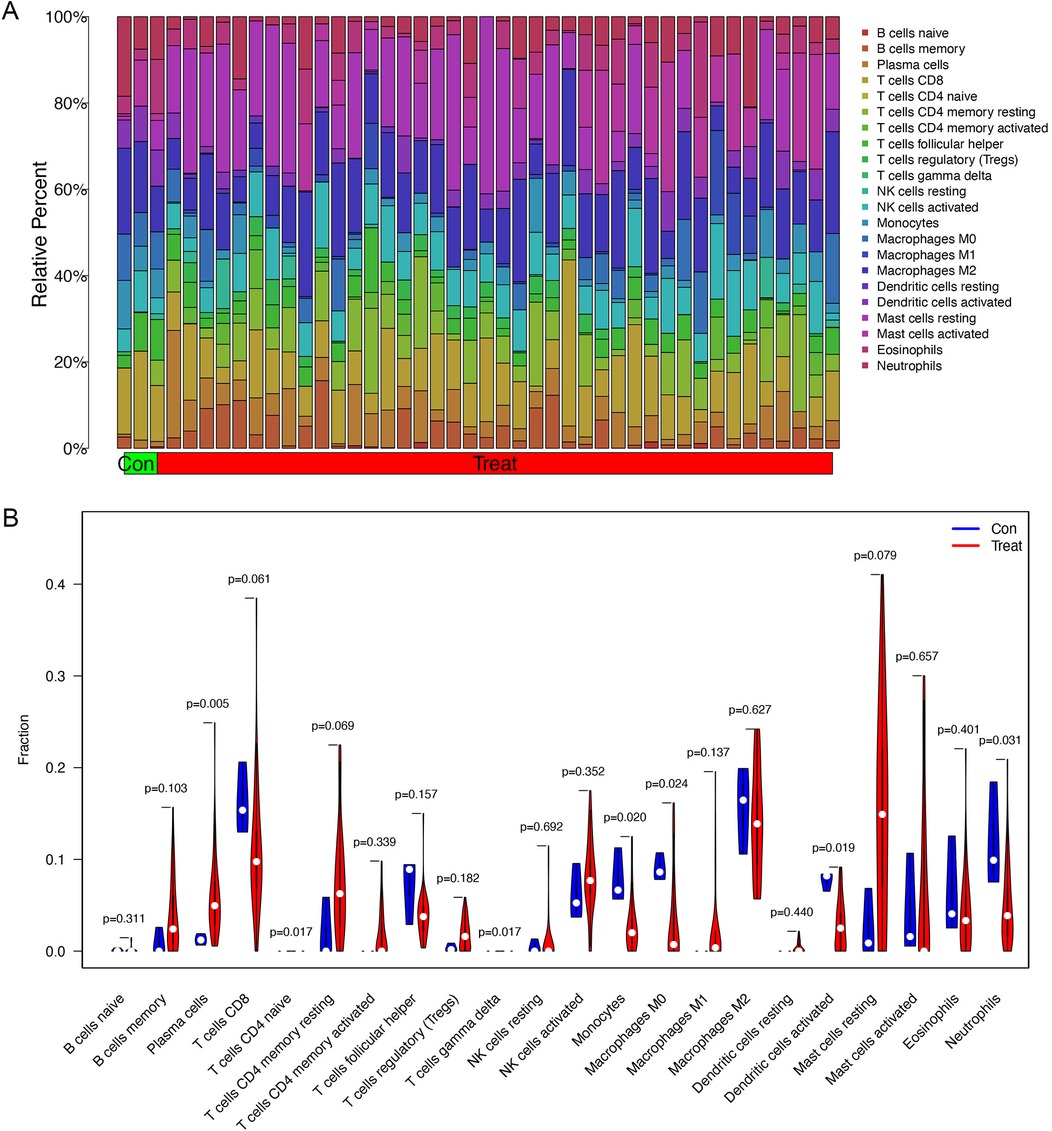
Figure 5. Immune cell infiltration analysis between asthma and healthy subjects. (A) The proportion of immune cells in each sample. (B) Differential infiltration of immune cells between healthy controls and asthma patients. Plasma cells, T cell CD4 naive, T cell gamma delta, monocytes, macrophages M0, activated dendritic cells and neutrophils have significant differences between two groups.
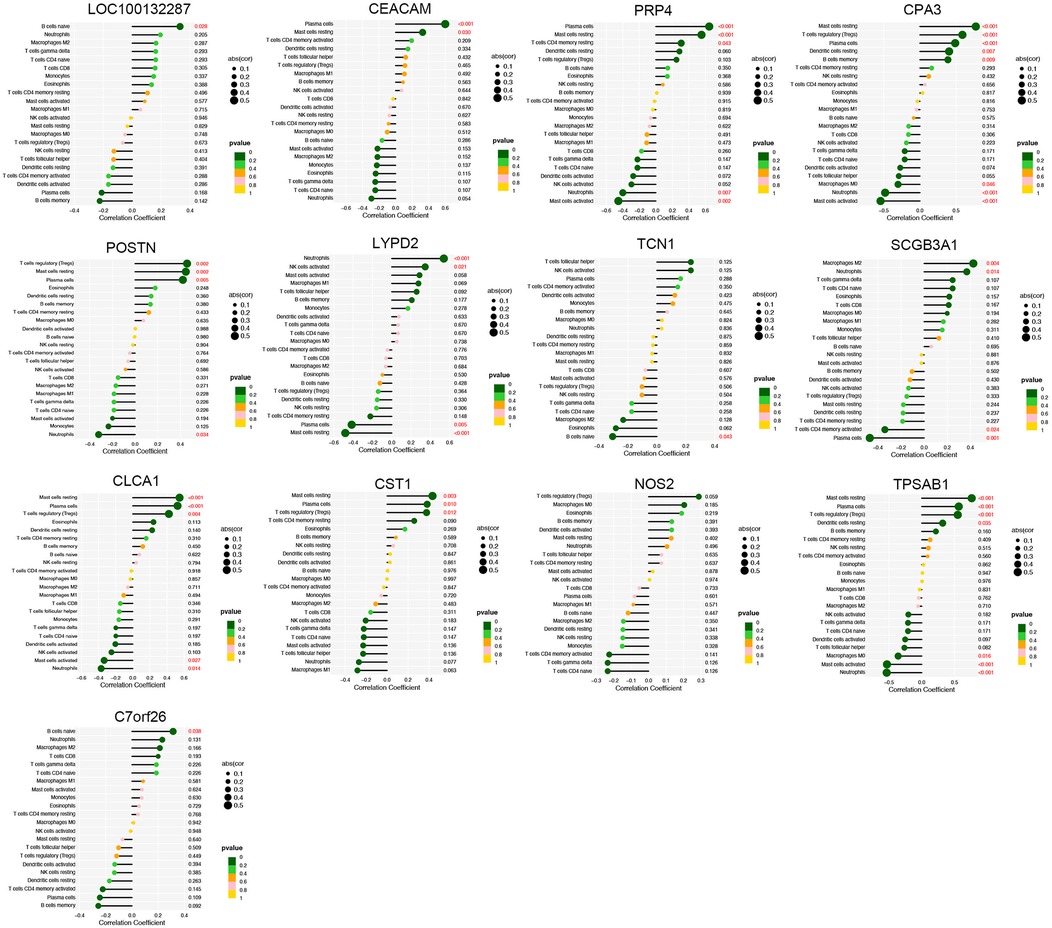
Figure 6. Immune cell correlation analysis of diagnostic genes. The genes CEACAM5, PRR4, CPA3, POSTN, LYPD2, CLCA1, and CST1 were significantly associated with plasma cells and resting mast cells (p < 0.05).
To determine gene expression levels, we extracted RNA from mouse lung tissues and performed high-throughput eukaryotic sequencing analysis. These four murine homologous genes, cpa3, postn, lypd2, and scgb3a1, did not differ significantly between the asthma group and the normal group. However, these findings indicated that the mRNA expression of nos2 and clca1 in the asthma group was higher than that in the normal group, which was in line with the transcriptome observations made in asthmatic patients in Figures 1A,B (Figure 7).
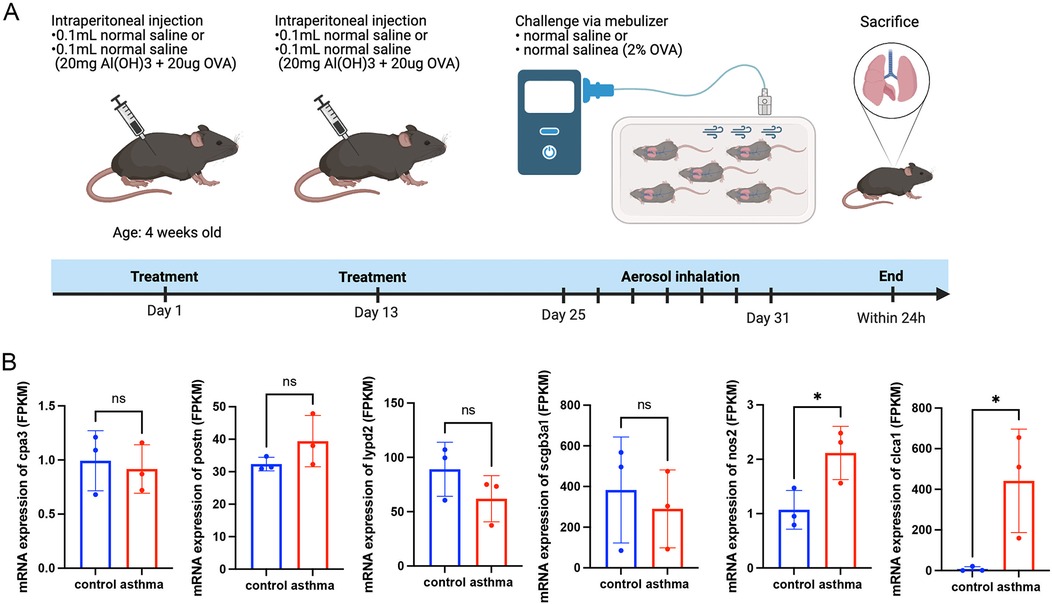
Figure 7. Animal experiments and sequencing analysis. (A) Schematic of the OVA asthma model construction; (B) Gene expression levels in mouse lung tissue. Control: normal mice; Asthma: asthma model mice. OVA, ovalbumin. Transcript analysis of the gene mRNA expression levels of cpa3, lypd2, scgb3a1, nos2, and clca1 in murine lung tissues, showing the gene nos2 and clca1 expression trends consistent with the transcriptomic data in patients with asthma.
Asthma, an prevailing pulmonary malaise, afflicts many individuals across the world (24). Wheezing, shortness of breath, coughing, and tightness in the chest are some of the symptoms that are caused by inflammation and constriction of the airways (25). Currently, we know several pathogenetic mechanisms contribute to the development and progression of asthma: inflammation, airway hyperresponsiveness, airway remodelling, immunological factors, genetic predisposition, environmental factors, and neural control (26). Many pharmaceutical strategies and self-management methods have been developed. However, some patients with asthma cannot control their symptoms with available treatment and management strategies, which highlights the unmet medical needs of these patients, an incomplete understanding of asthma pathogenesis, and the need for continued exploration of the topic, such as by targeting the specific genes that play cardinal roles in asthma evolution and progression. In this context, machine learning and other advanced techniques can be used to identify undiscovered genes critical to asthma and further explore asthma pathogenesis.
To address knowledge gaps physiology and pathology of asthma, we used two machine learning models to determine the main genes responsible for the initiation and progression of asthma. Preliminary exploration revealed marked disparities in gene expression between patients with asthma patients vs. that in healthy controls. We utilized KEGG, GO, GSEA, and PPI network analyses to further confirm the correlation of differential gene expression and asthma. Merging the LASSO regression with the SVM-RFE method enabled a model that not only showed a consensus in identifying key asthma genes but also compensated for performance deficiencies of the individual models in terms of accuracy and prediction. This synthetic approach identified eight pivotal asthma-related genes spanning the training set, test cohorts, and experimental animal specimens.
We identified 8 key genes (LOC100132287, CEACAM5, PRR4, CPA3, POSTN, LYPD2, TCN1, and SCGB3A1) associated with asthma by combining the LASSO regression model and the SVM-RFE method. Higher AUC values indicated a high diagnostic value. The association of the five genes CEACAM5, POSTN, TCN1, SCGB3A1, and CPA3 with asthma has been extensively identified and validated, and these are the most highly upregulated genes in patients with asthma (27–31), and CEACAM5 is associated with resting mast cells and eosinophils (32). The genes POSTN, TCN1, and CPA3 are associated with the type 2 inflammatory response (26, 33, 34). The gene SCGB3A1 is highly expressed in sputum columnar cells in patients with severe asthma and associated with non-neutrophilic airway inflammation (35). This is consistent with our findings.
Current reports indicate that PRR4 may impact the efficiency of the submucosal glands, leading to pathological changes in the respiratory tract (36). The role of the gene PRR4 in asthma require further verification. To date, no study has demonstrated an association between asthma and LYPD2. Some studies have shown that LYPD2 is predicted to be a GPI-anchored Ly6 protein, enriches in non-classical monocytes (37, 38). However, the gene LYPD2 had high AUC values, indicating that it has good predictive efficacy, which requires further exploration of the relationship with asthma.
The current study had several limitations. The foundation of our investigation was the computational analysis of gene expression samples, which provided estimated results and reflected our reliance on computational data. Not all core genes were validated in asthmatic mice, partly because some genes are only significantly expressed in subjects with severe asthma, relatively small sample size of the mouse experiments and not all genes are homologous in humans and mice. In future studies, we will continue to examine the association between the newly discovered diagnostic genes and asthma. Meanwhile, we are continuing to confirm the efficiency of these genes in the diagnosis of asthma in clinical applications.
In conclusion, our study validated several key genes potentially associated with asthma (CEACAM5, PRR4, CPA3, POSTN, TCN1, and SCGB3A1) and identified new asthma genetic marker, such as LYPD2. We propose that the combination of the detection of these genes and patient symptoms can lead to the prediction and diagnosis of asthma. We hope that by detecting the proteins expressed by these genes, we can determine the therapeutic effect of asthma and achieve clinical management.
The GSE63142 and GSE158752 asthma datasets were obtained from the GEO database at the National Center for Biotechnology Information (NCBI) (https://www.ncbi.nlm.nih.gov/geo/).
Ethical approval was not required for the studies involving humans because We obtained the GSE63142 and GSE158752 asthma datasets from the GEO database at the National Center for Biotechnology Information (NCBI) (https://www.ncbi.nlm.nih.gov/geo/). The studies were conducted in accordance with the local legislation and institutional requirements. Written informed consent for participation was not required from the participants or the participants' legal guardians/next of kin in accordance with the national legislation and institutional requirements because We obtained the GSE63142 and GSE158752 asthma datasets from the GEO database at the National Center for Biotechnology Information (NCBI) (https://www.ncbi.nlm.nih.gov/geo/). The animal study was approved by Wenzhou Medical University Laboratory Animal Resource Center. The study was conducted in accordance with the local legislation and institutional requirements.
XZ: Conceptualization, Writing – original draft, Data curation, Visualization, Methodology, Investigation. JS: Conceptualization, Investigation, Methodology, Writing – original draft, Visualization, Data curation. CL: Data curation, Writing – original draft, Investigation, Conceptualization, Methodology. XW: Methodology, Investigation, Writing – original draft, Data curation. YW: Data curation, Writing – original draft, Methodology, Visualization. JY: Writing – original draft, Data curation, Visualization, Methodology. WD: Investigation, Writing – original draft, Visualization, Data curation. XinX: Writing – original draft, Investigation, Visualization, Data curation. JF: Visualization, Writing – original draft, Investigation, Data curation. XiaX: Conceptualization, Methodology, Writing – review & editing, Writing – original draft. WZ: Conceptualization, Writing – review & editing, Writing – original draft, Funding acquisition, Methodology.
The author(s) declare financial support was received for the research, authorship, and/or publication of this article. This work was supported by the Zhejiang Provincial Natural Science Foundation of China under Grant No. LY23H010003 and Zhejiang Provincial Clinical Research Center for Pediatric Precision Medicine.
The authors express appreciation for the participation of all people who contributed to the design, analysis, and interpretation of the manuscript.
The authors declare that the research was conducted in the absence of any commercial or financial relationships that could be construed as a potential conflict of interest.
The author(s) declare that no Generative AI was used in the creation of this manuscript.
All claims expressed in this article are solely those of the authors and do not necessarily represent those of their affiliated organizations, or those of the publisher, the editors and the reviewers. Any product that may be evaluated in this article, or claim that may be made by its manufacturer, is not guaranteed or endorsed by the publisher.
The Supplementary Material for this article can be found online at: https://www.frontiersin.org/articles/10.3389/falgy.2025.1506608/full#supplementary-material
Supplementary Figure S1 | The differential expression of the GSE158752 dataset. (A) The genes have high levels of expression in patients with asthma. (B) The genes have low levels of expression in patients with asthma.
Supplementary Figure S2 | The AUC of the GSE158752 dataset. Validation of the 13 key genes using ROC curves in the test set, which ranged from 54% to 83%. AUC, area under the receiver operating characteristic curve.
1. Talwar D, Pahuja S, Prajapat D, Kumar K, Prakash A, Talwar D. Small airway involvement in severe asthma: how common is it and what are its implications? Monaldi Arch Chest Dis. (2024). doi: 10.4081/monaldi.2024.3005
2. Sockrider M, Fussner L. What is asthma? Am J Respir Crit Care Med. (2020) 202:P25–6. doi: 10.1164/rccm.2029P25
3. Wenzel SE. Asthma phenotypes: the evolution from clinical to molecular approaches. Nat Med. (2012) 18:716–25. doi: 10.1038/nm.2678
4. Busse WW, Bleecker ER, FitzGerald JM, Ferguson GT, Barker P, Sproule S, et al. Long-term safety and efficacy of Benralizumab in patients with severe, uncontrolled asthma: 1-year results from the bora phase 3 extension trial. Lancet Respir Med. (2019) 7(1):46–59. doi: 10.1016/S2213-2600(18)30406-5
5. Bousquet J, Humbert M, Gibson PG, Kostikas K, Jaumont X, Pfister P, et al. Real-world effectiveness of omalizumab in severe allergic asthma: a meta-analysis of observational studies. J Allergy Clin Immunol Pract. (2021) 9(7):2702–14. doi: 10.1016/j.jaip.2021.01.011
6. Xiao C, Puddicombe SM, Field S, Haywood J, Broughton-Head V, Puxeddu I, et al. Defective epithelial barrier function in asthma. J Allergy Clin Immunol. (2011) 128(3):549–56e1–12. doi: 10.1016/j.jaci.2011.05.038
7. Taylor DR, Bateman ED, Boulet LP, Boushey HA, Busse WW, Casale TB, et al. A new perspective on concepts of asthma severity and control. Eur Respir J. (2008) 32(3):545–54. doi: 10.1183/09031936.00155307
8. Lambrecht BN, Hammad H. Biology of lung dendritic cells at the origin of asthma. Immunity. (2009) 31:412–24. doi: 10.1016/j.immuni.2009.08.008
9. Lambrecht BN, Hammad H. The airway epithelium in asthma. Nat Med. (2012) 18:684–92. doi: 10.1038/nm.2737
10. Lambrecht BN, Hammad H. Lung dendritic cells in respiratory viral infection and asthma: from protection to immunopathology. Annu Rev Immunol. (2012) 30:243–70. doi: 10.1146/annurev-immunol-020711-075021
11. Zhang Y, Xia R, Lv M, Li Z, Jin L, Chen X, et al. Machine-learning algorithm-based prediction of diagnostic gene biomarkers related to immune infiltration in patients with chronic obstructive pulmonary disease. Front Immunol. (2022) 13:740513. doi: 10.3389/fimmu.2022.740513
12. Wu Z, Chen H, Ke S, Mo L, Qiu M, Zhu G, et al. Identifying potential biomarkers of idiopathic pulmonary fibrosis through machine learning analysis. Sci Rep. (2023) 13(1):16559. doi: 10.1038/s41598-023-43834-z
13. Saglani S, Custovic A. Childhood asthma: advances using machine learning and mechanistic studies. Am J Respir Crit Care Med. (2019) 199:414–22. doi: 10.1164/rccm.201810-1956CI
14. Kaplan A, Cao H, FitzGerald JM, Iannotti N, Yang E, Kocks JWH, et al. Artificial intelligence/machine learning in respiratory medicine and potential role in asthma and copd diagnosis. J Allergy Clin Immunol Pract. (2021) 9(6):2255–61. doi: 10.1016/j.jaip.2021.02.014
15. Modena BD, Tedrow JR, Milosevic J, Bleecker ER, Meyers DA, Wu W, et al. Gene expression in relation to exhaled nitric oxide identifies novel asthma phenotypes with unique biomolecular pathways. Am J Respir Crit Care Med. (2014) 190(12):1363–72. doi: 10.1164/rccm.201406-1099OC
16. Camiolo M, Gauthier M, Kaminski N, Ray A, Wenzel SE. Expression of sars-cov-2 receptor Ace2 and coincident host response signature varies by asthma inflammatory phenotype. J Allergy Clin Immunol. (2020) 146(2):315–24 e7. doi: 10.1016/j.jaci.2020.05.051
17. Subramanian A, Tamayo P, Mootha VK, Mukherjee S, Ebert BL, Gillette MA, et al. Gene set enrichment analysis: a knowledge-based approach for interpreting genome-wide expression profiles. Proc Natl Acad Sci U S A. (2005) 102(43):15545–50. doi: 10.1073/pnas.0506580102
18. Franceschini A, Szklarczyk D, Frankild S, Kuhn M, Simonovic M, Roth A, et al. String V9.1: protein-protein interaction networks, with increased coverage and integration. Nucleic Acids Res. (2013) 41(Database issue):D808–15. doi: 10.1093/nar/gks1094
19. Spycher BD, Henderson J, Granell R, Evans DM, Smith GD, Timpson NJ, et al. Genome-Wide prediction of childhood asthma and related phenotypes in a longitudinal birth cohort. J Allergy Clin Immunol. (2012) 130(2):503–9 e7. doi: 10.1016/j.jaci.2012.06.002
20. Mieth B, Kloft M, Rodriguez JA, Sonnenburg S, Vobruba R, Morcillo-Suarez C, et al. Combining multiple hypothesis testing with machine learning increases the statistical power of genome-wide association studies. Sci Rep. (2016) 6:36671. doi: 10.1038/srep36671
21. Kanehisa M, Furumichi M, Tanabe M, Sato Y, Morishima K. Kegg: new perspectives on genomes, pathways, diseases and drugs. Nucleic Acids Res. (2017) 45(D1):D353–D61. doi: 10.1093/nar/gkw1092
22. Kanehisa M, Goto S. KEGG: kyoto encyclopedia of genes and genomes. Nucleic Acids Res. (2000) 28:27–30. doi: 10.1093/nar/28.1.27
23. Morris CR. Arginine and asthma. Nestle Nutr Inst Workshop Ser. (2013) 77:1–15. doi: 10.1159/000351365
24. Wang CN, Lin YC, Chang BC, Chen CH, Wu R, Lee CC. Targeting the phosphorylation site of myristoylated alanine-rich C kinase substrate alleviates symptoms in a murine model of steroid-resistant asthma. Br J Pharmacol. (2019) 176(8):1122–34. doi: 10.1111/bph.14596
25. Boulet LP, Reddel HK, Bateman E, Pedersen S, FitzGerald JM, O'Byrne PM. The global initiative for asthma (gina): 25 years later. Eur Respir J. (2019) 54(2). doi: 10.1183/13993003.00598-2019
26. Holgate ST. Pathogenesis of asthma. Clin Exp Allergy. (2008) 38:872–97. doi: 10.1111/j.1365-2222.2008.02971.x
27. Mumby S, Kermani NZ, Garnett JP, Pavlidis S, Wilson SJ, Howarth PJ, et al. Ceacam5 is an il-13-regulated epithelial gene that mediates transcription in type-2 (T2) high severe asthma. Allergy. (2022) 77(11):3463–6. doi: 10.1111/all.15465
28. Xu C, Du L, Guo Y, Liang Y. Tcn1 expression is increased in asthma. Int Arch Allergy Immunol. (2023) 184(11):1135–42. doi: 10.1159/000531073
29. Vieira Braga FA, Kar G, Berg M, Carpaij OA, Polanski K, Simon LM, et al. A cellular census of human lungs identifies novel cell states in health and in asthma. Nat Med. (2019) 25(7):1153–63. doi: 10.1038/s41591-019-0468-5
30. Dougherty RH, Sidhu SS, Raman K, Solon M, Solberg OD, Caughey GH, et al. Accumulation of intraepithelial mast cells with a unique protease phenotype in T(H)2-high asthma. J Allergy Clin Immunol. (2010) 125(5):1046–53.e8. doi: 10.1016/j.jaci.2010.03.003
31. Leung TF, Liu EK, Li CY, Chan IH, Yung E, Lam CW, et al. Lack of association between Nos2 pentanucleotide repeat polymorphism and asthma phenotypes or exhaled nitric oxide concentration. Pediatr Pulmonol. (2006) 41(7):649–55. doi: 10.1002/ppul.20428
32. Hill DJ, Edwards AM, Rowe HA, Virji M. Carcinoembryonic antigen-related cell adhesion molecule (ceacam)-binding recombinant polypeptide confers protection against infection by respiratory and urogenital pathogens. Mol Microbiol. (2005) 55(5):1515–27. doi: 10.1111/j.1365-2958.2005.04487.x
33. Ma J, Tibbitt CA, Georen SK, Christian M, Murrell B, Cardell LO, et al. Single-Cell analysis pinpoints distinct populations of cytotoxic Cd4(+) T cells and an il-10(+)Cd109(+) T(H)2 cell population in nasal polyps. Sci Immunol. (2021) 6(62). doi: 10.1126/sciimmunol.abg6356
34. Kuo CS, Pavlidis S, Loza M, Baribaud F, Rowe A, Pandis I, et al. T-Helper cell type 2 (Th2) and non-Th2 molecular phenotypes of asthma using sputum transcriptomics in U-biopred. Eur Respir J. (2017) 49(2). doi: 10.1183/13993003.02135-2016
35. Qin L, Gibson PG, Simpson JL, Baines KJ, McDonald VM, Wood LG, et al. Dysregulation of sputum columnar epithelial cells and products in distinct asthma phenotypes. Clin Exp Allergy. (2019) 49(11):1418–28. doi: 10.1111/cea.13452
36. Wang M, Tang S, Yang X, Xie X, Luo Y, He S, et al. Identification of key genes and pathways in chronic rhinosinusitis with nasal polyps and asthma comorbidity using bioinformatics approaches. Front Immunol. (2022) 13:941547. doi: 10.3389/fimmu.2022.941547
37. Lyons YA, Wu SY, Overwijk WW, Baggerly KA, Sood AK. Immune cell profiling in cancer: molecular approaches to cell-specific identification. NPJ Precis Oncol. (2017) 1(1):26. doi: 10.1038/s41698-017-0031-0
Keywords: asthma, differentially expressed genes, machine learning, support vector machine recursive feature elimination (SVM-RFE), least absolute shrinkage and selection operator (LASSO) regression model
Citation: Zhong X, Song J, Lei C, Wang X, Wang Y, Yu J, Dai W, Xu X, Fan J, Xia X and Zhang W (2025) Machine learning-based screening of asthma biomarkers and related immune infiltration. Front. Allergy 6:1506608. doi: 10.3389/falgy.2025.1506608
Received: 5 October 2024; Accepted: 3 January 2025;
Published: 29 January 2025.
Edited by:
Svetlana P. Chapoval, University of Maryland, United StatesReviewed by:
Dina Rnjak, University Hospital Centre Zagreb, CroatiaCopyright: © 2025 Zhong, Song, Lei, Wang, Wang, Yu, Dai, Xu, Fan, Xia and Zhang. This is an open-access article distributed under the terms of the Creative Commons Attribution License (CC BY). The use, distribution or reproduction in other forums is permitted, provided the original author(s) and the copyright owner(s) are credited and that the original publication in this journal is cited, in accordance with accepted academic practice. No use, distribution or reproduction is permitted which does not comply with these terms.
*Correspondence: Xiaodong Xia, MzA2MTQ2MjY5QHFxLmNvbQ==; Weixi Zhang, emhhbmd3ZWl4aTExMkAxNjMuY29t
†These authors have contributed equally to this work
Disclaimer: All claims expressed in this article are solely those of the authors and do not necessarily represent those of their affiliated organizations, or those of the publisher, the editors and the reviewers. Any product that may be evaluated in this article or claim that may be made by its manufacturer is not guaranteed or endorsed by the publisher.
Research integrity at Frontiers
Learn more about the work of our research integrity team to safeguard the quality of each article we publish.