- 1School of Computer Science, University of Windsor, Windsor, ON, Canada
- 2College of Technological Innovation, Zayed University, Dubai, United Arab Emirates
This study focuses on identifying and evaluating the severity of powdery mildew disease in tomato plants. The uniqueness of this work lies in combining the imaging and advanced deep learning methods to develop a technique that transforms Red Green Blue (RGB) images into Simulated Hyperspectral Images (SHSI) to perform spectral and spatial analysis for precise detection and assessment of powdery mildew severity, thereby enhancing disease management. Furthermore, this research evaluates three advanced pre-trained VGG16 models, ResNet50 and EfficientNet-B7 algorithms for image preprocessing and feature extraction. Extracted features are passed to a neural network generator model to convert RGB image features into SHSIs, providing insights into the spectrum. This method enables the image analysis to perform assessments from SHSIs for health classification using Normalized Difference Vegetation Index (NDVI) values, which are meticulously compared with accurate hyperspectral data using metrics like mean absolute error (MAE) and root mean squared error (RMSE). This strategy enhances precision farming, environmental monitoring, and remote sensing accuracy. Results show that ResNet50’s architecture offers a robust framework for this study’s spectral and spatial analysis, making it a suitable choice over VGG16 and EfficientNet-B7 for transforming RGB images into SHSI. These simulated hyperspectral images offer a scalable and affordable approach for precise assessment of crop disease severity.
1 Introduction
Agriculture has played a role in societies throughout history as a food source and continues to be significant in the present day. Among the various crops grown, tomatoes are recognized as a rich source of vitamins, minerals, fibre and unique protein components. Moreover, their potential to lower cancer risk highlights their value in nutrition. Nevertheless, growing tomatoes comes with challenges due to plant diseases impacting crop yield and quality. Various diseases, like those caused by viruses, bacteria and different types of fungi, can seriously harm the health of plants. These pathogens can lead to symptoms like wilting, spots, on leaves and even plant death. Bacterial infections often show up as localized spots or areas of decay on plant tissues, while fungal infections can spread throughout the plant, affecting everything from leaves to seeds. Powdery mildew caused by the fungus Leveillula Taurica stands out as one of the detrimental diseases affecting tomato plants. Factors like weather patterns exacerbate the spread of this disease, posing increasing difficulties for farmers.
Additionally, oomycetes, a group of organisms that’s genetically different but look similar to fungi, pose unique challenges to plant health by causing leaf discoloration or premature death of plants. To simplify classification and management, plant diseases are generally grouped into fungal, viral and bacterial infections. A visual representation in Figure 1 outlines these disease types, providing a framework for recognizing their characteristics and relationships.
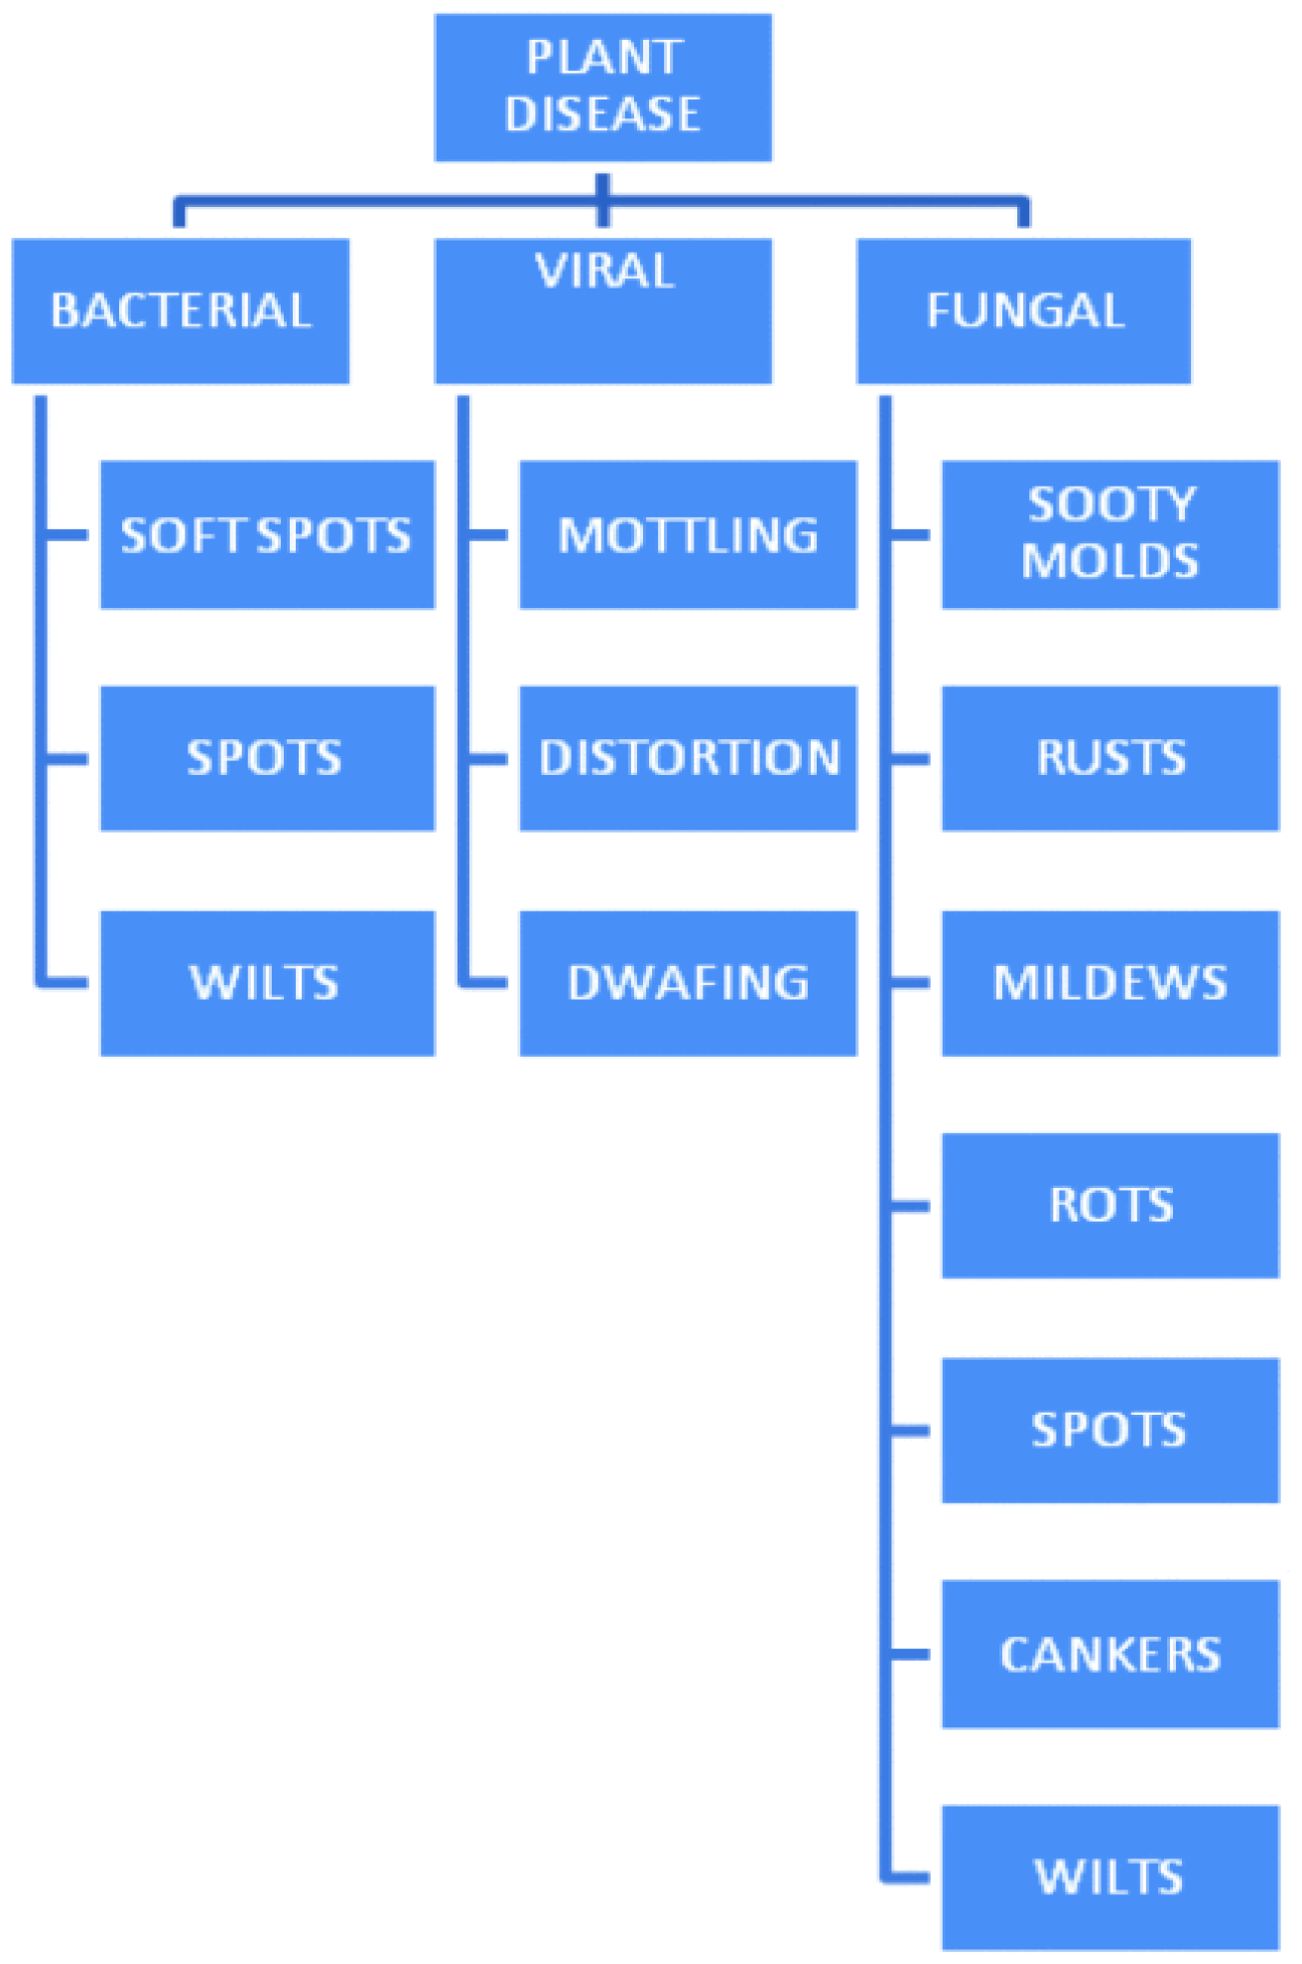
Figure 1. Plant Diseases Fundamental (Devaraj et al., 2019).
Traditionally, identifying such diseases has relied on time-consuming manual checks that may only sometimes be accurate (Rahman et al., 2023). When faced with these obstacles, scientists explore technical methods to identify plant diseases, especially when dealing with tomato powdery mildew. Researchers have also used pre-trained deep-learning models to tackle agricultural challenges (Majdalawieh et al., 2023). Hyperspectral imaging (HSI) technology is being explored for environmental monitoring and remote sensing of geographic locations and image analysis, mainly at the industrial level. However, research is also undergoing for its application at the agricultural level. HSI captures detailed data across wavelengths enabling early detection of diseases that may not be visible, to the naked eye or standard RGB cameras. This HSI image-based approach can offer insights into plant health. Deep learning models, and neural networks (CNNs) have shown impressive performance in categorizing plant diseases based on image data. These models can handle large datasets by recognizing patterns indicative of specific diseases. Research has showcased the success of models like ResNet, AlexNet and GoogleNet in achieving accuracy in identifying plant diseases. Despite their benefits, we face limitations in quantitative analysis with traditional RGB images. Moreover, RGB imaging captures three wavelength bands (red, blue, and green), potentially overlooking subtle disease symptoms that appear beyond the visible spectrum.
This limitation implies that when visible symptoms become apparent, the disease might have already inflicted harm to the plant (De Silva and Brown, 2022). Additionally, environmental elements, like lighting conditions and background noise, can often affect RGB images, potentially compromising the accuracy of disease detection models (Ramesh and Vydeki, 2020; Li and Li, 2022). Relying solely on RGB images may result in delayed identification of plant diseases, underscoring the need for sophisticated imaging methods such as HSI to enhance precision and enable early detection. To truly grasp the potential of HSI technology, it’s helpful to understand the constraints of RGB images in this scenario. Traditional color images consist of three wavelength bands: red (around 650 nm), green (520 nm) and blue (475 nm) light (Arad et al., 2020). On the other hand, hyperspectral systems can capture a range of light wavelengths that can go beyond what the human eye can see in the visible spectrum (400 700 nm). This enhanced capability enables the collection of data across various visible and invisible wavelengths (Pushparaj et al., 2021).
Hyperspectral technology is widely explored as a tool for detecting plant diseases. This method involves analyzing wavelengths within the spectrum, mainly focusing on the visible to near-infrared and sometimes short-wave infrared ranges. By capturing data from numerous narrow bands, hyperspectral sensors can effectively detect subtle changes in plant health caused by diseases. This advanced technology enables disease detection before visible symptoms manifest, facilitating differentiation between different disease types. Hyperspectral imaging technology can play a role in real-time monitoring of plant health on a large scale, providing precise and timely information to support modern agricultural practices (Thomas et al., 2020; Bock et al., 2019; FAO, 2019). This advanced imaging method may allow us to see plant details (Figure 2) that are not visible to the naked eye or regular cameras. The data obtained can be compared to healthy plant dimensions, offering insights beyond what traditional imaging techniques can provide. This new method marks a step ahead in monitoring crop health and could transform efforts to ensure food security.
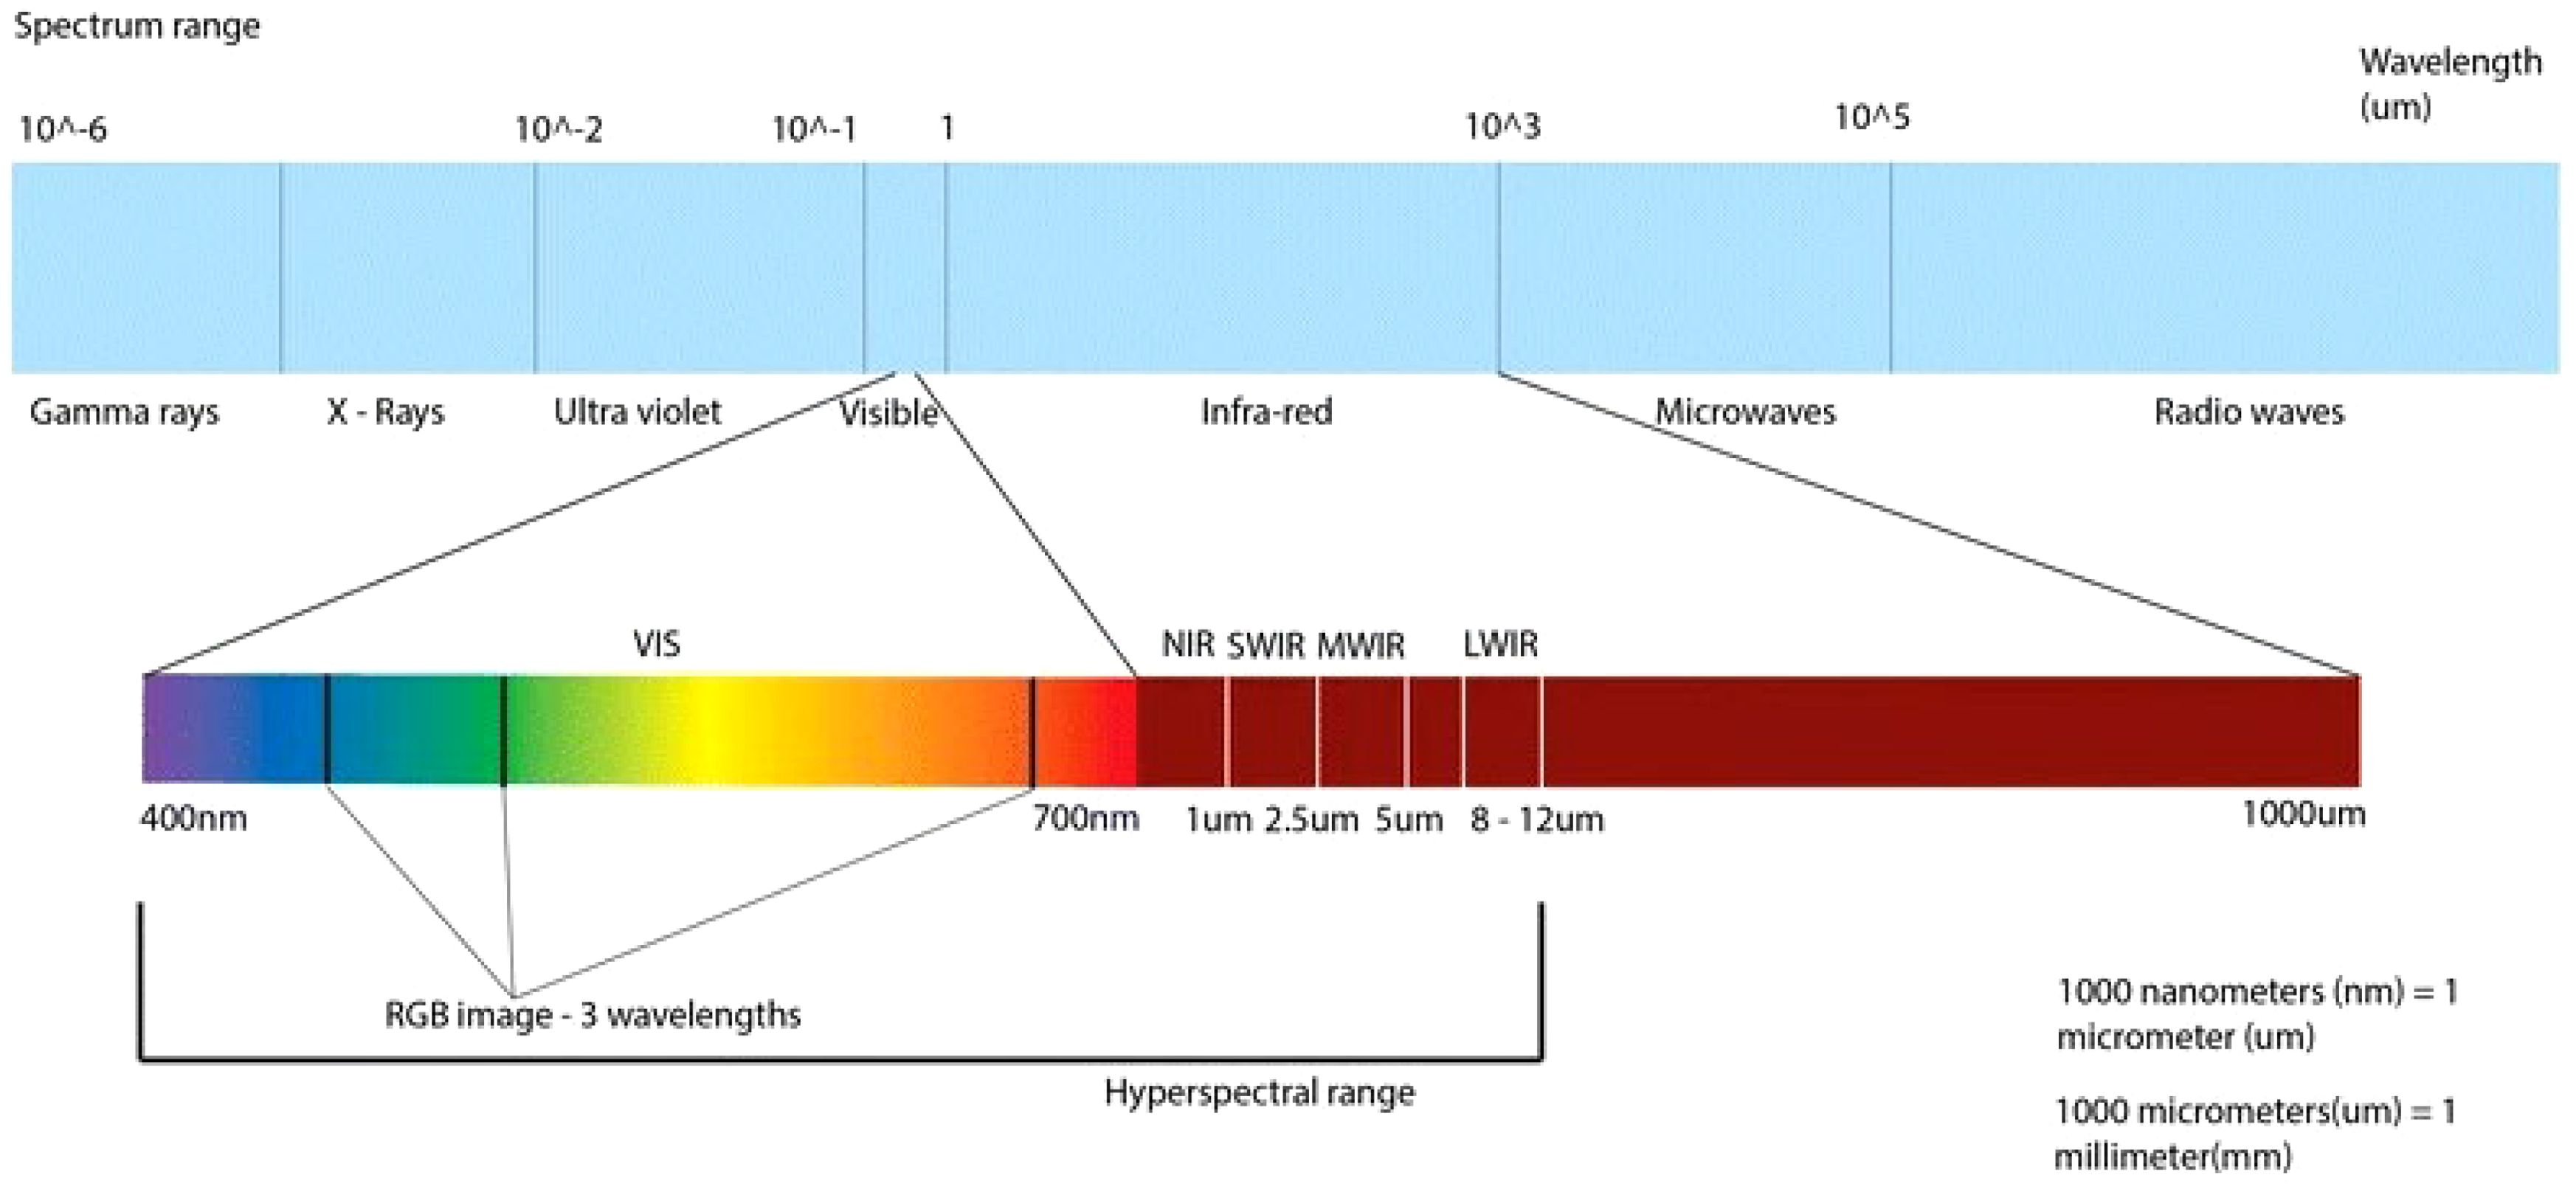
Figure 2. Electromagnetic spectrum with visible and infrared light displayed on the lower bar (Lowe et al., 2017).
This strategy is particularly beneficial for invasive evaluations of plant health. For instance, in Figure 3 we can see a side-by-side comparison of a RGB image (3a) and a hyperspectral image (3b) of tomato leaves. These images were taken under conditions at a wavelength of 1390 nm. The hyperspectral image provides insights into the structure and composition of the leaves, which is crucial for studying tomato leaves given their high transpiration rates and vulnerability to water stress. This imaging method allows researchers to gather information about leaf shape and health without contact by carefully selecting illumination wavelengths and areas of interest (Zhao T. et al., 2020).
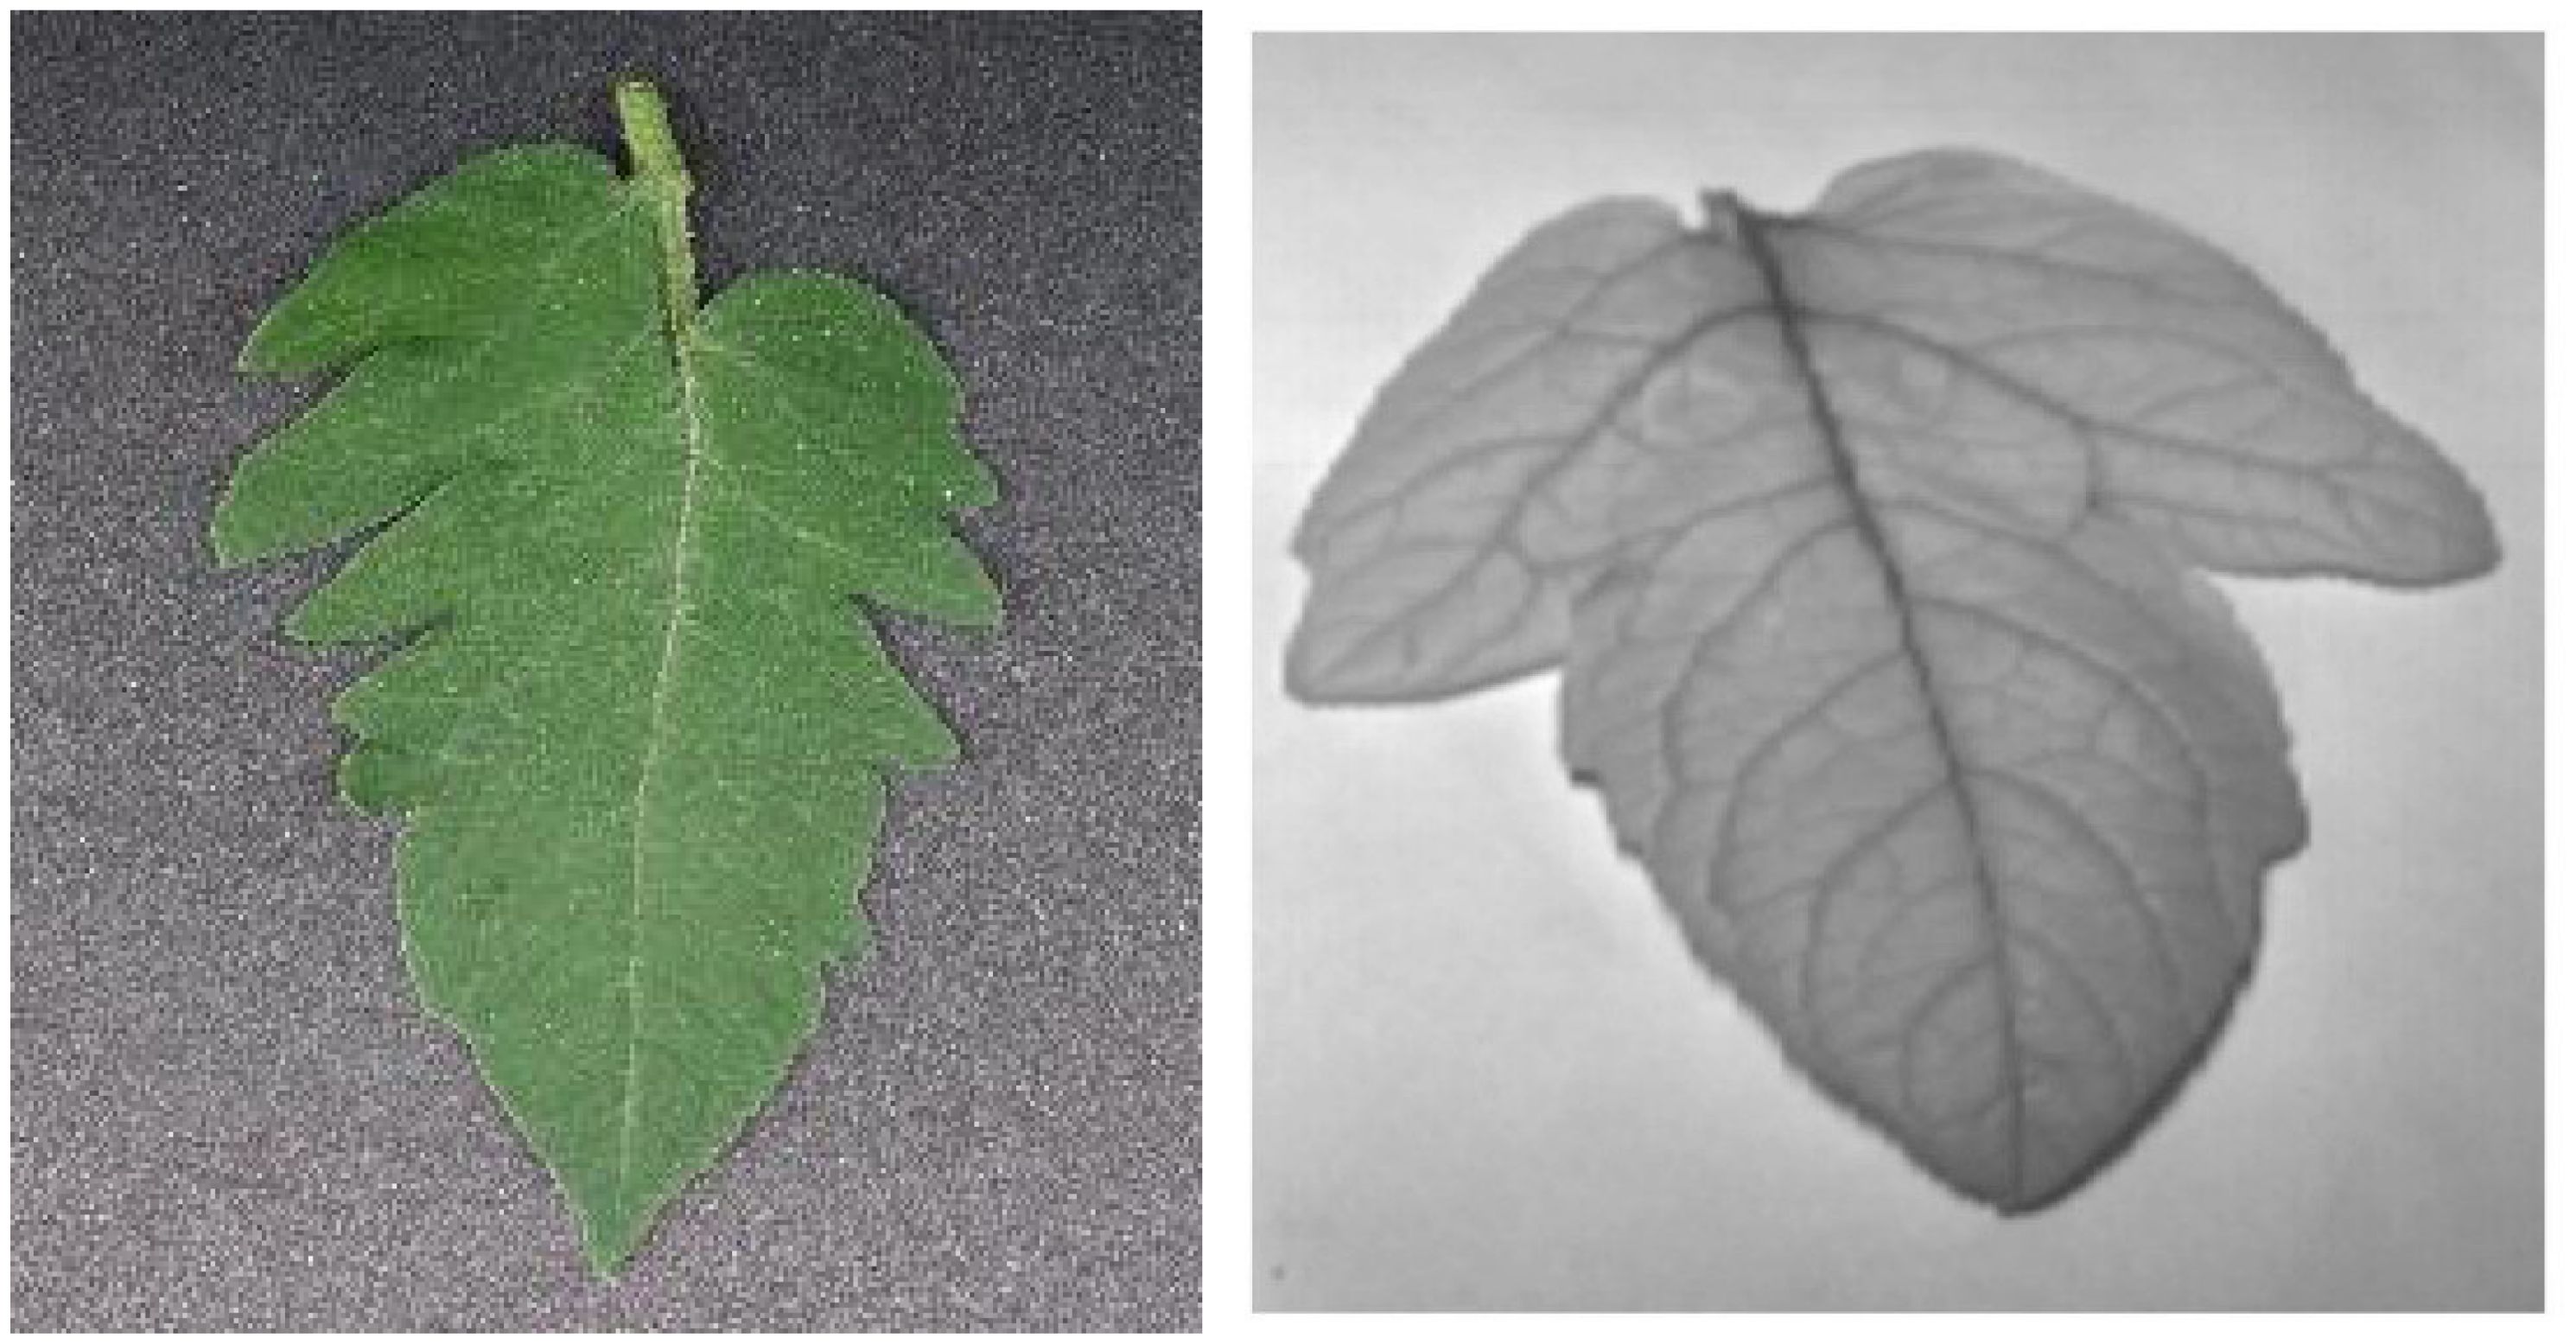
Figure 3. RGB image and Hyperspectral image at a 1390 nm wavelength (Huang and Chang, 2020; Zhao T, et al., 2020).
Although hyperspectral imaging technology is robust, its implementation can be expensive and complicated (Nguyen et al., 2021). Additionally, it may sometimes struggle with capturing data on a large scale to overcome these challenges, simulated hyperspectral images must be created. This approach can potentially improve the training of machine learning algorithms in deep learning scenarios and introduce opportunities for object and scene recognition without relying on complex imaging equipment. Consequently, the primary goal of this research is to enhance the precision and accuracy of disease detection and health assessment in tomato plants by developing a novel technique that transforms RGB images into Simulated Hyperspectral Images (SHSI). Additionally, the research delves into the evaluation of deep learning models by comparing three pre-trained models for feature extraction of plant images.
2 Related work
Zhao J. et al. (2020) tackled the high costs and low-resolution problems of hyperspectral imaging by developing a method to reconstruct these images from simple RGB photos taken with a smartphone camera. They used a model called HSCNN-R, optimized to convert RGB images of tomatoes into hyperspectral photos accurately. These converted images were then used to assess the quality of the tomatoes by measuring specific quality indicators. The results matched closely with actual lab measurements, proving that this method is effective and promising for real-time fruit quality monitoring in agriculture and beyond. However, the hyperspectral images were taken using an expensive camera.
Moreover, a comparison of deep learning models was not undertaken in this study. Other research (Lin et al., 2019) examines the powdery mildew disease and its severity in cucumbers via a convolutional neural network (CNN) model using semantic segmentation. Even though they could identify the condition with 96.08% accuracy, their images were captured in a controlled environment, and the considered dataset was inefficient in size and variety. Another advanced technique was used by researchers (Nguyen et al., 2021) to identify illnesses in grapevines brought on by the grapevine vein-clearing virus(GVCV). They captured fine-grained images of healthy and diseased grapevines using a specialized hyperspectral sensor camera that records a broad spectrum of light beyond what human eyes can perceive. They also developed specialized markers, such as the normalized pheophytization index (NPQI), to better detect the illness, Converting ordinary RGB photos, such as those taken with our smartphones, into hyperspectral photographs, which record much more light-related data. They tested three distinct approaches using a set of 450 conventional photos and their corresponding hyperspectral variants. Convhs_5, the most straightforward approach, produced passable results but lacked clarity. The best approach that produced findings that were both obvious and practical was Enhanced-ResNet. However, their lack of computing capacity prevented them from testing the most sophisticated approach, Dense-HSCNN, to its full potential (Pushparaj et al., 2021). The problem is converting RGB photographs from a conventional camera into comprehensive hyperspectral images, which can reveal much more information about an object or scene than what is first seen. They developed a method named C2H-Net based on an artificial intelligence framework to produce finely detailed images from ordinary photographs. They developed and made a new set of high-resolution photographs available to the public, dubbed C2H-Data, to aid their study and future investigations. Researchers may find a wealth of information in this collection, which includes several photos of various things. They demonstrated the superiority of their approach over several current techniques by testing their new system on this collection as well as two others (Yan, L et al., 2020). Hyperspectral imaging technology is like a compelling camera that records much more information about what it sees, which is very beneficial for determining the composition of various objects. Their study examines why these powerful cameras are utilized less frequently and was published in Scientific Reports. They are costly and challenging to operate, making it difficult to apply them to regular requirements like assisting with healthcare or determining food quality. To address this issue, the researchers looked at more than 25 clever methods to extract comparable hyperspectral information from the ordinary pictures we take with our phones or cameras. They discovered two primary approaches: one that functions best when there is a shortage of data and another that uses deep learning, a form of artificial intelligence, to do its magic in situations with abundant data. They determined the benefits and drawbacks of each strategy by testing them using publicly available web data (Zhang et al., 2022). A unique technology to transform ordinary camera photos (RGB images) into highly detailed images that can see beyond what our eyes can, much like having supervision in terms of colours. This study used a technique known as spectral super-resolution to improve the image in a way that allows us to see more colours and features that are often undetectable, in contrast to conventional approaches that attempt to make the image clearer or sharper. Much important information is lost when attempting to extract hyperspectral information (greater colour detail) from these essential photographs since it was never collected in the first place. The researchers created a multi-scale deep convolutional neural network (CNN), a kind of artificial intelligence, as a clever computer model to address the issue. Like a detective, their model can locate and utilize hints in the image to reconstruct the missing colour details. It extracts visible and hidden colour information by examining various sizes of photos (Yan Y et al., 2018). The challenge was centered around an interesting technological challenge in 2020: converting standard camera photos (the RGB kind we all take) into incredibly detailed images with significantly more colour information, like what you would get with hyperspectral imaging. They had run this challenge twice, so this was not their first rodeo. Two different competitions were set up: one named “Clean,” where the objective was to create these intricate graphics from flawless, noise-free RGB photos by employing some clever calculations, and another called “Real World,” where the challenge became more difficult. This time, participants were given noisy, compressed images from cameras that weren’t explicitly calibrated for the task images, similar to what most of us have on our phones. A vast collection of 510 hyperspectral photos of nature scenes was provided to add interest and provide enough material for everyone to work. In the end, 14 teams advanced to the championship round out of the more than 100 participants who signed up for the challenge (Arad et al., 2020). By sharing a unique collection of plant photos, a group of academics made significant progress in smart farming in 2023. These images, however, are not just any photos. They were captured using a hyperspectral camera, an incredibly sophisticated sensor that sees details that ordinary cameras miss. Farmers can produce more and better crops with this type of camera since it can tell us a lot more about plants, such as whether they need more water. A significant issue in the past was the need for sufficient high-resolution plant images to develop more intelligent agricultural instruments. To build a massive collection of these hyperspectral photos, the team chose to take 385 pictures of various plants across Russia in the summer of 2021. With 237 distinct colour bands, these photos exhibit various hues surpassing humans’ sight ability (Gaidel et al., 2023).
To summarize, researchers (Lin et al., 2019), Nguyen et al. (Nguyen et al., 2021), and Pushparaj et al. (Pushparaj et al., 2021) have explored utilizing deep learning and hyperspectral imaging to identify illnesses and stress in plants, such as cucumbers and grapevines. They used a range of models, from CNNs to Enhanced-ResNets, and explored ways to reduce the hurdles to acquiring advanced imaging technologies by recreating hyperspectral images from regular RGB images. Our research, which takes inspiration from these initiatives, offers a novel technique for simulating hyperspectral images from RGB images. This will enable a larger audience to benefit from the sophisticated capabilities of hyperspectral analysis without requiring expensive equipment. Furthermore, our research will explore three advanced pre-trained VGG16 models, ResNet50 and EfficientNet-B7 algorithms, to find the most suitable one for image preprocessing and feature extraction. Our solution aims to improve affordability and agricultural sustainability by integrating deep learning techniques to automate disease diagnosis and utilizes simulated hyperspectral data for complete plant health evaluation.
3 Materials and methods
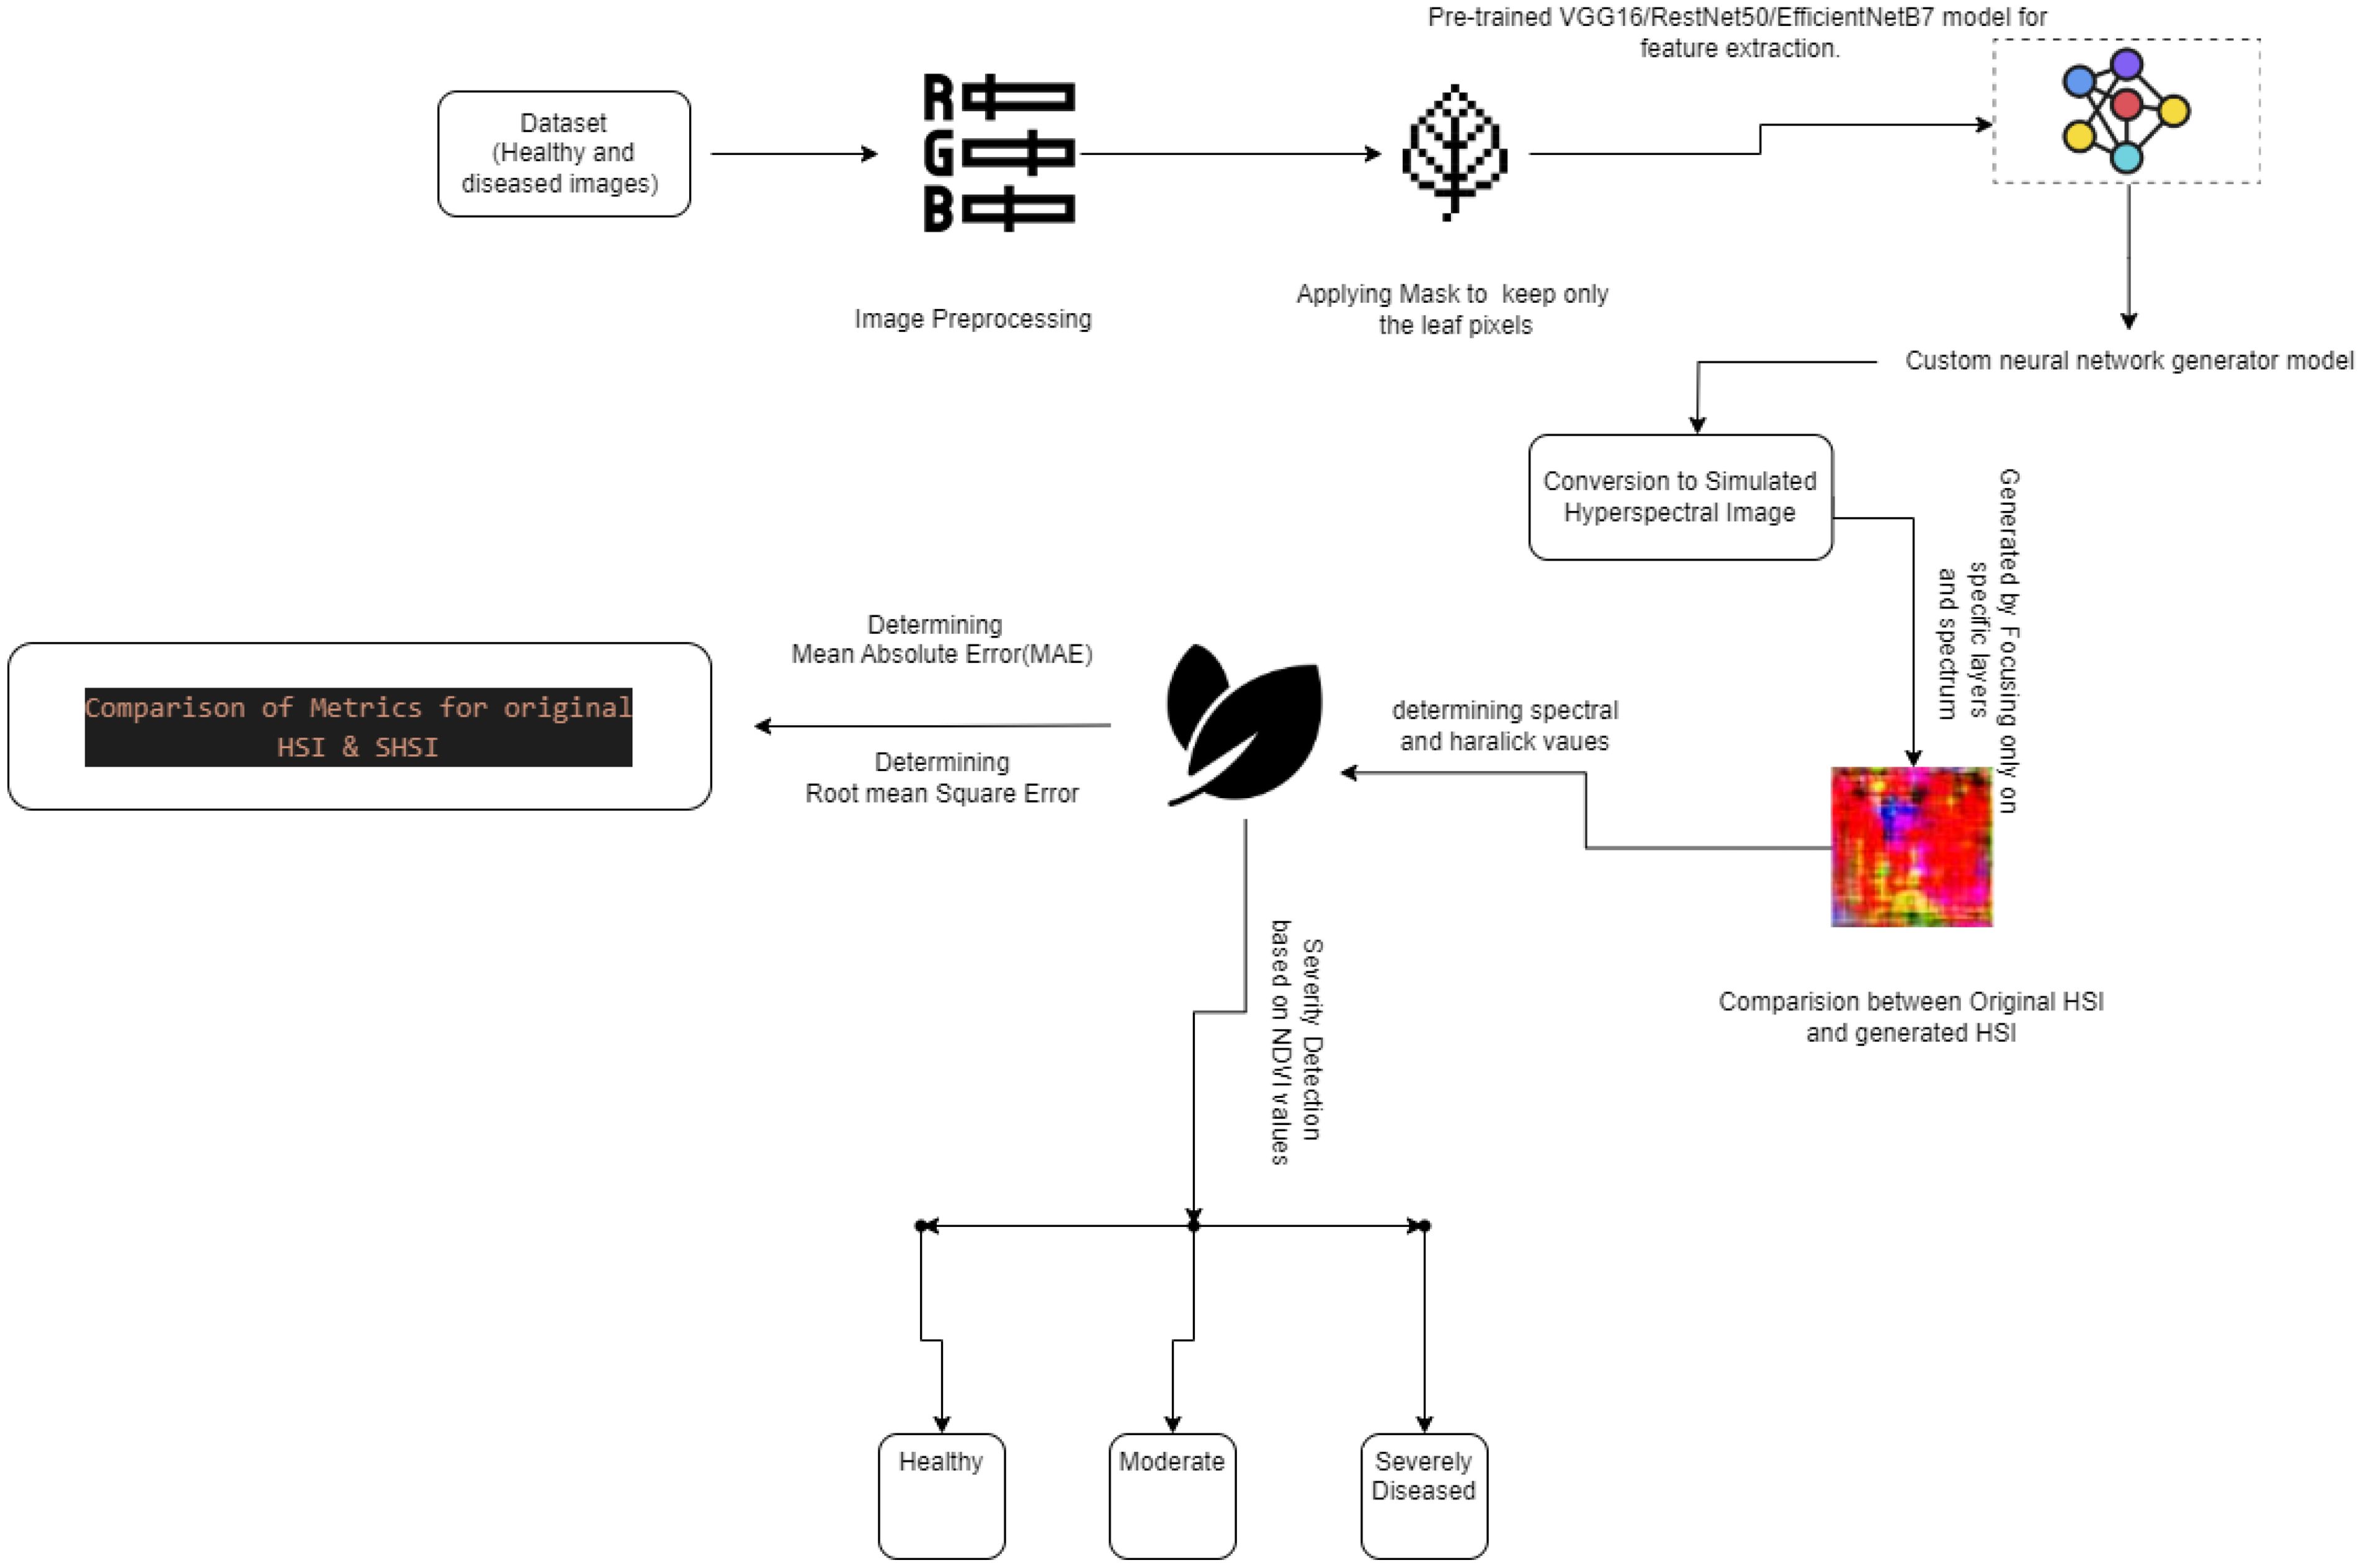
This research presents a novel method (Figure 4) that blends sophisticated imaging and computer science to enhance how we analyze plant health. We transform standard RGB images into Simulated Hyperspectral Images (SHSI). These images reveal details about plant health that are usually invisible to the naked eye. We use three advanced pre-trained models to extract features from these images: VGG-16 (Alatawi et al., 2022), RESNET-50 (Mandal et al., 2021), and EfficientB7 (Adinegoro et al., 2023). Next, we evaluate the metrics of our SHSI by comparing them to original hyperspectral images using two key measures: Mean Absolute Error (MAE) and Root Mean Square Error (RMSE). This step is crucial as it allows us to verify how effectively each model replicates the hyperspectral data. We also carry out detailed spectral and spatial analyses of the generated images.
We calculate important spectral indices like the Normalized Difference Vegetation Index (NDVI) and the Enhanced Vegetation Index (EVI) and spatial features such as Haralick values to gain a fuller picture of plant health (Devaraj et al., 2019. For each image, we measure NDVI values and assess the severity of vegetation health based on established threshold values (Huang and Chang, 2020; Sreedevi and Manike, 2022). This thorough approach showcases our dedication to advancing agricultural techniques through the latest technology, ensuring accurate plant health assessments with the help of deep learning and innovative imaging solutions (Gaidel et al., 2023; Gonog and Zhou, 2019).
3.1 Preparing the dataset
Our research relied heavily on three benchmark datasets, which provided vital context for analysis and comparison. These benchmark datasets were carefully selected to offer a consistent foundation for evaluating the effectiveness and performance of our suggested techniques. By adding these benchmarks, our results become more dependable and broadly applicable, encouraging a more thorough assessment of our models compared to accepted industry norms (Sreedevi and Manike, 2022; Lowe et al., 2017). In this dataset preparation stage, our work strategically uses OpenCV’s versatility to collect a dynamic range of real-time images. These photos form the basis of our study on the severity of plant diseases, emphasizing the widespread problem of powdery mildew (Lin et al., 2019). The carefully assembled dataset for this study is notable for its diversity and comprehensiveness. We have included examples of several phases of powdery mildew infection to guarantee a wide range of circumstances for a comprehensive investigation of the suggested approaches (Nguyen et al., 2021; Gaidel et al., 2023). The range of infection severity, from early beginnings to severe signs, is covered in this carefully chosen collection, which strengthens the dataset’s resilience and representativeness. In conclusion, the foundation of this research is the creation of our diverse dataset, which includes benchmark datasets, guaranteeing a careful and ethical examination of our suggested methodologies in the context of plant disease assessment (Sreedevi and Manike, 2022).
3.1.1 Dataset 1: Leaf disease dataset
Dataset-1 is publicly available at https://data.mendeley.com/datasets/tywbtsjrjv/1. This dataset is an extensive compilation of 61,486 photos covering 39 distinct classes of plant leaves, including background shots devoid of leaves, as well as specimens in good health and those afflicted with various diseases. Six augmentation techniques have been used to improve its volume and diversity. These approaches include rotation, scaling, noise injection, flipping, gamma correction, and PCA colour augmentation. Although many different plant species exist in the dataset, our work specifically focuses on the tomato classes. We use images in various conditions, from healthy to diseased, to develop and test our suggested method for plant identification (Arun Pandian and Gopal, 2019).
3.1.2 Dataset 2: Dataset of Tomato leaves
The link to access this dataset is https://data.mendeley.com/datasets/ngdgg79rzb/1.This dataset offers many photos of tomato leaves that have been carefully selected from two different sources and are intended for the in-depth examination of various plant diseases. Ten types of tomato leaf conditions, including both healthy and diseased states, are included in the initial half of the dataset, which is reduced to a consistent dimension for analysis from the PlantVillage database. The second section contains photos from Taiwan that have been greatly enhanced through various augmentation techniques to improve the dataset’s diversity and usefulness. The images combine single and multiple-leaf scenarios against simple and complicated backdrops (Huang and Chang, 2020).
3.1.3 Dataset 3: BGU iCVL Hyperspectral Image Dataset
This HSI image dataset is available at https://icvl.cs.bgu.ac.il/hyperspectral/. This dataset represents a comprehensive collection of hyperspectral photographs using a high-resolution Specim PS Kappa DX4 hyperspectral camera, which recorded 201 photos in 519 spectral bands between 400 and 1000 nm. The spatial resolution of each image is 1392 x 1300, and the pixel values range from 0 to 4095, which corresponds to the 12-bit depth of the camera. The dataset comprises.Mat files with data down sampled to 31 spectral channels for the 400 nm to 700 nm range for practicality’s sake. Although the dataset includes photos of various plant species, this work focuses only on pepper plants. By using this comprehensive spectral information, we may improve our comprehension and analysis of plants health and disease aspects (Arad and Ben-Shahar, 2016).
3.2 Image preprocessing
3.2.1 Grayscale conversion
Grayscale image conversion is our first step in the preparation pipeline. This conversion reduces the complexity of the picture data by concentrating only on intensity variation rather than colour, which is essential for the further image processing stages. The grayscale conversion is fundamental because it eliminates colour distraction and enhances aspects like texture and form that are important for assessing plant health. Although the code snippets do not specifically demonstrate the process, converting an RGB image to grayscale usually entails averaging the colour channels or using a more complex formula to resemble human vision closely. Grayscale photos allow us to concentrate on the structural features of the leaves, which are essential for spotting deficits or illnesses in plant health monitoring.
3.2.2 Thresholding for binary mask creation
We use thresholding to produce a binary mask separating plant leaves from the backdrop after grayscale conversion. This step is essential to isolate the leaf areas of interest. Otsu’s thresholding approach is specifically utilized, autonomously ascertaining the ideal threshold value to distinguish the leaf pixels from the backdrop. The product is a binary picture with a black backdrop and white leaf regions. Our code uses threshold_otsu from the skimage.filters to determine this threshold value. The filter package is then applied to the grayscale picture. This procedure produces a binary mask that makes it possible to precisely separate the leaf from its surrounds, which is necessary for further feature extraction and analysis.
3.2.3 Morphological operations
Morphological techniques like closure are used to the binary mask to improve the segmentation further. These actions assist in connecting nearby items that belong to the same leaf but were divided by the thresholding process and filling in tiny gaps within the discovered leaf regions. Closing works exceptionally well to provide a more accurate reproduction of the leaf’s form and to smooth out the leaf’s outline. This is done in the preprocessing script using close from skimage.morphology and a structural element (or kernel) specified by square(3). By enhancing its quality, this procedure makes the binary mask a more dependable basis for obtaining significant characteristics from the leaf.
3.2.4 Clearing the border
The image’s border must be cleared to remove any noise or artifacts touching the edges during preprocessing. This method guarantees that the analysis concentrates only on characteristics entirely present in the picture, preventing errors brought about by partially present objects or irrelevant noise at the edges. To do this, use the clear_border method from skimage.segmentation eliminates any related elements that encounter the picture border. This step further cleans the binary mask to guarantee that the following analysis is predicated on distinct, unambiguous representations of the leaf.
3.2.5 Application of the preprocessed mask
Ultimately, the original (or suitably transformed) picture is applied with the preprocessed mask, which separates the leaf pixels from the surrounding pixels. To preserve just the pixels inside the leaf regions for additional examination, the binary mask is multiplied element by element with the original picture data in this application. The workflow assumes this step even if it is not shown in the given snippets since the separated leaf sections would be the main focus of the subsequent feature extraction and analysis procedures. Applying the binary mask guarantees that the leaf receives all the attention it needs, allowing for a more thorough and precise assessment of its health.
For the deep learning models to reliably estimate plant health based on the visual information retrieved from the photos, each of these preprocessing stages is essential to prepare the images for the rigorous analysis that comes next. Figure 5 shows the RGB images before the pre-processing is done. Here in these images, we can detect the white powdery spots on the leaves, which signifies the leaves have some disease.
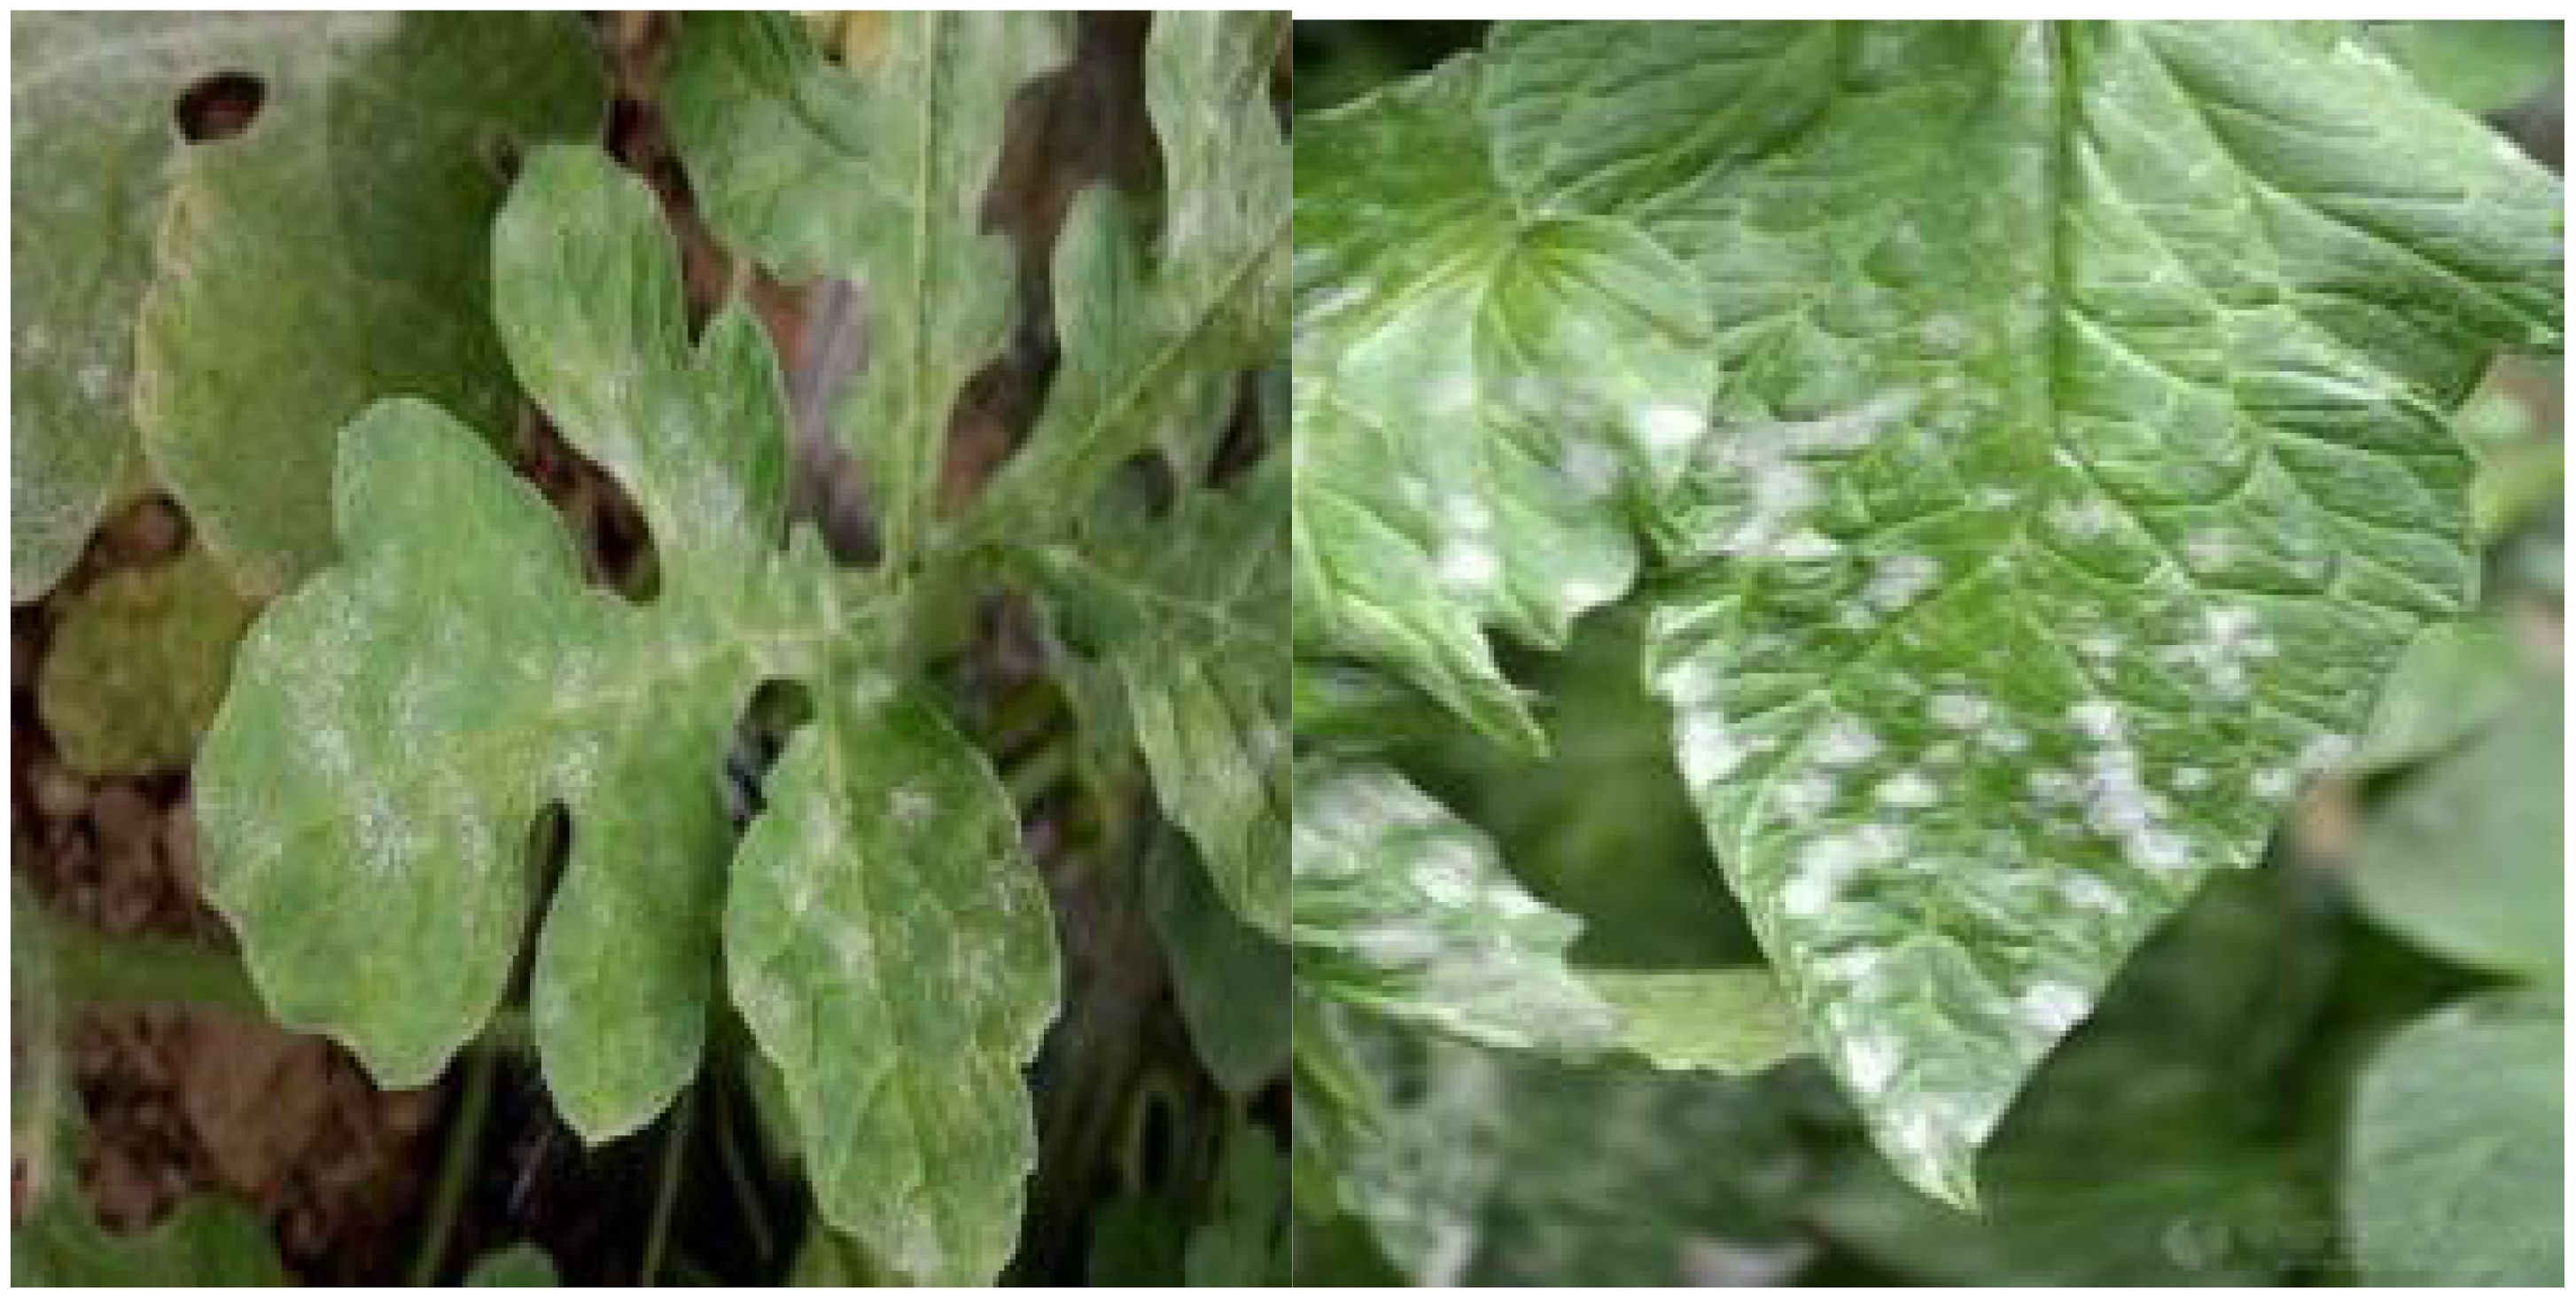
Figure 5. RGB images considered before pre-processing (Arun Pandian and Gopal, 2019; Huang and Chang, 2020).
3.3 Feature extraction with the models (VGG16, RestNet50, EfficientNet-B7)
3.3.1 VGG-16
In our research, the VGG-16 model is adapted as a crucial feature extractor within our pipeline because of its robust convolutional neural network architecture initially developed for image classification. By configuring VGG-16 without its top layers, focusing instead on its convolutional base, we harness the model to capture comprehensive feature maps from input images. The model, pre-trained with ImageNet weights, outputs data from its ‘block5_pool’ layer. This output offers a dense and insightful representation of the essential features of the images optimized for further processing. The procedure begins with the image preprocessing to fit VGG-16’s requirements. This includes resizing the image to 224x224 pixels, converting it to grayscale, and applying a binary threshold. Morphological operations are further employed to highlight significant areas within the image. The processed image is then converted into a 4D tensor and normalized, aligning it with the input specifications of the VGG-16 model, ensuring the data is in an optimal state for feature extraction. These extracted features serve as the input to our specially designed generator model, which includes layers that upscale the feature maps to simulate hyperspectral images with a desired spectral resolution of 31 bands. The generated hyperspectral images are then utilized to compute various spectral indices and features, including NDVI and Haralick texture features, which are essential for analyzing vegetation health. In summary, our work demonstrates an innovative application of the VGG-16 model, extending its use beyond traditional image classification to generate valuable hyperspectral simulations. These simulations are integral for scientific analysis and environmental monitoring, showcasing the versatility and adaptability of deep learning techniques in tackling real-world challenges in image processing and remote sensing.
Figure 6 illustrates VGG16’s architecture with 13 convolutional layers, 5 Max Pooling layers, and 3 Dense layers, totalling 21 layers. Remarkably, it employs 16 weight layers by repeating 3x3 convolution filters, 2x2 max pool layers, and consistent padding throughout, distinguishing itself with a focus on simplicity and effectiveness. The fully connected layers at the end culminate in a softmax layer for 1000-way ILSVRC classification.

Figure 6. VGG-16 architecture delineates the precise positioning of its diverse layers (Alatawi et al., 2022).
3.3.2 RESENET50
In our research, we have adapted the ResNet50 model, a sophisticated deep convolutional neural network, as a feature extractor for processing images aimed at spectral analysis and hyperspectral image simulation. The ResNet50 model, known for its deep architectural efficiency, was configured with pre-trained ImageNet weights, excluding its classification layers. This configuration targets the convolutional base of the model, particularly leveraging the output from the ‘conv5_block3_out’ layer. This specific layer was chosen for its capability to produce high-level, abstract representations of input images, capturing crucial feature maps essential for downstream processing tasks. The images undergo a rigorous preprocessing routine before feature extraction. This includes conversion to RGB format, grayscale transformation, application of a binary threshold, and execution of morphological operations such as closing and clearing borders. These steps significantly enhance the isolation of pertinent features while minimizing background noise. Subsequently, the images are formatted into a tensor suitable for ResNet50 through the `preprocess_input` function, standardizing the pixel values to fit the model’s input requirements. Upon preprocessing, the images are inputted into ResNet50, where the model extracts a dense feature map from the processed images. These extracted features are then utilized as inputs to a generator model designed to upscale the features and simulate a hyperspectral image encompassing multiple spectral bands. This innovative application underscores the versatility of the ResNet50 model, demonstrating its extension beyond traditional image classification to facilitate advanced tasks like environmental monitoring and analysis within our research framework.
ResNet-50 is a version of ResNet, a convolutional neural network with 50 layers. This includes 48 convolution layers, one MaxPool layer, and one Average Pool layer. We can see how ResNet-50 is structured in detail in Figure 7. ResNet operates on a deep residual learning framework, effectively tackling the problem of vanishing gradients that often occur in intense networks. Despite its depth of 50 layers, ResNet-50 has over 23 million trainable parameters, fewer than many other network architectures.
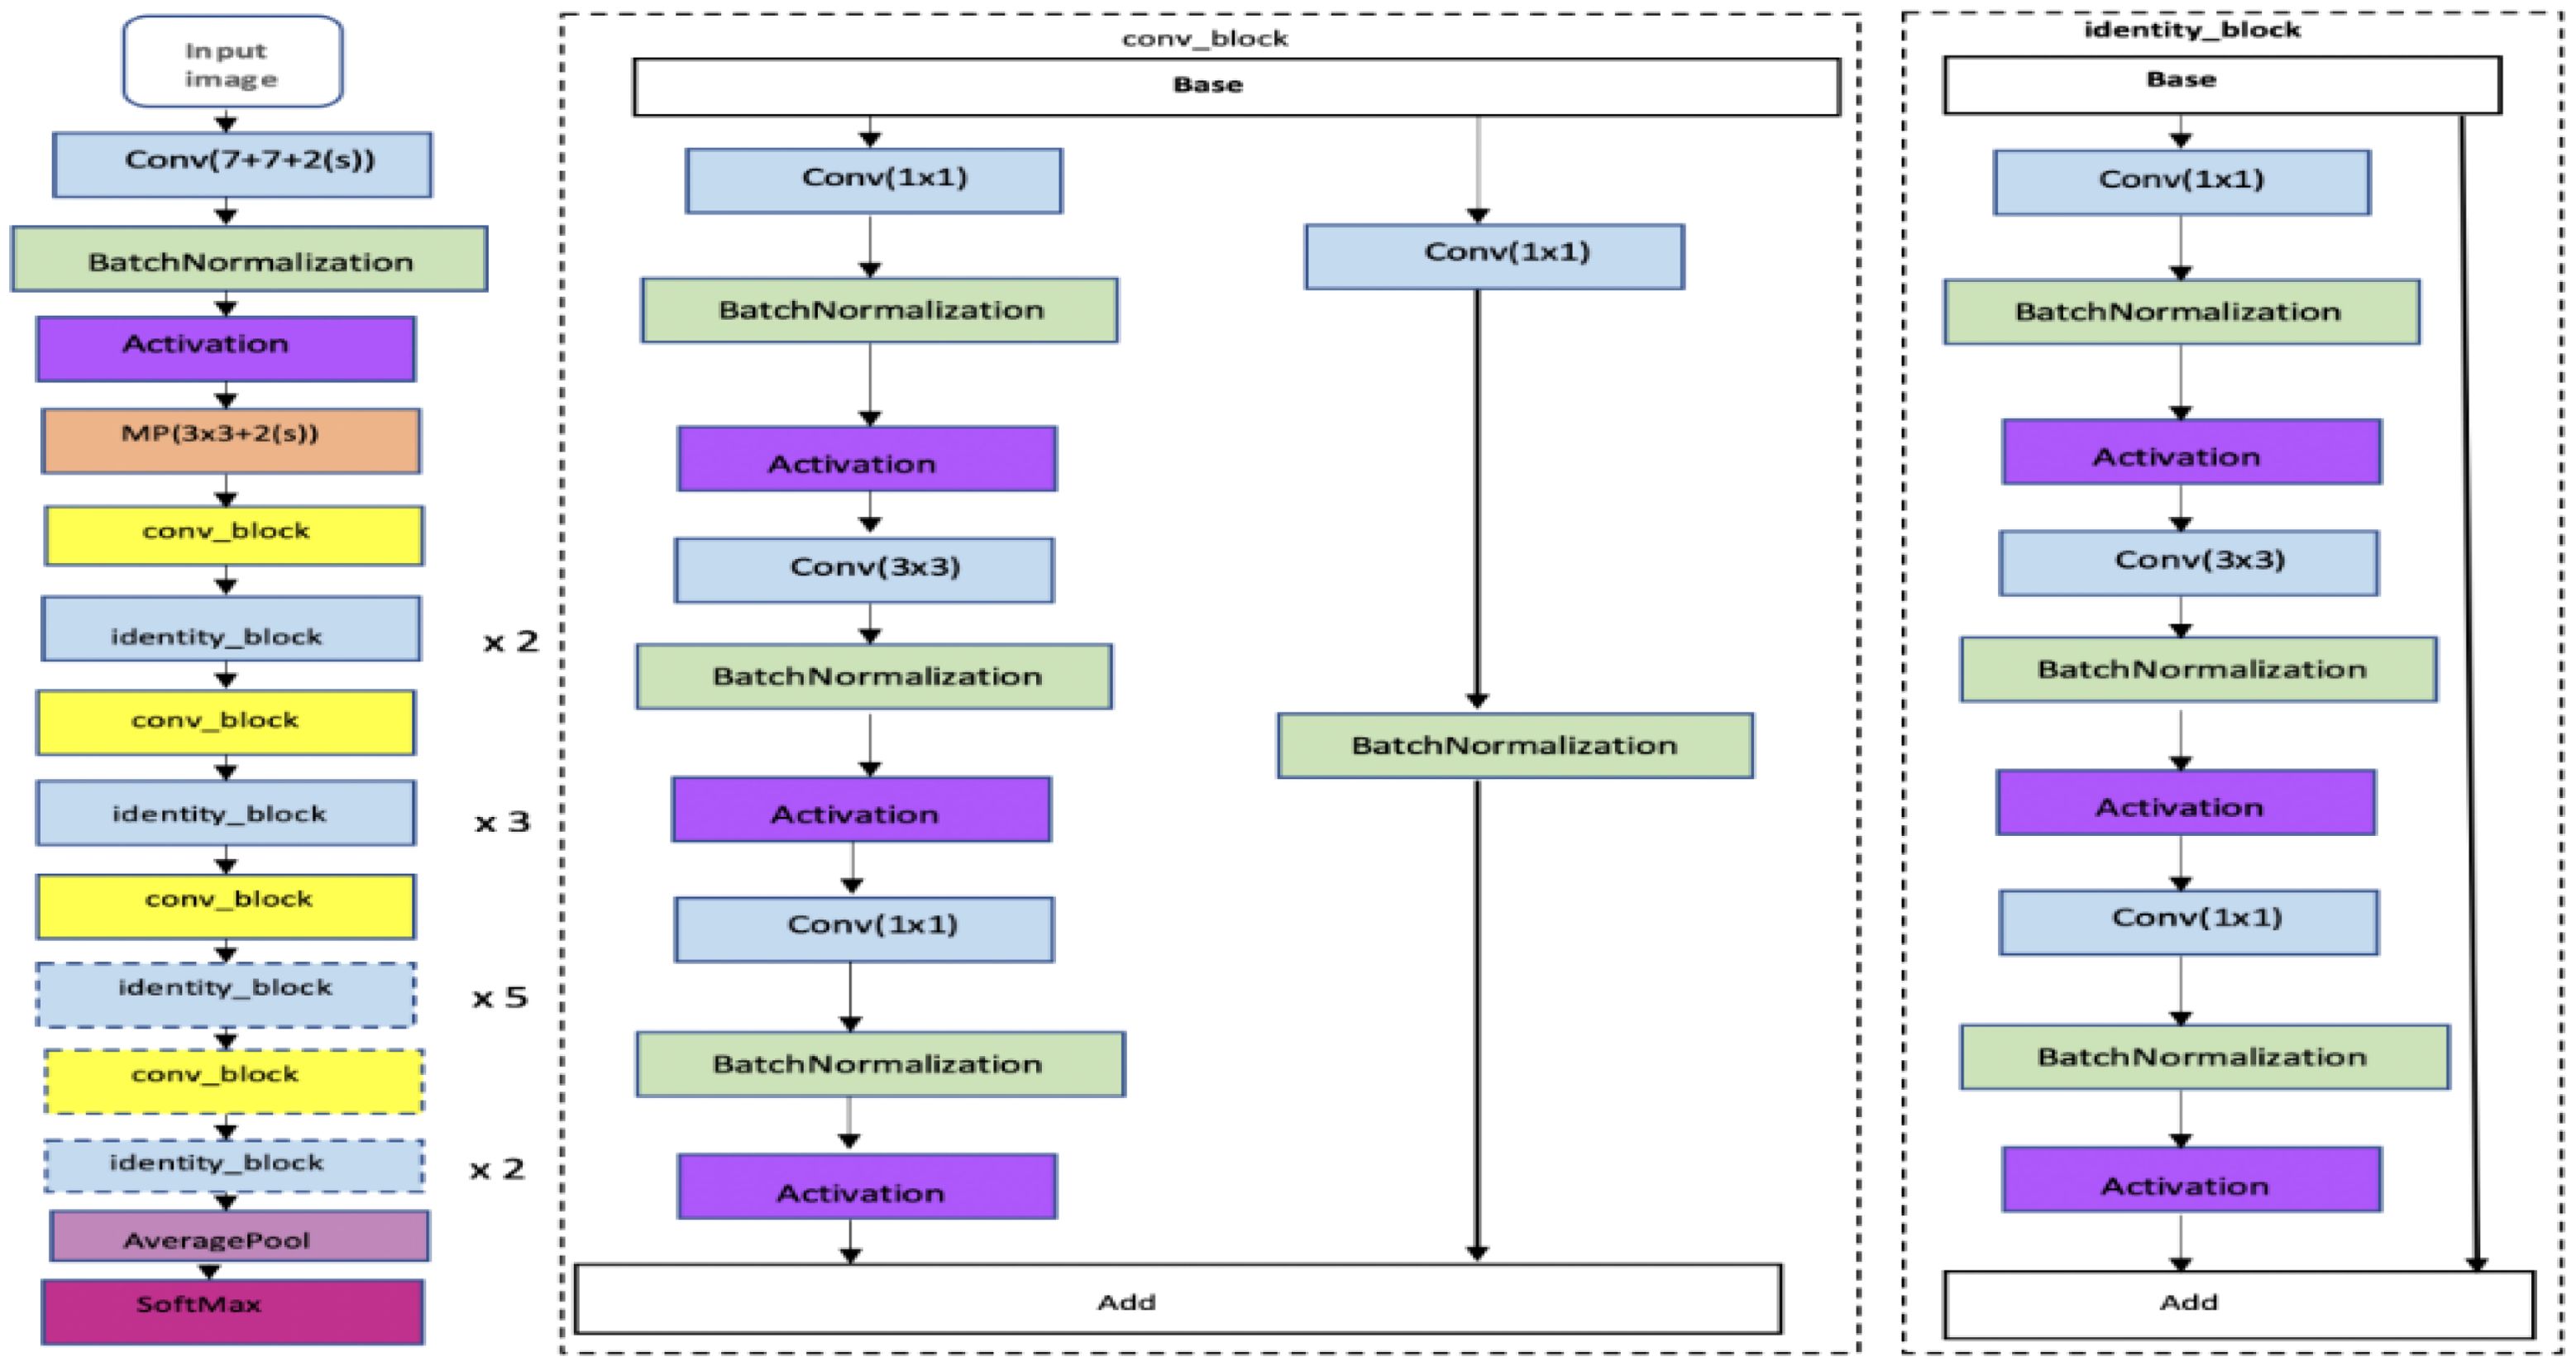
Figure 7. RESNET Architecture (Mandal et al., 2021).
3.3.3 EFFICIENTNET-B7
Our study utilized the EfficientNet B7 model as a feature extractor to enhance our image processing capabilities. Initially designed for high-efficiency performance, this model was adapted for our purposes by loading it with pre-trained ImageNet weights and turning off its classification layers (include_top=False). We specifically harness the output from the ‘top_activation’ layer, which provides a sophisticated feature map that captures detailed and abstract aspects of input images crucial for our analysis. The methodology begins with an extensive preprocessing of images. This involves converting the photos to RGB format, transitioning them to grayscale, and applying binary thresholding. Additionally, morphological operations are employed to further refine the focus on pertinent features while minimizing background interference. These images are then standardized through the preprocess_input function to meet the specific input requirements of EfficientNet B7.
Following preprocessing, these images are inputted into EfficientNet B7, which processes them to extract dense and informative feature maps. These extracted features are fed into a custom-built generator model with convolutional transpose layers. This model is engineered to upscale the feature maps and simulate hyperspectral images containing multiple spectral bands. This simulation is critical as it replicates the data captured by actual hyperspectral imaging, providing a foundation for detailed spectral analysis. This approach demonstrates the versatility and robustness of the EfficientNet B7 model beyond its conventional applications. By adopting this advanced neural network architecture, we enable more sophisticated analyses of environmental data, underscoring the model’s adaptability and efficacy in handling complex tasks in ecological monitoring and beyond. This integration marks a significant advancement in our research methodology, pushing the boundaries of what can be achieved with existing deep learning technologies.
EfficientNet models are built using a straightforward yet highly effective scaling method that allows the network to be enlarged as needed while being resource-efficient. This method makes these models particularly good at adapting to different tasks using transfer learning, where a model developed for one task is tweaked to perform another. EfficientNet has several versions, labelled B0 to B7, with the complexity and number of parameters varying from 5.3 million in the simplest version to 66 million in the most complex. Our research will focus on using EfficientNet-B7, and we can see its design in Figure 8.
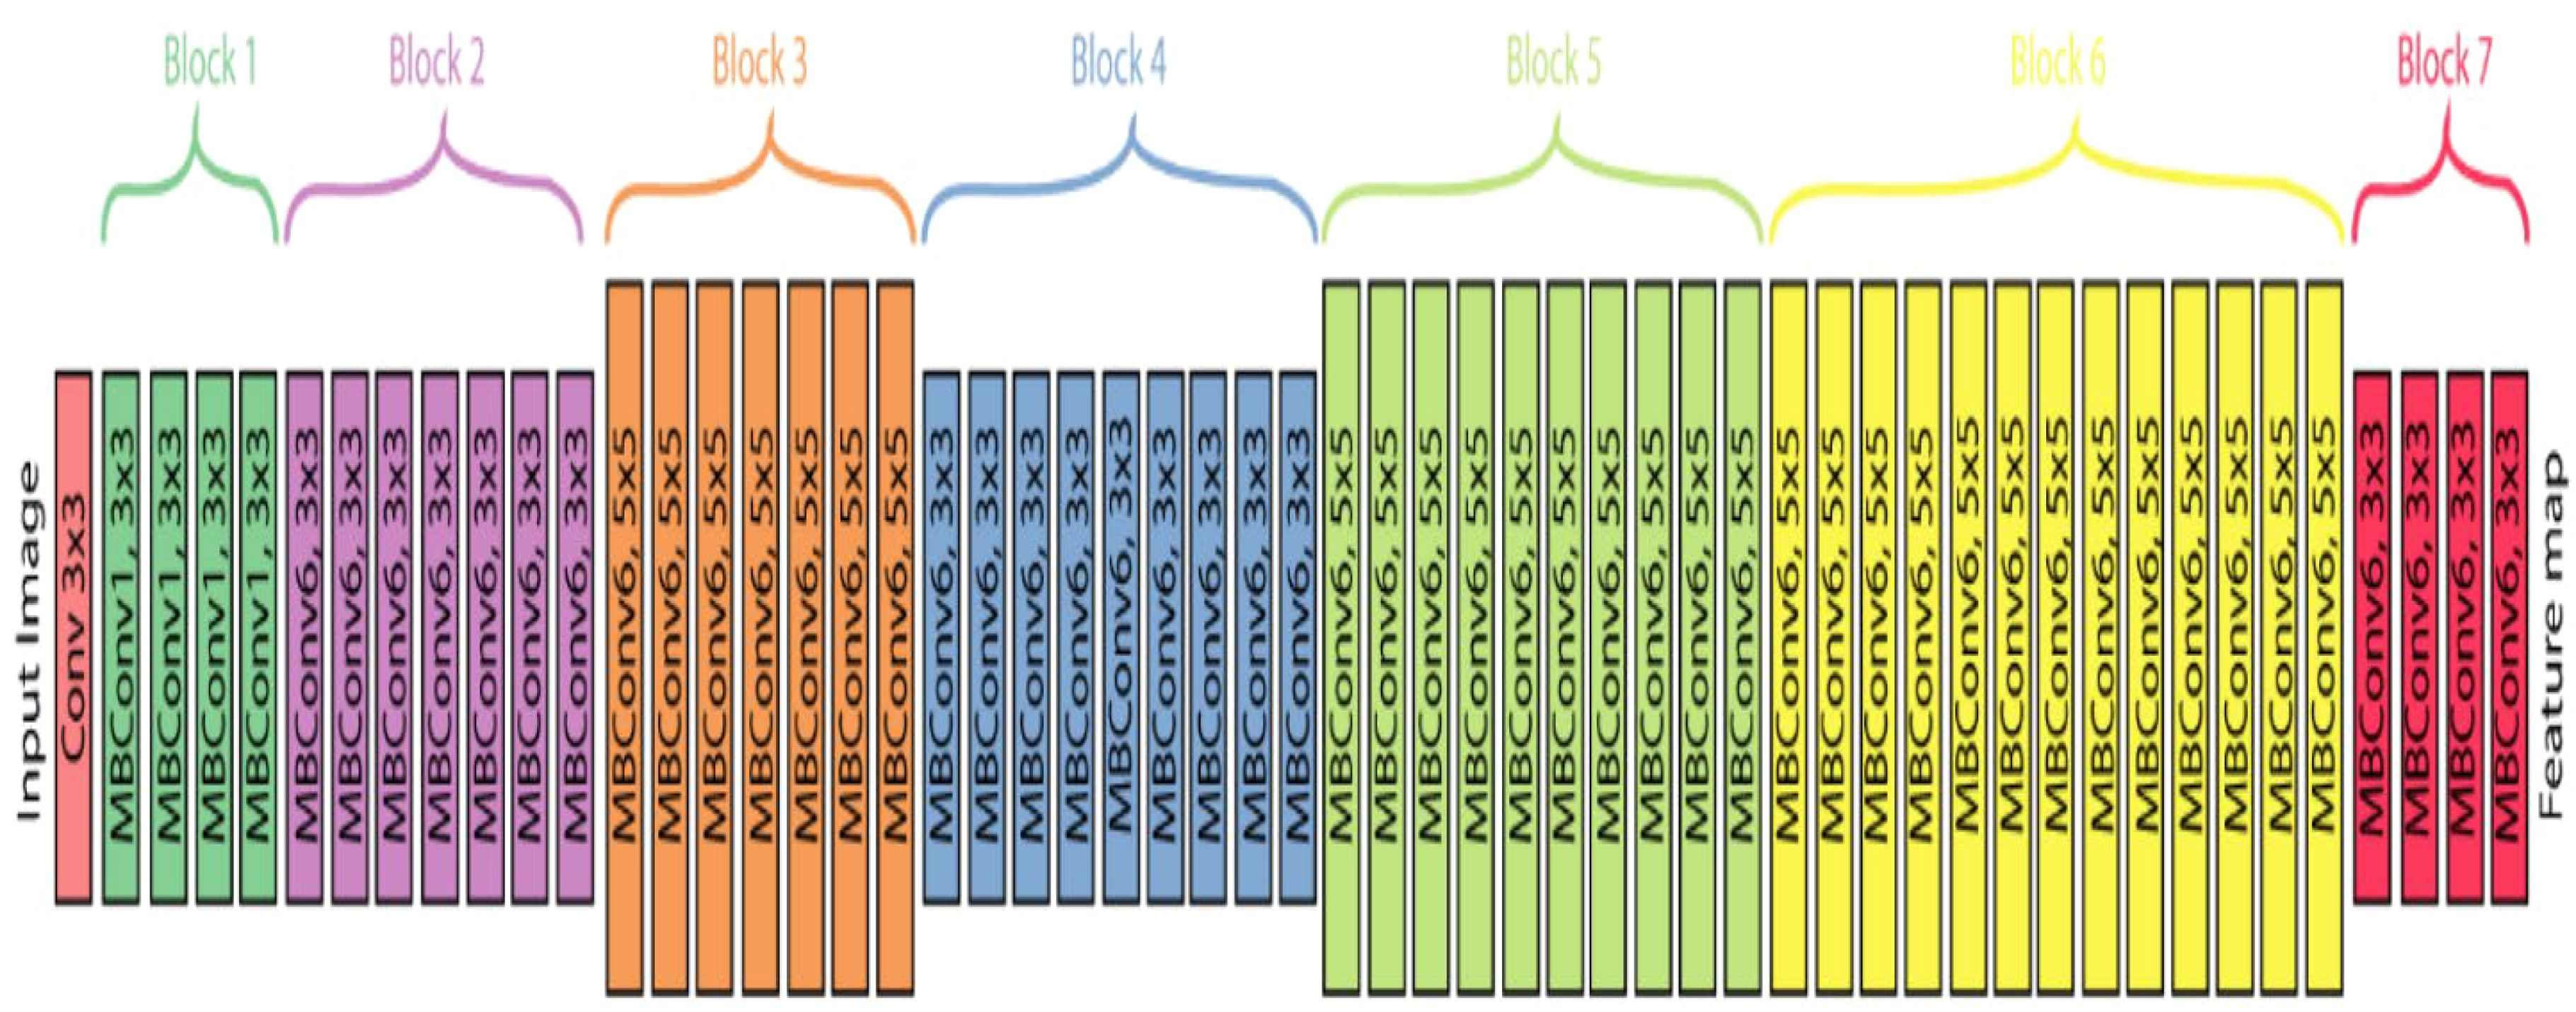
Figure 8. EfficientNet-B7 Architecture (Adinegoro et al., 2023).
3.4 Generating SHSI with a neural network generator
Our study cleverly uses a deep learning-driven technique to bridge the gap between the worlds of ordinary RGB photography and the subtle spectrum insights of hyperspectral imaging. By converting RGB photos into Simulated Hyperspectral photos (SHSI), this creative method successfully opens a wealth of information about plant health. By editing of normal RGB photos to imitate SHSIs over a spectrum of 237 bands far beyond the visual range, we explore the health indicators of the plant that were previously only accessible through sophisticated hyperspectral cameras. The key to our approach is the careful feature extraction from VGG16, RestNet50, and EfficientNet-B7, which sets the stage for the intricate reconstruction that a bespoke neural network generator performs. This generator is skilled at transforming the retrieved features into SHSIs that capture intricate spatial and spectral information. It has been optimized with convolutional layers, batch normalization, and smart up sampling. Our technique is calibrated to generate SHSIs with a resolution of 1392x1300 pixels and a spectral range of 400 to 700 nm, using 31 spectral bands, to meet analytical requirements. This sophisticated modelling of hyperspectral data from RGB photos not only increases the accessibility of hyperspectral analysis but also dramatically improves the capacity to track plant health, identify illnesses early, and carry out extensive agricultural operations. The algorithm implements this process by coordinating a smooth transition from capturing high-resolution RGB images to creating SHSIs. To maximize computing performance, it uses batch processing. The result is saved in NPY format, which guarantees the integrity of the simulated hyperspectral data for use in future research. In addition, the code uses explicit memory management techniques to maintain the simulation process over massive datasets without sacrificing system performance, considering the computational intensity.
Figure 9 illustrates the structure of Generative Adversarial Networks (GAN) and their computational techniques. In our work, the generator model is specifically crafted to take features extracted from RGB images, obtained through the pre-trained models mentioned above and transform them into simulated hyperspectral images. The generator employs convolutional layers, batch normalization, and up-sampling to produce realistic hyperspectral-like representations. This innovative approach provides valuable insights into the spectral characteristics of powdery mildew-infected tomato plants, contributing to a comprehensive understanding of disease severity.
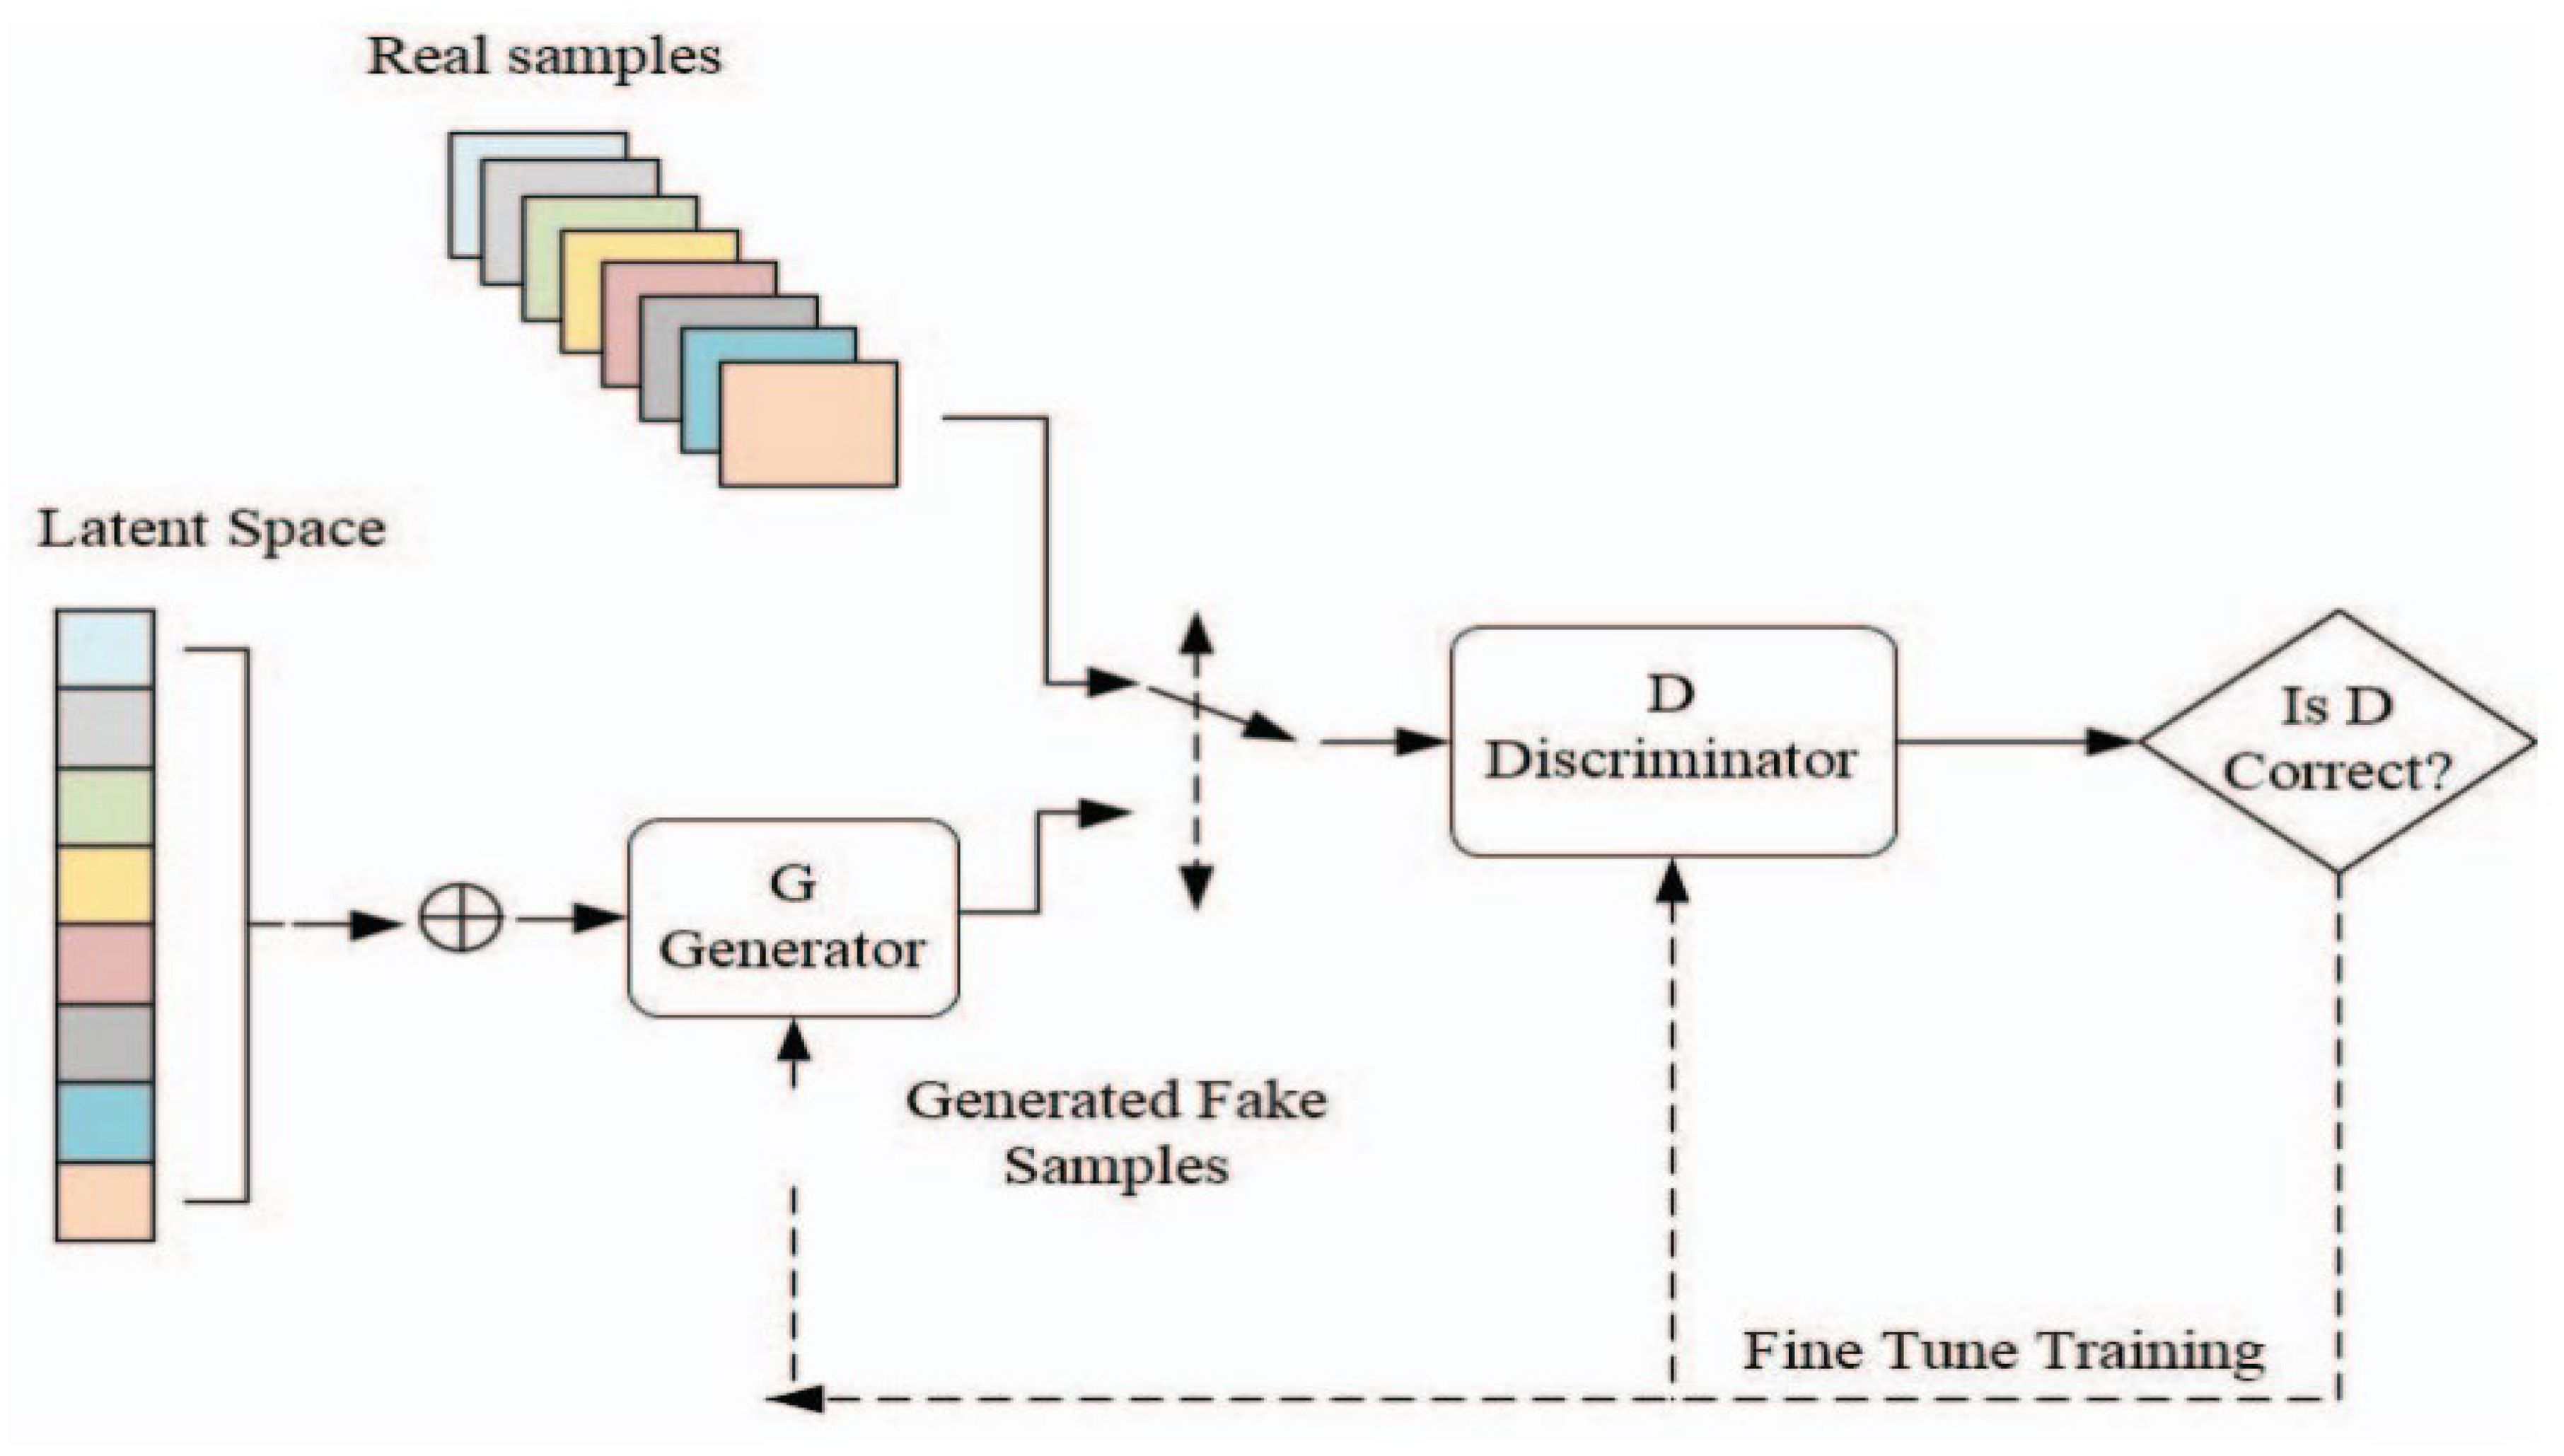
Figure 9. The architecture of a Generative Adversarial Network (GAN) (Gonog and Zhou, 2019).
3.5 Comparing the generated HSI and metrics determination
In our study, we evaluate the capability of simulated Hyperspectral Images (HSIs) generated from RGB images, utilizing three distinct deep-learning models as feature extractors: VGG16, ResNet50, and EfficientNetB7. Each model has been carefully integrated into our pipeline to analyze their effectiveness in capturing and reproducing the complex spectral characteristics inherent in HSIs.
To ensure an accurate assessment, we first resize each simulated HSI generated by these models to match the exact spatial and spectral dimensions of the original HSIs (Pushparaj et al., 2021). This step is crucial as it allows for a direct and fair comparison between the simulated and actual HSIs. Following resizing, the HSIs are transposed to correctly align their spectral bands with those of the original data, ensuring that each spectral component is compared against its authentic counterpart.
The prepared HSIs from each model are aggregated into separate arrays, facilitating efficient batch processing for the evaluation phase. We employ two primary metrics to evaluate the accuracy of the simulations across all three models: Mean Absolute Error (MAE) and Root Mean Square Error (RMSE). MAE measures the average magnitude of errors across all pixels and bands, providing a straightforward assessment of the average error per pixel and band. Conversely, RMSE is particularly effective at highlighting more significant errors, as it squares the discrepancies before averaging, thus emphasizing the most critical errors in the simulations. MAE (Equation 1) and RMSE (Equation 2) formulas to determine the values.
Where n is the number of data points or observations, is the actual value of the ith observation, is the predicted value of the ith observation. Before calculating these metrics, we perform a rigorous check to ensure that the dimensions of the predicted and actual HSI stacks are consistent across all models. Any dimensional inconsistency triggers a Value Error, preventing the computation of misleading metrics and ensuring that our comparisons are based on correctly aligned data. Once confirmed, MAE and RMSE are computed for each model’s output to quantitatively assess how closely each set of simulated HSIs approximates the original hyperspectral data. This comprehensive comparison and metric calculation allow us to evaluate and document the performance of each model rigorously.
This approach ensures a robust evaluation of the models’ effectiveness in generating hyperspectral data from more straightforward RGB images, providing clear, quantitative insights into the fidelity and precision of our hyperspectral image simulations. The results from these metrics are vital, as they contribute significantly to understanding the capabilities and limitations of each employed model in the context of hyperspectral imaging technology.
3.6 Computing spectral and haralick features of the generated images
Our research employed three feature extraction models, namely VGG16, ResNet50, and EfficientNetB7, to generate hyperspectral images from RGB input. These generated images were then subjected to computational analysis to extract key metrics. First, we computed the Normalized Difference Vegetation Index (NDVI) from the generated hyperspectral images. NDVI is a widely used metric for assessing vegetation health, calculated as the normalized difference between the near-infrared (NIR) and red spectral bands. Additionally, we computed various spectral indices, such as the Enhanced Vegetation Index (EVI), which integrates additional spectral bands to improve sensitivity to vegetation characteristics and atmospheric corrections. The formula (Equation 3) calculates the NDVI values:
Where NIR is the Near-Infrared reflectance value, Red is the Red reflectance value. Moreover, we calculated Haralick texture features from the grayscale versions of the generated hyperspectral images to characterize surface textures. These texture features, derived from the gray-level co-occurrence matrix (GLCM), provided insights into surface homogeneity, contrast, and other textural attributes. This comprehensive analysis allowed us to assess vegetation health and surface characteristics across different areas using the generated hyperspectral images from the feature extraction models.
4 Results
The experiments were conducted on an HP Pavilion Gaming Laptop model 16-a01xxx featuring an Intel(R) Core (TM) i7-10870H CPU running at a base frequency of 2.20GHz and a maximum Turbo Boost speed of 2.21GHz. The system was equipped with 16.0 GB of RAM, with 15.8 GB usable for efficient processing during the experimental procedures. Operating under a 64-bit architecture, the system type was classified as x64-based. This hardware configuration provided a robust and capable computing environment for the execution of the experiments, ensuring optimal performance and reliable results.
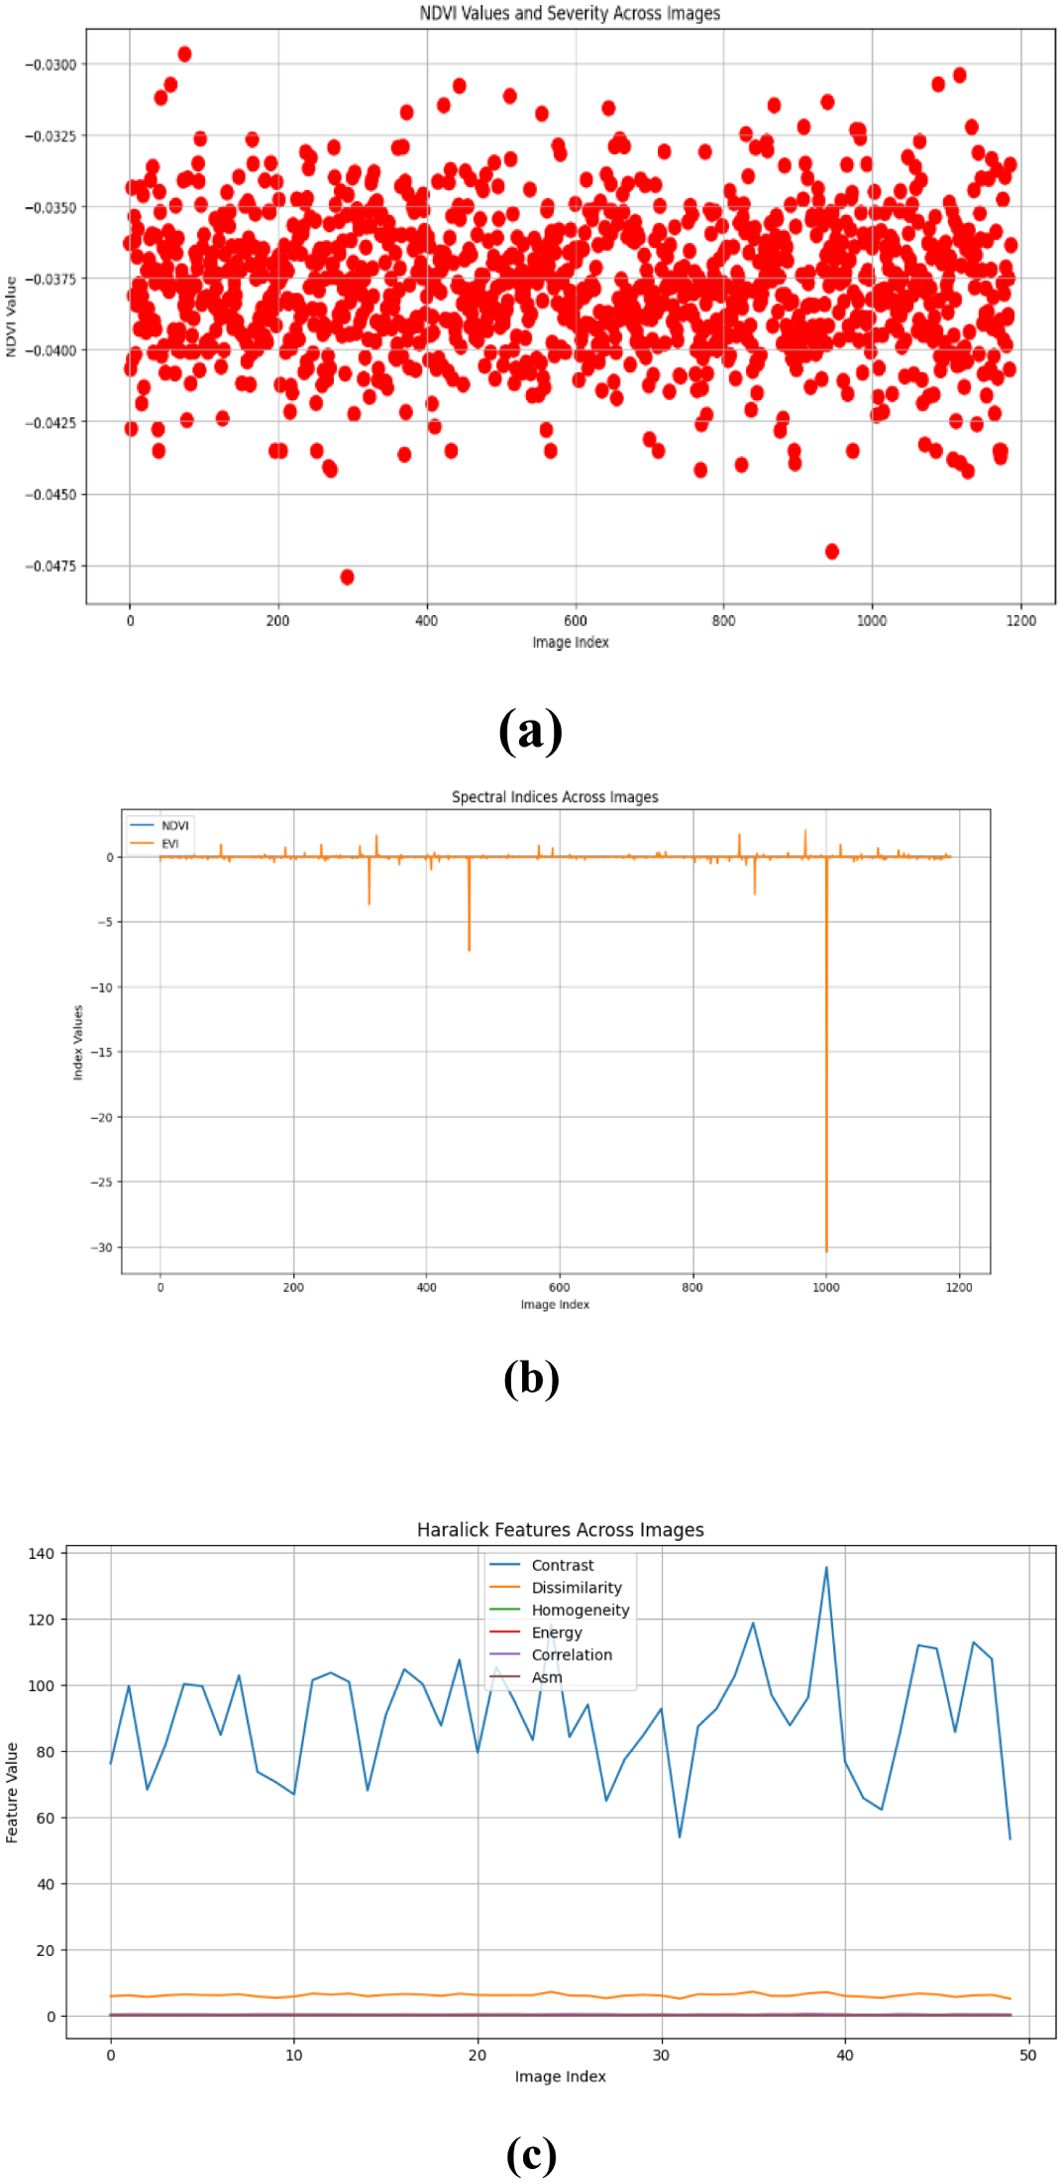
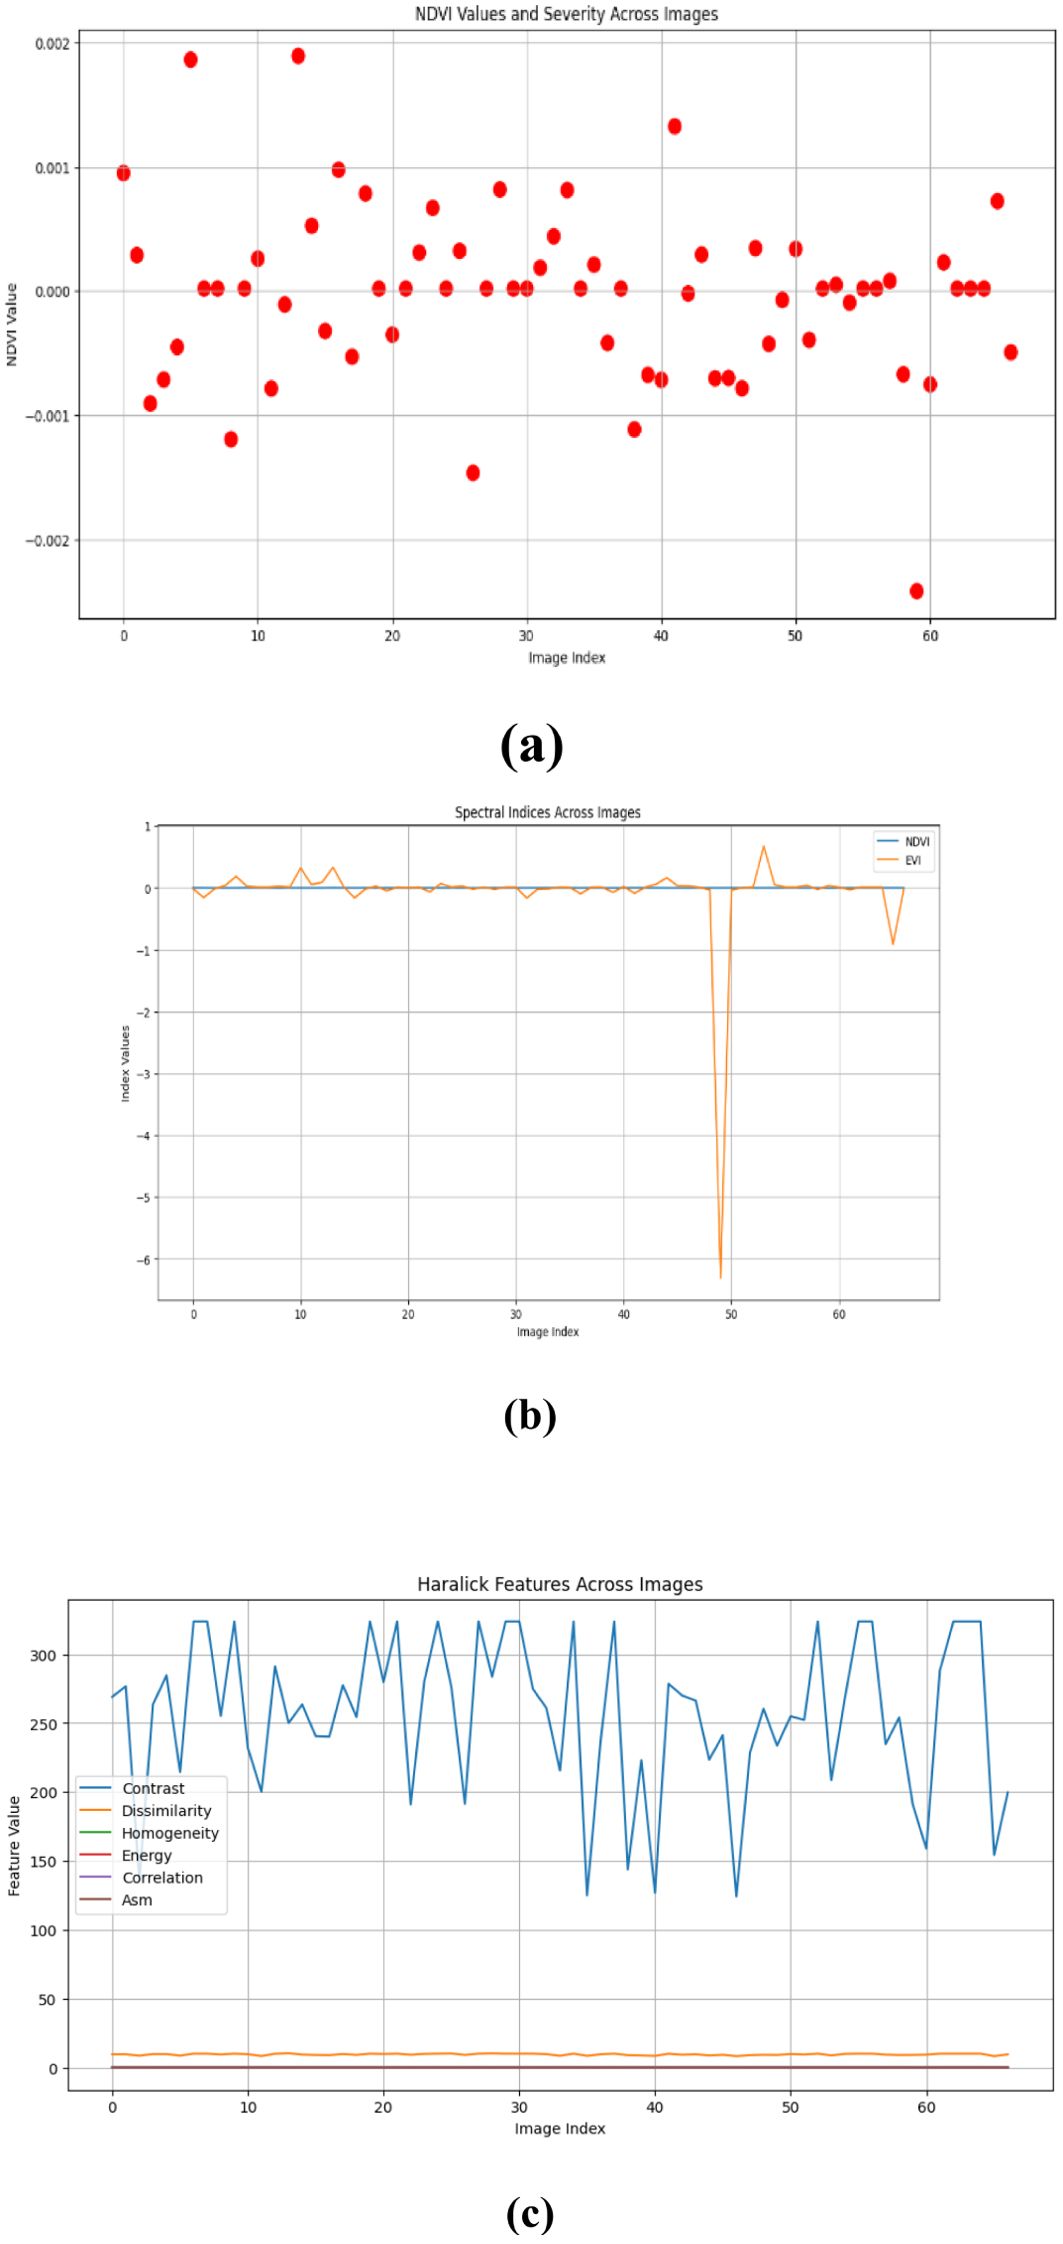
Table 1 compares the Mean Absolute Error (MAE) and Root Mean Square Error (RMSE) values obtained from the three feature extraction models, namely VGG16, ResNet50, and EfficientNetB7, for both healthy and diseased images. These metrics indicate the accuracy and robustness of the models in generating hyperspectral images from RGB inputs. For healthy images, the MAE and RMSE values provide insights into the discrepancy between the actual and generated hyperspectral images, with lower values indicating better performance. Similarly, for diseased images, the MAE and RMSE values reflect the accuracy of the models in capturing spectral features indicative of disease presence. A comparative analysis of these metrics across the three feature extraction models allows us to assess their effectiveness in capturing spectral information relevant to healthy and diseased vegetation. The table provides a comprehensive overview of the performance of each model, facilitating informed decisions regarding their suitability for specific applications in vegetation health assessment and disease detection, as described below.
i. VGG-16 Model:
The VGG-16 model consistently performed with a slight variation in MAE between healthy (364.78) and diseased (364.80) images. This indicates a stable ability to predict spectral data from RGB images regardless of the plant’s health condition. The RMSE values for healthy and diseased images were identical (430.47), suggesting that the error distribution was uniform across different health conditions.
ii. ResNet50 Model:
ResNet50 showed a marginally higher MAE for diseased images (364.82) than healthy ones (364.79). This slight difference implies that the model is slightly more challenged by diseased images, potentially due to the increased variability in spectral features caused by disease symptoms. The RMSE values were close but showed a slight increase for diseased images (430.49) compared to healthy ones (430.47). This indicates a slightly higher prediction error for diseased images.
iii. EfficientNet-B7 Model:
EfficientNet-B7 exhibited the lowest MAE for diseased images (364.78) and maintained a similar value for healthy images (364.79). This suggests that EfficientNet-B7 is highly effective in handling healthy and diseased spectral data. The RMSE for diseased images (430.46) was the lowest among the models, highlighting EfficientNet-B7’s superior performance in minimizing prediction errors for diseased conditions.
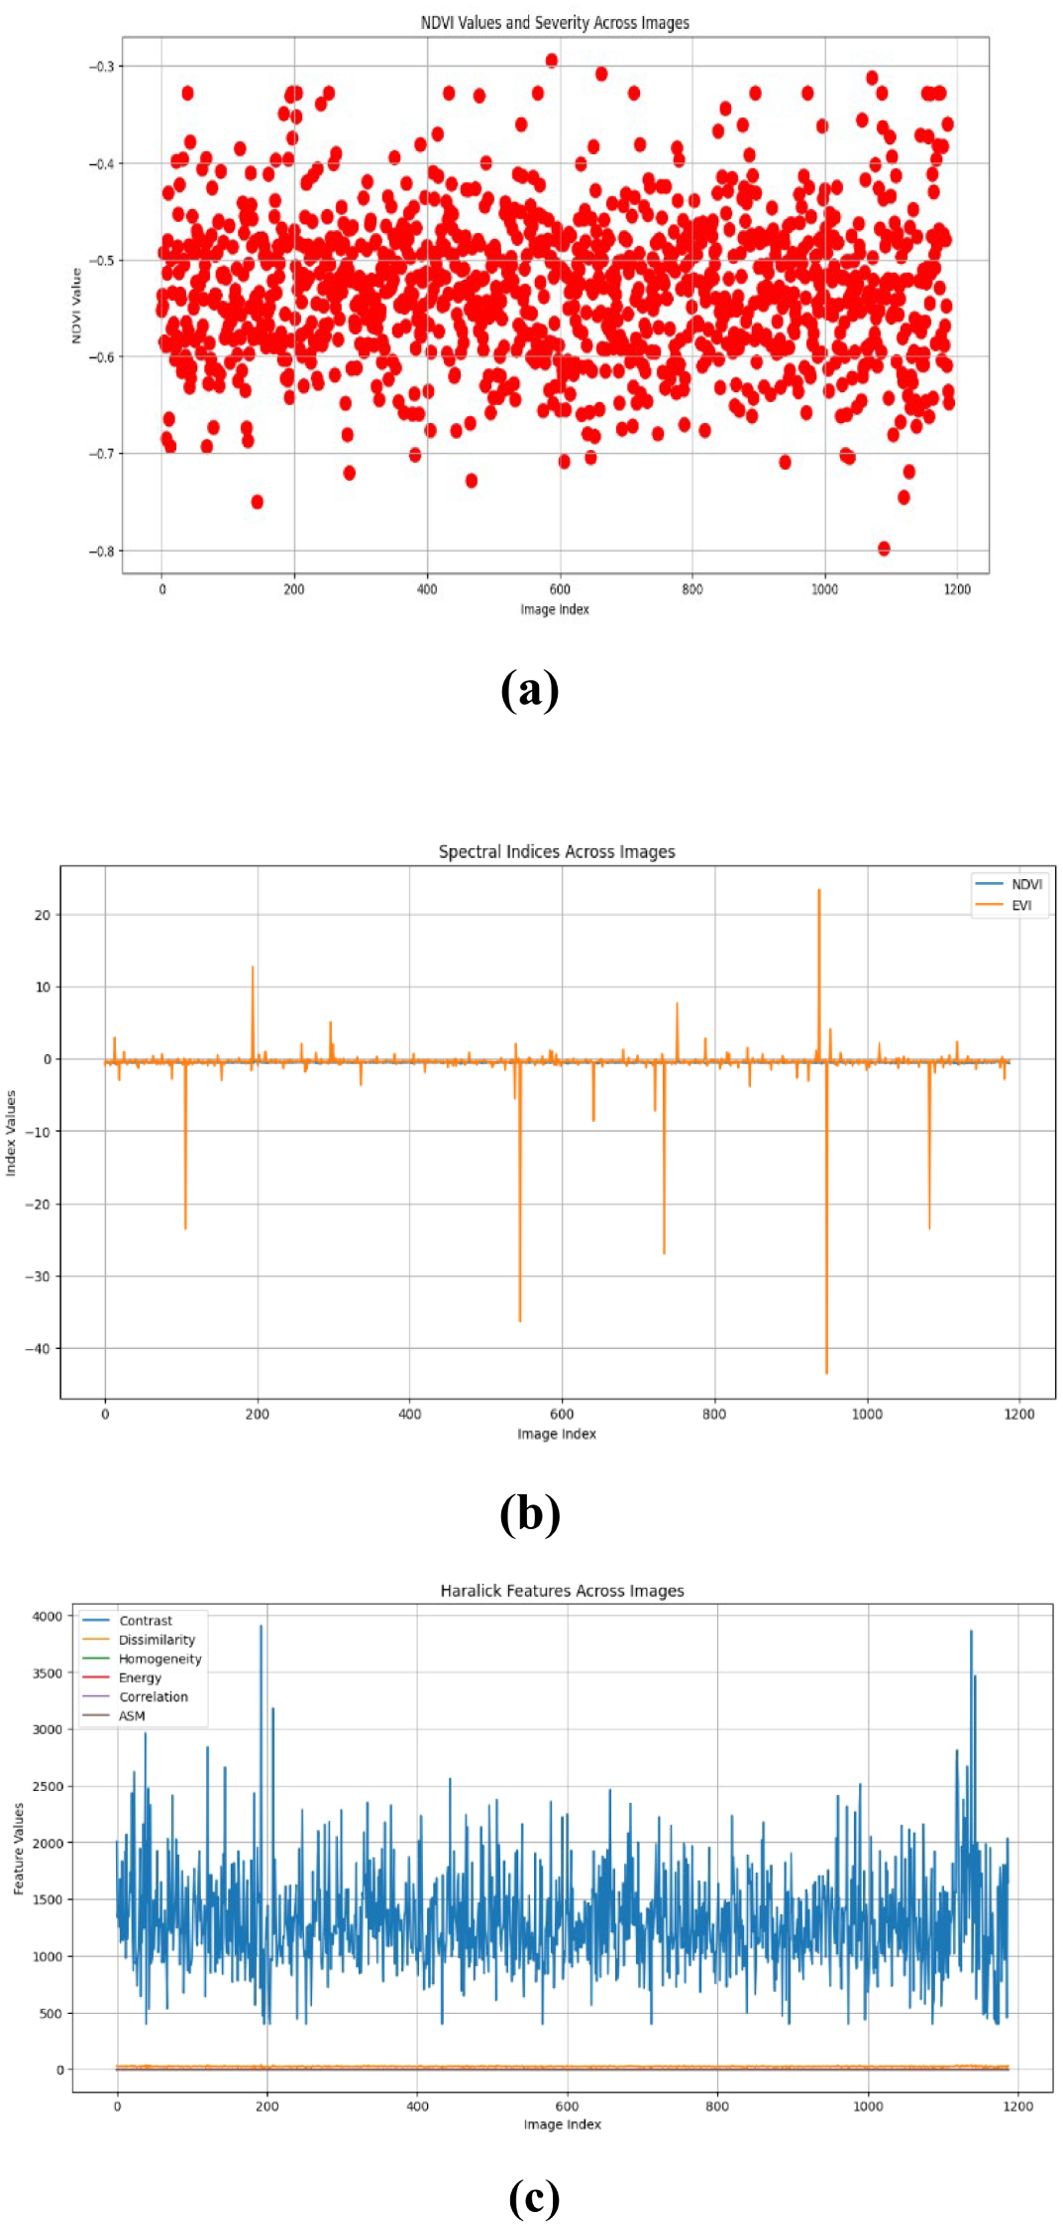
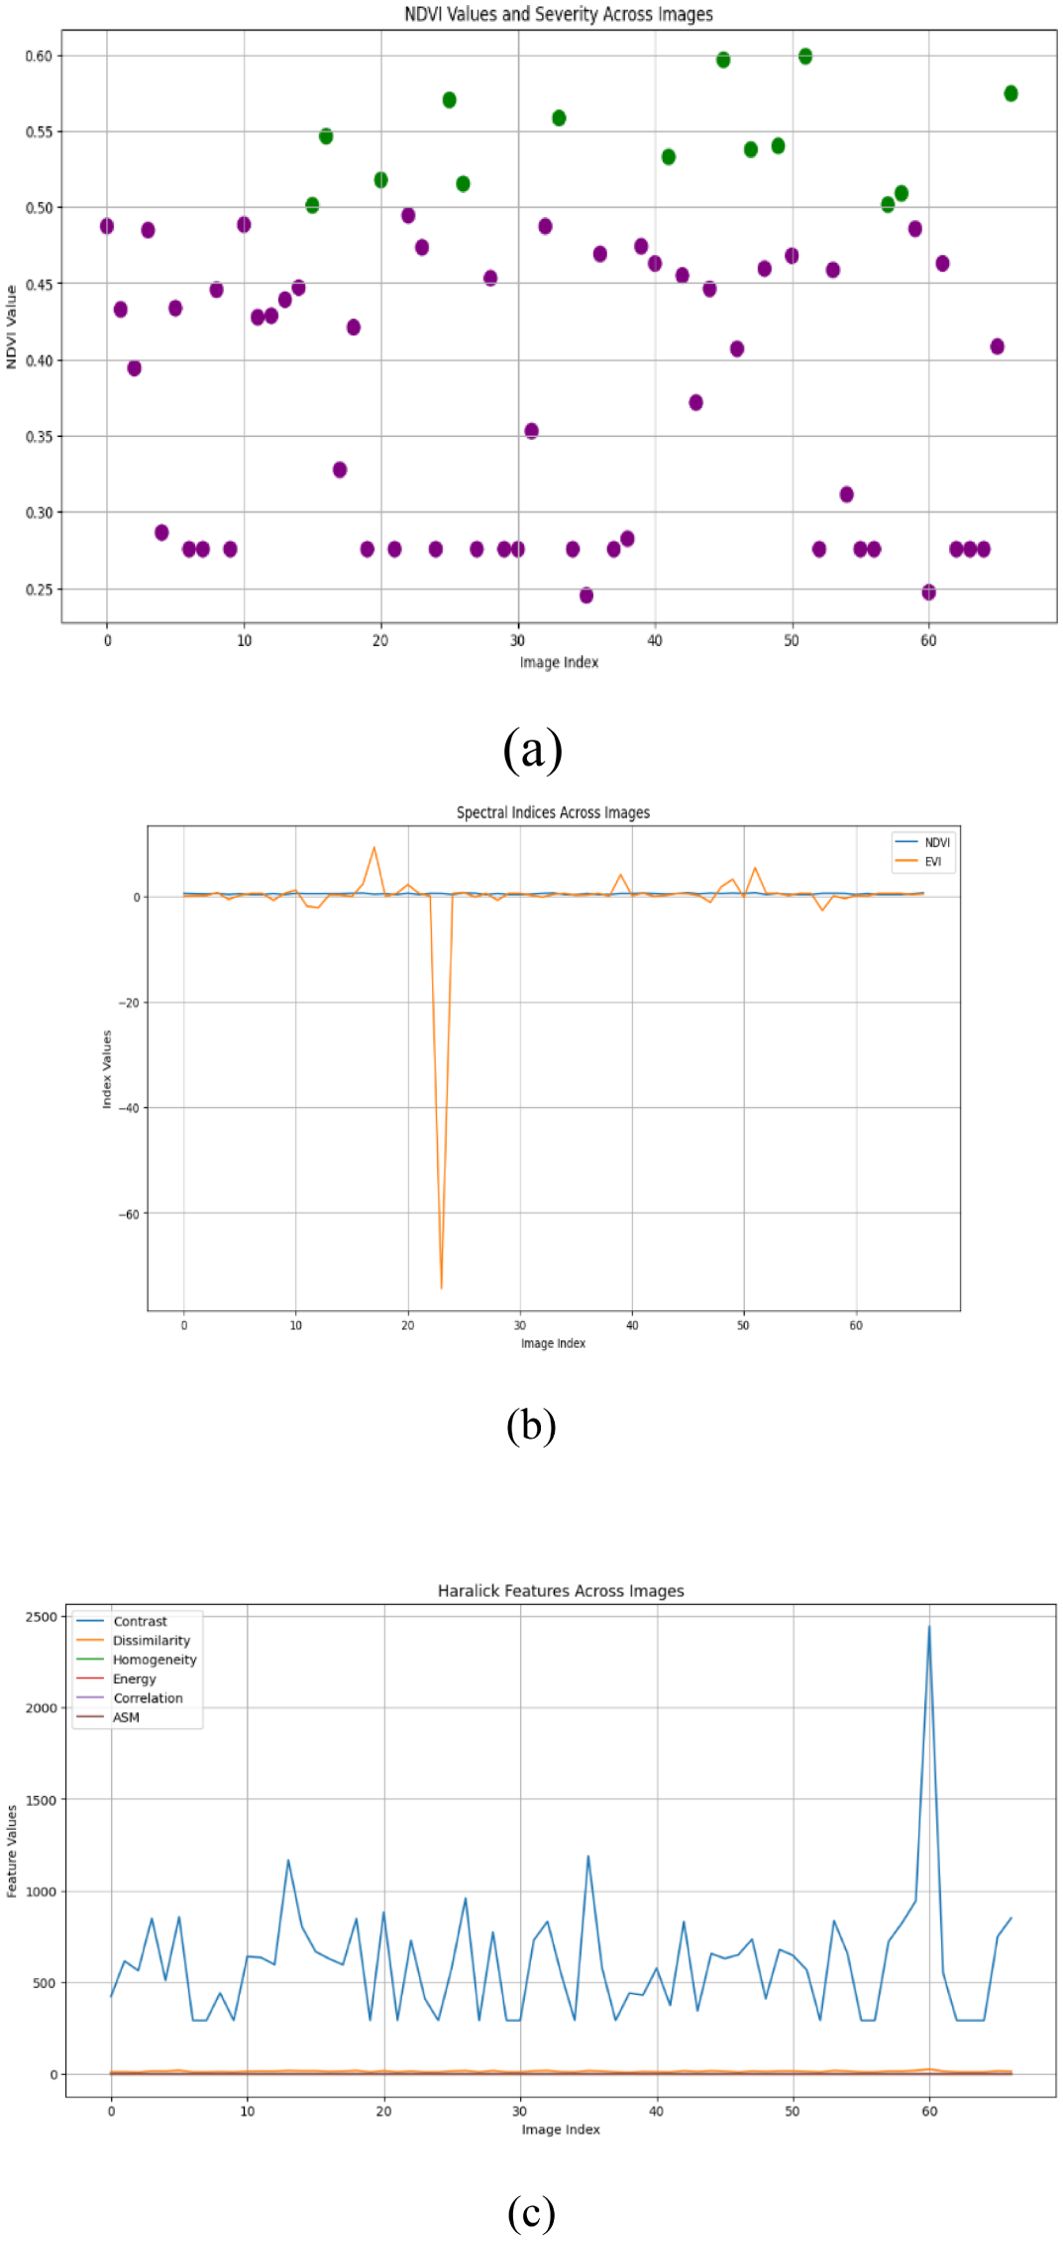
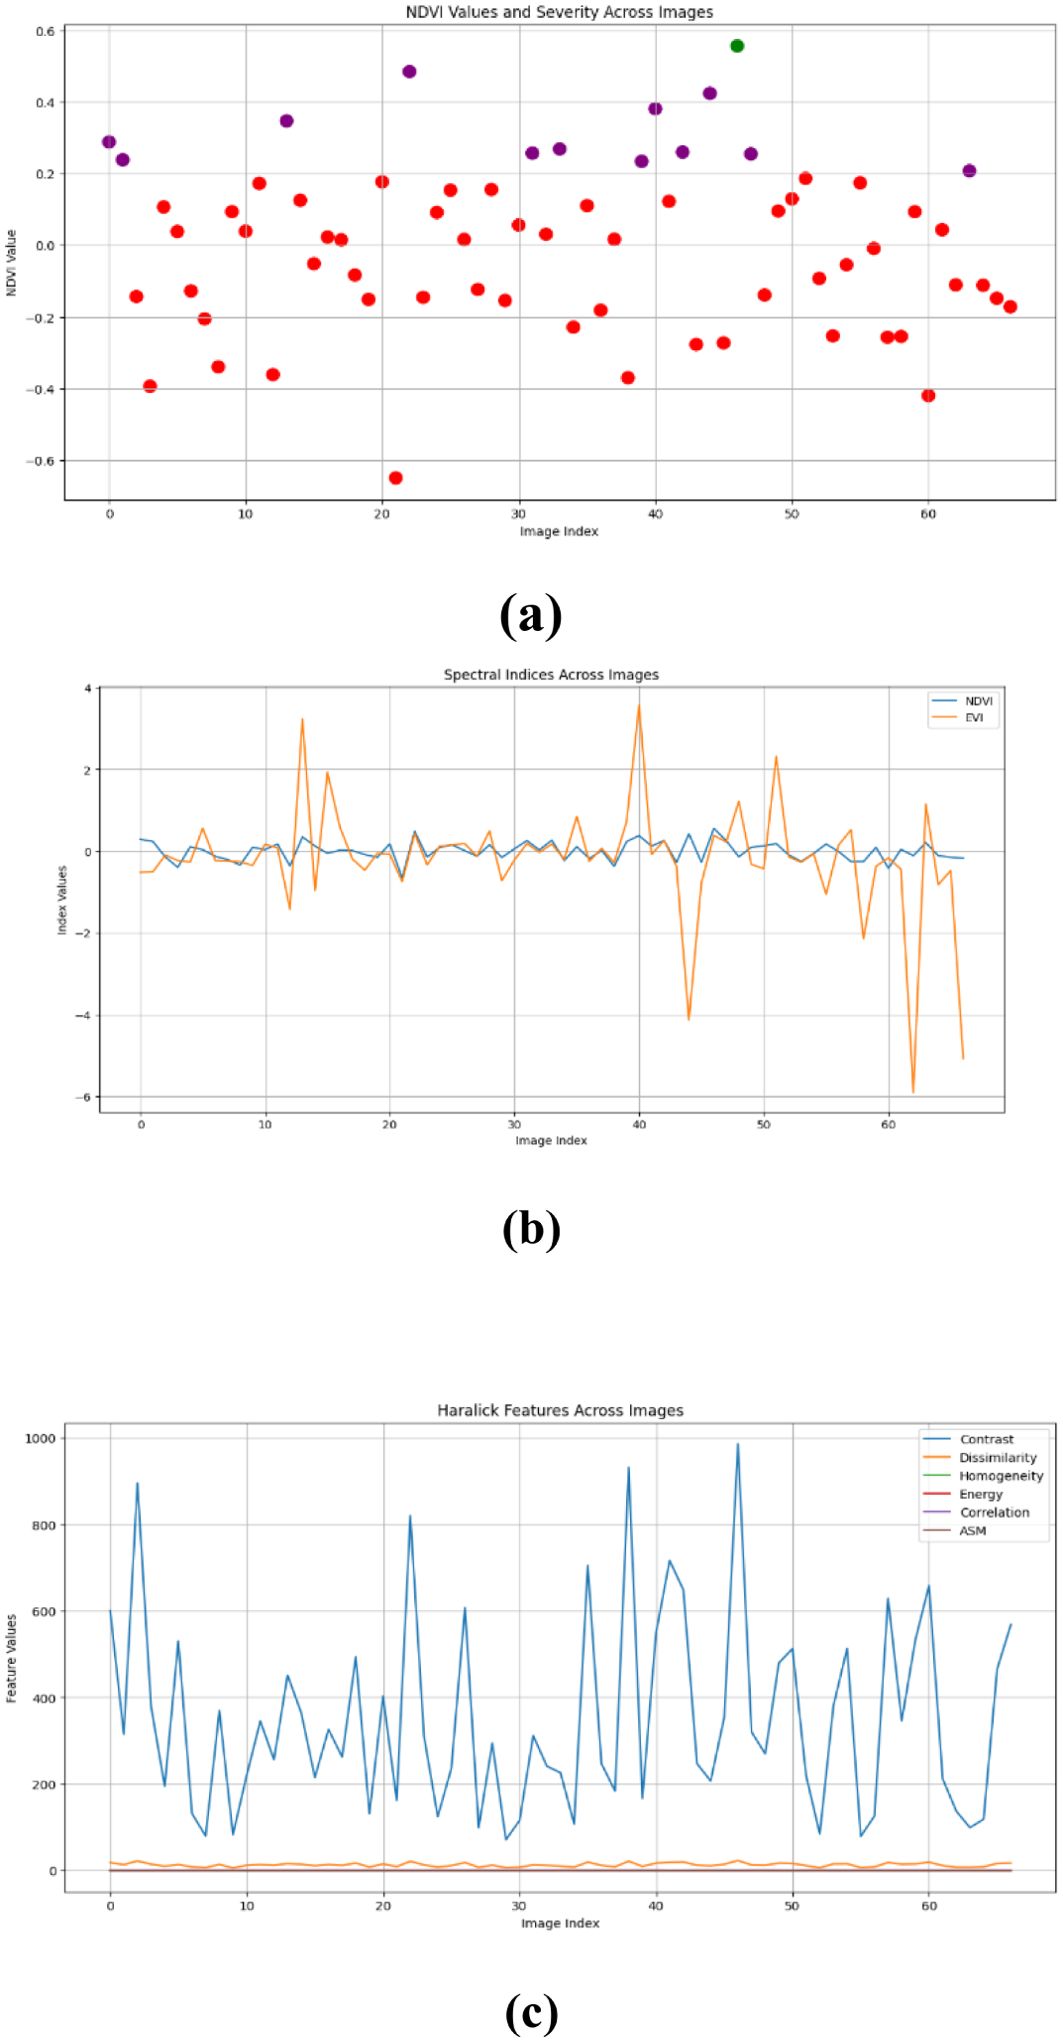
Figures 10–15 are a series of graphs showcasing the NDVI, spectral indices, and Haralick features for healthy and diseased images. These visuals correspond to three distinct feature extraction models: VGG16, ResNet50, and EfficientNetB7. These graphs offer a detailed glimpse into the spectral characteristics captured by each model, shedding light on vegetation health assessment and disease detection. The NDVI graphs reflect the health status of vegetation, with higher values indicating better health. Spectral indices graphs reveal the distribution of critical spectral features relevant to vegetation conditions, aiding in identifying disease signatures. Additionally, the Haralick features graphs illustrate textural patterns extracted from hyperspectral images, providing insights into vegetation health through texture analysis. These visual representations offer valuable insights into the performance of each model, helping researchers and practitioners understand their suitability for various vegetation monitoring and disease diagnosis tasks.
5 Discussion
Our study evaluated the performance of three prominent deep learning models - VGG-16, RESNET50, and EfficientNetB7 - for hyperspectral image analysis in the context of vegetation health assessment. The comparison was based on metrics such as mean absolute error (MAE) and root mean square error (RMSE), commonly used to measure the accuracy of regression models. The results indicate that all three models perform similarly in capturing healthy and diseased vegetation spectral features. However, a marginal superiority is observed in the performance of the RESNET50 model, as evidenced by slightly lower MAE values across both healthy and diseased image datasets. This suggests that RESNET50 may be more effective in accurately identifying and distinguishing between healthy and diseased vegetation than VGG-16 and EfficientNetB7. The consistency in performance across the three models underscores the robustness of deep learning approaches for hyperspectral image analysis in agriculture. These models can effectively extract relevant features from spectral data to assess vegetation health, holding significant promise for disease detection and crop monitoring applications.
Our findings contribute to the growing body of research aimed at leveraging machine-learning techniques for precision agriculture and crop disease management. By demonstrating the feasibility and effectiveness of deep learning models in analyzing hyperspectral imagery, we provide valuable insights that can inform the development of automated systems for early disease detection and intervention in agricultural settings. Furthermore, our study highlights the importance of selecting appropriate deep-learning architectures for specific applications. While RESNET50 exhibited slightly superior performance in our experiments, future research could further explore more sophisticated architectures and techniques to enhance classification accuracy and robustness. There are several avenues for exploration and improvement in terms of future scope:
1. Exploring additional deep learning architectures beyond the ones considered in this study, such as DenseNet and Inception, could offer further insights and improve classification performance.
2. Incorporating transfer learning techniques and leveraging pre-trained models on more extensive and diverse datasets could enhance the generalization ability of the models and improve their performance across different environmental conditions and crop types.
3. Expanding the analysis to include a broader range of spectral indices beyond NDVI could provide a more comprehensive understanding of vegetation health dynamics. Incorporating indices related to chlorophyll content, water stress, and nutrient deficiency could enhance the sensitivity of the models to various aspects of plant health and enable more precise diagnosis of crop diseases.
4. Refining the image pre-processing pipeline by exploring techniques such as data augmentation, noise reduction, and advanced morphological operations could improve the quality of input data and consequently enhance the performance of the models.
5. Deploying the system in real-world agricultural settings and collaborating with domain experts to validate its effectiveness across diverse scenarios would be crucial for its practical applicability and scalability.
Our study lays the groundwork for future research to develop advanced and reliable systems for precision agriculture and crop disease management, ultimately contributing to sustainable food production and environmental stewardship.
Data availability statement
The original contributions presented in the study are included in the article/supplementary material. Further inquiries can be directed to the corresponding author.
Author contributions
SK: Conceptualization, Investigation, Methodology, Project administration, Supervision, Writing – original draft, Writing – review & editing. MM: Conceptualization, Funding acquisition, Investigation, Writing – review & editing. BB: Conceptualization, Investigation, Supervision, Writing – review & editing. YS: Data curation, Investigation, Software, Writing – original draft, Writing – review & editing. AB: Data curation, Investigation, Software, Writing – original draft, Writing – review & editing.
Funding
The author(s) declare financial support was received for the research, authorship, and/or publication of this article. This research was funded by Zayed University, research grant number 12091.
Conflict of interest
The authors declare that the research was conducted in the absence of any commercial or financial relationships that could be construed as a potential conflict of interest.
Publisher’s note
All claims expressed in this article are solely those of the authors and do not necessarily represent those of their affiliated organizations, or those of the publisher, the editors and the reviewers. Any product that may be evaluated in this article, or claim that may be made by its manufacturer, is not guaranteed or endorsed by the publisher.
References
Adinegoro A. F., Sutapa G. N., Gunawan A. A. N., Anggarani N. K. N., Suardana P., Kasmawan I. G. A. (2023). Classification and segmentation of brain tumor using efficientnet-b7 and u-net. Asian J. Res. Comput. Sci. 15, 19. doi: 10.9734/ajrcos/2023/v15i3320
Alatawi A. A., Alomani S. M., Alhawiti N. I., Ayaz M. (2022). Plant disease detection using AI-based vgg-16 model. Int. J. Advanced Comput. Sci. Appl. 13 (4), 720–721. doi: 10.14569/IJACSA.2022.0130484
Arad B., Ben-Shahar O. (2016). “Sparse recovery of hyperspectral signal from natural RGB images,” in European Conference on Computer Vision (ECCV) 2016, Amsterdam, The Netherlands, October 11–14. (Cham, Switzerland: Springer International Publishing).
Arad B., Timofte R., Ben-Shahar O., Lin Y. T., Finlayson G. D. (2020). “Ntire 2020 challenge on spectral reconstruction from an RGB image,” in Proceedings of the IEEE/CVF Conference on Computer Vision and Pattern Recognition Workshops. (Piscataway, New Jersey, USA: Institute of Electrical and Electronics Engineers (IEEE). 446–447.
Arun Pandian J., Gopal G. (2019). “Data for: identification of plant leaf diseases using a 9-layer deep convolutional neural network,” in Mendeley Data, V1. (Amsterdam, Netherlands: Mendeley Data). doi: 10.17632/tywbtsjrjv.1
Bock C. H., Poole G. H., Parker P. E., Gottwald T. R. (2019). Plant disease severity estimated visually, by digital photography and image analysis, and by hyperspectral imaging. Crit. Rev. Plant Sci. 29, 59–107. doi: 10.1080/07352681003617285
De Silva N., Brown D. (2022). Comparative analysis of RGB and NIR images for plant disease detection using deep learning. Sensors 22, 742. doi: 10.3390/s22030742
Devaraj A., Rathan K., Jaahnavi S., Indira K. (2019). “Identification of plant disease using image processing technique,” in 2019 International Conference on Communication and Signal Processing (ICCSP). 0749–0753 (Piscataway, New Jersey, USA: IEEE).
FAO (2019). Pesticides use by region (Rome, Italy: Food and Agriculture Organization of the United Nations). Available at: http://www.fao.org/faostat/en/#data/RP.
Gaidel A. V., Podlipnov V. V., Ivliev N. A., Paringer R. A., Ishkin P. A., Mashkov S. V., et al. (2023). Agricultural plant hyperspectral imaging dataset. Кo;мпьютернaя oптикa 47, 442–450. doi: 10.18287/2412-6179-CO-1226
Gonog L., Zhou Y. (2019). “A review: generative adversarial networks,” in 2019 14th IEEE conference on industrial electronics and applications (ICIEA). 505–510 (Piscataway, New Jersey, USA: IEEE).
Huang M.-L., Chang Y.-H. (2020). “Dataset of tomato leaves,” in Mendeley Data, V1. (Amsterdam, Netherlands: Mendeley Data). doi: 10.17632/ngdgg79rzb.1
Li Q., Li Y. (2022). Hybrid vision transformer model for apple disease detection. Sensors 22, 943. doi: 10.3390/s22050943
Lin K., Gong L., Huang Y., Liu C., Pan J. (2019). Deep learning-based segmentation and quantification of cucumber powdery mildew using convolutional neural network. Front. Plant Sci. 10, 155. doi: 10.3389/fpls.2019.00155
Lowe A., Harrison N., French A. P. (2017). Hyperspectral image analysis techniques for the detection and classification of the early onset of plant disease and stress. Plant Methods 13, 80. doi: 10.1186/s13007-017-0233-z
Majdalawieh M., Khan S., Islam M. T. (2023). Using deep learning model to identify iron chlorosis in plants. IEEE Access 11, 46949–46955. doi: 10.1109/ACCESS.2023.3273607
Mandal B., Okeukwu A., Theis Y. (2021). Masked face recognition using resnet-50. arXiv preprint arXiv:2104.08997. doi: 10.48550/arXiv.2104.08997
Nguyen C., Sagan V., Maimaitiyiming M., Maimaitijiang M., Bhadra S., Kwasniewski M. T. (2021). Early detection of plant viral disease using hyperspectral imaging and deep learning. Sensors 21, 742. doi: 10.3390/s21030742
Pushparaj P., Dahiya N., Dabas M. (2021). “Reconstruction of hyperspectral images from RGB images,” in IOP Conference Series: Materials Science and Engineering, Vol. 1022, 012102 (Bristol, United Kingdom: IOP Publishing).
Rahman S. U., Alam F., Ahmad N., Arshad S. (2023). Image processing based system for the detection, identification and treatment of tomato leaf diseases. Multimedia Tools Appl. 82, 9431–9445. doi: 10.1007/s11042-022-13715-0
Ramesh S. V., Vydeki D. (2020). Rice plant disease classification using optimized deep neural network. J. Ambient Intell. Humanized Computing 11, 4541–4552. doi: 10.1007/s12652-020-01741-4
Sreedevi A., Manike C. (2022). A smart solution for tomato leaf disease classification by modified recurrent neural network with severity computation. Cybernetics Syst. 55 (2), 409–449. doi: 10.1080/01969722.2022.2122004
Thomas S., Holden N. M., O’Donnell C. P. (2020). The potential for hyperspectral imaging for precision farming: A review. Precis. Agric. 21, 114–136.
Yan L., Wang X., Zhao M., Kaloorazi M., Chen J., Rahardja S. (2020). Reconstruction of hyperspectral data from RGB images with prior category information. IEEE Trans. Comput. Imaging 6, 1070–1081. doi: 10.1109/TCI.6745852
Yan Y., Zhang L., Li J., Wei W., Zhang Y. (2018). “Accurate spectral super-resolution from single RGB image using multi-scale CNN,” in Pattern Recognition and Computer Vision: First Chinese Conference, PRCV 2018, Guangzhou, China, November 23-26, 2018, Proceedings, Part II, Vol. 1. 206–217 (Cham, Switzerland: Springer International Publishing).
Zhang J., Su R., Fu Q., Ren W., Heide F., Nie Y. (2022). A survey on computational spectral reconstruction methods from RGB to hyperspectral imaging. Sci. Rep. 12 (1), 11905. doi: 10.1038/s41598-022-16223-1
Zhao J., Kechasov D., Rewald B., Bodner G., Verheul M., Clarke N., et al. (2020). Deep learning in hyperspectral image reconstruction from single RGB images—A case study on tomato quality parameters. Remote Sens. 12, 3258. doi: 10.3390/rs12193258
Keywords: hyperspectral imaging, powdery mildew, deep learning, plant disease detection, neural networks, feature extraction techniques, image processing in agriculture
Citation: Khan S, Majdalawieh M, Boufama B, Sharma Y and Basani A (2024) Unlocking the potential of simulated hyperspectral imaging in agro environmental analysis: a comprehensive study of algorithmic approaches. Front. Agron. 6:1435234. doi: 10.3389/fagro.2024.1435234
Received: 19 May 2024; Accepted: 30 August 2024;
Published: 22 October 2024.
Edited by:
Karthikeyan Adhimoolam, Jeju National University, Republic of KoreaReviewed by:
Bruno Condori, Universidad Pública de El Alto, BoliviaMuhammad Abbas, University of the Punjab, Pakistan
Copyright © 2024 Khan, Majdalawieh, Boufama, Sharma and Basani. This is an open-access article distributed under the terms of the Creative Commons Attribution License (CC BY). The use, distribution or reproduction in other forums is permitted, provided the original author(s) and the copyright owner(s) are credited and that the original publication in this journal is cited, in accordance with accepted academic practice. No use, distribution or reproduction is permitted which does not comply with these terms.
*Correspondence: Shafaq Khan, c2hhZmFxa0B1d2luZHNvci5jYQ==
 Shafaq Khan
 Munir Majdalawieh
 Boubakeur Boufama1
 Yajan Sharma
 Ashwitha Basani