 Coleman Byers
 Simerjeet Virk
 Glen Rains
 Steve Li4
95% of researchers rate our articles as excellent or good
Learn more about the work of our research integrity team to safeguard the quality of each article we publish.
Find out more
ORIGINAL RESEARCH article
Front. Agron. , 27 June 2024
Sec. Climate-Smart Agronomy
Volume 6 - 2024 | https://doi.org/10.3389/fagro.2024.1418623
This article is part of the Research Topic Innovative Technologies and Applications of UAV in Precision Agriculture to Mitigate Climate Change View all articles
The use of Unmanned Aerial Application Systems (UAAS) has increased rapidly in agriculture in recent years. Information regarding their spray performance, as influenced by operational parameters, is important to understand for their effective utilization. A study was conducted to assess the spray characteristics of two commercial UAAS platforms (TTA M4E and DJI Agras T30) using three different nozzle types, flight speeds, and application heights. Spray deposition was recorded across the swath to assess and compare spray behavior under these selected varying operational parameters. In-swath deposition uniformity was evaluated using the coefficient of variation (CV) for different theoretical effective swaths computed from single-pass spray patterns. The results indicated a highly variable spray deposition with the majority of coverage concentrated directly below the UAAS flight path. Coarser droplets produced by the AIXR (Air-Induction Extended Range) and TTI (Turbo Teejet Induction) nozzles exhibited greater coverage directly under the UAAS while finer droplets from the XR (Extended Range) nozzle showed improved uniformity across wider swaths. Coverage decreased with an increase in flight speed for both platforms. Application height had no effect on spray coverage for the TTA M4E, but coverage increased with height for the DJI Agras T30 within the tested range. Both increased flight speed (5.0 and 6.7 m s-1 for the TTA M4E and DJI Agras T30, respectively) and height (3.0 m for both the TTA M4E and DJI Agras T30) showed increased uniformity. Among the tested parameters, only a few exhibited an acceptable variability (CV≤25%) within the range of theoretical effective swaths. The TTA M4E had a CV<25% for the flight speeds of 3.4 and 5.0 m s-1, and a height of 3.0 m at an effective swath of 2.0 m. In contrast, the 2.3 and 3.0 m heights, XR and TTI nozzles, and 4.5 and 6.7 m s-1 speeds exhibited acceptable variability for the DJI Agras T30 for an effective swath of 4.0 m. For both UAAS, none of the tested parameters had an acceptable CV (≤25%) at the widest swath (4.0 and 9.0 m for the TTA M4E and DJI Agras T30, respectively) recommended by the manufacturer.
The utilization of crop protection products, also known as pesticides, has become essential in modern agriculture for growers to effectively manage pest pressure and protect crop yield throughout the season (Sinha et al., 2022). Pesticide use is estimated to prevent losses in food production ranging from 50 to 80% globally and is vital to continue to meet an ever-increasing food demand caused by a growing global population (Oerke, 2006; Lan et al., 2017). Every year, an estimated 2.7 million tonnes (Mt) of pesticides are used globally (Atwood and Paisley-Jones, 2017). Conventional pesticide applications are most commonly conducted by ground equipment through broadcast applications (Gibbs et al., 2021). Approximately 28% of United States cropland is also treated aerially with manned agricultural aircraft at least once during the growing season as various factors including crop height, topography, and weather challenges prevent growers from timely pesticide applications with ground sprayers (Struttman and Zawada, 2019). Recently, Unmanned Aerial Application Systems (UAAS) have emerged as a popular application technology and gained increased interest for aerial pesticide applications due to their several potential benefits such as late-season applications in tall crops, application in areas inaccessible to ground sprayers, and reduced labor requirements in some cases by replacing backpack sprayers (He, 2018). While the first test of unmanned aerial systems for pesticide applications occurred in 1989 with a Yamaha helicopter design; its use outside Japan was limited due to spray tank size constraints and economic factors (Xiongkui et al., 2017). Since then, modern UAAS have seen significant developments in payload carrying capacity, battery life, nozzle configuration, and platform design. Most of these improvements have been motivated by a rising interest in the use of UAAS for precision crop management (Teske et al., 2018).
Recent research on UAAS has been focused on evaluating their application performance along with assessing the technology’s benefits over traditional application methods. Hunter et al. (2019) evaluated the utilization of unmanned aerial imaging and an UAAS to create site-specific application maps resulting in a similar operational efficiency to a broadcast application while treating 60% less area. Studies utilizing UAAS in orchard crops have found similar deposition rates and uniform droplet size when compared to manned-aerial applications (Giles and Billing, 2015; Martinez-Guanter et al., 2020). One of the main advantages of UAAS over other methods is propeller downwash which can propel the spray particles faster and deeper into crop canopies (Richardson et al., 2020). Studies evaluating spray deposition at different canopy heights found more consistent and increased coverage for both high and low foliage heights for two different UAAS platforms tested by Martin et al. (2019) and Gibbs et al. (2021). Teske et al. (2018) found that rotor downwash generated during flight can assist particles downwards under critical flight speeds resulting in higher coverage beneath the UAAS. However, rotor downwash can also contribute to increased drift of spray particles under some application conditions such as increased heights and flight speeds. Nozzle type and position relative to the rotors can also affect spray deposition within the swath as well as spray drift. Hunter et al. (2019) reported that the nozzles producing finer droplets on UAAS are more prone to off-target movement than nozzles that produce coarser droplets. Similarly, drift risk evaluated by Wang et al. (2021) comparing different nozzle types found spray drift to be 81 to 95% higher for hollow cone nozzles than air-induction nozzles. Comparing different nozzle configurations between UAAS platforms, Martin et al. (2019) found the widest effective swath occurred with nozzles placed directly below the rotors.
Spray characteristics of one UAAS type can vary from another due to differences in platform designs, size, nozzle types, and nozzle configurations (Hunter et al., 2020; Sinha et al., 2022). These differences between UAAS platforms make it challenging to understand and optimize application parameters to improve spray deposition and uniformity, especially under varying environmental conditions (Faiçal et al., 2017; He, 2018). Lan et al. (2017) reviewed the literature on five commercially available spray systems, reporting that each platform had unique optimal conditions to maximize spray deposition. Similarly, Martin et al. (2019) and Sinha et al. (2022) reported varying spray characteristics at similar application parameters for two different UAAS used in their studies. The potential of UAAS to perform precision application of pesticides could have a large economic impact on pest management in agriculture (Woldt et al., 2018). However, enabling such precision applications requires a thorough investigation and understanding of the spray performance (deposition, uniformity, and drift) of different UAAS to inform best management practices for their effective utilization. Additionally, UAAS design and capabilities are changing rapidly on newer platforms, and even between different models from the same manufacturer due to varying physical and operational characteristics. This makes it more challenging to apply the information learned from one platform to another and thus necessitates examining the spray performance of each platform under varying operational conditions to determine optimal application parameters. The research presented here is an effort to better understand the spray characteristics of two different commercially available UAAS platforms at varying operational parameters. The specific objectives of this study were to assess and compare (1) spray deposition within the swath for single-pass spray patterns and (2) uniformity of spray deposition for different computed effective swaths (from single-pass patterns) across varying nozzle types, application heights, and flight speeds for two different UAAS platforms.
Two commercially available UAAS platforms were used in this study: the TTA M4E (Beijing TT Aviation Technology Co., Beijing, China) and the DJI Agras T30 (SZ DJI Technology Co., Shenzhen, China) which will be referred to as ‘M4E’ and ‘T30’ from here forward for brevity. The M4E has a quadcopter arrangement, with a tank capacity of 5 L. The T30 has a hexacopter arrangement, with a tank capacity of 30 L. Both UAAS utilize nozzles for dispensing spray solution that are placed directly under the rotors (Figure 1). The M4E has two nozzles placed directly under the rear 2 rotors, while the T30 has 16 nozzles that are distributed across the 6 rotors and attached with frame arms as seen in Figure 1B. The M4E UAAS was controlled using a T12 12-channel radio controller connected via Bluetooth to a tablet and the manufacturer-specified flight application software. As noted in the M4E operator’s manual, the manufacturer reports a horizontal accuracy of ±1.0 m and a vertical accuracy of ±0.5 m. The T30 was controlled utilizing the DJI Smart Controller Enterprise pre-installed with the DJI Agras flight application software during testing. The controller was equipped with an RTK receiver and connected to a GNSS mobile base station (Model D-RTK 2, SZ DJI Technology Co., Shenzhen, China), providing a manufacturer-reported horizontal and vertical positioning accuracy of ±1 cm during all tests. For both UAAS, the flight planning software allowed for pre-programmed flight paths to be created and utilized during the testing. The detailed specifications for each UAAS including platform weight, operating payload weight, and recommended ranges for operational parameters are provided in Table 1.
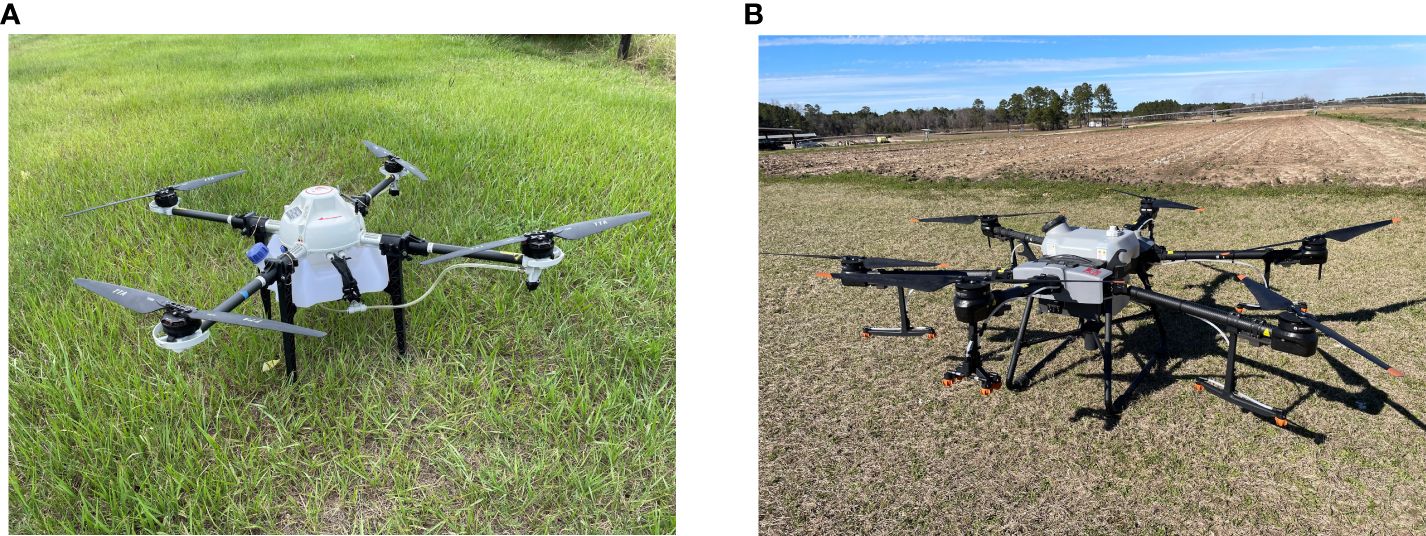
Figure 1 (A) TTA M4E and (B) DJI Agras T30 UAAS used for the spray performance studies conducted in 2022 and 2023, respectively.
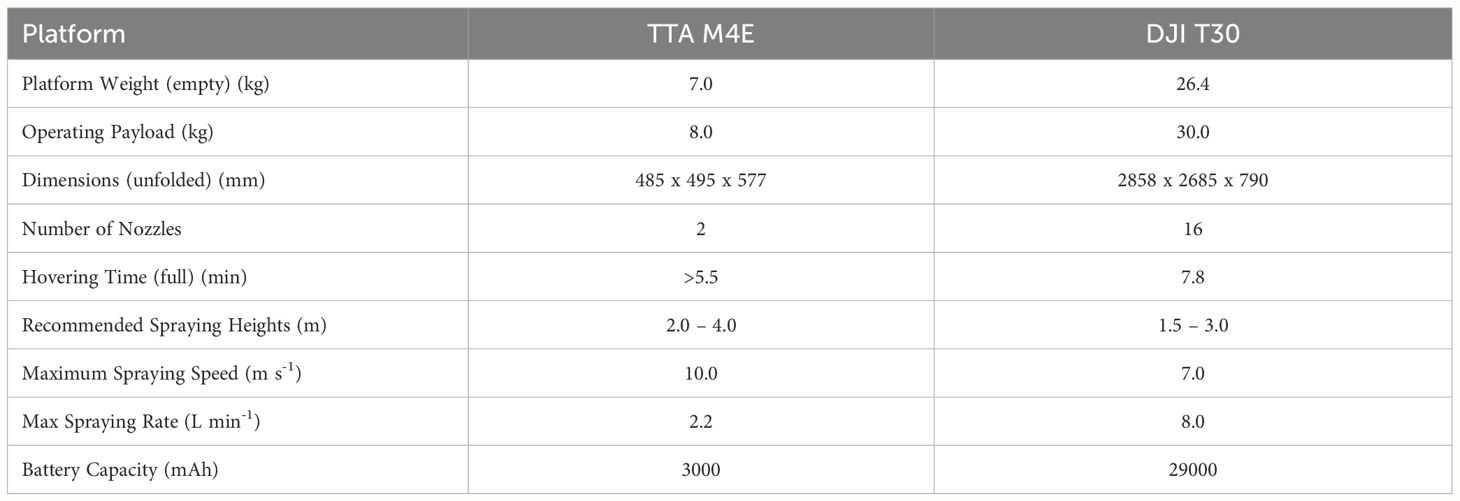
Table 1 Specifications for the TTA M4E and the DJI Agras T30 UAAS.
Field tests were conducted at research farms located on the University of Georgia campus in Tifton, GA on flat, open, and uncropped sites in 2022 (31.4706°, -83.5287°) and 2023 (31.5197°, -83.5491°). The application area within both fields consisted of a minimum of 122 m length and 40 m width, and was bordered by grass berms on all sides with minimal interference from trees or other objects.
For each UAAS, the study treatments consisted of three nozzle types to target different droplet sizes, three application heights to attain varying swaths, and three flight speeds. Application heights and flight speeds were selected based on the manufacturer’s recommended range as outlined in each UAAS’ operator’s manual. For both UAAS platforms, the three different nozzle types used were TeeJet® XR (Extended Range), AIXR (Air-Induction Extended Range), and TTI (Turbo TeeJet Induction) (TeeJet Technologies, Glendale Heights, IL) to attain the droplet sizes in the range of Fine to Medium, Coarse to Very Coarse, and Extremely Coarse to Ultra Coarse (ASABE, 2020), respectively. All nozzles used in these tests had a spray angle of 110° and the nozzle orifice size differed between the UAAS based on the target application rate.
The flight speeds and application heights varied between the two UAAS due to different recommended ranges by the manufacturer. For the M4E, the flight speeds were 2.5, 3.4, and 5.0 m s-1, and the application heights were 2.0, 2.5, and 3.0 m above ground level (AGL). The target swaths for the M4E followed a 1:1 ratio with the height as suggested by the manufacturer. The M4E platform does not have rate control capabilities, therefore flight speed variations resulted in different application rates (L ha-1). The flight speeds of 2.5, 3.4, and 5.0 m s-1 resulted in an application rate of 37.4, 28.1, and 18.7 L ha-1, respectively. To maintain the target application rate across different application heights, nozzle size and flow rate (L min-1) were changed accordingly to compensate for the change in flow rate due to the increased swath with height. The nozzle orifice sizes used were 03, 04, and 06 at the heights of 2.0, 2.5, and 3.0 m, providing flow rates of 2.3, 2.8, and 3.4 L min-1, respectively. The flow rate was verified utilizing a SpotOn Sprayer Calibrator (SC-1, Gemplers, Janesville, WI) for each nozzle before testing, and pump speed (pressure) was adjusted accordingly to achieve the target rate (L ha-1).
For the T30 testing, the flight speeds were 4.5, 5.6, and 6.7 m s-1, and the application heights were 1.5. 2.3, and 3.0 AGL. All treatments for the T30 were implemented using the target application rate of 18.7 L ha-1 and using nozzles of a 015 orifice size. Unlike the M4E, this platform is equipped with rate control capabilities so the system automatically adjusted the flow rate (L min-1) accordingly for the selected speed and height (swath) combination. The swath width was set within the DJI Agras app on the flight controller and was adjusted accordingly with each increase in height. Based on the manufacturer-provided information for the T30, the application heights of 1.5, 2.3, and 3.0 m were programmed to attain target swaths of 4.0, 6.5, and 9.0 m, respectively. Table 2 summarizes the different nozzle types, application heights, and flight speeds used for each UAAS platform for spray performance testing in this study.
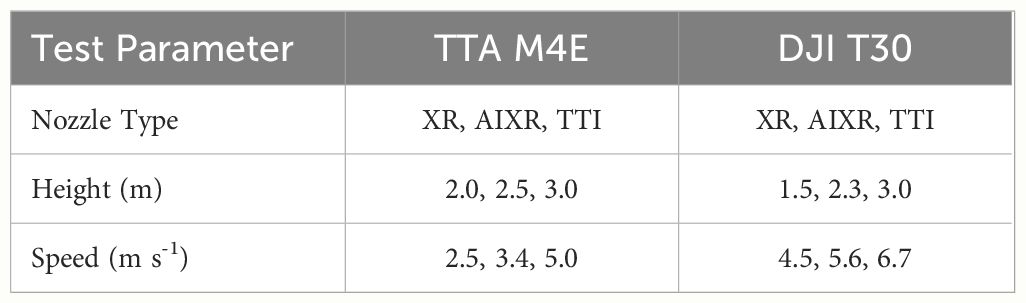
Table 2 Information on test parameters used for the TTA M4E and DJI T30 UAAS during spray performance testing.
Application performance for both UAAS was assessed by measuring spray deposition (percent coverage) and uniformity (coefficient of variation, CV) at varying nozzle types, flight speeds, and application heights. The data collection for spray coverage consisted of 0.1 m × 2.4 m wooden boards placed perpendicular to and centered under the flight path of the UAAS (Figure 2A). Water-sensitive paper (WSP) (Syngenta, Crop Protection Inc., Greensboro, NC) (2.5 cm × 7.6 cm) were placed at 0.3 m intervals on the wooden boards along the entire length of the spray swath (Figure 2B). A total length of 14.6 m of the wooden boards was used while the number of WSP placed within the swath varied based on the target swath and ranged from 17 to 33 (4.9 to 9.8 m) between the two UAAS platforms. Water was used as a spray solution in the tank for all tests. During testing, any deviations from the pre-programmed flight path were noted. The beginning and end of the flight passes for both platforms were at least 60 m from the data collection area to prevent application variability caused by each UAAS reaching the target speed or other factors.
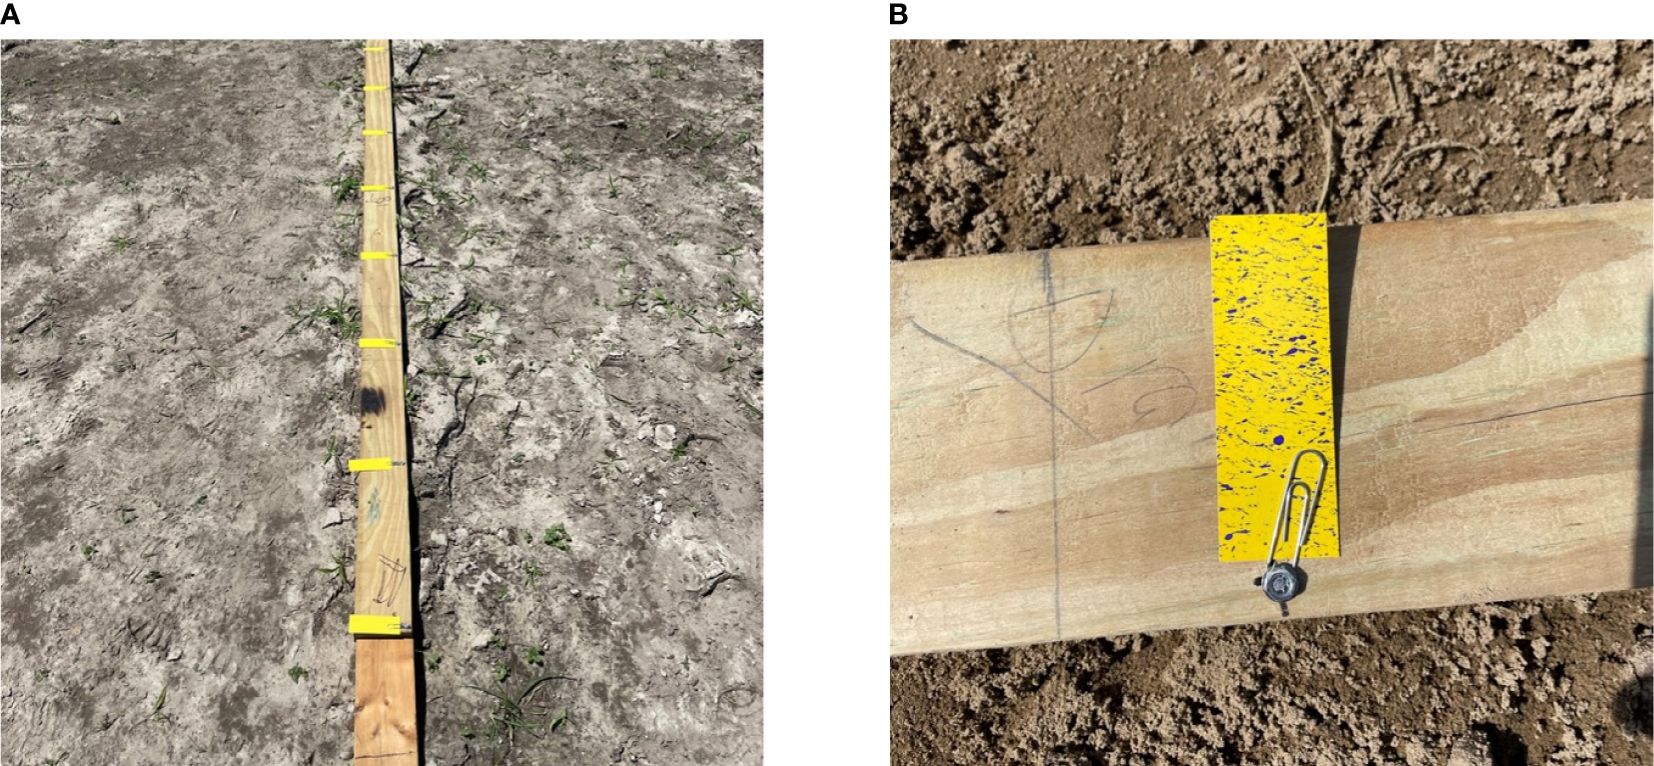
Figure 2 Illustration of setup used for data collection: (A) water-sensitive paper placed at 0.3 m intervals across the swath, and (B) spray deposition on the water-sensitive paper after the UAAS pass.
During testing, the study treatments were implemented in a manner where different levels of the selected treatment (nozzle type, flight speed, or application height) were executed while keeping the other two factors fixed throughout the testing. The experiments were conducted in this manner as the main goal of this study was to evaluate the effect of each treatment (nozzle type, flight speed, and application height) separately on spray deposition and uniformity rather than the combined or interaction effects of the selected treatments on spray performance. Additionally, since environmental conditions can vary considerably during the day, this experimental design allowed us to complete the testing and data collection for different levels of each treatment within a two to three-hour period, in which the wind speed and direction remained relatively consistent. The wind direction remained within ±15° of the flight path of the UAAS for both collection periods. All testing was conducted utilizing a single pass (serving as a replication) of the UAAS with each treatment replicated three times (Figure 3). Immediately after each pass, the WSP were collected and stored in pre-labeled envelopes to prevent atmospheric moisture contamination. WSP placement before and after each UAAS pass was handled by two teams of two to three people to avoid any potential contamination of the samples.
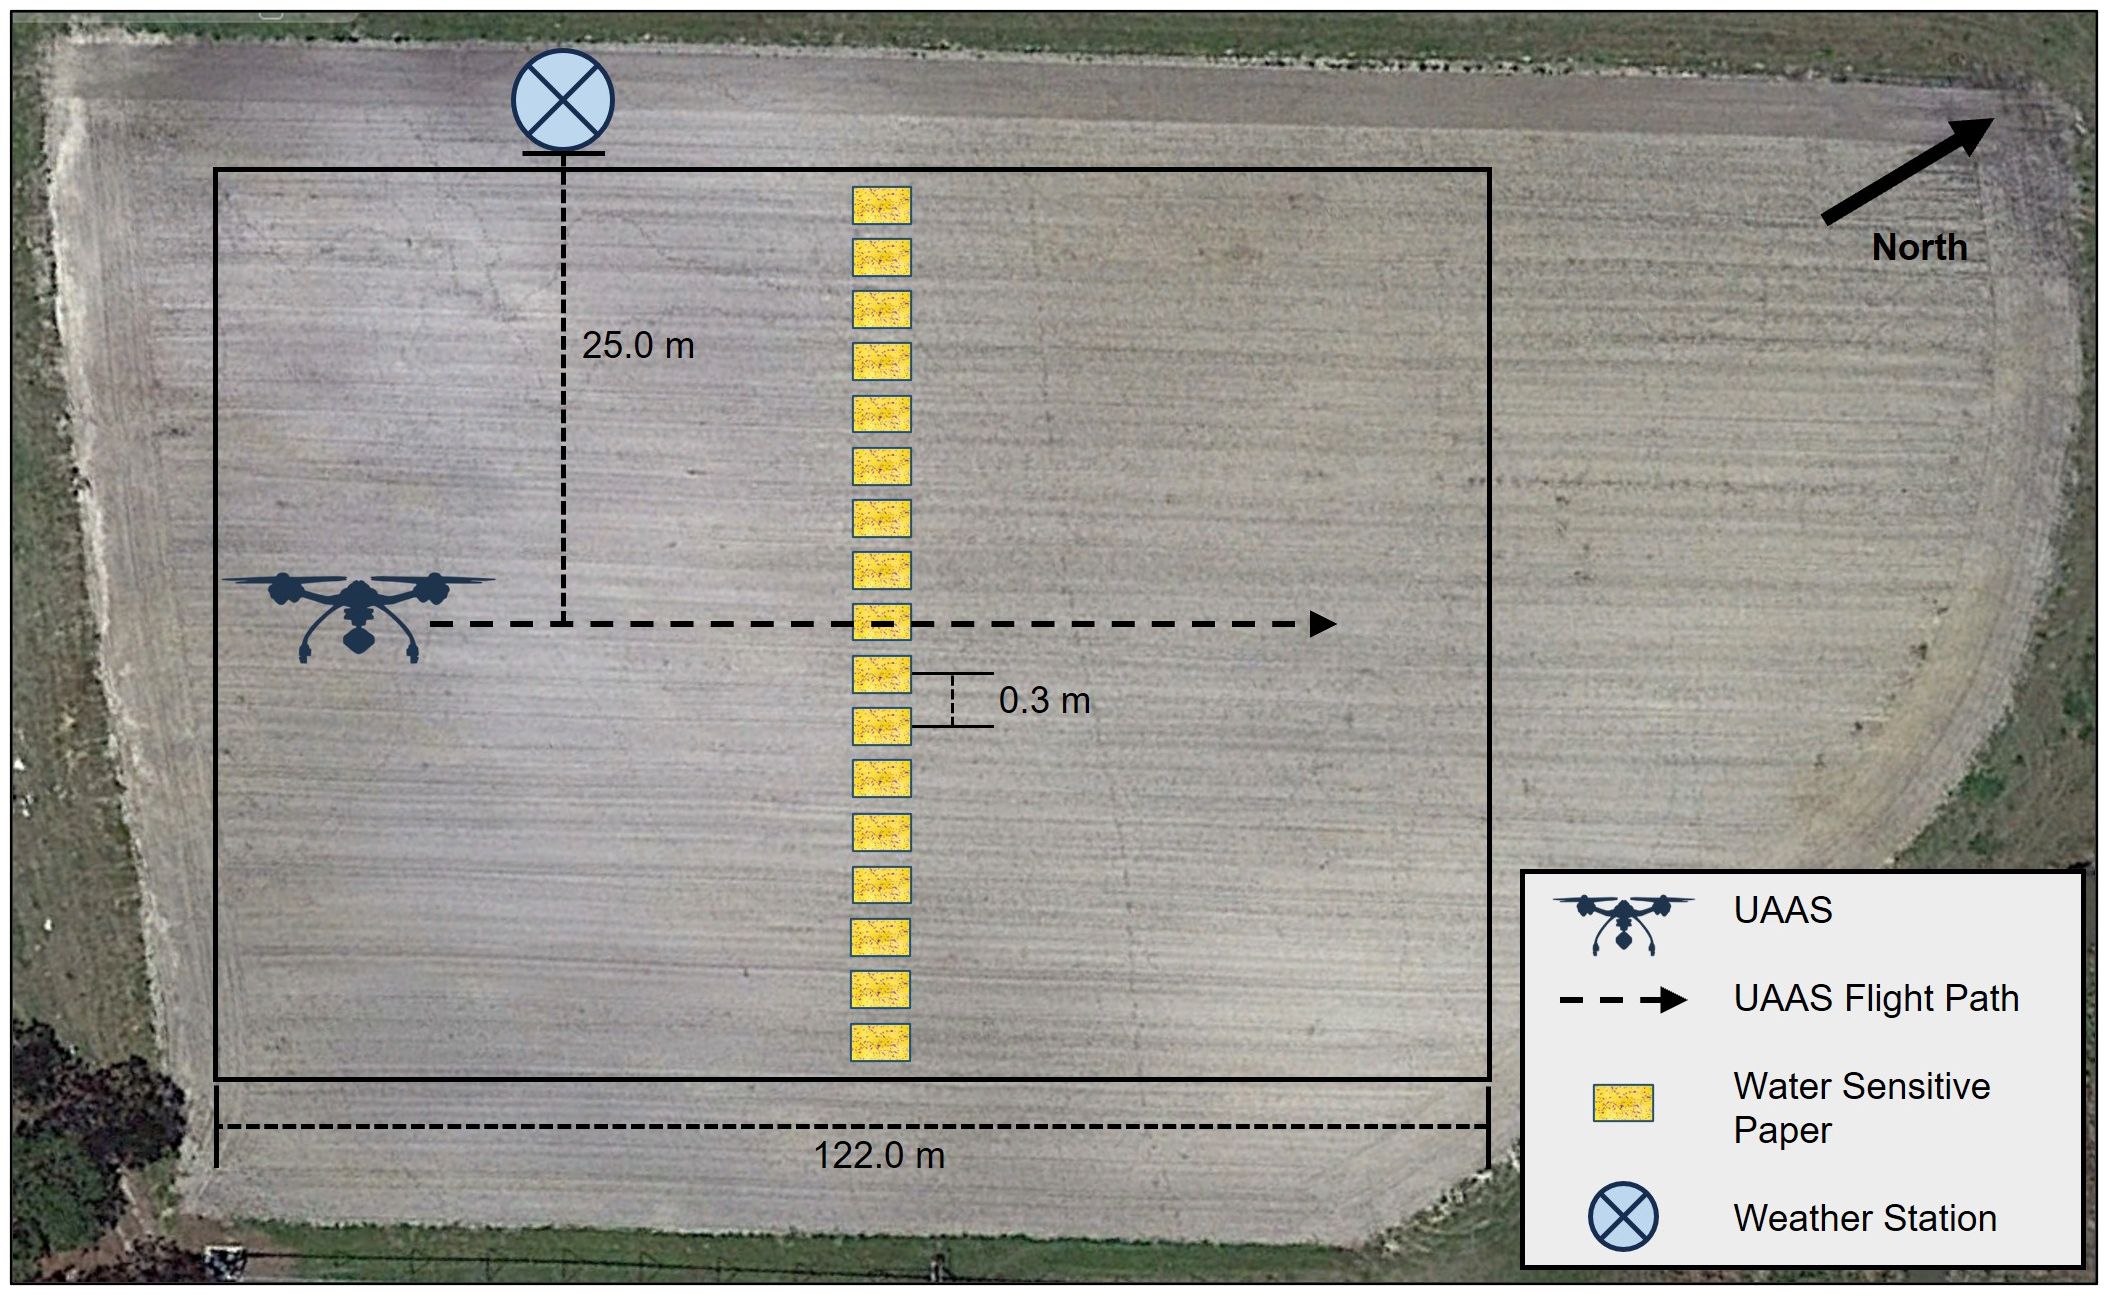
Figure 3 Illustration of the data collection setup in the test area used for collecting spray deposition data for each UAAS.
During the entire testing period, meteorological data including the wind speed and direction, temperature, and relative humidity were collected at 1.0-min intervals utilizing an on-site weather station (6250 Vantage Vue, Davis Instruments, Hayward, CA). The weather station was installed at a height of 1.8 m from the ground and was located approximately 25.0 m away from the application area. The testing and data collection for the M4E occurred on 15 June 2022, and for the T30 on 19 April 2023. The meteorological data averaged across the testing period for each UAAS is presented in Table 3.

Table 3 Meteorological conditions recorded during data collection. Values reported are the mean ± standard deviation.
All WSP were analyzed using a DropScope instrument (SprayX, São Paulo, Brazil) which provided the area covered by the spray droplets as coverage (%). Coverage was averaged over the three replicates based on their location within the swath and was used to generate a single-pass coverage pattern for each treatment. Mean spray coverage and standard deviation were computed for the entire swath as well as for different sections within the swath. For this, the full swath for each UAAS was divided into three sub-sections (left, center, and right) where the center swath section was defined as equivalent to the wingspan of each UAAS, which corresponded to 1.35 and 2.75 m for the M4E and T30, respectively. Data outside of this center section was subsequently sorted into the left and right sections based on the application direction. To assess the uniformity of spray deposition, the coefficient of variation (CV) values for a range of theoretical effective swaths were computed utilizing simulated UAAS passes following a progressive application pattern. Effective swath is defined as the widest swath width in which the CV is less than or equal to 25% (Woldt et al., 2018; Martin et al., 2019; Sinha et al., 2022). All statistical analysis was conducted utilizing JMP Pro 16.0 (SAS, Cary, NC). Considering the experimental design used for data collection, the effect of each treatment (nozzle type, speed, or height) was analyzed separately by subjecting data for both the full and swath sections (center, left, and right) to an ANOVA (α=0.05). Treatment means for significant effects were separated using the Student’s t-test (p ≤ 0.05).
The spray coverage patterns from single-pass testing at varying nozzle types, application speeds, and heights are provided in Figures 4–6 [(A) M4E and (B) T30], respectively. While the specific effect of each treatment on spray coverage within the swath is discussed in subsequent sections, some common trends among the spray patterns allowed general characteristics to be discussed here. For both UAAS and across all application parameters, spray coverage followed a typical ‘bell-shaped’ curve characterized by the majority of the spray deposition being concentrated towards the center of the swath and a rapid decrease in coverage towards the outer ends of the swath. The central coverage peak was more distinct with rapidly decreasing coverage towards the outer swath for the M4E than the T30 but was also influenced by the operational parameters tested in the study for both UAAS. In general, the magnitude of spray coverage for the M4E (4.2 - 19.6%) was considerably greater than the coverage obtained for the T30 (0.9 - 2.2%). The measured spray swath for the M4E (4.9 m swath) was significantly narrower than the T30 (4.9 – 9.8 m swath). These coverage and swath variations among the UAAS were mainly due to the considerable differences between the two UAAS platforms including their size, number of nozzles, nozzle placement, number of rotors, and rotor downwash. Across all tested parameters for both UAAS, large standard deviation values (up to 5.3 and 27.5% for the T30 and M4E respectively, represented by error bars in Figures 4–6) were observed at each sampling point indicating a high variability in spray coverage between the replications. This type of variability between spray passes is common during UAAS applications and was also observed and reported by other researchers (Martin et al., 2019; Sinha et al., 2022). Prevalent meteorological conditions during applications can also have an influence on spray deposition within the swath, especially due to wind speed and direction. This is more evident in spray patterns for the T30 (Figures 4B, 5B, 6B) where spray deposition was favored slightly towards the left of the swath due to a westward wind during the day of testing. This effect of wind speed and/or direction was not observed in the spray patterns for M4E (Figures 4A, 5A, 6A). This can also be one of the reasons that the spray patterns for the M4E seemed to be more symmetrical with most of the coverage differences primarily within the center swath, whereas for the T30, the differences in spray coverage can also be noticed within the left and right swath sections along with the center swath. For results discussed here and in the subsequent sections, the center swath section corresponds to the middle 1.35 and 2.75 m of the swath for the M4E and T30, respectively whereas anything outside of that represents the left and right swath sections.
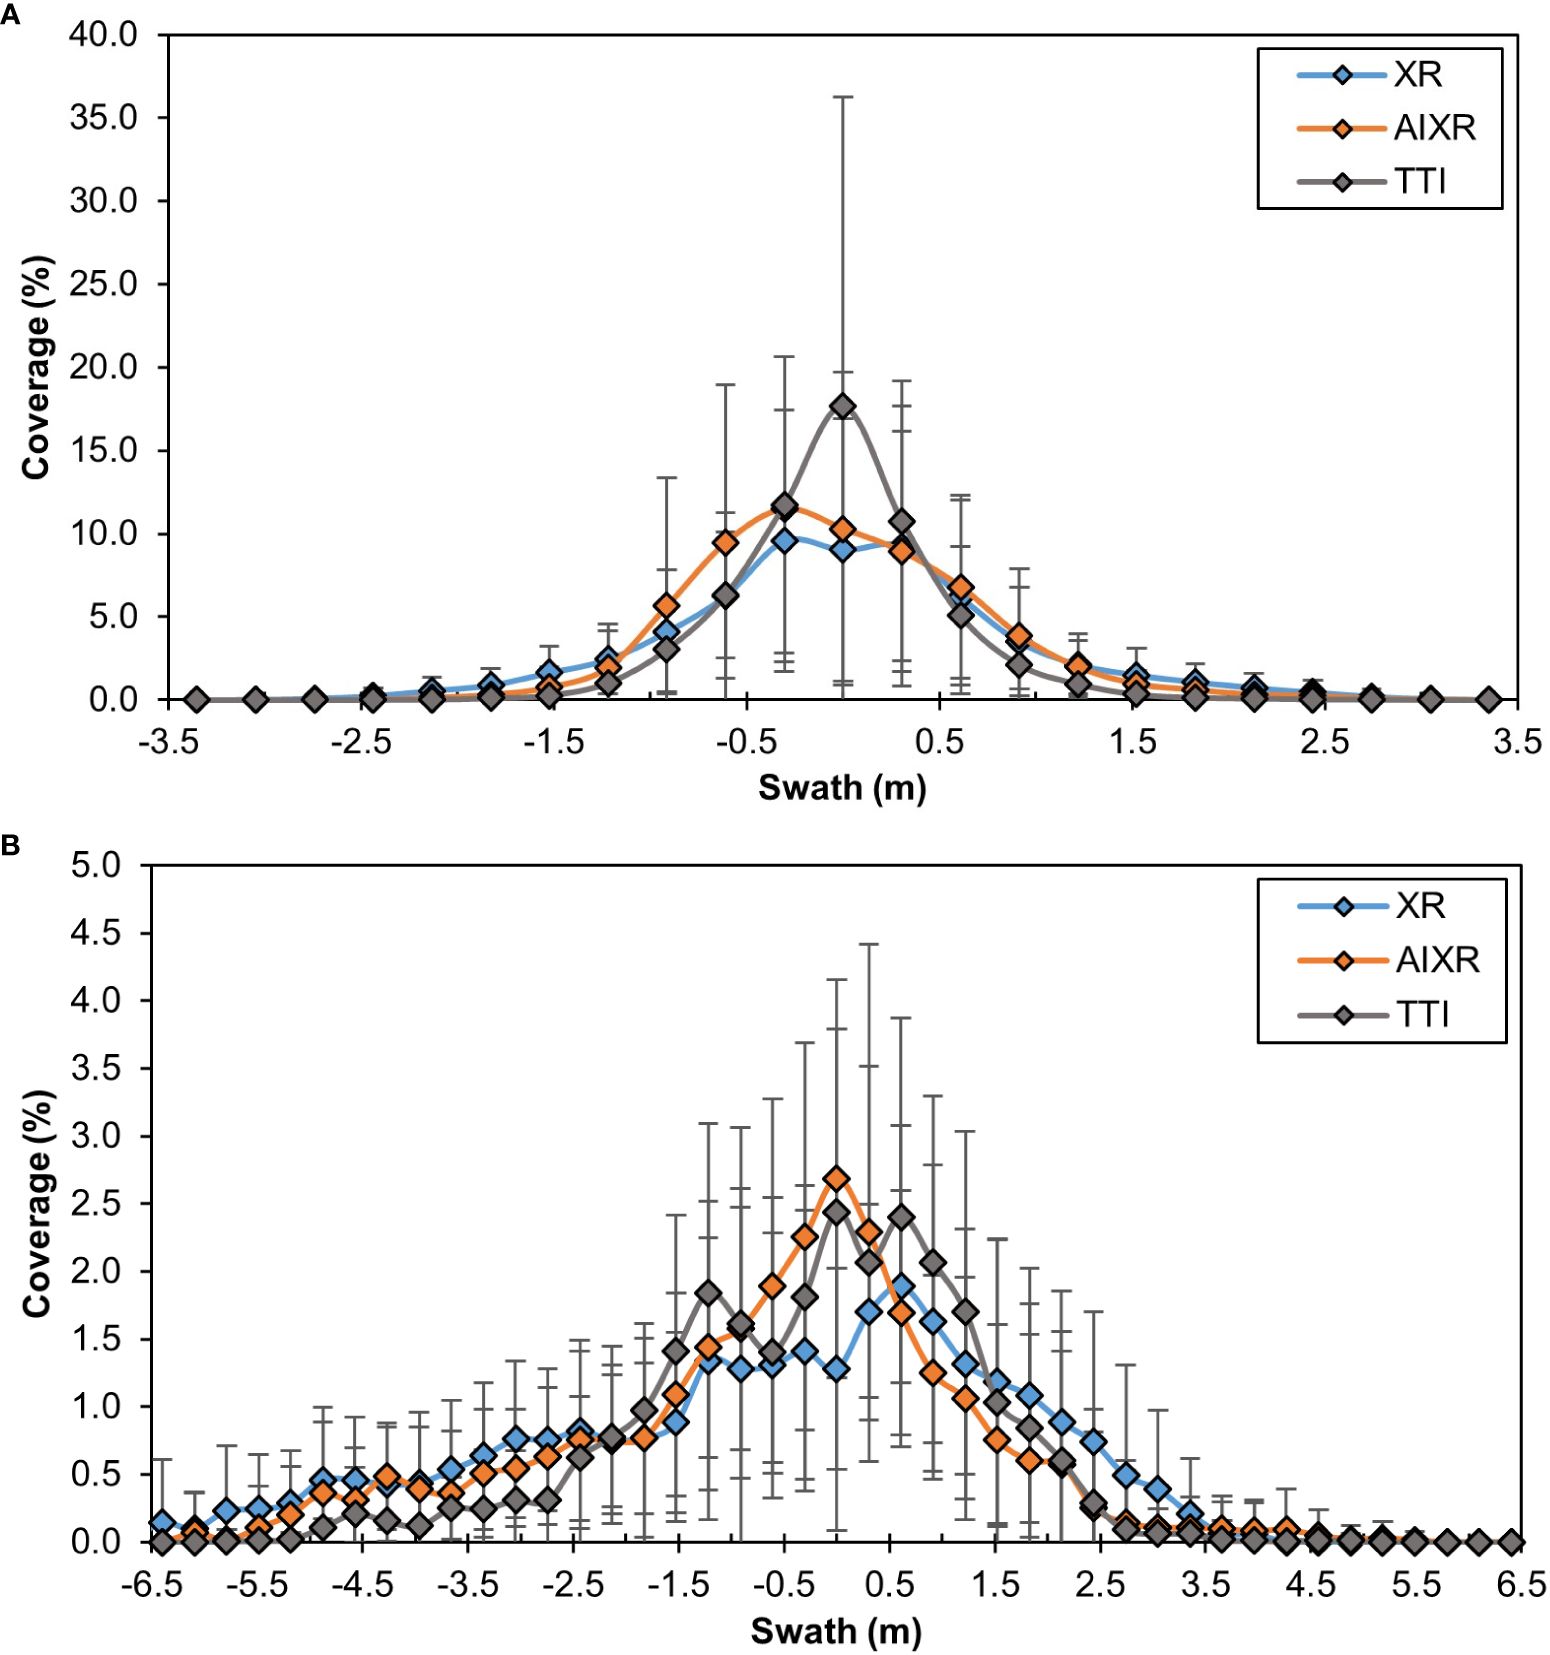
Figure 4 Spray coverage across the swath for the (A) M4E and (B) T30 UAAS for the three different nozzle types (XR, AIXR, and TTI) tested in this study. 0 m coincides with the flight path of the UAAS.
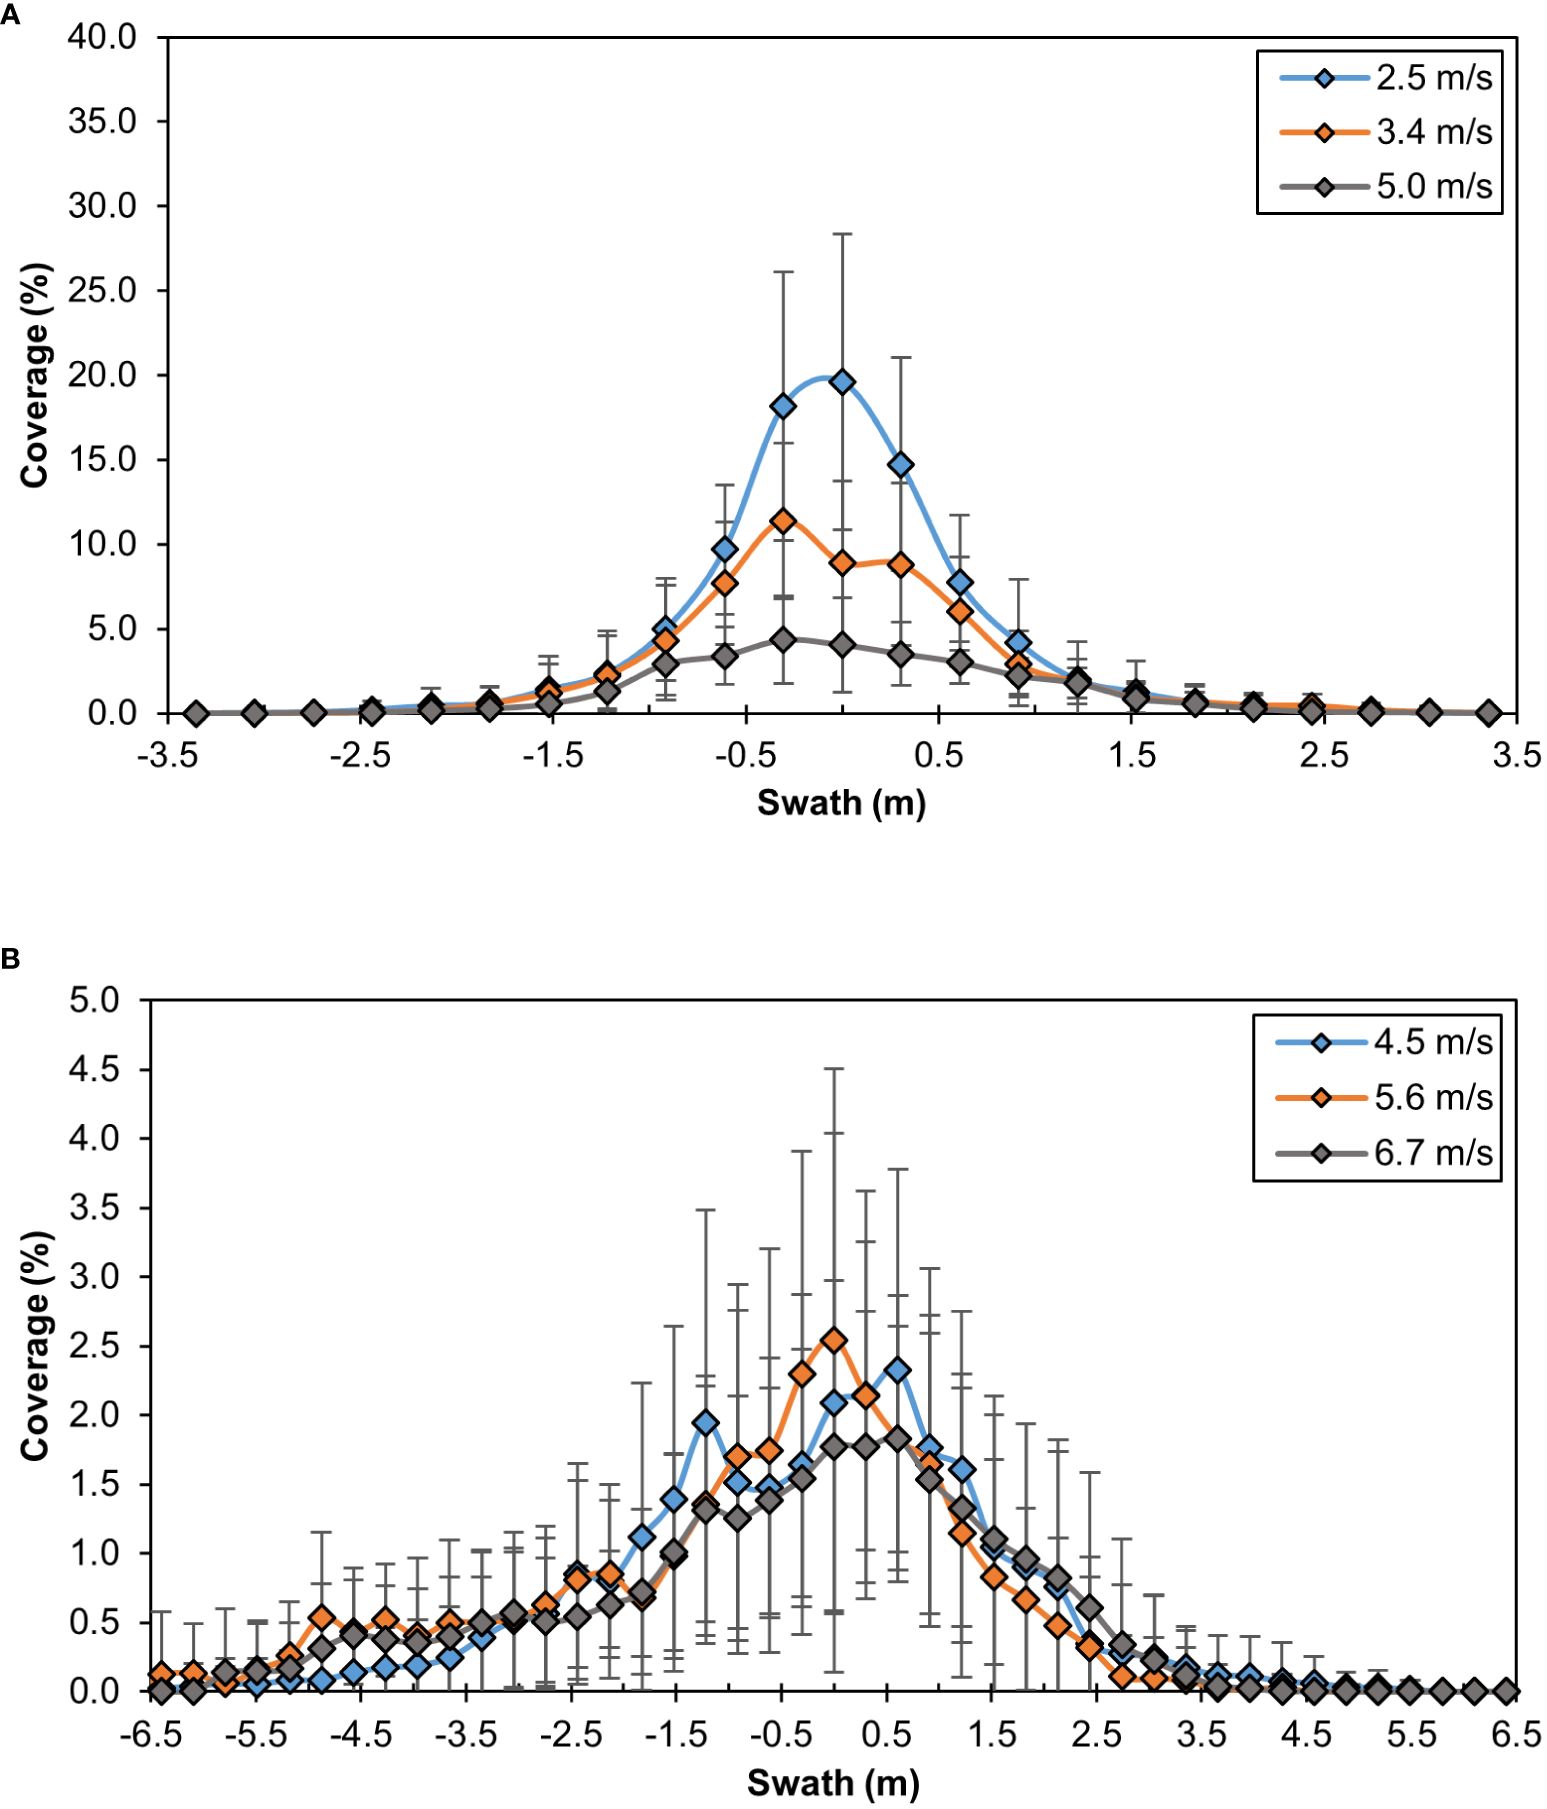
Figure 5 Spray coverage across the swath for the (A) M4E and (B) T30 UAAS for the three different application speeds tested for each UAAS. 0 m coincides with the flight path of the UAAS.
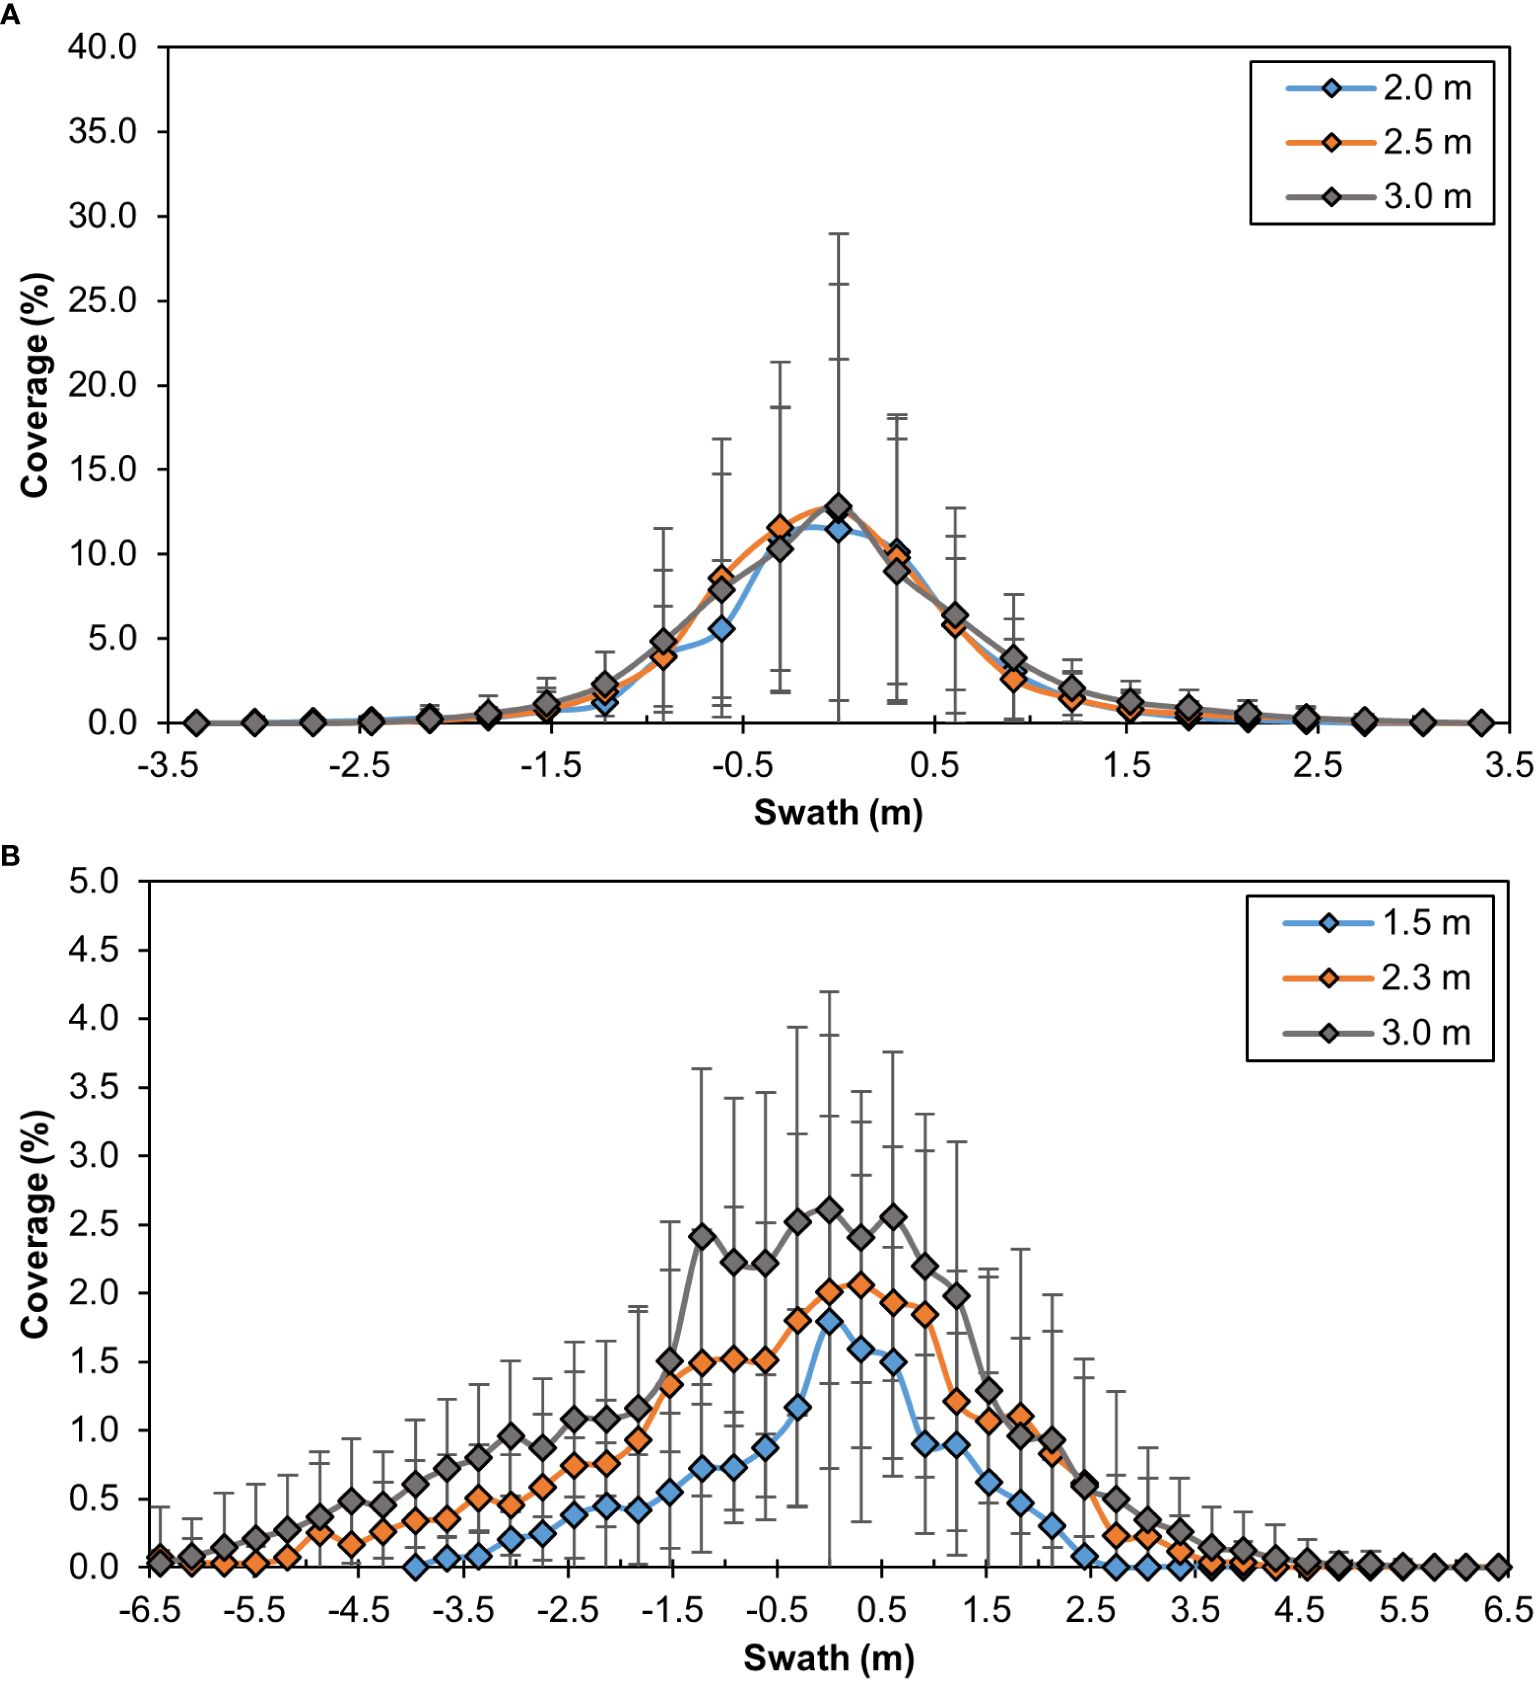
Figure 6 Spray coverage across the swath for the (A) M4E and (B) T30 UAAS for the three application heights tested for each UAAS platform. 0 m coincides with the flight path of the UAAS.
Nozzle type had a significant effect on spray coverage within individual swath sections (center, left, and right; p<0.05, for both the M4E and T30) but showed no effect when considering the entire swath (p=0.3707 and p=0.8652 for the M4E and T30, respectively). This is an important observation to consider as it emphasizes that only using spray coverage averaged across the whole swath, especially for single-pass patterns, is not sufficient for assessing UAAS performance as it fails to provide information about the effect of treatments at different locations or sections within the swath. For both the M4E and T30, the TTI nozzle provided greater coverage than the XR nozzle in the center swath (Table 4); however, the opposite trend existed towards the outer swath sections where the XR nozzle exhibited greater coverage. This is also evident in spray patterns in Figures 4A, B (M4E and T30, respectively) and can be possibly attributed to the susceptibility of the finer spray particles produced by the XR nozzle to disperse across the whole swath whereas the coarser spray droplets from the TTI nozzle have a higher tendency to deposit directly under the UAAS, within the center swath. For aerial applications, the finer spray particles are also more susceptible to off-target deposition or evaporation than coarser droplets (Younis, 1973; Bird et al., 1996; Martin et al., 2019). Downwash from UAAS is another factor that can influence both in-swath deposition and off-target movement based on the size of the droplets and the prevalent environmental conditions during application (Teske et al., 2018).
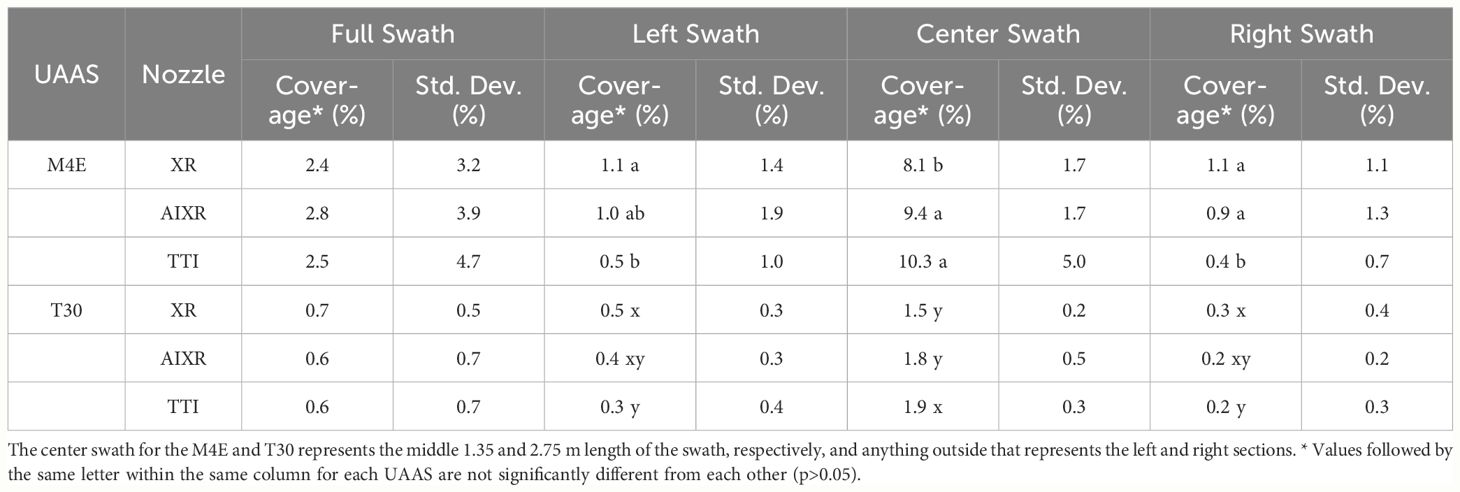
Table 4 Effect of nozzle type on spray coverage within the full and different sections of the swath for each UAAS.
The coverage results for the AIXR nozzle varied between the UAAS types. For the M4E, the AIXR nozzle provided comparable coverage to the TTI nozzle in the center of the swath and the XR nozzle in the outer swath sections. For the T30, the AIXR nozzle exhibited similar coverage to both the XR and TTI nozzles in the outer swath sections whereas it was similar only to the XR nozzle only in the center swath. This data suggests that the AIXR nozzle may be a better option for applications with the M4E as it provides improved coverage across the whole swath than the XR or TTI nozzles. Regardless of the nozzle type, the large standard deviation values (relative to the coverage values; Table 4) for both UAAS indicate high variability in spray deposition within the swath sections.
Few recent studies have investigated the effect of nozzle type on UAAS performance. While differences in UAAS types, number of nozzles, spray coverage assessment, and reporting method may not enable a direct comparison with the findings of the present study, general trends in spray coverage across the nozzle types can still be analyzed. Hunter et al. (2019) reported a significant interaction of nozzle type with application rate for DJI’s MG-1 where the XR nozzle provided greater coverage than the AIXR and TTI nozzles at a rate of 151 L ha-1 but found no difference in coverage between these nozzle types at the application rates between 22 and 50 L ha-1. These results were similar to the findings of the present study where all tests for both UAAS were conducted at application rates of <46.7 L ha-1 and showed no effect of nozzle type on mean coverage when assessed across the entire swath. However, the AIXR nozzle (coarser droplets) did provide greater coverage when assessed separately within different swath sections. Similarly, Wang et al. (2019) reported greater spray coverage for a coarse nozzle type (LU120–02, -03) at the two tested rates of 16.8 and 28.1 L ha-1 utilizing a single-rotor UAAS while the fine nozzle type (LU120–01) produced the highest deposition at a rate of 9.0 L ha-1.
Unlike nozzle type, the effect of application speed on spray coverage varied between the M4E and T30, though relatively large standard deviation values (0.2 - 6.0%, Table 5) for both UAAS again indicate high coverage variability within the full and individual swath sections. For the M4E, the spray coverage was significantly affected by application speed within the full swath (p<0.0001), left (p=0.0031), and center (p<0.0001) swath sections. An inverse relationship between spray coverage and flight speed was noticed towards the center of the swath, where coverage was highest for the lowest flight speed and vice-versa (Figure 5A). The spray coverage reduced substantially from 14 to 3.7% with an increase in application speed from 2.5 to 5.0 m s-1. Due to the majority of the coverage concentrated in a large central peak, this effect of application speed also translated to spray coverage assessed across the entire swath. For both the left and right swath sections, the lowest application speed (2.5 m s-1) again provided greater coverage than the highest speed (5.0 m s-1). This reduction in spray coverage with increasing speed for M4E can be attributed to the lack of rate control capabilities which means that as application speed increased, the flow rate (L min-1) remained constant (at each height), thereby resulting in a lower applied rate (L ha-1) and thus reduced spray deposition.
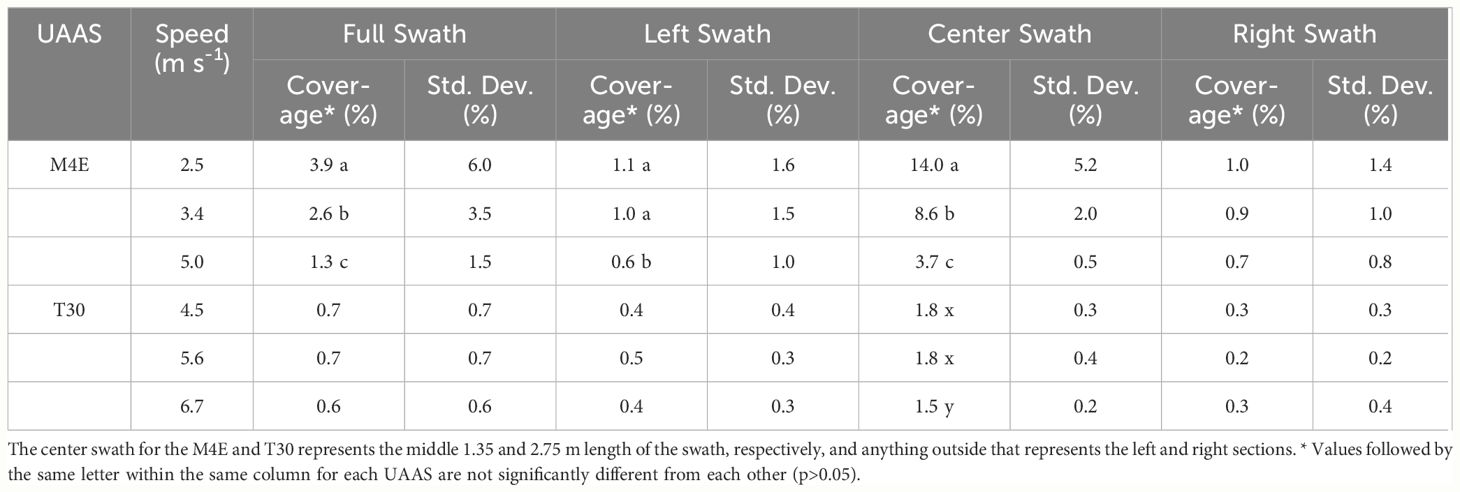
Table 5 Effect of flight speed on spray deposition within the full and different sections of the swath sections for each UAAS.
In contrast to the M4E, flight speed had a significant effect on spray coverage for the T30 only in the center swath (p=0.0027) and was non-significant (p>0.05) for all other swath sections. Within the center swath, the application speeds of 4.5 and 5.6 m s-1 demonstrated greater coverage than the highest speed of 6.7 m s-1 (Table 5; Figure 5B). The spray coverage ranged from 0.2 to 0.5% in the outer swath sections, and from 0.6 to 0.7% for the full swath regardless of the application speed. While the T30 is equipped with rate control capabilities, (i.e. it can adjust the flow rate in real-time as speed changes) the reduced coverage observed at 6.7 m s-1 is notable and may be a result of decreased propeller downwash, reducing spray flux landing within the swath. Teske et al. (2018) suggested that operating near or above a critical speed unique to each platform can instead cause rotor outwash that keeps droplets airborne, resulting in excessive off-target movement and reduced deposition in the swath.
Other studies that evaluated the effect of speed on UAAS spray coverage have reported similar findings to those recorded in this study. Several researchers utilizing a DJI MG-1 and a HSE V6A UAAS (both without rate control capabilities) found that the lowest tested flight speed of 1.0 m s-1 resulted in the highest coverage across the tested speeds of 1.0 to 7.0 m s-1 (Woldt et al., 2018; Martin et al., 2019; Hunter et al., 2020; Sinha et al., 2022). Martin et al. (2019) reported no difference in coverage among the flight speeds of 3.0, 5.0, and 7.0 m s-1 for the MG-1 and V6A while Woldt et al. (2018) found that speeds greater than 3.0 m s-1 decreased spray deposition for the V6A UAAS, however, this effect did not occur for the MG-1. Increasing flight speeds (ranging from 0.3 – 1.0 m s-1) has been shown to reduce coverage and droplet uniformity in a wind tunnel study conducted by Lv et al. (2019) utilizing a UAAS simulation device.
Similar to the flight speed, the effect of application height on spray coverage varied between the M4E and T30; however, the variability within individual swath sections was still considerably high as indicated by large standard deviation values for each UAAS (Table 6). For the M4E, application height affected spray coverage within the left (p=0.0404) and right (p=0.0025) swath sections but not in the center or full swath (p>0.05). The spray patterns in Figure 6A also show no considerable differences in spray coverage among the application heights, except at certain locations within the swath. The mean spray coverage ranged from 8.8 to 9.7% within the center section and from 2.5 to 2.6% across the full swath. In the outer swath sections, the application height of 3.0 m (approx. 1.0% coverage) resulted in a slightly improved coverage than the lower heights of 2.0 and 2.5 m (0.7 – 0.8%). Generally, spray swath is expected to increase with application height up to a certain limit. However, this increase in coverage within the outer swath sections at the 3.0 m height could be related to greater deposition of particles within the comparatively wider swath than at lower heights. Increased application heights also allow more time for the spray flux to disperse across the swath before landing, resulting in more uniform coverage (Sinha et al., 2022). Contrarily, higher application heights also increase the potential for spray drift which can reduce deposition within the swath. Propeller downwash is also influenced by application height as it is more prominent and advantageous at lower heights. Teske et al. (2018) suggested that changes in spray release height can alter the transition from downwash generated by the UAAS to outwash, which can force spray flux upwards before reaching the ground, resulting in increased airborne drift and decreased deposition uniformity.
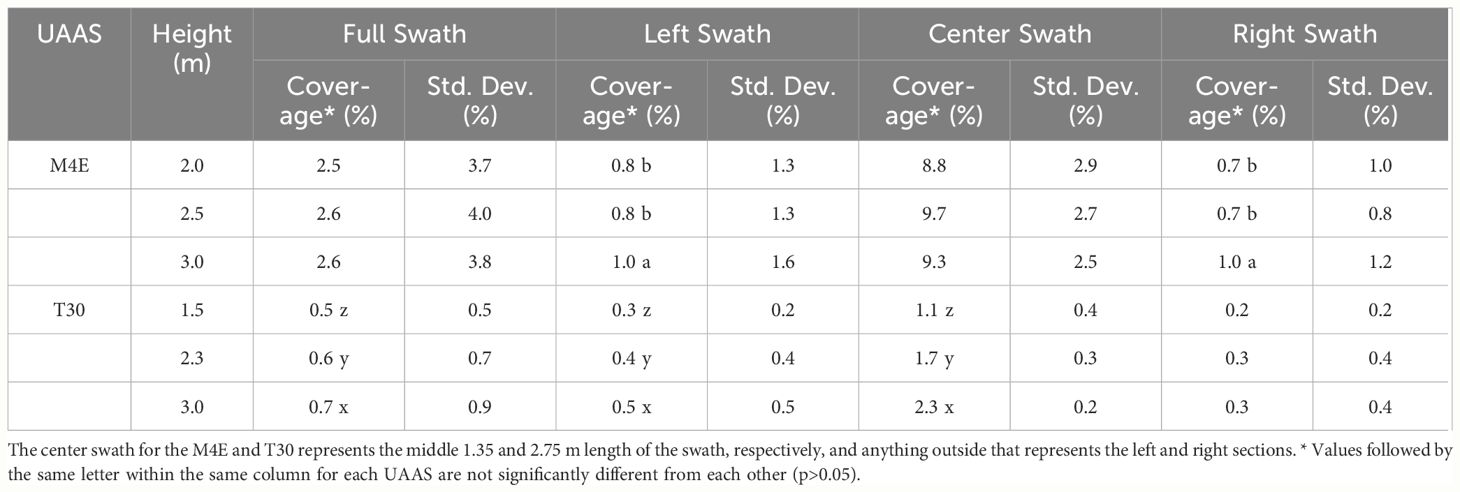
Table 6 Effect of application height on spray deposition within the full and different sections of the spray swath.
For the T30, application height had a significant effect on spray coverage within the left (p<0.0001) and center (p<0.0001) swath sections, and across the full swath (p<0.0001), but not within the right swath (p=0.0952). Within the swath sections with significant differences in coverage, the spray coverage increased with an increase in application height, with the greatest deposition occurring at the height of 3.0 m followed by the 2.3 and 1.5 m. This trend of increasing coverage with application height can also be observed from spray patterns in Figure 6B. Along with higher coverage, an increase in swath with application height was also observed, which was expected and can again be noticed in Figure 6B. Technically, the rate controller on the T30 is adjusting the flow rate (L min-1) accordingly between different swaths (programmed in the controller and based on application heights) to maintain the target application rate (L ha-1) but the results attained here for spray coverage suggest otherwise. Assuming the UAAS maintained a similar application rate of 18.7 L ha-1 between the different swaths tested in this study, the increase in flow rate with height also resulted in increased spray deposition within the swath, which was not expected. This suggests that the increased flow rate (L min-1) for the increase in height does not result in a linear increase in deposition as is expected with ground sprayers, but instead the additional spray flux may continue to land primarily within the central swath as seen in Figure 6B. However, it should also be noted that these coverage differences among application heights are small (0.1 – 0.6%) and could be possibly influenced by other operational factors as well.
Reports on the effect of height on spray deposition from previous research varied mainly due to differences in the UAAS platforms utilized in these studies. Martin et al. (2019) found no significant effect of application height (2.0, 3.0, and 4.0 m) for the DJI MG-1; however, it was significant for the V6A in which the 3.0 m application height provided the highest coverage. Lou et al. (2018) reported greater coverage and improved uniformity at a 2.0 m application height compared to a 1.5 m height utilizing the XAG’s P20 UAAS. In another study evaluating application heights of 1.5, 2.0, and 2.5 m with the MG-1, the 2.0 m application height resulted in the highest spray coverage (Nordin et al., 2021). For pesticide applications with UAAS, selecting an optimal application height is important to maximize spray deposition within the swath while reducing spray drift potential. Higher application heights weaken the effect of propeller downwash on spray flux, resulting in increased susceptibility to crosswinds, spray drift (Changling et al., 2017), and reduced canopy penetration, while lower application heights can result in decreased coverage and deposition uniformity due to an increased outwash force pushing the spray flux away from the swath (Lou et al., 2018).
The CV values for spray coverage for different theoretical swaths (grouped by all tested operational parameters) for the M4E and T30 are presented in Figures 7A, B, respectively.
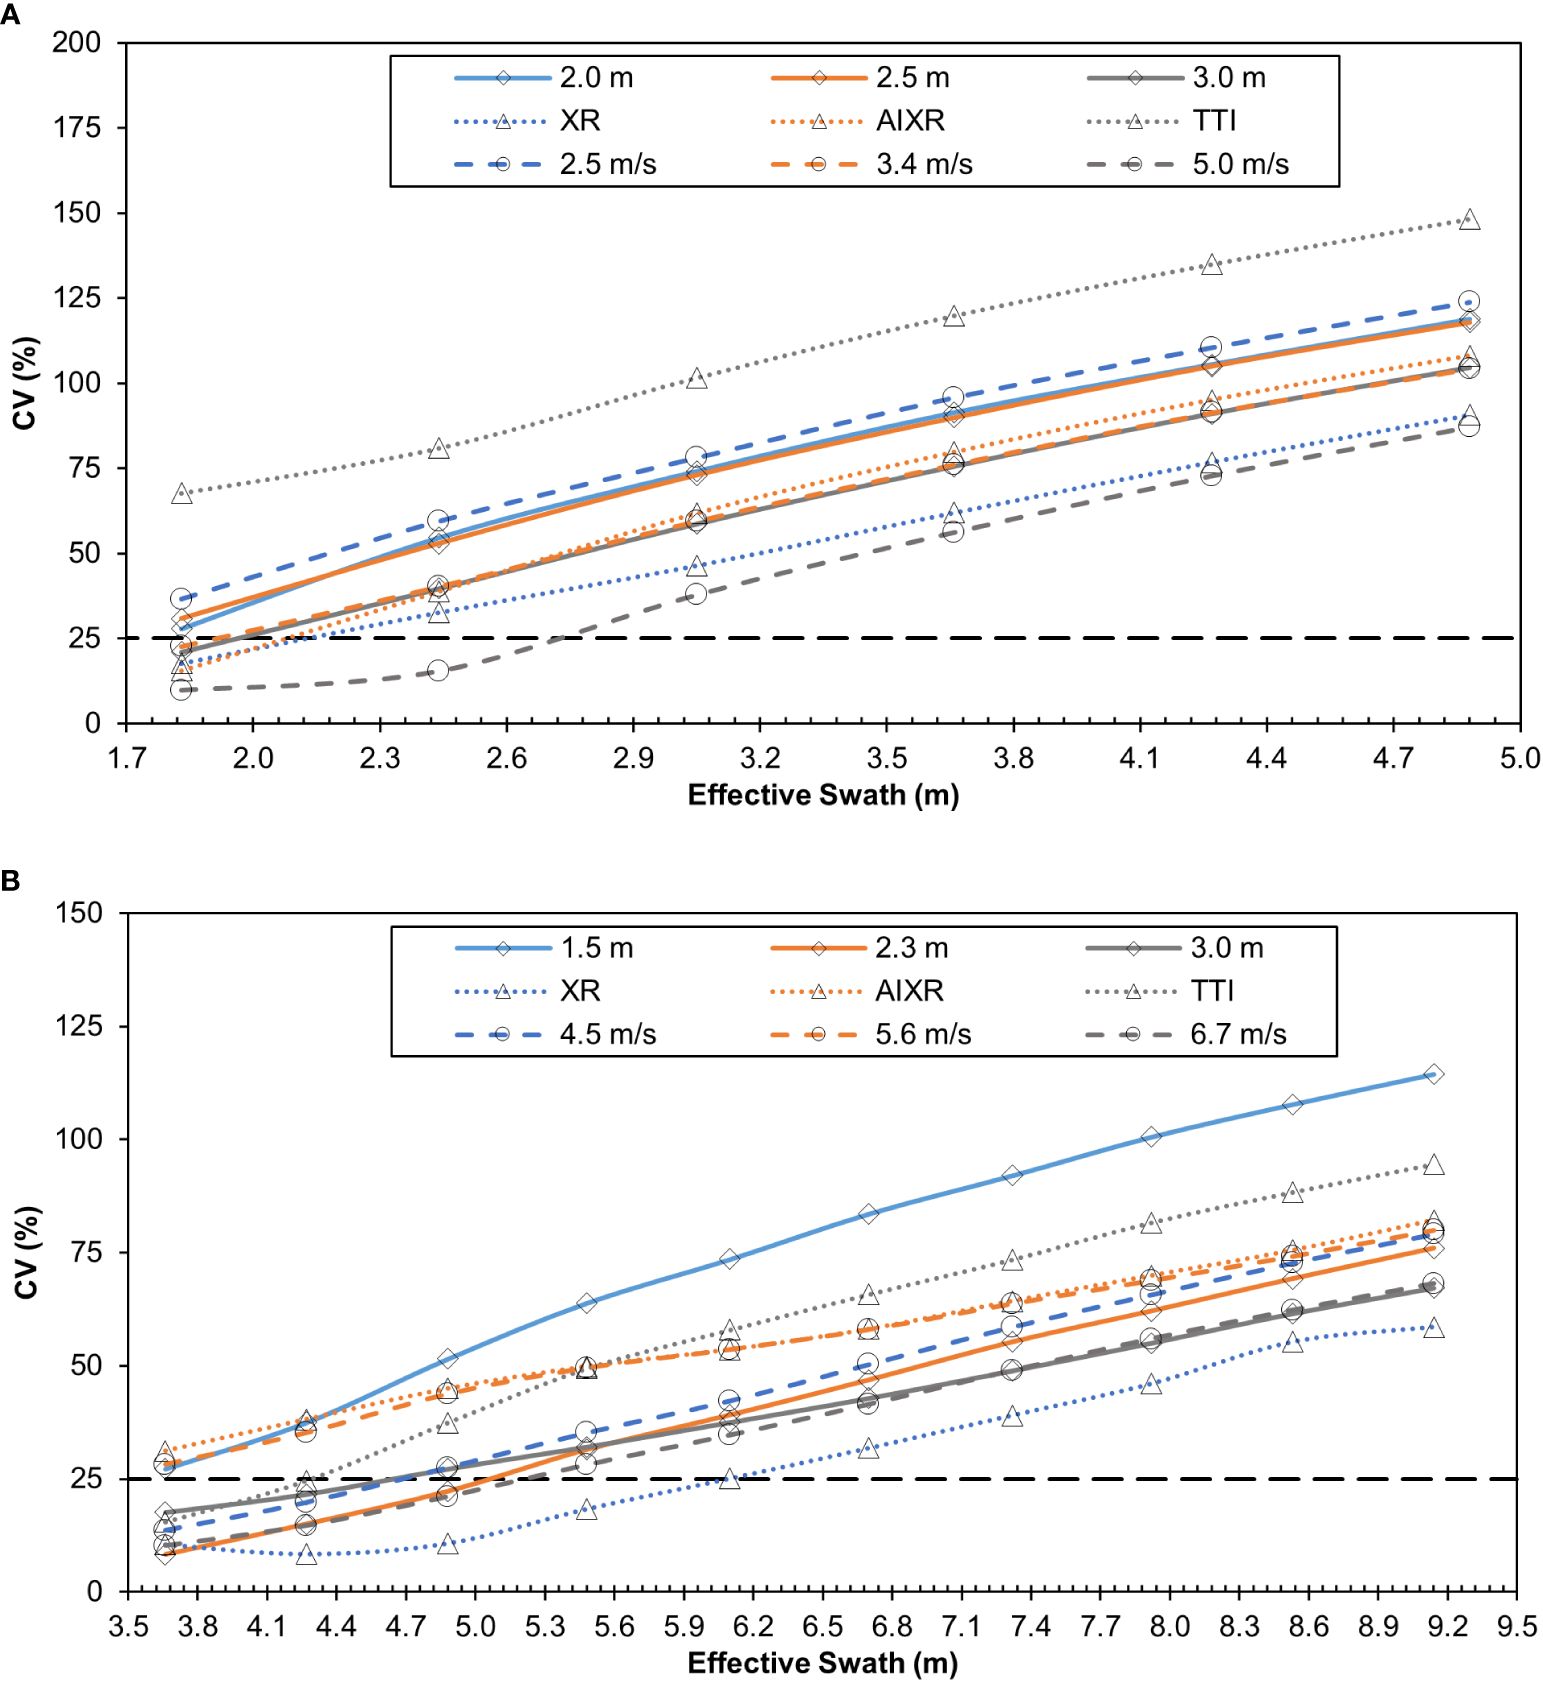
Figure 7 Coefficient of variability (CV, %) at varying effective swaths for the (A) M4E and (B) T30 UAAS under different operational parameters tested for each UAAS. Black dashed, horizontal line denotes the 25% acceptable CV.
For the M4E, all tested application parameters exhibited large variability within the swath, with CV values ranging from 9.8 to 148.2% for effective swaths ranging from 1.8 to 4.9 m (Figure 7A). The spray swath for the M4E as listed by the manufacturer (TT Aviation Technologies, Beijing, China) is 2.0 - 4.0 m, dependent on the application height (2.0 – 4.0 m). As expected, the CV increases with an increase in theoretical effective swath across all operational parameters, with the lowest CV values occurring at the narrower swaths. When considering the manufacturer-recommended swath of 2.0 to 4.0 m, only a few of the tested application parameters exhibited an acceptable CV value of ≤25%. Among the nozzle types, both the XR and AIXR nozzles had CV values in the range of 15.6 to 21.1% at an effective swath of 2.0 m. Similarly, the application speed of 3.4 and 5.0 m s-1, and the application height of 3.0 m demonstrated CV values ranging from 9.8 to 22.7% at an effective swath of 2.0 m. However, none of the tested parameters had CV values ≤25% when considering the widest manufacturer-listed effective swath of 4.0 m. In fact, 2.4 m was the widest effective swath with an acceptable CV of 15.4% and was observed for the application speed of 5.0 m s-1. Overall, this data suggests that for the M4E, fine to medium spray droplets (XR and AIXR nozzles) along with a higher flight speed (5.0 m s-1) and application height (3.0 m) resulted in the minimum spray deposition variability within the swath while larger spray droplets (TTI nozzle), slower flight speed (2.5 m s-1) and the lowest application height (2.0 m) increased in-swath variability.
In contrast to the M4E, the spray deposition variability within the swath for the T30 was relatively lower across all application parameters. The CV values ranged from 8.3 to 114.4% across the computed effective swaths of 3.7 to 9.1 m (Figure 7B). Once again, the general trend observed was that the uniformity within the swath (CV values) decreased with an increase in swath and vice-versa. The spray swath for the T30 reported by the manufacturer (SZ DJI Technology Co., Shenzhen, China) is 4.0 - 9.0 m at the application height of 1.5 - 3.0 m from the ground or target crop. Among all tested parameters, the XR and TTI nozzles, flight speeds of 4.5 and 6.7 m s-1, and application heights of 2.3 and 3.0 m exhibited CV values ≤25% when considering an effective swath of 4.0 m. However, as observed for the M4E, none of the operational parameters had an acceptable CV value when considering the manufacturer-listed widest effective swath of 9.0 m. The widest effective swath with an acceptable variability (CV≤25%) was observed to be ~5.5 m for the XR nozzle. In general, the in-swath deposition variability for the T30 was highest when using coarser spray droplets (AIXR and TTI nozzles) and flying at a lower altitude (1.5 m). Interestingly, in-swath variability was low for both the slowest and the fastest flight speeds (4.5 and 6.7 m s-1) used in this study for effective swaths below ~4.9 m.
Comparing trends across both UAAS platforms, the in-swath deposition variability was observed to be minimal when using XR nozzles (finer droplets), operating at increased flight speeds, and higher application heights. These results were similar to the findings of Sinha et al. (2022) where the authors also reported minimum spray deposition variability within the swath for finer droplet nozzles, increased flight speeds, and increased heights for the UAAS (MG-1 and V6A) used in their study. For both the M4E and T30, the widest effective swath with an acceptable in-swath variability (CV≤25%) was also considerably narrower than the widest manufacturer-listed swaths of 4.0 and 9.0 m (M4E and T30, respectively). Few of the tested application parameters demonstrated acceptable variability within the swath at the narrower spray swaths reported by the UAAS manufacturers (2.0 and 4.0 m for M4E and T30, respectively). Since each UAAS platform has its unique spray characteristics, the results obtained here emphasize the importance of using proper calibration procedures to determine an effective swath and the corresponding operational parameters that provide uniform spray distribution within that swath.
The ASABE standard S386.2 (ASABE, 2018) outlines the procedure to evaluate spray patterns for aerial applications and to define an effective swath without specifying an acceptable CV for aerial applications. This standard is used widely to evaluate spray pattern uniformity of aerial applications with manned aircraft. A CV range of 20 to 30% is widely utilized in existing literature; however, these studies have consistently found limited application parameter combinations that result in acceptable deposition variability (Dongyan et al., 2015; Martin et al., 2019; Sinha et al., 2022). While several efforts are underway to modify the current standards to include spray pattern analysis of applications with UAAS, significant differences in spray characteristics between manned and UAAS applications may necessitate the development of a new standard and/or procedures that define different acceptable parameters for aerial applications with UAAS.
The availability of new UAAS platforms and their utilization for pesticide applications in agriculture is increasing rapidly. Therefore, research investigations including the current and other recent studies (Hunter et al., 2019; Martin et al., 2019; Gibbs et al., 2021; Sinha et al., 2022) are important to better understand the spray performance of different UAAS platforms under varying conditions, and generate scientific information that can encourage the sensible and effective use of this technology. Currently, appropriate performance data on most new UAAS platforms is limited and their usage by applicators is based primarily on the operational ranges (such as height, speed, and swath) provided by the manufacturers. Additionally, most pesticide applications with UAAS today occur with an intent to maximize field efficiency i.e., applying low rates to cover more area and maximize the efficiency of each tank load. Consequently, most UAAS applications are being conducted at the widest possible swaths, using maximum operating speeds and higher application heights. However, the results obtained in this study for both the M4E and T30 (which was one of the most widely used platforms during the time period this study was conducted) suggest that spray performance (in-swath deposition and uniformity) is highly inconsistent and variable across the range of operational parameters recommended by the manufacturers. For both UAAS used in this study, the increased application height of 3.0 m resulted in comparable or more uniform deposition than lower altitudes, and also overall greater coverage for the T30. While application heights >3.0 m were not tested in the present study, it can be assumed that application height will cease to improve deposition at a certain upper limit. Application height has also been identified as one of the primary factors influencing the drift potential of spray droplets (Lou et al., 2018). In this study, for both UAAS platforms, the maximum flight speeds (5.0 and 6.7 m s-1 for the M4E and T30, respectively) were also tested and the results suggested reduced coverage within the center of the swath compared to the two lower speeds. Interestingly, the higher flight speeds for both the M4E and T30 also exhibited improved deposition uniformity within various computed effective spray swaths. While the reduced deposition at increased speeds for the M4E was expected due to the lack of rate control capabilities, these findings for T30 were not anticipated. These findings suggest an increased potential for inadequate application deposition and efficacy at these parameters, and warrant further investigation into operational parameters to maximize the potential of this technology.
Increased deposition and uniformity within the swath are desired and considered optimal for UAAS applications. However, increased deposition does not necessarily result in improved uniformity within the swath, which was noticed for both the M4E and T30 in the present study. Therefore, when evaluating the spray performance of UAAS, both in-swath coverage and uniformity need to be considered for the selection of optimal parameters along with considering other environmental factors. A majority of UAAS platforms (models available with nozzles) come equipped with smaller orifice (usually 015) XR nozzles. For both the M4E and T30 in this study, the finer droplets produced by the XR nozzles showed comparable spray deposition and uniformity across wider effective swaths when compared to other nozzle types (AIXR and TTI). However, previous UAAS studies also suggest the greatest drift potential of finer droplets as compared to coarser droplets (Wang et al., 2021). Both the AIXR and TTI nozzles showed comparable coverage to the XR nozzle but within reduced swaths. These findings indicate that the proper nozzle selection on these UAAS to achieve acceptable deposition and uniformity can vary based on prevalent environmental conditions. While XR nozzles can be used at wider swaths in low-wind application conditions, AIXR or TTI nozzles may be better suited at narrower swaths for applications where there is an increased potential for spray drift. Additionally, the low-volume applications that are common with UAAS applications can also have an impact on the efficacy of contact (non-systemic) pesticides that often require greater and uniform deposition for effective pest control. In conjunction with lower application rates, improper selection of flight parameters can also lead to ‘streaking’ where a high dose of product is applied at certain locations within the swath while other sections do not receive an adequate amount of pesticide product. If not managed properly, streaking could have serious implications on effective pest control and should be prevented through preliminary swath testing to determine optimal application parameters unique to each UAAS model and the application type.
Similar to the T30 UAAS used in the present study, most new UAAS platforms are equipped with a rate control technology and are expected to adjust flow rate accordingly with changes in speed and swath. However, the accuracy and capabilities of these rate control systems on UAAS, especially at maximum speeds and increased swaths, have not been investigated. Both increased application heights and flight speeds influence propeller downwash and its ability to propel spray flux towards the ground or into crop canopies; therefore, the impact of varying flight heights and speeds on downwash, and it’s subsequent effect on spray performance should be evaluated as well. Additionally, newer UAAS platforms warrant field evaluations of each UAAS under varying environmental conditions to establish operational parameters optimal for unique application conditions. By extension, the assessment of in-swath deposition with adjacent consecutive passes can provide better insight into the actual variability and impact of environmental conditions on spray performance in real-world application conditions and thus needs to be conducted.
Compared to ground applications, most pesticide applications with UAAS occur using low application rates ranging from 18.7 to 46.8 L ha-1. At these low-volume applications, field testing with actual products needs to be conducted to determine if the pesticide efficacy is adequate to effectively and economically manage pest pressures in different crops. Furthermore, several studies have suggested differences in the spray behavior of nozzle types at varying application rates (Hunter et al., 2019; Wang et al., 2019). Thus, future research should also evaluate the spray performance of different nozzle types across varying application rates. Several newer UAAS models such as the XAG P100 and DJI Agras T40 are equipped with rotatory atomizers to generate spray droplets instead of traditional hydraulic nozzles. The spray performance of rotary atomizers and their potential benefits over conventional nozzles on UAAS during pesticide applications is currently limited and needs to be investigated.
The spray performance, in terms of spray deposition and uniformity within the swath, was assessed for two commercial UAAS platforms (TTA M4E and DJI Agras T30) using different nozzle types, flight speeds, and application heights. The following conclusions can be drawn from the results obtained in this study:
● Spray deposition was highly variable across the swath for both UAAS with a majority of the coverage concentrated towards the center of the swath and significantly decreased coverage towards the outer swath sections. This trend was observed across all tested parameters.
● The XR nozzle exhibited lower coverage than the AIXR and TTI nozzles for the M4E, and the TTI nozzle for the T30 in the center of the swath. However, the XR nozzle showed greater deposition uniformity across wider effective swaths than the AIXR and TTI nozzles for both UAAS platforms.
● Spray coverage decreased with an increase in flight speed but demonstrated improved in-swath deposition uniformity for both UAAS platforms.
● Application height had no effect on spray coverage for the M4E but showed improvement in coverage at higher altitudes for the T30. The highest application height (3.0 m) also provided more uniform deposition within the swath for both UAAS platforms.
● For each UAAS platform, only a few operational parameters exhibited desired spray uniformity (CV≤25%) when considering the manufacturer-recommended swath ranges. The widest effective swath with acceptable variability for both UAAS platforms was considerably narrower than the manufacturer-reported swath.
The raw data supporting the conclusions of this article will be made available by the authors, without undue reservation.
CB: Writing – original draft, Writing – review & editing. SV: Funding acquisition, Methodology, Supervision, Writing – review & editing. GR: Writing – review & editing. SL: Writing – review & editing.
The author(s) declare that no financial support was received for the research, authorship, and/or publication of this article.
The authors would like to thank Ravi Meena, Matthew Tucker, and Madan Sapkota for their assistance with data collection.
The authors declare that the research was conducted in the absence of any commercial or financial relationships that could be construed as a potential conflict of interest.
All claims expressed in this article are solely those of the authors and do not necessarily represent those of their affiliated organizations, or those of the publisher, the editors and the reviewers. Any product that may be evaluated in this article, or claim that may be made by its manufacturer, is not guaranteed or endorsed by the publisher.
The Supplementary Material for this article can be found online at: https://www.frontiersin.org/articles/10.3389/fagro.2024.1418623/full#supplementary-material
American Society of American and Biological Engineers [ASABE] (2018). S386.2 Calibration and Distribution Pattern Testing of Agricultural Aerial Application Equipment (American Society of American and Biological Engineers).
American Society of American and Biological Engineers [ASABE] (2020). S572.3 Spray Nozzle Classification by Droplet Spectra (American Society of American and Biological Engineers).
Atwood D., Paisley-Jones C. (2017). Pesticide Industry Sales and Usage 2008–2012 Market Estimates (Washington, DC: United States Environmental Protection Agency).
Bird S. L., Esterly D. M., Perry S. G. (1996). Off-target deposition of pesticides from agricultural aerial spray applications. J. Environ. Qual. 25, 1095–1104. doi: 10.2134/jeq1996.00472425002500050024x
Changling W., Jianli S., Xiongkui H., Zhichong W., Shilin W., Yanhua M. (2017). Effect of flight parameters on distribution characteristics of pesticide spraying droplets deposition of plant-protection unmanned aerial vehicle. TCSAE 33, 109–216. doi: 10.11975/j.issn.1002-6819.2017.23.014
Dongyan Z., Liping C., Ruirui Z., Gang X., Yubin L., Hoffmann W. C., et al. (2015). Evaluating effective swath width and droplet distribution of aerial spraying systems on M-18B and Thrush 510G airplanes. Biol. Eng. 8 (2), 21–30. doi: 10.3965/j.ijabe.20150802.1493
Faiçal B. S., Freitas H., Gomes P. H., Mano L. Y., Pessin G., De Carvalho A. C. P. L. F., et al. (2017). An adaptive approach for UAV-based pesticide spraying in dynamic environments. Comput. Electron. Agric. 138, 210–223. doi: 10.1016/j.compag.2017.04.011
Gibbs J. L., Peters T. M., Heck L. P. (2021). Comparison of droplet size, coverage, and drift potential from UAV application methods and ground application methods on row crops. Trans. ASABE 64, 819–828. doi: 10.13031/trans.14121
Giles D., Billing R. (2015). Deployment and performance of a UAV for crop spraying. Chem. Eng. Trans. 44, 307–312. doi: 10.3303/CET1544052
He X. (2018). Rapid development of unmanned aerial vehicles (UAV) for plant protection and application technology in China. outlook Pest man 29, 162–167. doi: 10.1564/v29_aug_04
Hunter J. E., Gannon T. W., Richardson R. J., Yelverton F. H., Leon R. G. (2019). Coverage and drift potential associated with nozzle and speed selection for herbicide applications using an unmanned aerial sprayer. Weed Technol. 34, 235–240. doi: 10.1017/wet.2019.101
Hunter J. E., Gannon T. W., Richardson R. J., Yelverton F. H., Leon R. G. (2020). Coverage and drift potential associated with nozzle and speed selection for herbicide applications using an unmanned aerial sprayer. Weed Technol. 34, 235–240. doi: 10.1017/wet.2019.101
Lan Y., Shengde C., Fritz B. K. (2017). Current status and future trends of precision agricultural aviation technologies. Biol. Eng. 10 (3), 1–17. doi: 10.3965/j.ijabe.20171003.3088
Lou Z., Xin F., Han X., Lan Y., Duan T., Fu W. (2018). Effect of unmanned aerial vehicle flight height on droplet distribution, drift and control of cotton aphids and spider mites. Agronomy 8, 187. doi: 10.3390/agronomy8090187
Lv M., Xiao S., Tang Y., He Y., Jinhua Polytechnic College, College of Biosystems Engineering and Food Science, et al. (2019). Influence of UAV flight speed on droplet deposition characteristics with the application of infrared thermal imaging. Int. J. Agric. Biol. Eng. 12, 10–17. doi: 10.25165/j.ijabe.20191203.4868
Martin D. E., Woldt W. E., Latheef M. A. (2019). Effect of application height and ground speed on spray pattern and droplet spectra from remotely piloted aerial application systems. Drones 3, 83. doi: 10.3390/drones3040083
Martinez-Guanter J., Agüera P., Agüera J., Pérez-Ruiz M. (2020). Spray and economics assessment of a UAV-based ultra-low-volume application in olive and citrus orchards. Precis. Agric. 21, 226–243. doi: 10.1007/s11119–019-09665–7
Nordin M. N., Mat Jusoh M. S., Abu Bakar B. H., Ahmad M. T., Mail M. F., Tet Vun C., et al. (2021). Study on water distribution of spraying drone by different speed and altitude. Adv. Agric. Food Res. J. 2 (2), a0000215. doi: 10.36877/aafrj.a0000215
Richardson B., Rolando C. A., Kimberley M. O. (2020). Quantifying spray deposition from a UAV configured for spot spray applications to individual plants. Trans. ASABE 63, 1049–1058. doi: 10.13031/trans.13724
Sinha R., Johnson J., Power K., Moodie A., Warhurst E., Barbosa R. (2022). Understanding spray attributes of commercial UAAS as impacted by operational and design parameters. Drones 6, 281. doi: 10.3390/drones6100281
Struttman T., Zawada J. (2019). 2019 NAAA Aerial Applications Industry Survey: Operators (Alexandria Virginia: National Agricultural Aviation Association).
Teske M. E., Wachspress D. A., Thistle H. W. (2018). Prediction of aerial spray release from UAVs. Trans. ASABE 61, 909–918. doi: 10.13031/trans.12701
Wang G., Lan Y., Qi H., Chen P., Hewitt A., Han Y. (2019). Field evaluation of an unmanned aerial vehicle (UAV) sprayer: effect of spray volume on deposition and the control of pests and disease in wheat. Pest. Manage. Sci. 75, 1546–1555. doi: 10.1002/ps.5321
Wang L., Xu M., Hou Q., Wang Z., Lan Y., Wang S. (2021). Numerical verification on influence of multi-feature parameters to the downwash airflow field and operation effect of a six-rotor agricultural UAV in flight. Comput. Electron. Agric. 190, 106425. doi: 10.1016/j.compag.2021.106425
Woldt W., Martin D., Lahteef M., Kruger G., Wright R., McMechan J., et al. (2018). Field Evaluation of Commercially Available Small Unmanned Aircraft Crop Spray Systems (Michigan: American Society of Agricultural and Biological Engineers). doi: 10.13031/aim.201801143
Xiongkui H., Bonds J., Herbst A., Langenakens J. (2017). Recent development of unmanned aerial vehicle for plant protection in East Asia. Biol. Eng. 10 (3), 18–30. doi: 10.3965/j.ijabe.20171003.3248
Keywords: unmanned aerial application systems (UAAS), spray deposition, uniformity, effective swath, nozzle types, flight speeds, application height
Citation: Byers C, Virk S, Rains G and Li S (2024) Spray deposition and uniformity assessment of unmanned aerial application systems (UAAS) at varying operational parameters. Front. Agron. 6:1418623. doi: 10.3389/fagro.2024.1418623
Received: 16 April 2024; Accepted: 30 May 2024;
Published: 27 June 2024.
Edited by:
Sergio Vélez, Wageningen University and Research, NetherlandsReviewed by:
Evans Asenso, University of Ghana, GhanaCopyright © 2024 Byers, Virk, Rains and Li. This is an open-access article distributed under the terms of the Creative Commons Attribution License (CC BY). The use, distribution or reproduction in other forums is permitted, provided the original author(s) and the copyright owner(s) are credited and that the original publication in this journal is cited, in accordance with accepted academic practice. No use, distribution or reproduction is permitted which does not comply with these terms.
*Correspondence: Simerjeet Virk, c3ZpcmtAdWdhLmVkdQ==
Disclaimer: All claims expressed in this article are solely those of the authors and do not necessarily represent those of their affiliated organizations, or those of the publisher, the editors and the reviewers. Any product that may be evaluated in this article or claim that may be made by its manufacturer is not guaranteed or endorsed by the publisher.
Research integrity at Frontiers
Learn more about the work of our research integrity team to safeguard the quality of each article we publish.