- 1Department of Electrical and Photonics Engineering, Technical University of Denmark (DTU), Kongens Lyngby, Denmark
- 2UMR6082 - FOTON, CNRS, University Rennes, Rennes, France
Nowadays, as the ever-increasing demand for more powerful computing resources continues, alternative advanced computing paradigms are under extensive investigation. Significant effort has been made to deviate from conventional Von Neumann architectures. In-memory computing has emerged in the field of electronics as a possible solution to the infamous bottleneck between memory and computing processors, which reduces the effective throughput of data. In photonics, novel schemes attempt to collocate the computing processor and memory in a single device. Photonics offers the flexibility of multiplexing streams of data not only spatially and in time, but also in frequency or, equivalently, in wavelength, which makes it highly suitable for parallel computing. Here, we numerically show the use of time and wavelength division multiplexing (WDM) to solve four independent tasks at the same time in a single photonic chip, serving as a proof of concept for our proposal. The system is a time-delay reservoir computing (TDRC) based on a microring resonator (MRR). The addressed tasks cover different applications: Time-series prediction, waveform signal classification, wireless channel equalization, and radar signal prediction. The system is also tested for simultaneous computing of up to 10 instances of the same task, exhibiting excellent performance. The footprint of the system is reduced by using time-division multiplexing of the nodes that act as the neurons of the studied neural network scheme. WDM is used for the parallelization of wavelength channels, each addressing a single task. By adjusting the input power and frequency of each optical channel, we can achieve levels of performance for each of the tasks that are comparable to those quoted in state-of-the-art reports focusing on single-task operation. We also quantify the memory capacity and nonlinearity of each parallelized RC and relate these properties to the performance of each task. Finally, we provide insight into the impact of the feedback mechanism on the performance of the system.
1 Introduction
Over recent years, the development of photonic computing has attracted significant interest within the scientific community and positioned photonics as a potential technology for novel computing schemes (Huang et al., 2022; McMahon, 2023). Light possesses unique properties that can be harnessed for computing such as the capability for massive parallelization. This can be achieved by multiplexing several optical channels using different wavelengths within an available range of the electromagnetic spectrum. This is a well-established technique used for optical communication known as wavelength division multiplexing (WDM). In WDM, a high density of channels can be transmitted through the same medium with relatively low interference between them, ultimately boosting the total communication capacity as several data streams can be transmitted simultaneously. If a similar principle is used for computing, this can be translated into different computing tasks being addressed simultaneously.
Von Neumann architectures are often penalized by bottlenecks due to the intrinsic lack of collocation of memory and computing processors (Hennessy and Patterson, 2019; Cucchi et al., 2022; El Srouji et al., 2022). So-called “in-memory” alternatives are emerging in electronic platforms to counter this issue (Sun et al., 2023). Similarly, photonics has the potential to provide collocated higher-dimensional processor capabilities through nonlinear optical phenomena and, at the same time, provide memory enhancement of the system (El Srouji et al., 2022). Furthermore, it can enable parallel processing by using well-established techniques such as WDM, in a similar way to optical communications, if different optical channels could address several computing tasks (Bai et al., 2023; Zhou et al., 2022).
Recently, there has also been a trend in the development of nonvolatile photonic memories that can be efficiently reconfigured. This could help close the gap toward all-photonic computing (Bogaerts et al., 2020). However, a main concern when translating concepts such as a higher dimensionality of data space and buffer memory from electronics to photonics is the decrease in scalability of photonic devices. The footprint of optical technologies can become larger than electronics when trying to implement complex machine learning architectures such as in the case of conventional deep neural networks (NNs). In this sense, novel computing paradigms more suitable for physical implementation e.g., through photonics, have been under extensive investigation lately (Van der Sande et al., 2017; McMahon, 2023).
Hence, we now center our attention on reservoir computing (RC), a recurrent NN scheme that presents interesting features in terms of physical implementation (Cucchi et al., 2022; Schuman et al., 2022; Huang et al., 2022). RC is able to solve complex and memory-demanding tasks (time-series prediction, classification, financial forecasting, channel equalization, etc.) while requiring simpler training than other conventional NN schemes, as only linear regression is required. In its general principle, RC builds a dynamical input-to-output mapping of signals by increasing the dimensional space of the input sequences. The core of this scheme is the reservoir layer, which must be capable of providing fading memory by the use of recurrent connections between its nodes. This layer is also responsible for the nonlinear temporal expansion (kernel) so that different input signals are easier to differentiate. The weights of the connections between nodes are random and fixed at the input and reservoir layers (Cucchi et al., 2022).
RC is a nonlinear dynamical system driven by the input signal, which does not require back-propagation to minimize the error between the prediction and the target. In traditional NNs, this back-propagation of errors is usually addressed with well-established gradient descent algorithms, which can be expensive in terms of time, memory, and energy required to train a deep NN. In RC, the input and reservoir connections are not trained. The nonlinear dynamics target the nonlinear separability of its states at the output. Hence, it only requires linear regression as the training algorithm in the output layer. It is this simplicity that makes the paradigm suitable for physical implementation, as only the recorded states of the reservoir are required during the training stage without the need to modify the corresponding weights. More in-depth details on RC can be found in extensive reviews on the subject (Van der Sande et al., 2017; Cucchi et al., 2022; Yan et al., 2024).
As in other NN schemes, increasing the number of neurons, i.e., nodes, increases the dimensionality of the RC as each node provides an additional degree of freedom to the nonlinear dynamics. One way to implement this in RC is to spatially increase the number of nodes. In terms of RC physical implementation through photonics, this has been proposed in multiple works in the literature, where several identical photonic devices play the role of nonlinear nodes. We outline some examples: Using semiconductor optical amplifiers (SOA) (Vandoorne et al., 2008), microring resonators (MRRs) (Mesaritakis et al., 2013), as well as networks of multimode interferometers and other passive photonic devices (Vandoorne et al., 2014; Masaad et al., 2023). Similarly, the spatial multiplexing of nodes has been realized by using spatial light modulators and free-space optics (Rafayelyan et al., 2020; Bu et al., 2022). However, spatial-based RC has the disadvantage of quickly growing in size when increasing the number of nodes.
In order to decrease the footprint of the photonic implementation, we opt for a different implementation of RC that emerged more recently, known as time-delay RC (TDRC), first introduced in (Appeltant et al., 2011). In TDRC, the virtual nodes of the reservoir are multiplexed in time; therefore, a single physical nonlinear node is required. On the other hand, the throughput of the system becomes constrained by the processing rate of the virtual nodes. Nevertheless, as only one physical nonlinear device is required in the reservoir layer, this paradigm has gained a lot of attraction for photonic RC implementations. Several TDRC works have been reported in the literature, in which different optical nonlinear phenomena or behaviors are exploited. We briefly mention some of the main techniques used: The nonlinear response of an SOA (Duport et al., 2012), the sine nonlinearity of an integrated Mach-Zehnder modulator (Appeltant et al., 2011; Paquot et al., 2012), the nonlinear dynamics of semiconductor lasers (Bueno et al., 2017; Skalli et al., 2022) and recently, the nonlinear dynamics of a silicon MRR, first proposed for a TDRC in (Donati et al., 2022). Usually, in these implementations, the memory of the reservoir is enhanced through the means of a feedback loop mechanism by which physically delayed versions of inputs to the system can also influence the state of the reservoir. The photo-detection stage in the above-stated works also provides some degree of nonlinearity.
In previous studies, we analyzed the MRR-based TDRC scheme by studying how the time constants of the nonlinear effects that come into play in the MRR cavity affect the TDRC performance as a function of the input power to the MRR and frequency detuning from the MRR resonance (Giron Castro et al., 2024b). This provided insights into the different regimes of operation of MRR-based photonic TDRC and was extended to address different types of computing tasks. We investigated the best performance achievable in each of the tasks by adjusting the optical parameters of the scheme (Giron Castro et al., 2024a). Recently, MRR-based TDRC was experimentally implemented in (Donati et al., 2024), by using a fiber-based feedback loop. Its performance was assessed for Boolean operation and time-series prediction tasks.
These studies on MRR-based TDRC however, focused on investigating the system when addressing a single task at a time. This is where the benefits of WDM can come into play to enhance the computing capacity of photonic RC schemes. For instance, in (Gooskens et al., 2022), the wavelength dimension is used in a photonic RC scheme to enhance the performance of a specific task (nonlinear signal equalization and Boolean operations). Similarly, in (Li et al., 2023) WDM is used in an RC based on a Fabry-Perot semiconductor laser to achieve superior throughput and performance in the task of signal equalization in an optical fiber communication link. Lastly, in (Lupo et al., 2023) a photonic RC based on phase modulation and spectral filtering demonstrated the simultaneous operation of two different instances of the same task, which are encoded using frequency combs. In an initial study (Giron Castro et al., 2024), we combined WDM with MRR-based TDRC to show that this scheme also offers the potential of parallel computing by simultaneously addressing three distinct computing tasks.
In this work, we extend the study in (Giron Castro et al., 2024) by systematically analyzing the memory and nonlinear capabilities of the proposed WDM MRR-based TDRC scheme and investigating the impact of additional computing tasks in parallel. Finally, we quantify the effect of the phase control in the external waveguide that is used in this scheme as a feedback mechanism. The numerical model of the system is based on the well-studied temporal coupled-mode theory (TCMT).
The structure of the article is as follows: In Section 2 we introduce WDM MRR-based TDRC and further detail each of the layers of the setup, model, and optical properties of the scheme. In Section 3 we describe each of the computing tasks addressed in this work as well as the metrics of performance, nonlinearity, and memory capacity of the system. In Section 4 we present and discuss the results of our investigation. Finally, we summarize the conclusions of this work in Section 5.
2 Multitask WDM MRR-based TDRC
On a high level, the TDRC scheme based on an MRR relies on injecting the input data encoded onto an optical carrier into the MRR at its input port and detecting a non-linearly transformed version at the drop port. An additional feedback connection with an optimized delay is normally included between the through and add port of the MRR to provide additional memory (Donati et al., 2022; Donati et al., 2024; Giron Castro et al., 2024b).
An MRR, however, is characterized by a frequency-periodic response. Our proposal is then to use several resonances of the MRR as the base of a WDM TDRC where we use multiple optical channels (each detuned from its respective resonance) to address more computing tasks simultaneously. In the following subsections, we describe the frequency allocation process of each channel and the details of each layer of the system.
2.1 Setup and frequency allocation
The simulated system is shown in Figure 1. We consider
where
where
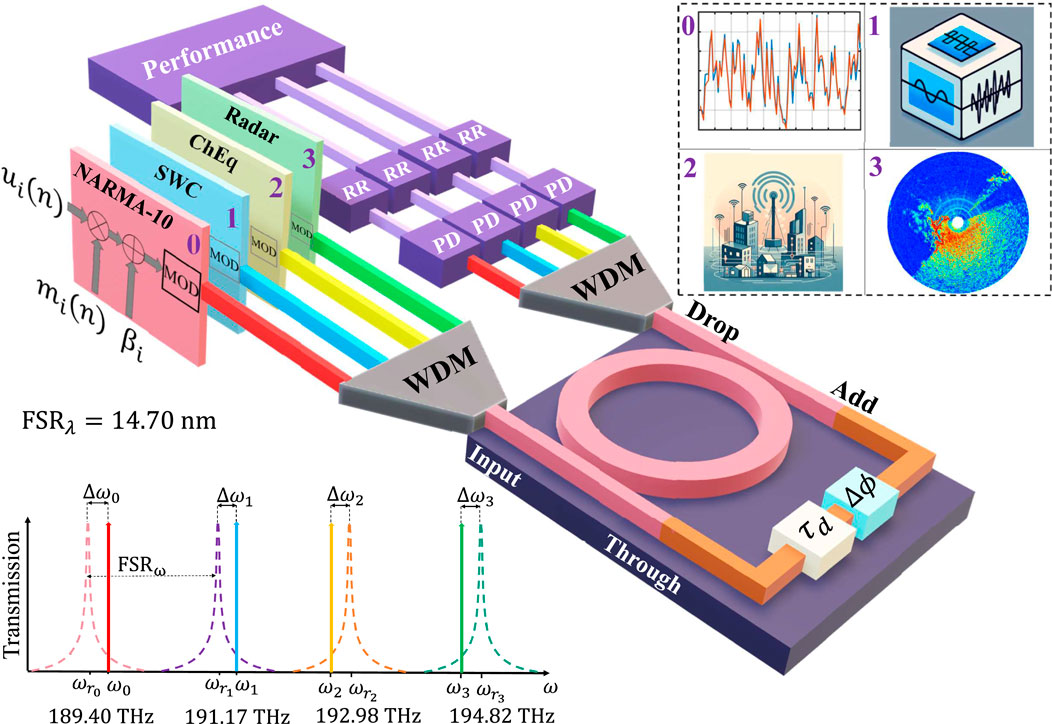
Figure 1. WDM MRR-based TDRC scheme addressing four different tasks (top right inset): Channel 0: NARMA-10 time-series prediction. Channel 1: Signal waveform classification (SWC). Channel 2: Wireless channel equalization (ChEq). Channel 3: Radar signal prediction. On the bottom left, is the frequency allocation of the optical channels. PD: Photodiode. RR: Ridge regression.
2.2 Input layer
The input symbol sequence of each task,
Each
The optical channels are then modulated by their respective masked input data sequence. The modulator (MOD) block in Figure 1 refers to the encoding of the information in the intensity of the optical signal when pre-processing the data. Each optical channel is modulated in power linearly. Subsequently, the modulated optical channels are wavelength-multiplexed and injected into the input port of the MRR. The resulting electric field of the
2.3 Reservoir layer
We consider a silicon-on-insulator (SOI) MRR with an input signal wavelength centered around 1,550 nm. Given the bandgap of silicon, the electromagnetic field in such a wavelength range triggers the generation of free carriers via two-photon absorption (TPA) in the MRR cavity. The surge of excess carriers yields free carrier dispersion (FCD), which decreases the effective refractive index of the silicon, and results in a blue shift of the MRR resonance. Free-carrier absorption losses and the subsequent conversion of optical power to heat increase the temperature in the cavity. The resulting thermo-optic (TO) effect increases the refractive index and causes a red shift of the resonance. The nonlinear dynamics of FCD and the TO effect are a source of multistability and self-pulsing in the MRR, which have been extensively studied over the years (Johnson et al., 2006; Van Vaerenbergh et al., 2012; Zhang et al., 2013; Borghi et al., 2021).
Henceforth, the MRR is an optical device capable of generating nonlinear optical dynamics that can be used for computing applications in SOI platform as reviewed in (Biasi et al., 2024). The input data of MRR-based TDRC modulates these dynamics to achieve the nonlinear temporal expansion of the input. The lifetime of the generated free carrier is usually in the order of 1–10 ns while the TO effect is slower in silicon: The thermal time constant is an order of magnitude higher (Zhang et al., 2013; Biasi et al., 2024). Therefore, modulating the input data sequence with a rate (1 GBd) results in a symbol duration with a similar order of magnitude as the time constants governing the nonlinear dynamics. This, in turn, allows us to exploit such nonlinear dynamics for computing purposes.
We mathematically modeled the nonlinear effects in the MRR cavity when injecting multiple optical channels in the MRR. We use TCMT and consider the contribution of the modal amplitude of each optical channel
where we define
The first term consists of the detuning between the optical channel and resonance (
where the first term accounts for the loss rate due to the cavity waveguide attenuation
where
The TCMT model also includes the rate equations for
The time constants
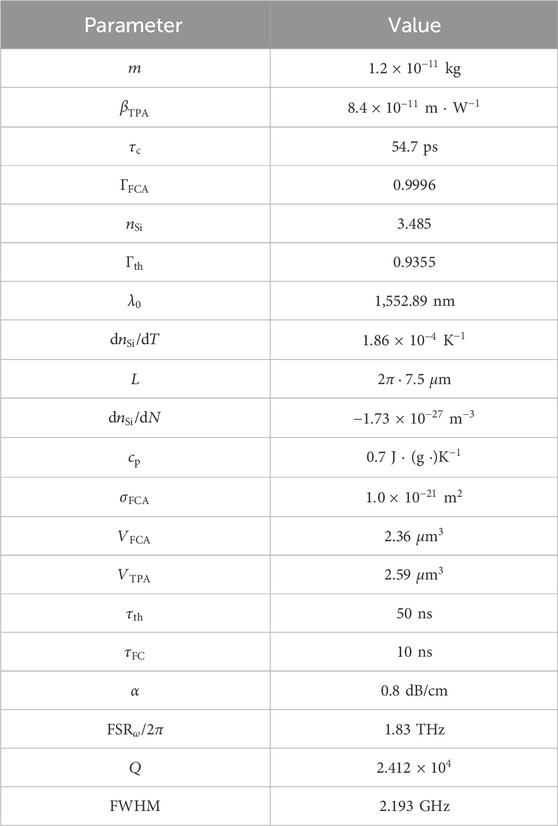
The system of differential equations in Equations 6, 12, 13 is solved, by first normalizing the equations to dimensionless parameters and then using a conventional Runge-Kutta method. The discretization process of the signals into the steps of the Runge-Kutta solver follows the same procedure as done in (Giron Castro et al., 2024b). In this case, the mathematical procedure is just extended to account for the multiple electric fields. The values of the simulated optical parameters are the same as in our initial study of this system (Giron Castro et al., 2024) and are listed in Table 1. We calculate the values of the quality factor
2.4 Output layer
At the output of the reservoir (drop port of the MRR), the
This brings additional nonlinearity through a square power function. Based on each detected signal, we train the output layer using ridge regression to calculate the
3 Benchmark tasks and computing metrics
In this section, we describe each of the benchmark tasks that have been used in this work: NARMA-10 time-series prediction, signal waveform classification (SWC) as a basic classification task, and the equalization of a wireless channel affected by nonlinear distortions and noise, referred to as ChEq. The fourth task is concerned with the prediction of the future position of the target in an experimentally measured radar signal (IPIX). The details of the tasks were obtained from (Paquot et al., 2012; Duport et al., 2012).
3.1 NARMA-10 time-series prediction
The first task that we consider in this work is the one-step ahead time-series prediction of the discrete-time tenth-order nonlinear auto-regressive moving average (NARMA-10) function. In this task, commonly found in RC literature, the target of the RC is the chaotic mathematical function expressed as:
As it is highlighted by Equation 17, NARMA-10 is useful to test the memory capabilities of an RC scheme. For this task,
where
3.2 Signal waveform classification
In this toy classification task, the RC target is to differentiate correctly the shape of a waveform between square and sine waveforms as determined by Equation 19:
The input sequence
3.3 Wireless channel equalization
This task emulates a wireless channel model that is disturbed by multipath fading, noise, and high-order nonlinear distortions. The system is first modeled as a linear wireless channel with the input
This is followed by a combination of second-order and third-order nonlinear distortion besides the addition of pseudo-random additive Gaussian noise with zero mean, denoted by
The target of the RC is to reconstruct the original signal,
During the pre-processing stage, we added a bias to the input,
3.4 IPIX radar task
This task consists of a
3.5 Linear, nonlinear and total memory capacity
RC is capable of buffering a finite number of previous inputs. How long an input drives or has an influence on the reservoir state is limited, which reduces the computing load in RC schemes. However, this also limits the number of past inputs that it can accurately predict. Therefore, we can quantify the memory capacity
There is a limit to the significant
The previous definition accounts only for the linear
Then, the total
in this work,
3.6 Nonlinearity metric of the MRR-based TDRC
From Equation 7, we can determine the frequency detuning of the resonance resulting from the nonlinear effects occurring in the MRR, noted
By quantifying the nonlinear detuning, we can have an estimation of the strength of the nonlinear dynamics of the cavity independently of the performance of the tasks. The value of
4 Results and discussion
We start this section by considering the case where the system under investigation addresses a single task, i.e., a single wavelength is used. Later we use this scenario as a performance reference when the same task is addressed by several wavelength-multiplexed channels. Then, we discuss the performance of the system when addressing different tasks simultaneously, one per wavelength-multiplexed channel. Finally, the impact of the feedback waveguide in the system is investigated. We simulate the WDM MRR-based TDRC for a
Throughout most of this section, the length of both training and testing sets is 2000 elements. The exceptions are Sections 4.5, 4.6, 4.7.2 where the system addresses different tasks simultaneously. In that case, 10,000 symbols are used for training and 10 different subsets of 10,000 symbols for testing. The length of the warm-up dataset used before both the training and testing sequences is 250.
4.1 Single-
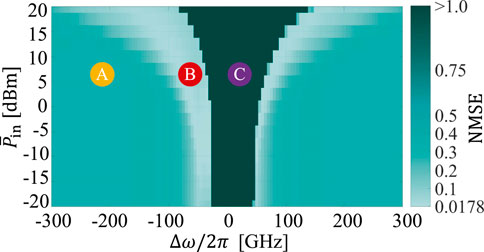
If we consider a single optical channel in the system described in Section 2
Region B achieves sufficient nonlinearity to address a particular task without sacrificing memory. This is the region of interest in which we can operate this system. The best performance
For the WDM scenario, an adequate balance for the contribution of power from each optical channel is critical. The power levels need to be tuned to avoid enhancing the performance of one of the tasks while penalizing the others. We also aim to avoid both lacking nonlinearity and triggering self-pulsing effects. For comprehensive details of this single-input channel analysis, we refer the reader to (Giron Castro et al., 2024b).
4.2 Multiple optical channels addressing the same task in parallel, M = 4
Our proposal to extend the scheme through WDM relies on the premise that we can achieve approximately equal performance in the different optical channels detuned from their respective resonance of the MRR. Indeed, this would allow us to use several resonances of the MRR. The main wavelength-dependent factor that impacts the performance is the delay waveguide. The phase shift experienced by each channel depends on its wavelength according to Equation 11. Further analysis of the impact of the phase shift in the system is realized in Section 4.7.
Here, we first test if the performance of the system shows the same behavior for a
In terms of nonlinear dynamics, we do not expect a significant difference in terms of high dimensionality achieved by each optical channel. However, it is important to verify if the system achieves the same performance pattern over the parameter space of each optical channel. The following analysis considers both equal and different instances of the same task addressed simultaneously by the system.
4.2.1 Simultaneous computing of equal instances of the same task
We evaluate the performance of our proposal when different optical channels are simultaneously modulated by input data of the same task. For this simulation, we use the same set of 10 seeds (from which we average testing performance over the number of seeds) to generate each target NARMA-10 sequence for every channel. In other words, the system addresses simultaneously four completely equal instances of the NARMA-10 task. With this analysis, we investigate the similarity of the response from each optical channel under equal conditions. The performance obtained as a function of
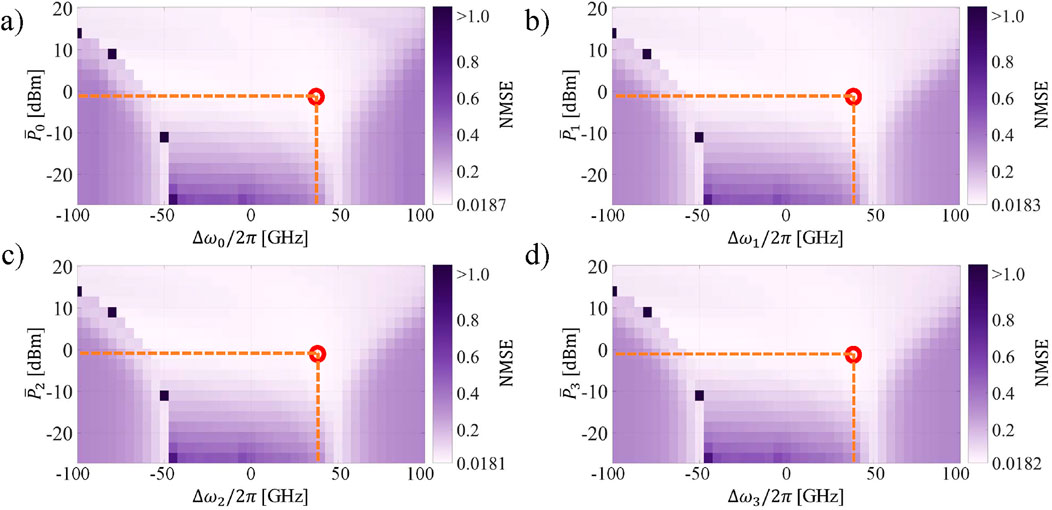
Figure 3. NMSE of the 4-channels WDM MRR-based TDRC addressing equal instances of the same task (NARMA-10) simultaneously as a function of
In this scenario, we observe that the system is capable of achieving the same performance as in the case of a single optical channel (Section 4.1). The best performance of each channel is encircled in red. The location of the best performance over the parameter space is the same for all the channels (
Hence, the total power
These differences in the power required to achieve the same level of performance, and in the generation of self-pulsing can be explained by considering the total energy circulating in the cavity. From the outlined TCMT model, we consider the contribution of the modal amplitude energy of each optical channel
We can infer from Equation 8 that a lower change rate of
Consequently, triggering self-pulsing (Region C in Figure 2) in the WDM-based TDRC would require additional power than if we used a single optical channel. This difference in energy appears to reduce the area over the parameter space where self-pulsing occurs. This is beneficial for the system as self-pulsing is detrimental to the memory of the RC as discussed later in Section 4.4. Nevertheless, this also means that more power is required to achieve a moderate level of nonlinear dynamics where the system performs the best (Region B).
4.2.2 Simultaneous computing of different instances of the same task
In this case, different sets of 10 seeds are used to generate each input data sequence that modulates each optical channel. Hence, with this analysis, we test the capability of the system to achieve good performance when simultaneously addressing multiple different instances of the same task (NARMA-10). The attained results are observed in Figure 4. As in the previous case, we also quantified the relative difference between the NMSE of channel 0 and the rest of the channels (see Supplementary Material).
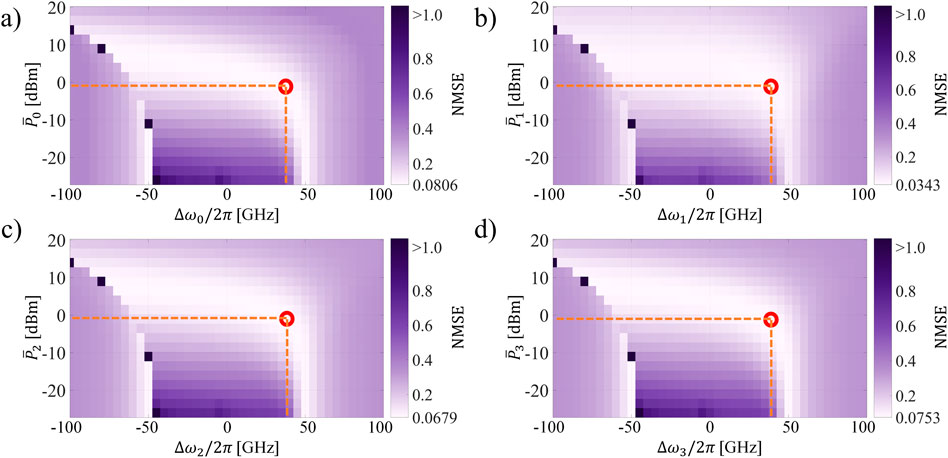
Figure 4. NMSE of the 4-channels WDM MRR-based TDRC addressing different instances of the same task (NARMA-10) simultaneously as a function of Pi and Δωi/2π. (A) Channel 0, (B) Channel 1, (C) Channel 2, (D) Channel 3. The best performance is encircled in red.
There is a decrease in performance with respect to the case where we used the same set of seeds to generate the modulating signals of every optical channel. This is to be expected if we consider that the carrier population interacts with all the channels through the cavity nonlinear dynamics. If the modulated optical signals are equal, then the short memory provided by the carrier population will contain information that favors equally the computing processing in every channel. This effect appears to also compensate for the impact on the system of the resulting phase shift in the feedback mechanism (further studied in Section 4.7). Henceforth, the inter-coupling between the nodes of each optical channel benefits the all-around performance of the system when using the same sets of seeds.
This benefit is not present when using different sets of seeds. However, in that scenario, it does not translate to a performance penalty either. The imprinting of unwanted information between the tasks is averaged out in the system due to the difference in speed between the input and the lifetime of the nonlinear effects. This is also the case when the system addresses different tasks in parallel as shown later in Section 4.5.
We can see that the region of the best performance over the parameter space becomes narrower for this case (Figure 4) and the difference of NMSE between the channels, particularly between channels 0 and 1, is increased (see Supplementary Material). However, we still obtain very good performance for the NARMA-10 task in every instance. The minimum NMSE in every multiplexed channel is different, but the location over the parameter space remains the same for all. In fact, it is the same location as in the previously studied scenario
Therefore, despite the less favorable inter-coupling dynamics of the system, the overall behavior of the system over the parameter space remains the same. As we analyze later in this work, further improvement in the performance of each NARMA-10 instance could be potentially achieved by optimizing the phase control of the feedback mechanism.
4.3 Performance vs. number of channels for the NARMA-10 task
We evaluate the performance of the system when increasing the number of wavelength channels
The attained results are shown in Figure 5. First, we can see that for a few additional channels,
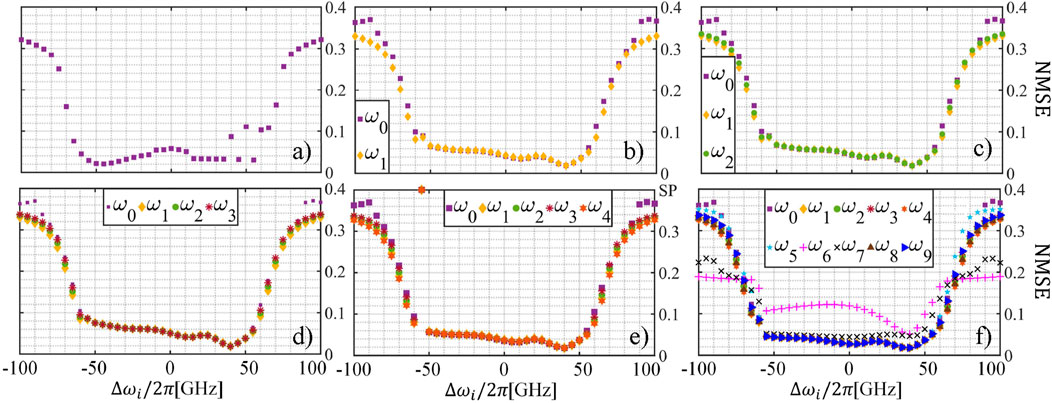
Figure 5. NARMA-10 NMSE per
This suggests that for specific values of
As the number of channels is increased, we observe how the impact of the phase shift in the delay waveguide becomes more noticeable. Specifically, when
This issue can be addressed by modulating the respective data of channels
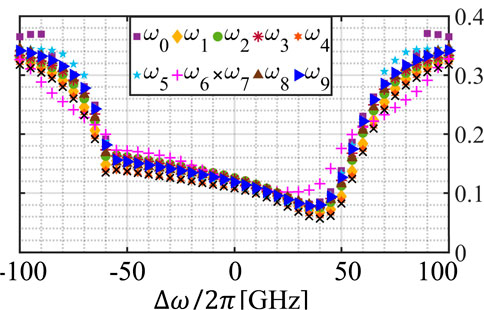
Figure 6. Memory capacity of each optical channel of the WDM MRR-based TDRC as a function of
4.4 Memory capacity of the WDM MRR-based photonic RC, M = 4
Another method to validate the suitability of each optical channel for computing purposes without depending on a particular task is to calculate the memory capacity, as previously defined in Section 3. In this case, the target of RC is to reconstruct the input that was used previously to generate the NARMA-10 sequence, for
The results are visible in Figure 7. It is clear that the
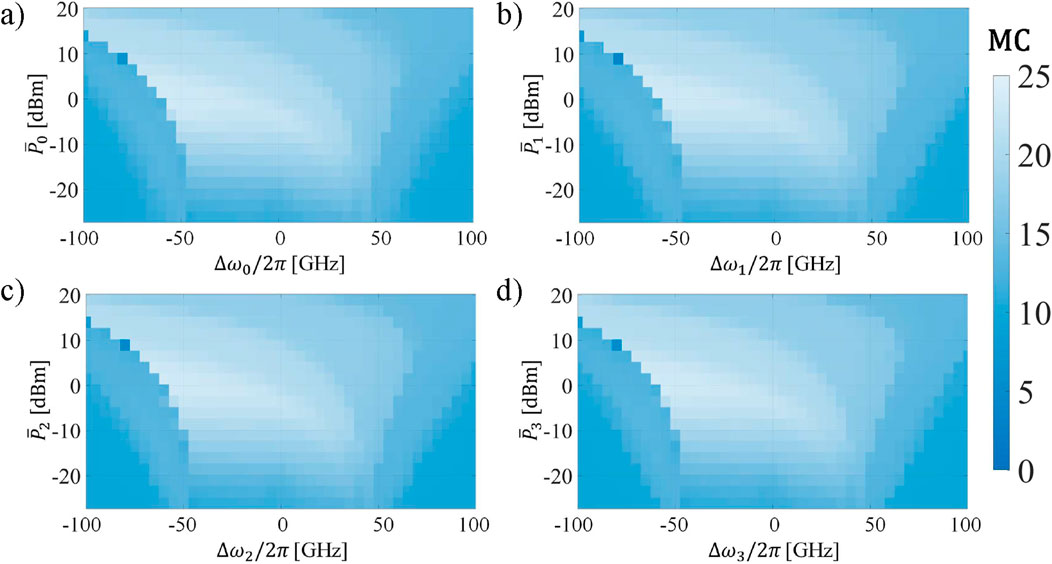
Figure 7. Memory capacity of each optical channel of the WDM MRR-based TDRC as a function of
When considering different tasks in each optical channel, a certain degree of freedom is available. The
4.5 Multiple optical channels addressing different tasks in parallel, M = 4
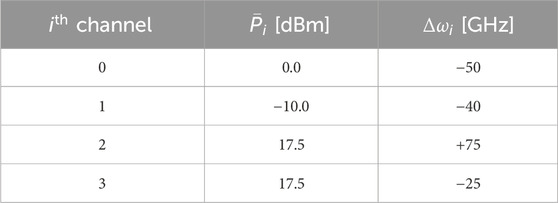
The initial part of this section focused on the capabilities of the studied RC scheme to reproduce similar performance when addressing simultaneously the same task in different optical channels. Now we focus on addressing different tasks on each of the optical channels, following the setup of the tasks shown in Figure 1. For this purpose, we set the value

Figure 8. Performance of the WDM MRR-based TDRC scheme addressing four different tasks as a function of
We list the results regarding the best performance of each task and compare them with those of previous studies on photonic TDRC (see Supplementary Material). We point out that the results of the previous studies are for photonic reservoirs that address a single task at a time. Indeed, there is a small performance penalty even when compared to the single-
As in Section 4.2, there is an interaction between the tasks because they are under the influence of the same nonlinear dynamics. A change in
4.6 Nonlinearity of each optical channel for different tasks
The different performance patterns of each optical channel and task over the studied parameter space (Figure 8) could be related to the amount of nonlinear detuning triggered by the processed data of each task when it is propagated through the reservoir. This could be the case in a practical scenario where the modulation or encoding used in each task could generate different optical signals. However, we do not expect the nonlinear detuning to be as different between channels in this numerical analysis due to the bias added to each optical signal. To verify this, we use the previously defined metric for the nonlinear detuning of the resonances,
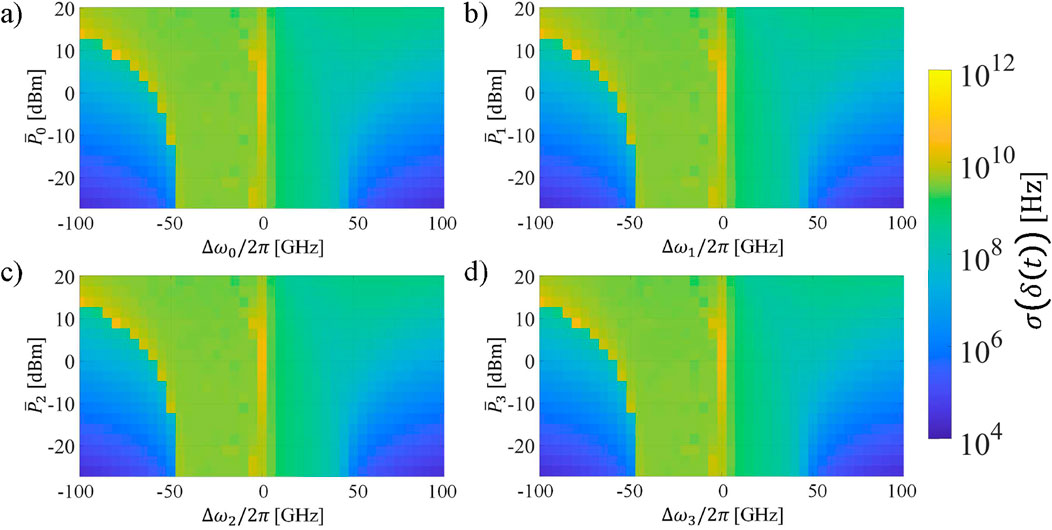
Figure 9. Standard deviation of the nonlinear detuning of each
As anticipated, the nonlinear detuning of the optical channels follows a very similar pattern. The thermal effect becomes dominant as the power increases, and subsequently, the area of the parameter space with the highest value of
A more in-depth analysis of the nonlinear detuning is necessary to verify if self-pulsing is triggered when adjusting independently the input power and frequency detuning of each channel. This could provide further generalization on the locations over the parameter space that are more favorable for a particular task. Ultimately, as demonstrated by the results of Figures 7–9, the difference in performance between tasks for a given value of
4.7 Impact of the phase shift control
As discussed earlier in this work, the phase shift in the delay waveguide depends on the wavelength of the propagating optical signal. Therefore, a specific instance of a task might exhibit a decrease in performance when its optical channel is changed, depending on the impact of the phase shift in the memory. In the simulated system, we implement a wavelength-independent adjustable phase shift in the delay waveguide
4.7.1 Impact of
In Figures 5D, 6, we observed how, for some optical channels the performance over the parameter space differed from that of other optical channels, when addressing the same task. We have attributed this behavior so far to the wavelength dependence of the phase shift in the delay waveguide. To confirm this hypothesis, we simulate the system when varying the value of
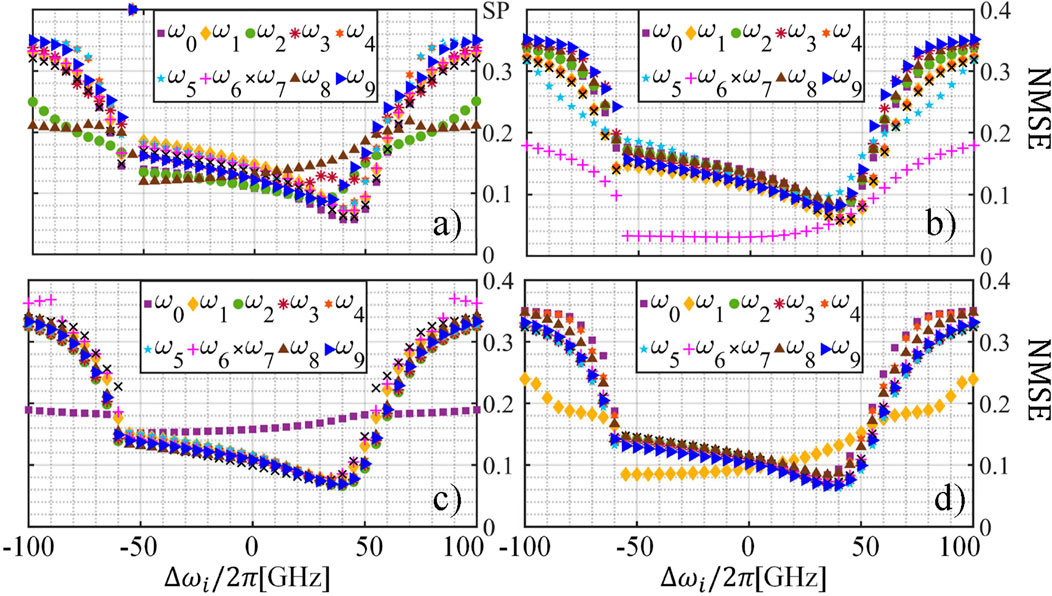
Figure 10. Performance of the system for the NARMA-10 task with
We observe how each value of
4.7.2 Impact of
When addressing different tasks, changing the value of
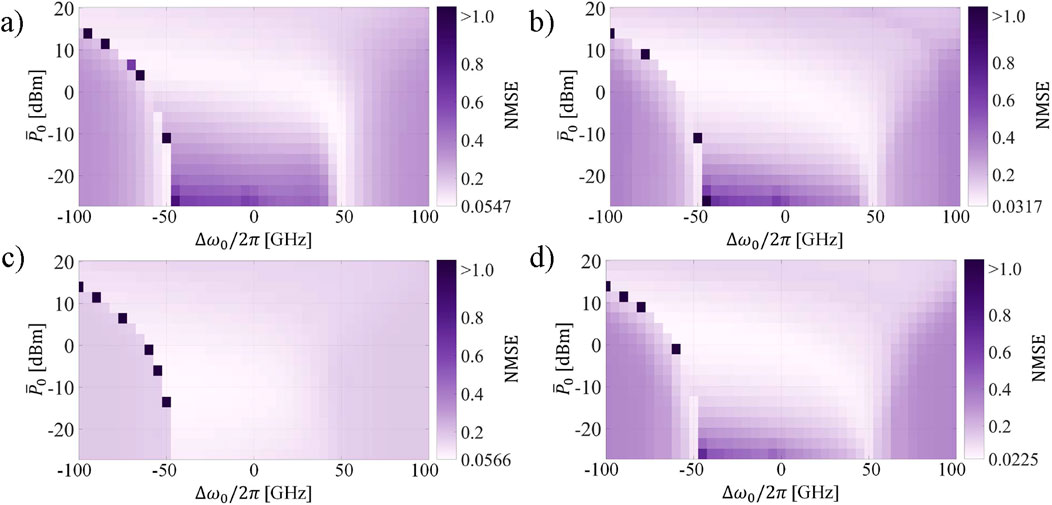
Figure 11. NMSE of the Channel 0 when addressing the NARMA-10 task as a function of
In Figures 11A, B, D, there is not much variation in the performance over the parameter space. However, we can observe how region B (best performance) is extended in Figure 11C. Furthermore, varying
In this way, it is possible to optimize the best performance of each task as shown in the results listed in Table 3. We acknowledge that a finer step of

Table 3. Comparison of the best performance of each task for different values of
5 Conclusion
By using both time and wavelength division multiplexing in an MRR-based RC scheme, we are able to achieve parallel computing of four different tasks, each addressing a different application, in a single photonic device. The scheme exhibits also the potential of replicating similar levels of performance for a determined task. This highlights that a simple optimization would be needed to solve the same computing application or process, multiple times, simultaneously. When addressing different tasks, the memory and nonlinear properties of the system are very similar between the multiple optical channels. Therefore, the performance of a particular task will rely on the adjustment of input power and frequency detuning to fulfill the computing requirements of the task. The phase shift caused by the external delay waveguide was demonstrated to be another tunable factor to improve the system performance. We tested the system with up to 10 realizations of the same task, and up to 4 different tasks, all solved simultaneously. In summary, the system offers high parallel computing potential without significant reduction of scalability or performance.
Data availability statement
The raw data supporting the conclusions of this article will be made available by the authors, without undue reservation.
Author contributions
BG: Conceptualization, Data curation, Formal Analysis, Investigation, Methodology, Resources, Software, Validation, Visualization, Writing–original draft, Writing–review and editing. CP: Conceptualization, Formal Analysis, Investigation, Methodology, Resources, Supervision, Validation, Visualization, Writing–review and editing. DZ: Funding acquisition, Investigation, Methodology, Project administration, Resources, Supervision, Validation, Visualization, Writing–review and editing. FD: Conceptualization, Data curation, Formal Analysis, Funding acquisition, Investigation, Methodology, Project administration, Resources, Software, Supervision, Validation, Visualization, Writing–review and editing.
Funding
The author(s) declare that financial support was received for the research, authorship, and/or publication of this article. Villum Fonden (OPTIC-AI grant no. VIL29334, and VI-POPCOM grant no. VIL54486), and the Swedish Research Council (VR) project BRAIN (2022–04798).
Acknowledgments
The images representing the classification and wireless channel equalization tasks (insets 1 and 2 on the top right square of Fig. 1) were generated on 31-05-2024 with the assistance of Microsoft Copilot, an artificial intelligence model based on GPT-4, developed by OpenAI and Microsoft. Inset 0 was obtained from the simulated data of the NARMA-10 task and inset 3 from (Haykin, 2001).
Conflict of interest
The authors declare that the research was conducted in the absence of any commercial or financial relationships that could be construed as a potential conflict of interest.
Publisher’s note
All claims expressed in this article are solely those of the authors and do not necessarily represent those of their affiliated organizations, or those of the publisher, the editors and the reviewers. Any product that may be evaluated in this article, or claim that may be made by its manufacturer, is not guaranteed or endorsed by the publisher.
Supplementary material
The Supplementary Material for this article can be found online at: https://www.frontiersin.org/articles/10.3389/aot.2024.1471239/full#supplementary-material
References
Appeltant, L., Soriano, M. C., Van der Sande, G., Danckaert, J., Massar, S., Dambre, J., et al. (2011). Information processing using a single dynamical node as complex system. Nat. Commun. 2, 468. doi:10.1038/ncomms1476
Bai, Y., Xu, X., Tan, M., Sun, Y., Li, Y., Wu, J., et al. (2023). Photonic multiplexing techniques for neuromorphic computing. Nanophotonics 12, 795–817. doi:10.1515/nanoph-2022-0485
Biasi, S., Donati, G., Lugnan, A., Mancinelli, M., Staffoli, E., and Pavesi, L. (2024). Photonic neural networks based on integrated silicon microresonators. Intell. Comput. 3, 0067. doi:10.34133/icomputing.0067
Bogaerts, W., Pérez, D., Capmany, J., Miller, D. A. B., Poon, J., Englund, D., et al. (2020). Programmable photonic circuits. Nature 586, 207–216. doi:10.1038/s41586-020-2764-0
Borghi, M., Bazzanella, D., Mancinelli, M., and Pavesi, L. (2021). On the modeling of thermal and free carrier nonlinearities in silicon-on-insulator microring resonators. Opt. Express 29, 4363–4377. doi:10.1364/OE.413572
Bu, T., Zhang, H., Kumar, S., Jin, M., Kumar, P., and Huang, Y. (2022). Efficient optical reservoir computing for parallel data processing. Opt. Lett. 47, 3784–3787. doi:10.1364/OL.464288
Bueno, J., Brunner, D., Soriano, M. C., and Fischer, I. (2017). Conditions for reservoir computing performance using semiconductor lasers with delayed optical feedback. Opt. Express 25, 2401–2412. doi:10.1364/OE.25.002401
Cucchi, M., Abreu, S., Ciccone, G., Brunner, D., and Kleemann, H. (2022). Hands-on reservoir computing: a tutorial for practical implementation. Neuromorphic Comput. Eng. 2, 032002. doi:10.1088/2634-4386/ac7db7
Dambre, J., Verstraeten, D., Schrauwen, B., and Massar, S. (2012). Information processing capacity of dynamical systems. Sci. Rep. 2, 514. doi:10.1038/srep00514
Donati, G., Argyris, A., Mancinelli, M., Mirasso, C. R., and Pavesi, L. (2024). Time delay reservoir computing with a silicon microring resonator and a fiber-based optical feedback loop. Opt. Express 32, 13419–13437. doi:10.1364/OE.514617
Donati, G., Mirasso, C. R., Mancinelli, M., Pavesi, L., and Argyris, A. (2022). Microring resonators with external optical feedback for time delay reservoir computing. Opt. Express 30, 522–537. doi:10.1364/OE.444063
Duport, F., Schneider, B., Smerieri, A., Haelterman, M., and Massar, S. (2012). All-optical reservoir computing. Opt. Express 20, 22783–22795. doi:10.1364/OE.20.022783
El Srouji, L., Krishnan, A., Ravichandran, R., Lee, Y., On, M., Xiao, X., et al. (2022). Photonic and optoelectronic neuromorphic computing. Apl. Photonics 7, 051101. doi:10.1063/5.0072090
Giron Castro, B. J., Peucheret, C., and Da Ros, F. (2024a). Memory capacity analysis of time-delay reservoir computing based on silicon microring resonator nonlinearities. Mach. Learn. Photonics 7, 49. doi:10.1117/12.3016750
Giron Castro, B. J., Peucheret, C., Zibar, D., and Da Ros, F. (2024) “Multi-task wavelength-multiplexed reservoir computing using a silicon microring resonator,” in 2024 international joint conference on neural networks (IJCNN), 1–7. doi:10.1109/IJCNN60899.2024.10650854
Giron Castro, B. J., Peucheret, C., Zibar, D., and Da Ros, F. (2024b). Effects of cavity nonlinearities and linear losses on silicon microring-based reservoir computing. Opt. Express 32, 2039–2057. doi:10.1364/OE.509437
Gooskens, E., Laporte, F., Ma, C., Sackesyn, S., Dambre, J., and Bienstman, P. (2022). Wavelength dimension in waveguide-based photonic reservoir computing. Opt. Express 30, 15634–15647. doi:10.1364/OE.455774
Haykin, S. (2001). The Dartmouth database of IPIX radar. Available at: http://soma.ece.mcmaster.ca/ipix/dartmouth/inde-x.html (accessed on May 30, 2024).
Hennessy, J. L., and Patterson, D. A. (2019). A new golden age for computer architecture. Commun. ACM 62, 48–60. doi:10.1145/3282307
Huang, C., Sorger, V. J., Miscuglio, M., Al-Qadasi, M., Mukherjee, A., Lampe, L., et al. (2022). Prospects and applications of photonic neural networks. Adv. Phys. X 7. doi:10.1080/23746149.2021.1981155
Hülser, T., Köster, F., Lüdge, K., and Jaurigue, L. (2023). Deriving task specific performance from the information processing capacity of a reservoir computer. Nanophotonics 12, 937–947. doi:10.1515/nanoph-2022-0415
Jaeger, H. (2002). Short term memory in echo state networks. GMD Rep. 152, 60. doi:10.24406/publica-fhg-291107
Johnson, T. J., Borselli, M., and Painter, O. (2006). Self-induced optical modulation of the transmission through a high-Qsilicon microdisk resonator. Opt. Express 14, 817–831. doi:10.1364/OPEX.14.000817
Li, R.-Q., Shen, Y.-W., Lin, B.-D., Yu, J., He, X., and Wang, C. (2023). Scalable wavelength-multiplexing photonic reservoir computing. Apl. Mach. Learn. 1, 036105. doi:10.1063/5.0158939
Lupo, A., Zajnulina, M., and Massar, S. (2023). Parallel and deep reservoir computing based on frequency multiplexing. AI Opt. Data Sci. IV 12438, 25. doi:10.1117/12.2647351
Masaad, S., Gooskens, E., Sackesyn, S., Dambre, J., and Bienstman, P. (2023). Photonic reservoir computing for nonlinear equalization of 64-QAM signals with a Kramers–Kronig receiver. Nanophotonics 12, 925–935. doi:10.1515/nanoph-2022-0426
McMahon, P. L. (2023). The physics of optical computing. Nat. Rev. Phys. 5, 717–734. doi:10.1038/s42254-023-00645-5
Mesaritakis, C., Papataxiarhis, V., and Syvridis, D. (2013). Micro ring resonators as building blocks for an all-optical high-speed reservoir-computing bit-pattern-recognition system. J. Opt. Soc. Am. B 30, 3048–3055. doi:10.1364/JOSAB.30.003048
Paquot, Y., Duport, F., Smerieri, A., Dambre, J., Schrauwen, B., Haelterman, M., et al. (2012). Optoelectronic reservoir computing. Sci. Rep. 2, 287. doi:10.1038/srep00287
Rafayelyan, M., Dong, J., Tan, Y., Krzakala, F., and Gigan, S. (2020). Large-scale optical reservoir computing for spatiotemporal chaotic systems prediction. Phys. Rev. X 10, 041037. doi:10.1103/PhysRevX.10.041037
Schuman, C. D., Kulkarni, S. R., Parsa, M., Mitchell, J. P., Date, P., and Kay, B. (2022). Opportunities for neuromorphic computing algorithms and applications. Nat. Comput. Sci. 2, 10–19. doi:10.1038/s43588-021-00184-y
Skalli, A., Robertson, J., Owen-Newns, D., Hejda, M., Porte, X., Reitzenstein, S., et al. (2022). Photonic neuromorphic computing using vertical cavity semiconductor lasers. Opt. Mater. Express 12, 2395–2414. doi:10.1364/OME.450926
Sun, Z., Kvatinsky, S., Si, X., Mehonic, A., Cai, Y., and Huang, R. (2023). A full spectrum of computing-in-memory technologies. Nat. Electron 6, 823–835. doi:10.1038/s41928-023-01053-4
Van der Sande, G., Brunner, D., and Soriano, M. C. (2017). Advances in photonic reservoir computing. Nanophotonics 6, 561–576. doi:10.1515/nanoph-2016-0132
Vandoorne, K., Dierckx, W., Schrauwen, B., Verstraeten, D., Baets, R., Bienstman, P., et al. (2008). Toward optical signal processing using photonic reservoir computing. Opt. Express 16, 11182–11192. doi:10.1364/OE.16.011182
Vandoorne, K., Mechet, P., Van Vaerenbergh, T., Fiers, M., Morthier, G., Verstraeten, D., et al. (2014). Experimental demonstration of reservoir computing on a silicon photonics chip. Nat. Commun. 5, 3541. doi:10.1038/ncomms4541
Van Vaerenbergh, T., Fiers, M., Mechet, P., Spuesens, T., Kumar, R., Morthier, G., et al. (2012). Cascadeable excitability in microrings. Opt. Express 20, 20292–20308. doi:10.1364/OE.20.020292
Yan, M., Huang, C., Bienstman, P., Tino, P., Lin, W., and Sun, J. (2024). Emerging opportunities and challenges for the future of reservoir computing. Nat. Commun. 15, 2056. doi:10.1038/s41467-024-45187-1
Zhang, L., Fei, Y., Cao, T., Cao, Y., Xu, Q., and Chen, S. (2013). Multibistability and self-pulsation in nonlinear high-Q silicon microring resonators considering thermo-optical effect. Phys. Rev. A 87, 053805. doi:10.1103/PhysRevA.87.053805
Keywords: reservoir computing, parallel computing, microring resonator, neuromorphic photonics, wavelength division multiplexing
Citation: Giron Castro BJ, Peucheret C, Zibar D and Da Ros F (2024) Multi-task photonic reservoir computing: wavelength division multiplexing for parallel computing with a silicon microring resonator. Adv. Opt. Technol. 13:1471239. doi: 10.3389/aot.2024.1471239
Received: 26 July 2024; Accepted: 27 September 2024;
Published: 23 October 2024.
Edited by:
Kaveh Rahbardar Mojaver, Colorado State University, United StatesReviewed by:
Shuang Chang, Vanderbilt University, United StatesNathan Youngblood, University of Pittsburgh, United States
Copyright © 2024 Giron Castro, Peucheret, Zibar and Da Ros. This is an open-access article distributed under the terms of the Creative Commons Attribution License (CC BY). The use, distribution or reproduction in other forums is permitted, provided the original author(s) and the copyright owner(s) are credited and that the original publication in this journal is cited, in accordance with accepted academic practice. No use, distribution or reproduction is permitted which does not comply with these terms.
*Correspondence: Bernard J. Giron Castro, YmpnY2FAZHR1LmRr
 Bernard J. Giron Castro
 Christophe Peucheret2