 Jeannette M. Beasley
 Melanie J. Firestone
 Collin J. Popp
 Rienna Russo3
 Stella S. Yi
- 1Department of Medicine, NYU Langone Health, New York, NY, United States
- 2School of Public Health, University of Minnesota, Minneapolis, MN, United States
- 3Department of Population Health, NYU Langone Health, New York, NY, United States
Background: Dietary protein serves a pivotal role in providing the body with essential amino acids, which are required for the maintenance of body proteins, and the assimilation of structural and functional components required for basic survival. Understanding how dietary protein sources potentially vary for different population subgroups will allow for future nutrition interventions to be more targeted for specific needs.
Objective: The purpose of this analysis was to identify the top ten food category sources of dietary protein by age and race and ethnicity in a nationally representative sample.
Methods: Cross-sectional data on adults (18+ years) from the National Health and Nutrition Examination Survey (NHANES) 2011–2016 with one 24-h dietary recall were analyzed (n = 15,697). Population proportions were calculated based on protein intake (g/day) for What We Eat In America food categories.
Results: The analytic sample (n = 15,697) was 15.0% Hispanic (95% CI [12.1, 17.9], 65.0% non-Hispanic White (95% CI [60.8, 69.3]), 11.5% non-Hispanic Black (95% CI [9.1, 13.9]), 5.4% non-Hispanic Asian (95% CI [4.3, 6.6]), and 3.1% other (95% CI [2.5, 3.6]). In all racial and ethnic groups, as well as age categories, chicken (whole pieces) was the top-ranked source of dietary protein. In addition to chicken (whole pieces), beef (excludes ground), eggs and omelets, and meat mixed dishes food categories ranked in the top ten sources of protein for every race/ethnicity. Only two solely plant-based proteins appeared in the top ten sources: beans, peas and legumes for Hispanics, and nuts and seeds for Other. For all age categories, beef (excludes ground) was among the top five sources and egg/omelets appear in the top ten sources.
Conclusion: The top ten sources of protein accounted for over 40% of dietary protein irrespective of race/ethnicity or age category, having major implications for the sustainability of our nation's food supply. Public health strategies that encourage diversity in protein sources in food preparation and incorporate legumes and nuts along with poultry have the potential to shift the overall population protein intake distribution toward improving overall diet quality.
Introduction
Dietary protein serves a pivotal role in providing the body with essential amino acids, which are required for the maintenance of body proteins, and the assimilation of structural and functional components required for basic survival (1). Protein is unique in comparison to carbohydrates and fats in that it is a nitrogen-containing compound. Under normal conditions, protein is not stored for the purposes of energy production, as are carbohydrates or fatty acids. Furthermore, dietary protein is uniquely metabolized, resulting in a higher postprandial thermic effect of food compared to carbohydrates and fats. For those purposes, dietary protein is also more satiating, leading to postprandial reductions in hunger (2, 3). Protein-rich diets have been found to maintain muscle mass, increase weight loss, and improve metabolic function across the lifespan (4).
Dietary protein intake is important across the lifespan, in particular among older adults. The Recommended Dietary Allowance (RDA) for protein is 0.8 g/kg/day for all adults, and age- and gender- specific National Health and Nutrition Examination Survey (NHANES) analyses reported while 3% of men ages 19–30 consumed less than the RDA, 19% of women ages 71 and older consumed less than the RDA (5). Age-associated declines in muscle function, muscle wasting, frailty, and reduced quality of life have been well-documented (6–8). Optimal intake of dietary protein during aging may help alleviate the decrease in muscle mass and maintain the functional integrity of body proteins (9). Despite this, the proportion of older adults meeting the RDA for protein is mixed (5, 10, 11).
The degree to which protein needs are not being met not only varies by age but also by race/ethnicity. Prior assessment of protein intake suggests that Asian American populations have higher intakes of protein as a percentage of calories compared to non-Hispanic White (NHW) and non-Hispanic Black (NHB) populations (5, 12). The higher intakes of protein were also observed in older, Asian American adults, with 17% protein as a percent of total calories in both the >51 years and ≥71 years categories (5). In comparison, older NHW adults consume roughly 15% of their total calories from protein. While we know trends since 1999 are toward an older (increase from 18 to 21.1% of adults aged ≥65 years) and more diverse (proportion who were non-Hispanic white declined from 69.8 to 64.4%) population (13), we hypothesize, that dietary protein sources vary by age and race/ethnicity. Understanding dietary protein sources can help inform intervention efforts addressing protein intake to accommodate racial/ethnic diversity in the United States. Therefore, the purpose of this analysis was to identify the top ten food category sources of dietary protein by age and race and ethnicity in a nationally representative sample.
Materials and Methods
Study Design
The National Health and Nutrition Examination Survey (NHANES) is a program of studies designed to assess the health and nutritional status of non-institutionalized, civilian adults in the United States (14). Those who participate in the NHANES provide demographic and general health information followed by a visit to a Mobile Examination Center for anthropometric measurements and 24-h dietary recalls, which are conducted by a trained interviewer using the USDA-multiple pass method. The Research Ethics Review Board at the National Center for Health Statistics approved all survey protocols, and all participants and their proxies provided written informed consent.
The USDA Food and Nutrition Database for Dietary Studies (FNDDS) provides nutrient values for foods and beverages reported in each 24-h dietary recall based on the USDA National Nutrient Database for Standard Reference (15). FNDDS food categories were linked to one What We Eat in America (WWEIA) category, a classification scheme that includes ~150 food categories and does not disaggregate into ingredients (i.e., pizza vs. cheese, tomatoes, etc.), to analyze protein intake in the previous 24-h from food and beverages (16). The categorization is designed to group similar foods and beverages together based on usage and nutrients. Meat mixed dishes, for example, typically include meat served with a sauce (i.e., meat with gravy) or with vegetables (i.e., beef stew). The purpose in using these categories is to represent how these foods are typically consumed.
Data from a single 24-h recall for three waves, 2011–2016, were pooled as these were the years during which non-Hispanic Asian Americans were oversampled (17). The resulting dataset had a sample size of 29,902. Participants were excluded if they were <18 years of age (n = 11,933), were missing the dietary recall (n = 2,271), or reported consuming exclusively water (n = 1). The final analytic sample included 15,697 individuals.
Measures
Descriptive demographic variables included sex, age, race/ethnicity, education, and nativity. Race/ethnicity was divided into five categories: Hispanic, non-Hispanic White (NHW), non-Hispanic Black (NHB), non-Hispanic Asian (NHA), and Other (includes mixed race). Education was restricted to adults ≥25 years. Age was divided into four categories: 18–24, 25–44, 45–64, and ≥65 years. The race/ethnicity categories and age categories were further combined so that within each race/ethnicity category there were four age-specific categories. For example, NHW was divided into (1) NHW, 18–24; (2) NHW, 25–44; (3) NHW, 45–64; and (4) NHW, ≥65 years.
Means and standard errors for protein intake (g/d), energy intake (kcal/d), and protein density (%kcal/d) were calculated by age and race/ethnicity. To determine the top ten dietary sources of protein, population proportions (%) were calculated for each food category by summing the amount of protein consumed within each category for all persons within each subcategory (age, race/ethnicity) and dividing that by the sum of all protein consumed for all foods for all persons within each subcategory (age, race/ethnicity) multiplied by 100 (18).
Statistical Analyses
Food categories were ranked based on population proportion and the top ten are reported. Mean differences comparing Asian Americans to other races/ethnicities and adults ages ≥65 to other age groups were calculated using t-tests. Tests were considered statistically significant if p < 0.05. Correction for multiple comparisons was not conducted given the small number of planned comparisons. Calculations were estimated using survey procedures in SAS v.9.4 (SAS Institute Inc, Cary, NC) to adjust for the complex survey design. Sample weights accounted for the probability of selection, non-response, and day of the week of dietary recall.
Results
The analytic sample (n = 15,697) was 15.0% Hispanic (95% CI: [12.1, 17.9]), 65.0% NHW (95% CI: [60.8, 69.3]), 11.5% NHB (95% CI: [9.1, 13.9]), 5.4% NHA (95% CI: [4.3, 6.6]), and 3.1% Other (95% CI: [2.5, 3.6]) (Table 1). Older adults (≥65 y) accounted for 18.5% of the sample. Approximately half of the sample was female (51.3%), one-third had a college degree or greater, and over four-fifths of the sample was US-born (82.8%).
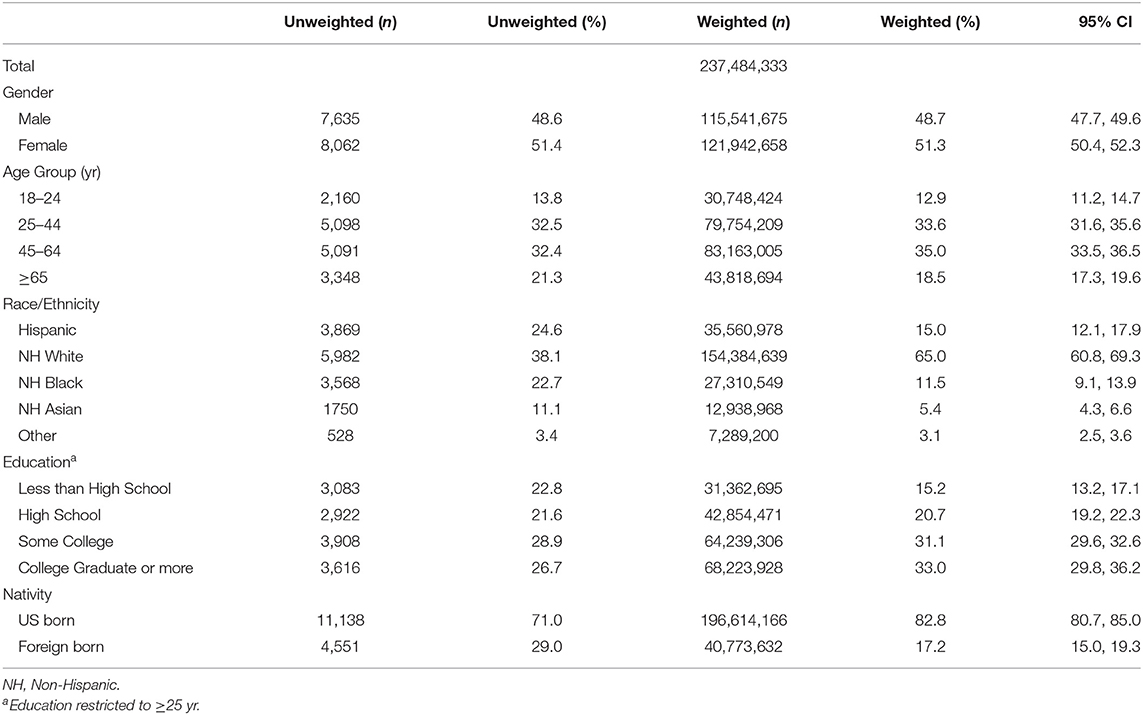
Table 1. Demographic characteristics, NHANES 2011–2016 (n = 15,697).
Protein by Race/Ethnicity
Hispanics consumed the greatest amount of absolute protein, with a mean intake of 88 grams per day (95% CI: [86, 91], p = 0.0003) (Figure 1). NHA consumed the fewest calories (1904, 95% CI: [1861, 1947]) compared to other race/ethnic groups (p-value for all < 0.0001). Therefore, protein density (%kcal/day) was significantly higher among NHA (17.3, 95% CI: [17.0, 17.6]) compared to NHB (15.3, 95% CI: [15.0, 15.5]), Other (15.6, 95% CI: [14.8, 16.4]), NHW (15.7, 95% CI: [15.5, 16.0]), and Hispanics (16.5, 95% CI: [16.2, 16.7]) (p-value for all < 0.001).
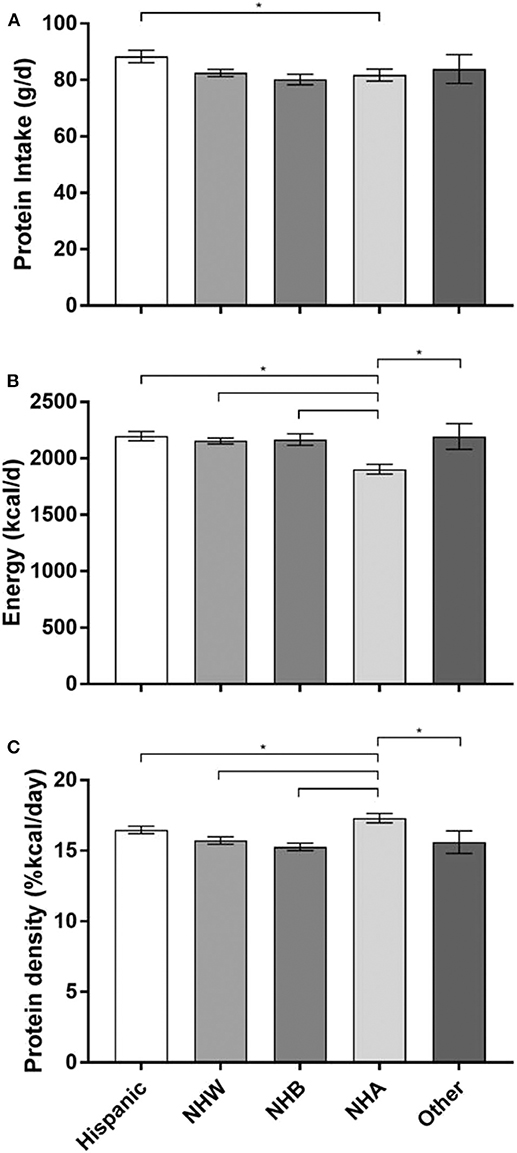
Figure 1. Protein intake, energy intake, and protein density by race/ethnicity. (A) Protein intake in grams per day (g/d). (B) Energy intake in kilocalories per day (kcal/d). (C) Protein density (%kcals/day). The three panels (A–C) each share the same x-axis description that are only labled on panel C.Data are reported at mean and upper and lower limits. *p < 0.05 Non-Hispanic Asian are the reference group; NHW, Non-Hispanic White; NHB, Non-Hispanic Black; NHA, Non-Hispanic Asian.
Adults from all race/ethnicity groups consumed at least 40% of their total protein intake from the top ten food categories. NHA consumed the most, with almost half (48.6%) from the top ten food categories, compared to 41.0% for NHW, 41.5% for Other, 45.7% for Hispanics, and 45.9% for NHB (Table 2). Across all race/ethnicity groups, chicken (whole pieces) was the top-ranked source for dietary protein (Table 2). As the top source, chicken accounted for ≤ 10% of total protein in all race/ethnicity groups except for the NHB population, where chicken accounted for 14% of total protein. Beef (excludes ground), eggs and omelets, and meat mixed dishes food categories were also ranked in the top ten sources of protein for every race/ethnicity. Pizza ranked as a top ten source of protein among all race/ethnic groups except for NHA. Fish was in the top 10 sources of protein for Hispanic, NHW, NHB, NHA, and Other. More specifically, fish was the second and third ranked source of protein for NHB and NHA, respectively. Each race/ethnicity group had at least one food category that uniquely ranked as a top ten source (Hispanic: other
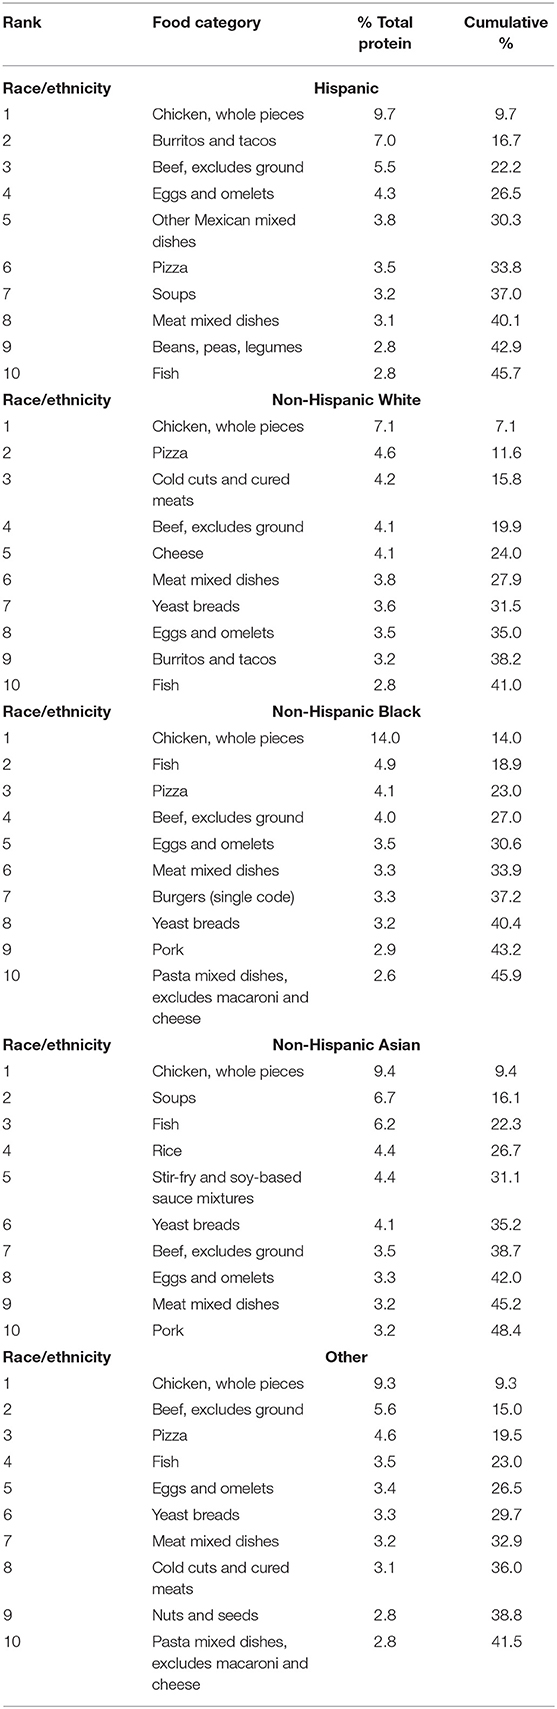
Table 2. Protein sources by race/ethnicity.
Mexican mixed dishes; NHW: cheese; NHB: burger [single code]; NHA: rice, stir-fry and soy-based dishes, and Other: nuts and seeds). Only two solely plant-based proteins appeared in the top ten sources: beans, peas and legumes for Hispanics, and nuts and seeds for Other.
Protein by Age
Older adults consumed the least absolute protein (71 grams per day, 95% CI: [69, 73]) and energy (1819 calories, 95% CI: [1779, 1860] compared to other age groups (p-value for all < 0.0001) (Figure 2). However, protein density (%kcal/day) did not vary significantly by age group (p-value for all>0.05).
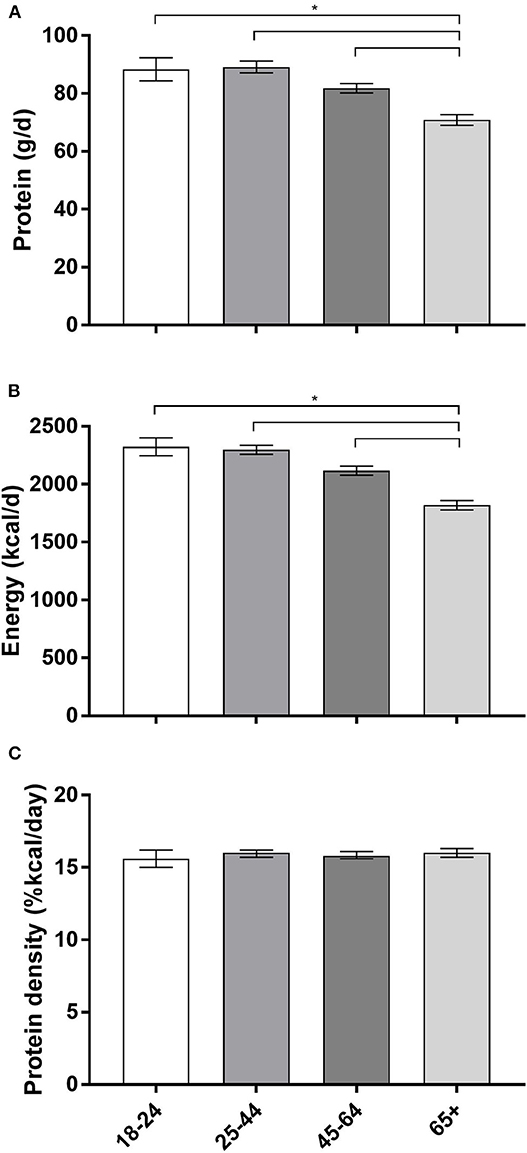
Figure 2. Protein intake, energy intake and protein density by age category (years). (A) Protein intake in grams per day (g/d). (B) Energy intake in kilocalories per day (kcal/d). (C) Protein density (%kcals/day). The three panels (A–C) each share the same x-axis description that are only labled on (C). Data are reported at mean and upper and lower limits; data reported in years; *p < 0.05; ≥65 is the reference group.
Chicken (whole pieces) was the top source of protein irrespective of age (Table 3). Beef (excludes ground) was among the top five sources of protein, and cheese, eggs/omelets, as well as cold cuts and cured meats, appeared in the top ten sources for all age categories. Fish was a top ten source of protein among all age categories except for 18–24 year olds. The youngest (18–24 years) and oldest (≥65 years) age categories each had two top protein sources that were exclusive to their age category: burgers and pasta mixed dishes (excluding macaroni and cheese) for 18–24 year olds, and nuts/seeds and soups for ≥65 year olds.
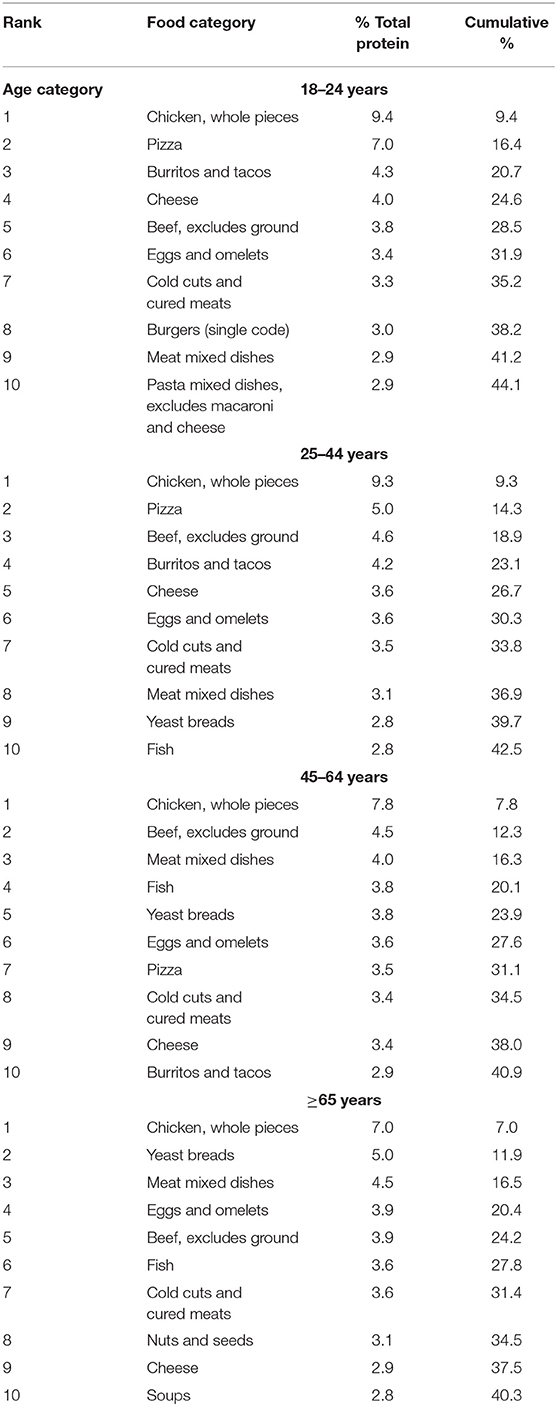
Table 3. Protein sources by age category.
Protein by Race/Ethnicity and Age
Chicken (whole pieces) was the only protein source to appear as a top protein source in all categories, irrespective of race/ethnicity and age (Table 4). While pizza appeared as a top protein source for all race/ethnic groups under age 45, it was not a top protein source for any race/ethnic group among those aged ≥65 years. In contrast, fish was a top protein source for all/race/ethnic groups over age 44 years, but it was only a top protein source among NHB in the 18–24 year old age category.

Table 4. Protein sources by race/ethnicity and age category.
Discussion
This study identified the top ten dietary sources of protein by age and race/ethnicity groups. The top ten sources of protein accounted for over 40% of dietary protein irrespective of race/ethnicity or age category, having major implications for the sustainability of our nation's food supply (e.g., greenhouse gas
emissions, nitrogen and phosphorous pollution, biodiversity loss, and water and land use) (19). This analysis is aligned with local and national activity around nutrition improvements to reduce chronic disease risk. Findings from this analysis contribute to guidance from expert committees suggesting interventions might target (1) increasing protein intake, exclusively among older adults (≥65 years); (20) (2) substituting nutrient-rich sources of protein intake (i.e., beans, peas, legumes) for sources demonstrating deleterious health effects (i.e., cold cuts and cured meats); (21) and (3) improving the sustainability of the nation's food supply (19).
While prioritization has been placed on increasing protein intake among older adults (22, 23), limited evidence to monitor intake suggests no change, which may in part be due to policies that by design may not reach all sub-populations. From 2001 to 2014, protein intake ranged from 14 to 16% of calories irrespective of age and gender category (5). On average, 30% of protein consumed in the United States is derived from plant sources (24). Determining which foods contribute to dietary protein intake within each racial/ethnic and age group could allow for the development of culturally adapted public health messages. In addition, determining specific food contributions within each racial/ethnic and age group category allows health practitioners and dietitians to make informed and valuable recommendations on healthy protein sources. In order to better understand the disparities in obesity and risk factors associated with chronic disease among racial/ethnic groups we must examine the dietary contributions, specifically from dietary protein.
Traditionally it has been thought that animal protein contributes significantly to the development of chronic disease (e.g., cardiovascular disease [CVD], type 2 diabetes [T2D], hypertension), whereas plant-based protein may be more protective. Though the evidence for animal and plant-based protein contributing to chronic disease are mixed (7, 25–28), replacing energy-rich, nutrient poor sources of animal protein with a different type of animal protein, or with beans, peas, and legumes, would have positive effects on the population's health (19, 29).
Furthermore, having only two racial/ethnic groups with plant-based sources of protein in their top ten has major implications on the sustainability of the nation's food supply in addition to the nation's health (19, 30). Animal-based protein is associated with greater greenhouse gas emissions when compared to plant-based protein (31, 32). The top ten sources of protein contributed to over 40% of dietary protein consumption. Increased consumption of meat puts increased pressure on farmers to produce enough supply to meet the demand, which in turn strains resources, including water, land, and feed. Additionally, when local farmers cannot meet the supply, meats are imported from distant locations within and sometimes outside of the United States, which increases energy consumption due to the fuel required to refrigerate and transport the products (19). In conclusion, while a key recommendation of the 2015 Dietary Guidelines is to consume “a variety of protein foods in nutrient-dense forms,” (21) these data suggest several of the subgroups named (i.e., legumes) are underconsumed. Protein foods are important sources of other nutrients, including B vitamins, selenium, choline, and zinc, but nutrients provided by various types of protein foods differ (33–35). For this reason, the latest Dietary Guidelines provide subgroup recommendations for the following protein sources: seafood; meats, poultry, and eggs; and nuts, seeds, and soy products.
The strengths of this study include a sample representative of the US non-institutionalized population and an oversample of Asian Americans allowing for comparisons of sources of protein intake among Asian Americans to other race/ethnic groups. Stratifying by race/ethnicity helps us to better understand factors accounting for differences in protein intake in the US population. There are several limitations that should be noted. A single dietary recall cannot represent an individual's usual intake and has measurement error; however, the NHANES multiple-pass method demonstrated acceptable validity and reliability when compared with urinary nitrogen, a recovery biomarker of protein intake (36, 37). Although rigorous methods were used for dietary recall that allows for the incorporation of diverse dietary patterns, data are subject to measurement error (i.e., recall and coding errors). Furthermore, the race/ethnicity categories are broad and one race/ethnic category was not directly sampled (e.g., Other [includes mixed race]). As such, this precludes the ability to distinguish between subpopulations (i.e., Chinese, Indian, Filipino), potentially masking disparities by ethnicity and country of origin (38, 39).
This analysis highlights racial/ethnic and age differences in top sources of protein, which is important for developing targeted efforts to increase protein intake among high-risk subpopulations. Public health strategies that encourage diversity in protein sources in food preparation and incorporate legumes and nuts along with poultry have the potential to shift the overall population protein intake distribution toward improving overall diet quality.
Data Availability Statement
The raw data supporting the conclusions of this manuscript will be made available by the authors, without undue reservation, to any qualified researcher.
Ethics Statement
The studies involving human participants were reviewed and approved by The Research Ethics Review Board at the National Center for Health Statistics. The patients/participants provided their written informed consent to participate in this study.
Author Contributions
JB conceived of the study. MF conducted the data analysis, CP and JB drafted the manuscript, and all authors edited the manuscript. All authors read and approved the final manuscript.
Funding
This research was supported in part by NIH/National Institute on Minority Health and Health Disparities (U54MD000538), and National Heart, Lung, and Blood Institute (R01HL141427).
Conflict of Interest
The authors declare that the research was conducted in the absence of any commercial or financial relationships that could be construed as a potential conflict of interest.
Abbreviations
CVD, cardiovascular disease; T2D, type 2 diabetes; FNDDS, Food and Nutrition Database for Dietary Studies; NHANES, National Health and Nutrition Examination Survey; NHA, non-Hispanic Asian; NHB, non-Hispanic Black; NHW, non-Hispanic White; RDA, Recommended Dietary Allowance; USDA, United States Department of Agriculture.
References
1. Dietary Reference Intakes for Energy, Carbohydrate Fiber Fat, Fatty Acids, Cholesterol Protein and Amino Acids (Macronutrients). Washington, DC: National Academies Press, (2005).
2. Crovetti R, Porrini M, Santangelo A, Testolin G. The influence of thermic effect of food on satiety. Eur J Clin Nutr. (1998) 52:482–8. doi: 10.1038/sj.ejcn.1600578
3. Beasley JM, Ange BA, Anderson CA, Miller ER 3rd, Erlinger TP, Holbrook JT, et al. Associations between macronutrient intake and self-reported appetite and fasting levels of appetite hormones: results from the optimal macronutrient intake trial to prevent heart disease. Am J Epidemiol. (2009) 169:893–900. doi: 10.1093/aje/kwn415
4. Wycherley TP, Moran LJ, Clifton PM, Noakes M, Brinkworth GD. Effects of energy-restricted high-protein, low-fat compared with standard-protein, low-fat diets: a meta-analysis of randomized controlled trials. Am J Clin Nutr. (2012) 96:1281–98. doi: 10.3945/ajcn.112.044321
5. Berryman CE, Lieberman HR, Fulgoni VL 3rd, Pasiakos SM. Protein intake trends and conformity with the dietary reference intakes in the United States: analysis of the national health and nutrition examination survey, 2001-2014. Am J Clin Nutr. (2018) 108:405–13. doi: 10.1093/ajcn/nqy088
6. Wolfe RR. The role of dietary protein in optimizing muscle mass, function and health outcomes in older individuals. Br J Nutr. (2012) 108(Suppl. 2):S88–93. doi: 10.1017/S0007114512002590
7. Beasley JM, LaCroix AZ, Neuhouser ML, Huang Y, Tinker L, Woods N, et al. Protein intake and incident frailty in the women's health initiative observational study. J Am Geriatr Soc. (2010) 58:1063–71. doi: 10.1111/j.1532-5415.2010.02866.x
8. Beasley JM, Wertheim BC, LaCroix AZ, Prentice RL, Neuhouser ML, Tinker LF, et al. Biomarker-calibrated protein intake and physical function in the women's health initiative. J Am Geriatr Soc. (2013) 61:1863–71. doi: 10.1111/jgs.12503
9. Sahni S, Mangano KM, Hannan MT, Kiel DP, McLean RR. Higher protein intake is associated with higher lean mass and quadriceps muscle strength in adult men and women. J Nutr. (2015) 145:1569–75. doi: 10.3945/jn.114.204925
10. Krok-Schoen JL, Archdeacon Price A, Luo M, Kelly OJ, Taylor CA. Low dietary protein intakes and associated dietary patterns and functional limitations in an aging population: a NHANES analysis. J Nutr Health Aging. (2019) 23:338–47. doi: 10.1007/s12603-019-1174-1
11. Beasley JM, Deierlein AL, Morland KB, Granieri EC, Spark A. Is meeting the recommended dietary allowance (RDA) for protein related to body composition among older adults? results from the cardiovascular health of seniors and built environment study. J Nutr Health Aging. (2016) 20:790–6. doi: 10.1007/s12603-015-0707-5
12. Popp CJ, Beasley JM, Yi SS, Hu L, Wylie-Rosett J. A cross-sectional analysis of dietary protein intake and body composition among Chinese Americans. J Nutr Sci. (2019) 8:e4. doi: 10.1017/jns.2018.31
13. Shan Z, Rehm CD, Rogers G, Ruan M, Wang DD, Hu FB, et al. Trends in dietary carbohydrate, protein, and fat intake and diet quality among US adults, 1999-2016. JAMA. (2019) 322: 1178–87. doi: 10.1001/jama.2019.13771
14. Centers for Disease Control and Prevention. National Health and Nutrition Examination Survey. Available online at: https://www.cdc.gov/nchs/nhanes/index.htm (accessed August 31, 2019).
15. U.S. Department of Agriculture. USDA National Nutrient Database for Standard Reference, Release 21 [updated March 12, 2009]. Available online at: http://www.ars.usda.gov/main/site_main.htm?modecode=12354500 (accessed March 31, 2009).
16. U.S. Department of Agriculture. Agricultural Research Service. What We Eat in America Food Categories 2011-2012. (2015). Available online at: www.ars.usda.gov/nea/bhnrc/fsrg (accessed August 4, 2016).
17. Johnson CL, Dohrmann SM, Burt VL, Mohadjer LK. National health and nutrition examination survey: sample design, 2011-2014. Vital Health Stat. (2014) 1–33. Available online at: https://www.cdc.gov/nchs/data/series/sr_02/sr02_162.pdf
18. Krebs-Smith SM, Kott PS, Guenther PM. Mean proportion and population proportion: two answers to the same question? J Am Diet Assoc. (1989) 89:671–6.
19. Willett W, Rockström J, Loken B, Springmann M, Lang T, Vermeulen S, et al. Food in the anthropocene: the EAT–lancet commission on healthy diets from sustainable food systems. Lancet. (2019) 393:447–92. doi: 10.1016/S0140-6736(18)31788-4
20. Deutz NE, Bauer JM, Barazzoni R, Biolo G, Boirie Y, Bosy-Westphal A, et al. Protein intake and exercise for optimal muscle function with aging: recommendations from the ESPEN expert group. Clin Nutr. (2014) 33:929–36. doi: 10.1016/j.clnu.2014.04.007
21. DHHS/USDA. 2015-2020 Dietary Guidelines for Americans, 8th Edn. (2015). Available online at: https://health.gov/dietaryguidelines/2015/guidelines/ (accessed May 16, 2017).
22. Volpi E, Campbell WW, Dwyer JT, Johnson MA, Jensen GL, Morley JE, et al. Is the optimal level of protein intake for older adults greater than the recommended dietary allowance? J Gerontol A Biol Sci Med Sci. (2013) 68:677–81. doi: 10.1093/gerona/gls229
23. Bauer J, Biolo G, Cederholm T, Cesari M, Cruz-Jentoft AJ, Morley JE, et al. Evidence-based recommendations for optimal dietary protein intake in older people: a position paper from the PROT-AGE study group. J Am Med Direct Assoc. (2013) 14:542–59. doi: 10.1016/j.jamda.2013.05.021
24. Pasiakos SM, Agarwal S, Lieberman HR, Fulgoni VL III. Sources and amounts of animal, dairy, and plant protein intake of US adults in 2007-2010. Nutrients. (2015) 7:7058–69. doi: 10.3390/nu7085322
25. Berryman CE, Agarwal S, Lieberman HR, Fulgoni VL III, Pasiakos SM. Diets higher in animal and plant protein are associated with lower adiposity and do not impair kidney function in US adults. Am J Clin Nutr. (2016) 104:743–9. doi: 10.3945/ajcn.116.133819
26. Guasch-Ferre M, Satija A, Blondin SA, Janiszewski M, Emlen E, O'Connor LE, et al. Meta-analysis of randomized controlled trials of red meat consumption in comparison with various comparison diets on cardiovascular risk factors. Circulation. (2019) 139:1828–45. doi: 10.1161/CIRCULATIONAHA.118.035225
27. Tian S, Xu Q, Jiang R, Han T, Sun C, Na L. Dietary protein consumption and the risk of type 2 diabetes: a systematic review and meta-analysis of cohort studies. Nutrients. (2017) 9:982. doi: 10.3390/nu9090982
28. Johnston BC, Zeraatkar D, Han MA, Vernooij RWM, Valli C, El Dib R, et al. Unprocessed red meat and processed meat consumption: dietary guideline recommendations from the nutritional recommendations (NutriRECS) consortium. Ann Intern Med. (2019) 171:756–64. doi: 10.7326/M19-1621
29. Bouchenak M, Lamri-Senhadji M. Nutritional quality of legumes, and their role in cardiometabolic risk prevention: a review. J Med Food. (2013) 16:185–98. doi: 10.1089/jmf.2011.0238
30. Godfray HCJ, Aveyard P, Garnett T, Hall JW, Key TJ, Lorimer J, et al. Meat consumption, health, and the environment. Science. (2018) 361:eaam5324. doi: 10.1126/science.aam5324
31. Clune S, Crossin E, Verghese K. Systematic review of greenhouse gas emissions for different fresh food categories. J Clean Prod. (2017) 140:766–83. doi: 10.1016/j.jclepro.2016.04.082
32. Hirvonen K, Bai Y, Headey D, Masters WA. Affordability of the EAT-Lancet reference diet: a global analysis. Lancet Glob Health. (2020) 8:e59–66. doi: 10.1016/S2214-109X(19)30447-4
33. Saunders AV, Craig WJ, Baines SK. Zinc and vegetarian diets. Med J Aust. (2013) 199:S17–21. doi: 10.5694/mja11.11493
34. Biesalski HK. Meat as a component of a healthy diet - are there any risks or benefits if meat is avoided in the diet? Meat Sci. (2005) 70:509–24. doi: 10.1016/j.meatsci.2004.07.017
35. Fayet F, Flood V, Petocz P, Samman S. Avoidance of meat and poultry decreases intakes of omega-3 fatty acids, vitamin B12, selenium and zinc in young women. J Hum Nutr Diet. (2014) 27(Suppl. 2):135–42. doi: 10.1111/jhn.12092
36. Centers for Disease Control and Prevention, National Center for Health Statistics, Division of Health and Nutrition Examination Surveys. National Health and Nutrition Examination Survey: Analytic Guidelines, 2011-2012. (2013).
37. Freedman LS, Commins JM, Moler JE, Arab L, Baer DJ, Kipnis V, et al. Pooled results from 5 validation studies of dietary self-report instruments using recovery biomarkers for energy and protein intake. Am J Epidemiol. (2014) 180:172–88. doi: 10.1093/aje/kwu116
38. Holland AT, Palaniappan LP. Problems with the collection and interpretation of Asian-American health data: omission, aggregation, and extrapolation. Ann Epidemiol. (2012) 22:397–405. doi: 10.1016/j.annepidem.2012.04.001
Keywords: nutrition, epidemiology, aging, Asian American, African American, Hispanic American
Citation: Beasley JM, Firestone MJ, Popp CJ, Russo R and Yi SS (2020) Age and Racial/Ethnic Differences in Dietary Sources of Protein, NHANES, 2011–2016. Front. Nutr. 7:76. doi: 10.3389/fnut.2020.00076
Received: 19 February 2020; Accepted: 04 May 2020;
Published: 26 June 2020.
Edited by:
Megan A. McCrory, Boston University, United StatesReviewed by:
Victor L. Fulgoni III, Nutrition Impact, LLC, United StatesJosiemer Mattei, Harvard University, United States
Copyright © 2020 Beasley, Firestone, Popp, Russo and Yi. This is an open-access article distributed under the terms of the Creative Commons Attribution License (CC BY). The use, distribution or reproduction in other forums is permitted, provided the original author(s) and the copyright owner(s) are credited and that the original publication in this journal is cited, in accordance with accepted academic practice. No use, distribution or reproduction is permitted which does not comply with these terms.
*Correspondence: Jeannette M. Beasley, amVhbm5ldHRlLmJlYXNsZXlAbnl1bGFuZ29uZS5vcmc=